I. INTRODUCTION
Thermo-mechanical alloy design and processing typically impose mechanical, thermal, or chemical driving forces on a system that promote the formation and evolution of nonequilibrium point and planar defects, and in some cases, chemical disorder. Desired microstructures are subsequently obtained through controlled relaxations toward lower energy states during thermal annealing. At the relatively low strains and strain rates associated with most commercial thermo-mechanical alloy processing, the transient behavior of line and planar defects, and their interactions with various atomic and microstructural features, tends to dominate the overall microstructural response and to dictate materials properties. The low production of nonequilibrium point defects at small strains tends to make their contribution to microstructural evolution rather insignificant, at least in terms of affecting microstructural design parameters like grain size and phase stability. Similarly, the spatial dimensions over which nonequilibrium forced chemical mixing occurs tend to be insignificant at relatively low strains in coarse microstructures. In contrast, processing alloys at large strain rates, and to much higher levels of strain, often with the goal of nanostructuring, heightens the importance of understanding the behavior of nonequilibrium point and chemical defects as their concentrations can significantly exceed the concentrations of intrinsic defects. Few detailed experimental studies, however, have investigated this processing regime under conditions where temperature, high strain, and high continuous strain rate are accurately controlled and well specified.
Forced chemical mixing at room temperature has received a great deal of attention over the past few decades in the context of severe plastic deformation (SPD), which is often associated with the high strains used to refine the microstructure toward the nanometer scale.
Reference Gholinia, Prangnell and Markushev1–Reference Schuh, Nieh and Iwasaki11
In the absence of significant vacancy migration, the nature of forced atomic relocations in the bulk and at interfaces, governs chemical mixing and the spatial frequencies of compositional heterogeneities. Alloys with heats of mixing much less than zero often undergo chemical or structural disordering.
Reference Schwarz and Koch12
Miscible and moderately immiscible (
 $\left| {\Delta {H_{{\rm{mix}}}}} \right|$
less than ≈15 kJ mol−1) systems tend to chemically homogenize at sufficiently high strains while maintaining crystallinity.
Reference Quelennec, Menand, Le Breton, Pippan and Sauvage10,Reference Klassen, Herr and Averback13–Reference Ma and Atzmon16
Experiments, theory, and simulations indicate that in this case the strain required for homogenization scales approximately linearly with the characteristic wave length of the initial compositional heterogeneities.
Reference Arshad, Lach, Pouryazdan, Hahn, Bellon, Dillon and Averback17–Reference Ashkenazy, Vo, Schwen, Averback and Bellon20
Highly immiscible systems (ΔH
mix > 20 kJ mol−1) investigated in the literature typically remain phase separated at the nanoscale with only limited enhanced solubilities.
Reference Xu, Herr, Klassen and Averback21–Reference Botcharova, Freudenberger and Schultz25
This behavior has been attributed, in some cases, to differences in local plasticity between the phases,
Reference Da Pozzo, Palmas, Vacca and Delogu26,Reference Cordero and Schuh27
but also recently, to a thermo-chemical biasing in atom relocations during shear-induced mixing.
Reference Wang, Averback, Bellon and Dillon22,Reference Wang, Vo, Campion, Nguyen, Setman, Dillon, Bellon and Averback23,Reference Lund and Schuh28,Reference Vo, Odunuga, Bellon and Averback29
While the general trends described above have been demonstrated for a large number of alloys processed at temperatures below ∼0.25 T
mp (T
mp = melting temperature), the mechanisms controlling such behaviors still remain controversial. Comparable studies above ∼0.25 T
mp are far fewer (see Refs. Reference Hohenwarter, Faller, Rashkova and Pippan30–Reference Zhilyaev, Sergeev and Langdon35 for several recent examples), despite the potential for developing new alloys with novel microstructures and properties within this processing space. The present study seeks to provide insights into the competition between forced atomic displacements occurring during SPD and vacancy mediated atomic relaxations in a model alloy, Cu–Ag. We choose Cu–Ag since shear mixing is well studied in this alloy at low temperatures and largely understood.
Reference Arshad, Lach, Pouryazdan, Hahn, Bellon, Dillon and Averback17,Reference Pouryazdan, Schwen, Wang, Scherer, Hahn, Averback and Bellon18,Reference Ren, Arshad, Bellon, Averback, Pouryazdan and Hahn36–Reference Tian, Wu, Zhang, Figueiredo, Gao and Langdon40
Studies on high temperature SPD have been performed primarily using ball milling (BM), accumulative roll bonding, equal channel angular compression, and more recently with high pressure torsion (HPT). Reference Valiev4,Reference Hohenwarter, Faller, Rashkova and Pippan30–Reference Zhilyaev, Sergeev and Langdon35,Reference Saito, Utsunomiya, Tsuji and Sakai41–Reference Suryanarayana43 For the alloy system to reach its steady state microstructure, however, only BM and HPT presently provide sufficiently high strain rates to be practical. Prior experiments used high temperature BM to investigate the microstructural evolution in nearly equiatomic Cu–Ag alloys (ΔH mix ∼6 kJ mol−1 for Cu50Ag50 alloy). Reference Klassen, Herr and Averback13,Reference Zghal, Twesten, Wu and Bellon44,Reference Wu, Isheim, Bellon and Seidman45 These studies had shown that the alloy reaches a steady-state, multiphase microstructure at sufficiently high strain and that the characteristic length scales of this microstructure increase with increasing temperature. The apparent activation energies for phase decomposition were observed to be significantly smaller than those associated with vacancy migration: 0.66 and 0.7 eV in Ag and Cu, respectively. The studies provided differing explanations for the low apparent activation energy. In the earlier study, the measured activation energy, 0.11 eV, was interpreted in the context of first-order kinetics dominated by shear-induced vacancies. Reference Klassen, Herr and Averback13 In the subsequent work, a different measured apparent activation energy, 0.4–0.59 eV, was interpreted by a more complex combination of effects arising from saturated nonequilibrium vacancies, enthalpic effects resulting from concentrated solutions, and a convolution of lattice and grain boundary contributions. Reference Wu, Isheim, Bellon and Seidman45 Both of these studies have subsequently been interpreted more broadly within the context of steady-state self-organization, which can result when the length scales and time scales associated with forced chemical mixing compete with thermodynamic relaxations. Reference Odunuga, Li, Krasnochtchekov, Bellon and Averback46,Reference Schwen, Wang, Averback and Bellon47 While these initial studies using high-temperature BM were key to establish the phenomenon of self-organized nanostructures in immiscible alloys under shear deformation, they lacked the necessary control of strain rate, total strain, and temperature to develop a quantitative understanding of this behavior. HPT, on the other hand, has emerged as a technique that offers high levels of strain, a strain rate that is both variable and controllable, and it is conducive to good temperature control Reference Zhilyaev and Langdon48–Reference Valiev, Islamgaliev and Alexandrov50 ; we thus have utilized HPT in the present work to investigate the details of microstructural evolution in Cu90Ag10 alloys during SPD at elevated temperatures. The use of a relatively dilute alloy simplifies characterization of the length scale, as the Ag forms isolated nanoprecipitates in Cu, Reference Arshad, Lach, Pouryazdan, Hahn, Bellon, Dillon and Averback17 which are easily identified by high-angle annular dark field scanning transmission electron microscopy (HAADF-STEM) imaging.
Shear-induced mixing is mediated in Cu–Ag predominantly through dislocation glide, as one plane of atoms glides past another plane. Such a so-called ballistic motion tends to homogenize the alloy. The highly correlated motion of atoms that occurs during shear mixing, however, is non-Fickian Reference Arshad, Lach, Pouryazdan, Hahn, Bellon, Dillon and Averback17–Reference Ashkenazy, Vo, Schwen, Averback and Bellon20 and difficult to describe analytically. This motion, nevertheless, has been shown to be conveniently expressed in terms of the mean-square relative displacements of atoms, where the relative displacements between pairs of atoms are considered. Reference Bellon, Averback, Odunuga, Li, Krasnochtchekov and Caro19 The relative pair diffusion rate, Reference Einstein51 moreover, has been predicted to scale linearly with the relative pair separation. Reference Bellon, Averback, Odunuga, Li, Krasnochtchekov and Caro19 This result is easy to understand since a change in the relative position of two atoms requires the passage of a dislocation between them, and the probability for such an event increases linearly with their distance apart. At high temperatures, thermally activated diffusion also takes place, and it tends to return the system to equilibrium, where Cu–Ag is a two-phase alloy. Thus, shear mixing and thermally activated diffusion compete in determining the microstructure of the alloy. Since the shear-mixing rate increases linearly with length scale, and thermal diffusion is independent of length scale, it is intuitively clear that the alloy system should be able to order on small length scales where thermal diffusion dominates, while being disordered on large length scales, where ballistic mixing is dominant. Indeed, it was shown that using Kinetic Monte Carlo (KMC) simulations (similar to Ref. Reference Schwen, Wang, Averback and Bellon47) an immiscible alloy under combined shear mixing and thermal diffusion will phase separate on a length, r, which is given by the distance at which the two pair diffusion coefficients are equal, Reference Schwen, Wang, Averback and Bellon47 i.e.,
 $$r = {{{a_0}} \over {{d^2}}}{{{F_{{\rm{vac}}}}} \over {{F_{{\rm{shear}}}}}}\quad ,$$
Here, F vac is the frequency of vacancy jumps, F shear is the frequency at which dislocations are inserted into the simulation cell, a 0 is the nearest neighbor distance, and d 2 is the number of atoms in a slip plane within the simulation cell. The simulations show, further, that the final length scale of the alloy microstructure is completely determined by the two dynamic state variables, F vac and F shear, and independent of the initial conditions. Dynamic phase diagrams can thus be constructed to characterize such driven systems. Reference Martin and Bellon52 While the model leading to Eq. (1) is highly idealized, it provides a convenient context for examining experimentally self-organization of immiscible alloys during SPD. This work thus utilizes HPT to investigate the effect of the two variables, temperature and strain rate, on microstructural development. We examine Cu90Ag10 alloy in the temperature range of ∼0.12–∼0.40 T mp, at controlled strain rates varying between 0.1 and 6.25 s−1.
II. EXPERIMENTAL
Chemically homogenized powders of Cu90Ag10 were first fabricated by high-energy BM (SPEX 8000 with hardened steel vial and milling balls) of micrometer-sized elemental Cu and Ag powders in an Ar-filled dry glove box. Atom probe tomography (APT), discussed below, indicates <1 at.% Fe impurity incorporation during BM. These powders were subsequently hot-pressed at 300 °C in a vacuum (2 × 10⁻⁶ Pa) under a pressure of ≈1 GPa, in a press attached directly to the glove box. The powder samples were not exposed to atmosphere prior to densification. The process resulted in >98% dense Cu rods, ≈ 10 mm in diameter, which contained Ag precipitates with a volume-averaged initial diameter, D p,i, of 31 ± 7 nm. Annealing the as-pressed samples at 600 and 750 °C for 1 h in Ar increased the precipitate sizes to D p,i of 122 ± 25 nm and 252 ± 58 nm, respectively. Particle size was determined by tracing individual Ag particles, as identified by a combination of concurrently acquired bright-field scanning transmission electron microscopy (BF-STEM) and HAADF-STEM images, using ImageJ software. The associated error bars are one standard deviation of the particle diameter distributions measured over 200 particles. The particle size distributions of the as-prepared samples are log-normal, as expected. The samples were cut into 250 µm thick disks, polished, and then deformed by back and forth (+90°/−90°) HPT cycles in the “unconstrained” configuration, i.e., the sample was compressed between flat anvils, thereby allowing the sample to flow outward. The thinness of the samples and high friction, however, prevents significant flow; the change in thickness is only ≈20%. This sample geometry and HPT configuration were previously optimized so that deformation is nearly homogeneous through thickness. Reference Arshad, Lach, Pouryazdan, Hahn, Bellon, Dillon and Averback17 HPT was performed at 0.1, 1, and 6 rpm under a pressure of 4.5 GPa at temperatures of 125, 200, 300, and 400 °C. The temperature of the anvils, whose thermal mass far exceeds that of the sample, was controlled to maintain the processing temperature. The temperature of the sample was monitored with a pyrometer (± 0.5 °C at 400 °C) adjacent to the sample position. HPT was initiated immediately after inserting the samples, and the samples quenched at the end of the cycle. High temperature BM was also performed at 125, 200, 300, and 400 °C using fully mixed Cu90Ag10 powders, mixed powders after 600 °C annealing, and micrometer-sized elemental powders as the starting material. A heating tape was wrapped around the vial in the BM to raise the temperature, and a control thermocouple was attached to the outer surface. It is noted that the internal temperature of the vial may deviate somewhat from the temperature at its surface; however, we expect that the quoted temperature values are sufficiently accurate to provide a reasonable comparison with the HPT samples.
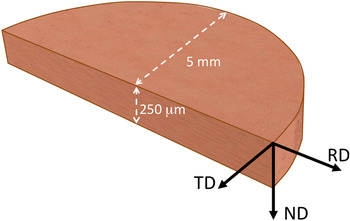
We begin by defining a reference frame for the samples, as HPT deforms the sample anisotropically. This is shown in Fig. 1 (here, ND = normal direction, RD = radial direction, and TD = transverse direction). HAADF-STEM (JEOL 2200FS) and APT (Cameca LEAP 4000X Si, Northwestern University) Reference Hellman, Vandenbroucke, Rusing, Isheim and Seidman53 were performed on samples prepared by focused ion beam (FEI company) milling. TEM samples were prepared for observation along the ND and TD directions, and atom probe needles were aligned along the ND direction. APT samples having 40–50 nm tip radii were analyzed at 60 K using laser pulsing under a DC voltage of 1–4 kV. Typically, 10–15 million atoms were collected.
Cross-sectional schematic of sample geometry with sample reference frame directions depicted.

X-ray diffraction (XRD, PANalytical/Philips X'pert MRD system) was performed in the ND direction on the RD–TD plane using a 1 mm × 1 mm beam. The Ag and Cu crystallite diameters were estimated using the Scherrer equation.
Reference Patterson54
The anisometric shapes of Cu grains and Ag particles in the samples require measurements in perpendicular directions to define an average sphere-equivalent diameter. The Ag in-plane diameters after HPT were determined from the HAADF-STEM images in the RD–TD plane by measuring over 200 particles. The Cu grain in-plane diameters were determined using the linear intercept method
Reference Hilliard55
performed on BF-STEM images. XRD was performed such that it was primarily probing the thickness (ND) of the particles, and the values quoted from XRD measurements were found to be in good agreement with several cross-sectional STEM-based measurements. Both Ag and Cu average diameters reported in this study after HPT were calculated by combining the two sets of data, i.e.,
 ${D_{\rm{p}}} = \root 3 \of {\left( {D_{{\rm{STEM}}}^2} \right) \cdot {D_{{\rm{XRD}}}}}$
to account for the anisometric particle and grain shapes. Additional HAADF-STEM images were taken in TD–ND planes, or RD direction, on selected samples to investigate more carefully the 3D shapes of the Ag precipitates. The particle and grain sizes measured entirely by HAADF-STEM were consistent with XRD/in-plane TEM analysis of crystallite size, supporting the validity of the approach used to calculate average diameters. This analysis was also applied to BM powders, which were composed primarily of millimeter-sized, disk-shaped alloy particles. Note that in subsequent discussion, precipitate diameter and grain diameter measured as described above will be distinguished from “crystallite diameter”, measured solely from XRD performed primarily through thickness, ND. The solubility was estimated from the shift of the Cu(111) peak using a modified Vegard's law according to the lattice parameters of rapidly quenched metastable Cu–Ag alloys.
Reference Linde56
All characterizations were performed on samples taken from a radial position of 2 mm, unless stated otherwise; at this location, the total strain is ∼1500, and the strain rates corresponding to 0.1, 1, and 6 rpm samples are 0.1, 1, and 6.25 s−1.
III. RESULTS
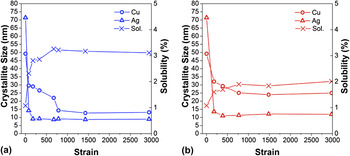
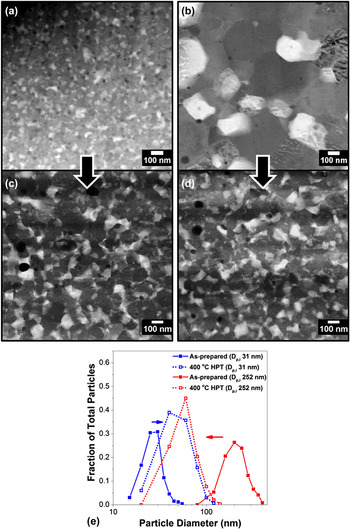
Figure 2 shows the effect of total strain at 200 and 300 °C on the Ag crystallite size, Cu crystallite size, and Ag solubility for samples with a D p,i of 122 nm deformed at 1 rpm. Steady-state Ag and Cu crystallite sizes and Ag solubility are established well below a strain of 1500. Figure 3 indicates that at 400 °C, with a strain of 1500 imposed at 6.25 s−1 strain rate, the microstructural length scales established during HPT are independent of the initial particle and grain size within experimental error. For example, the initial Ag particle sizes of D p,i = 31 ± 7 nm and D p,i = 252 ± 58 nm are coarsened or refined to 65 ± 19 nm and 75 ± 20 nm, respectively. Based on the above experimental observation that the samples with the largest and smallest grain and particle sizes investigated can refine or coarsen to the same steady-state microstructure by a strain of 1500, this value of strain was selected for all subsequent microstructural analysis to investigate self-organization as a function of temperature and strain rate at consistent levels of strain, and presumably one representing the steady-state.
Evolution of the Cu crystallite size, Ag crystallite size, and solubility with strain at (a) 200 and (b) 300 °C for the sample with a D p,i of 122 nm deformed at 1 rpm. All data estimated from XRD.

(a and c) HAADF-STEM images of the sample with D p,i = 31 nm and (b and d) D p,i = 252 nm before and after 25 cycles of HPT at 400 °C at 6.25 s−1 strain rate, respectively. The images c and d are taken in the RD–TD plane. (e) Particle size distributions before and after HPT for the two samples.

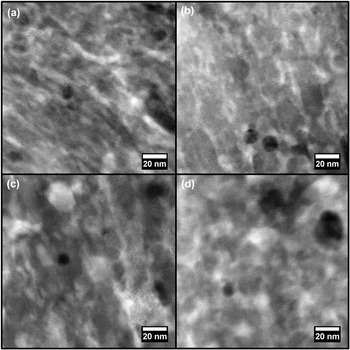
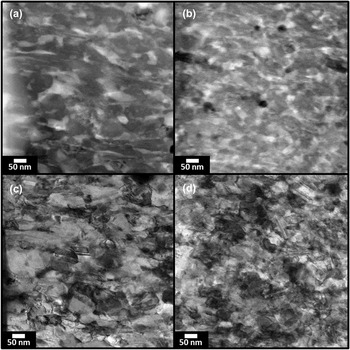
HAADF STEM images in Fig. 4 show the effect of temperature on Ag particle size in the ND direction (RD–TD plane) of samples, D p,i = 122 nm, subjected to HPT at low (0.1 s−1) and high (6.25 s−1) strain rates at 200 and 300 °C. The bright features in the images are Ag rich, the gray background is the Cu-rich matrix, and the low density of small dark features accordingly obtained from EDS measurements to be oxide particles (possibly associated with Fe contamination from the initial BM of the powder) and pores/bubbles (possibly due to Ar incorporation also from the initial BM). Reducing the temperature generally results in smaller Ag particles. At 125 °C, no distinct Ag particles were observed by HAADF-STEM.
HAADF-STEM images of the sample with D p,i = 122 nm after 25 cycles of HPT at 200 °C at (a) 0.1 s−1 and (b) 6.25 s−1, and at 300 °C at (c) 0.1 s−1 and (d) 6.25 s−1. All images are taken in the ND direction (RD–TD plane).

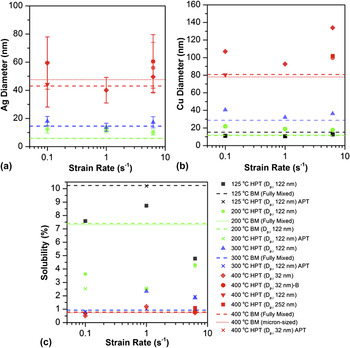
Figure 5 summarizes the measurements of Ag particle diameters, Cu grain diameters, and Ag solubilities on samples processed at various strain rates and temperatures. The values associated with samples BM at temperatures nominally equivalent to the HPT temperatures are included for comparison, but for somewhat longer times, ≈2 h. Both the sphere-equivalent average Ag particle and Cu grain sizes increase with temperature and exhibit negligible strain rate dependence, within experimental error. With the possible exception of one of the samples processed at 125 °C, the Ag solubility in Cu is relatively insensitive to strain rate. The grain and particle shapes, on the other hand, do display a strain-rate dependence, which will be discussed in more detail below. The Ag particle and Cu grain sizes in the BM samples are consistent with samples processed by HPT. The Ag solubility values, primarily deduced from the shift in the Cu(111) peak measured by XRD, for BM and HPT samples differ somewhat, primarily around 200 °C. The differences can be rationalized by small differences in processing temperatures, which are difficult to accurately measure during BM. Nevertheless, the trend of increasing Ag solubility with decreasing processing temperature is consistent across both data sets. The Ag solubilities in Cu determined from XRD were also confirmed for selected samples using APT, which provides a more sensitive measure of local solute concentration; this will be described in more detail below.
(a) Ag particle and (b) Cu grain diameters calculated from the in-plane STEM images and corrected for thickness by XRD measurement, and (c) solubility of Ag in Cu (all data determined from the Cu(111) peak shift in XRD except the ‘x’ labels which is from APT). The dashed lines correspond to data taken from high temperature BM experiments. The legend applies to all three plots, and the parenthetical information describes the initial Ag particle size.

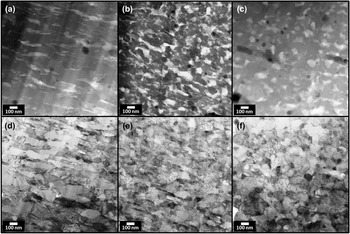
For samples deformed by HPT at 400 °C, the shapes of the Cu grains and Ag particles vary with strain rate, as seen in the HAADF-STEM images in the RD direction provided in Fig. 6. At the lowest strain rate, the Ag particles and Cu grains are most anisometric, on average exhibiting elongated morphologies aligned approximately perpendicular to the sample normal. At the highest strain rate, the Ag and Cu grains are far more equiaxed. The average ratio of Ag particle lengths parallel and perpendicular to the strain axis at 400 °C is 3.7, 2.1, and 1.4 at 0.1, 1, and 6.25 s−1, respectively. This effect is also observed at 300 °C, as shown in Fig. 7, although its magnitude is somewhat smaller, with the average aspect ratio changing from 1.8 to 1.4 for strain rates increasing from 0.1 to 6.25 s−1. Surprisingly, when imaged in the ND direction, the grains and particles in all samples appear equiaxed, suggesting that the elongated grains and particles observed at lower strain rates, on average, exhibit a plate-like morphology, compressed along the loading axis. The compressional strain of the samples, as noted above, was only ≈20% and cannot explain this behavior. Similar behavior was reported by Ren et al. Reference Ren, Arshad, Bellon, Averback, Pouryazdan and Hahn36 for large strains induced by mechanical wear.
HAADF-STEM images of the sample with D p,i = 31 nm sample after 25 cycles of HPT at 400 °C deformed at (a) 0.1 s−1, (b) 1 s−1, and (c) 6.25 s−1, and their corresponding BF-STEM images (d, e, and f), respectively.

HAADF-STEM images of the sample with D p,i = 122 nm sample after 25 cycles of HPT at 300 °C deformed at (a) 0.1 s−1 and (b) 6.25 s−1, and their corresponding BF-STEM images (c and d), respectively.

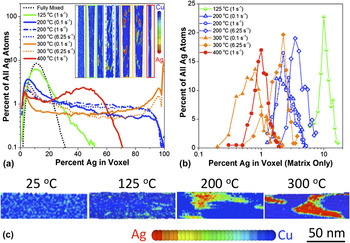
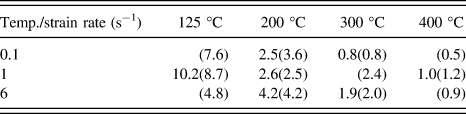
Selected APT data were acquired to confirm the Ag solubility measurements determined from XRD, but also to characterize more broadly the Ag distribution in the different types of samples. Figure 8(a) shows reconstructed images of APT tips, where the color scale is based on the local average Ag concentration. These concentration maps were obtained by forming a simple cubic lattice with a cell size of 1 nm3 and measuring the atomic concentration in each cell, or “voxel.” Each voxel contains ≈100 atomic sites, although with the collection efficiency of the APT being ≈½, the average count/voxel was 42. Also shown in this figure is the distribution of Ag concentrations in all of the voxels. The dotted line represents the (Poisson) distribution for a homogeneous sample. At room temperature, the sample with D p,i = 122 nm chemically randomizes at strains exceeding 500 as reported in Ref. Reference Arshad, Lach, Pouryazdan, Hahn, Bellon, Dillon and Averback17. The solubility of Ag in the Cu matrix was obtained by averaging the Ag concentration in voxels located away from the Ag precipitates. Figure 8(b), for example, shows the distributions of Ag in such regions under different HPT conditions. The results for the solubilities are presented in Table I. Overall, these results agree well with the data from XRD: the solubilities decrease with increasing temperature, while on the other hand, they have only a weak dependence on strain rate. It is noteworthy that at 125 °C no distinct Ag-rich particles larger than 1 voxel are present; consequently our procedure yields a solubility equal to the average concentration of Ag in the sample. The distribution, however, deviates from a Poisson distribution indicating that it is not completely random. To reflect the nonrandom distribution of Ag, and the observation of Ag rich voxels, subsequent discussion will assume that at 125 °C some Ag clustering occurs at a length scale of ≈1 nm, particularly, in the context of comparing the relationship between particle size and solubility.
(a) Distribution of Ag atoms versus percent Ag in voxels for different temperatures and deformation rates. The inset show 1 nm3 voxel-based reconstruction of the tips corresponding to each plot. Data for fully mixed (random) sample are shown from previous study. Reference Arshad, Lach, Pouryazdan, Hahn, Bellon, Dillon and Averback17 (b) Percent of all Ag atoms versus percent Ag in voxels located in the Cu-rich matrix region only (10 ,000–20,000 atoms in each distribution). (c) Voxel reconstructions of regions showing individual particles in the APT samples.

Solubilities in at.% as a function of temperature and strain rate measured from APT data along with values calculated from XRD (in parentheses).

At 200 °C, Ag particles are clearly observed, although they have relatively diffuse interfaces when compared to the samples prepared at 300 °C, as shown in Fig. 8(c). At 400 °C, no particles were observed, but this is due to the average interparticle distance exceeding the size of the APT tip. Interesting is that within the 400 °C sample, interconnected planes of Ag rich material are observed, possibly indicating Ag segregation to the Cu grain boundaries. APT also revealed Fe and O contamination, typically less than 0.1 and 1 at.%, respectively.
IV. DISCUSSION
Self-organization in A–B alloys with thermo-chemical properties similar to Cu–Ag during SPD had been investigated previously using KMC simulations.
Reference Schwen, Wang, Averback and Bellon47,Reference Enrique and Bellon57
These simulations predict how the microstructural length scales and nonequilibrium solubilities in these alloys depend on temperature and strain rate, and thus they provide a useful context to interpret the current experimental results. Before comparing these simulations with our experiments, however, the key assumptions in the model deserve comment. First, the KMC simulation uses a rigid lattice so it excludes any effects of grain boundaries, interphase boundaries, or interactions between dislocations. Thus, the model neglects shear-induced vacancy production, for example, by the nonconservative motion of jogs in screw dislocations,
Reference Militzer, Sun and Jonas58,Reference Song, Chen and Weng59
even though past BM experiments indicate their potential importance.
Reference Klassen, Herr and Averback13,Reference Wu, Isheim, Bellon and Seidman45
This concentration of excess vacancies, moreover, is sensitive to temperature and various microstructural features,
Reference Militzer, Sun and Jonas58,Reference Mecking and Estrin60
and this makes accounting for them challenging in simulations. The KMC model, therefore, ignored shear-induced vacancies and simply used a single vacancy to mediate thermal diffusion, with the thermal vacancy concentration being accounted for by varying the vacancy jump frequency. Finally, the model assumes random shearing, i.e., a dislocation is forced to glide across the sample on one slip plane, and then a new dislocation is forced to glide on another of the 12 slip systems of the FCC lattice, which is chosen randomly. While these assumptions clearly obviate direct comparison between the simulations and experiments, the main predictions of the simulations are nevertheless quite useful for understanding the current experiments. Namely, the simulations provide a direct relationship between the microstructural length scale of the alloy, r, and the ratio of vacancy jump frequency to the frequency of shear-induced atomic relocations; as noted above
 $r = {{{a_0}} \over {{d^2}}}{{{F_{{\rm{vac}}}}} \over {{F_{{\rm{shear}}}}}}$
. This relationship is clearly valid regardless of the source of vacancies: equilibrium vacancies or shear induced vacancies. We can relate this finding to the experiments by noting that,
Reference Schwen, Wang, Averback and Bellon47
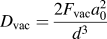 ${D_{{\rm{vac}}}} = {{2{F_{{\rm{vac}}}}a_0^2} \over {{d^3}}}$
and
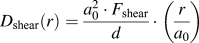 ${D_{{\rm{shear}}}}\left( r \right) = {{a_0^2 \cdot {F_{{\rm{shear}}}}} \over d} \cdot \left( {{r \over {{a_0}}}} \right)$
, so that
 $$r = {{{a_0}} \over {{d^2}}}{{{F_{{\rm{vac}}}}} \over {{F_{{\rm{shear}}}}}} = {{\nu {c_{\rm{v}}}} \over {\dot \gamma }}{a_0}\quad ,$$
where c
v is the molar fraction of vacancies, ν is the frequency at which an individual vacancy jumps, and
 $\dot \gamma$
is the strain rate. The simulations also show that the solubility of an immiscible alloying addition during shear is governed by kinetic effects rather than thermodynamic (i.e., the Gibbs–Thomson equation). This leads to a characteristic scaling between solubility and microstructural length scale, also independent of the temperature and/or strain rate, and this scaling can be tested directly in the experiments.
Reference Schwen, Wang, Averback and Bellon47
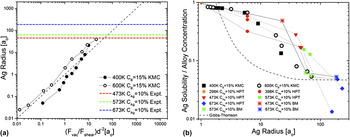
We begin our discussion by showing in Fig. 9 the results of the experiments and simulations on the same plot. The first feature to notice is that over a wide range of temperature (400–600 K), strain rate (10−11 s−1–10−3 s−1), and composition (15–50 at.%), the microstructural lengths in the simulations scale very well with
 ${{{a_0}} \over {{d^2}}} \cdot {{{F_{{\rm{vac}}}}} \over {{F_{{\rm{shear}}}}}}$
. This provides strong support that Eq. (1) is fairly robust, being insensitive to the details of the microstructure and the concentration of vacancies. The experimental data are more difficult to plot since we do not know the vacancy jump frequency, apriori, however, since the length scale does not depend on strain rate, we show the experimental data in this plot as horizontal lines for the different temperatures. The reason for this lack of a dependence of r on strain rate can be understood by assuming that the vacancies are created solely by shear deformation, with each unit of strain producing a fixed concentration of vacancies, α, i.e.,
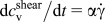 ${{{\rm{d}}c_{\rm{v}}^{{\rm{shear}}}} \mathord{\left/ {\vphantom {{{\rm{d}}c_{\rm{v}}^{{\rm{shear}}}} {{\rm{d}}t}}} \right. \kern-\nulldelimiterspace} {{\rm{d}}t}} = \alpha \dot \gamma$
. If we further assume that these excess vacancies annihilate at grain boundaries, then
 $F_{\rm{v}}^{{\rm{shear}}} \propto {{\alpha \dot \gamma L^2 } \mathord{\left/ {\vphantom {{\alpha \dot \gamma L^2 } {3\pi ^2 }}} \right. \kern-\nulldelimiterspace} {3\pi ^2 }}$
, where L is the grain size. Since F
shear is also proportional to the strain rate,
 $\dot \gamma$
, the ratio F
v/F
shear is independent of strain rate. These considerations also show why the experimental values of r are only weakly dependent on temperature, as r depends on temperature only through the grain size, L, where the experimental values show increases only slowly with temperature. Indeed, the increases in the experimental values of r with temperature shown in Fig. 9(a) are consistent with the increases in grain size shown in Fig. 5. This argument of first-order defect kinetics had been used previously to help explain phase stability in amorphous/crystalline NiZr alloys
Reference Chen, Bibole, Le Hazif and Martin61
and macroscopic phase separation in Cu/Ag alloys
Reference Klassen, Herr and Averback13
during high temperature BM.
(a) Comparison of microstructural length scale measured experimentally and calculated by KMC Reference Schwen, Wang, Averback and Bellon47 as a function of the calculated thermal vacancy jump frequency normalized to the shearing frequency, d 2, and a 0. The experimental data are plotted as lines since the absolute vacancy concentration is not known explicitly. (b) Comparison of the solubility of Ag in Cu, normalized to Ag concentration, as a function of microstructural length scale measured experimentally (Cu90Ag10) and calculated by KMC (Cu85Ag15). Reference Schwen, Wang, Averback and Bellon47 The dotted lines connect data points collected at equivalent strain rates.

We next estimate the steady-state, shear-induced vacancy concentration. While, in principle, this can be directly achieved using Eq. (1a), the determination of the jump frequency of vacancies is difficult to estimate owing to correlation of jumps at interface (Cu/Ag) boundaries. We therefore compare the values r between the experiments and simulations at the same strain rate and temperature, i.e.,
 $c_{\rm{v}}^{{\rm{shear}}} = \left( {{{{r_{\exp }}} \mathord{\left/ {\vphantom {{{r_{\exp }}} {{r_{{\rm{KMC}}}}}}} \right. \kern-\nulldelimiterspace} {{r_{{\rm{KMC}}}}}}} \right) \cdot c_{\rm{v}}^{{\rm{eq}}}$
, where
 $c_{\rm{v}}^{{\rm{eq}}}$
is the equilibrium vacancy concentration calculated in the simulations
62
and r
exp and r
KMC are the experimental and KMC values of the precipitate size, respectively. The values of
 $c_{\rm{v}}^{{\rm{shear}}}$
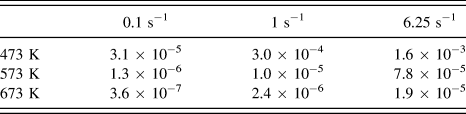
obtained in this way are shown in Table II for the different temperatures used in the experiments, and as seen, they are on the order of 10−7–10−3. The highest concentration obtained, which occurs at the lowest temperature, T = 200 °C, is approximately a factor of 10 larger than the equilibrium concentration of vacancies at the melting temperature of Cu. If we assume further that the vacancies annihilate predominantly at grain boundaries, we can also estimate the vacancy production rate. We obtain for both 200 and 300 °C, α = 1.5 × 10⁻³ ± 6 × 10⁻⁴. For comparison, we note the theoretical estimate of Mecking and Estrin,
Reference Mecking and Estrin60
 $\alpha = 0.1{\sigma \over {G \cdot {b^3}}}$
, and with a value of σ ≈ 1 GPa,
Reference Vo, Schaefer, Averback, Albe, Ashkenazy and Bellon63
α = 3 × 10⁻³. This close agreement with the experiments is clearly somewhat fortuitous, given the assumptions involved, but nevertheless, the agreement does show that the analysis provides physically reasonable estimates.
Vacancy concentration (in atom fraction) as a function of strain rate and temperature calculated from our experimental data following Eq. (1).

We can also compare the equilibrium concentration of vacancies (in pure Cu) at 400 °C,
 $c_{\rm{v}}^{{\rm{eq}}}$
≈ 1 × 10⁻⁹ to the calculated shear-induced concentration
 $c_{\rm{v}}^{{\rm{shear}}}$
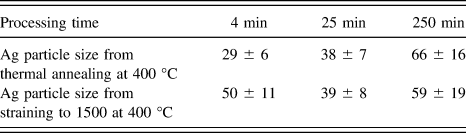
≈ 3 × 10⁻⁷ (obtained at the lowest strain rate). The concentration of thermal vacancies is beginning to approach the shear induced concentration, and this perhaps explains why the precipitate size during thermal annealing at 400 °C is comparable to that during shear mixing at that temperature, as shown in Table III. As discussed below, however, recrystallization is also becoming active at this temperature, and this may also influence the behavior. Extrapolation of the nonequilibrium vacancy concentration to 125 °C shows that the concentration would be on the order of 10−2. This is comparable to or exceeds the maximum excess concentration of vacancies that a crystal can support (≈10−3–10−2).
Reference Wu, Isheim, Bellon and Seidman45
This explains why the microstructural length scale is markedly reduced at 125 °C despite the fact that vacancies are still mobile at this temperature (see Fig. 10); i.e., the vacancy concentration saturates and the effective production rate of nonequilibrium vacancies, α, is no longer independent of temperature. Wu et al.
Reference Wu, Isheim, Bellon and Seidman45
assumed such behavior to explain the steady-state length scale in BM Cu50Ag50 between 120 and 180 °C.
Comparison of samples thermally annealed and HPT at 400 °C for equivalent times. Note that the 4 min sample is at the highest strain rate and the 250 min sample is at the lowest strain rate.

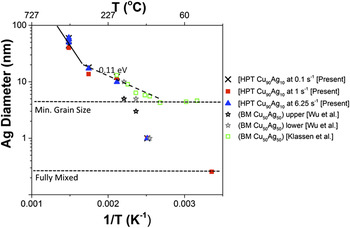
Plot of Ag particle size as a function of temperature and strain rate comparing the current results with prior work utilizing Cu50Ag50 processed by BM.

The dependence of solubility is plotted in Fig. 9(b) as a function of length scale. In this case, the experiments and KMC simulations can be compared directly, and it is seen that they are in rough agreement. Both show much higher solubility at small length scales than does Gibbs–Thomson, but they approach Gibbs–Thomson, as calculated in Ref. Reference Schwen, Wang, Averback and Bellon47, at large length scales. The fact that the relationship between solubility and microstructural length scale approaches Gibbs–Thomson at 400 °C suggests that the system is approaching equilibrium, in agreement with our estimates of
 ${{c_{\rm{v}}^{{\rm{shear}}}} \mathord{\left/ {\vphantom {{c_{\rm{v}}^{{\rm{shear}}}} {c_{\rm{v}}^{{\rm{eq}}}}}} \right. \kern-\nulldelimiterspace} {c_{\rm{v}}^{{\rm{eq}}}}}$
discussed above.
Finally, we consider the steady-state response of the system at 400 °C. At this temperature, the steady-state Ag particle size is characteristically larger than what would be extrapolated from lower temperatures in the Arrhenius plot shown in Fig. 10, thus suggesting a different mechanism influencing the process at 300 and 400 °C. Indeed for pure Cu, it has been predicted that at a strain rate of 0.1 s−1, the transition from recovery to recrystallization will occur at ≈380 °C. Reference Galindo-Nava and Rivera-Diaz-del-Castillo64 Hong and Kwon Reference Hong and Kwon65 also observed recrystallization of Cu84Ag16 alloys at a strain rate of ≈10−4 at 400 °C, while they reported almost no recrystallization occurred in samples strained at 300 °C. Since the tracer diffusivity of Ag in Cu exceeds self-diffusion by an order of magnitude at these low temperatures, we will assume that grain growth and recrystallization of the primary Cu phase govern the evolution of grain shape. The significant differences in grain anisometry as a function of strain rate at 400 °C, viz., becoming more equiaxed with increasing strain rate, suggest the onset of dynamic recrystallization. Samples processed at higher strain rates acquire stored energy more quickly; thus promoting a higher nucleation rate of recrystallized grains and a more equiaxed structure. An increase in local sample heating due to higher strain rates Reference Pereira, Figueiredo, Huang, Cetlin and Langdon49 might also promote an increase in nucleation rate, although no significant temperature rise was observed at the anvils adjacent to the sample. BF-STEM images in Figs. 6 and 7 indicate a higher dislocation density within the grains of samples processed at 300 °C relative to those HPT at 400 °C, which is again consistent with a change in relaxation mechanism from dynamic recovery to dynamic recrystallization.
V. CONCLUSIONS
We have used HPT experiments at high temperatures to analyze the effects of temperature and strain rate on self-organization in dilute Cu–Ag. It was demonstrated that the same steady-state is achieved regardless of initial microstructure; coarse grained and decomposed or homogenized. The characteristic length scale associated with compositional patterning is approximately independent of shearing rate, and it shows a very low apparent activation energy. Experimental observations suggest that below 300 °C the excess nonequilibrium shear-induced vacancy concentration governs diffusional relaxations during high temperature shearing. A transition from recovery controlled coarsening to dynamic recrystallization dominated coarsening occurs between 300 and 400 °C. Self-organization reactions still prevail during dynamic recrystallization, but with strain rate primarily influencing particle and grain shapes.
ACKNOWLEDGMENTS
The authors would like to acknowledge the financial support from National Science Foundation (DMR 10-05813) to carry out this research. The APT was performed at the Northwestern University Center for Atom-Probe Tomography (NUCAPT), which is supported by the National Science Foundation's MRSEC Program (DMR-1121262). The research at TUD and KIT was financially supported by Deutsche Forschungsgemeinschaft (HA1344/22-2). The Austrian Science Fund FWF within the project No T512-N20 is thankfully acknowledged for supporting D.S.