



1 Introduction
The addition of a small amount of polymers of high molecular weight can lead to a pressure drop decrease in turbulent flows. Since the first observations reported by Forrest & Grierson (Reference Forrest and Grierson1931), Toms (Reference Toms1948) and Mysels (Reference Mysels1949), numerous experimental studies have been conducted in attempts to make practical use of polymer-induced drag reduction (DR), including long-distance transport of liquids (Sellin et al. Reference Sellin, Hoyt, Poliert and Scrivener1982), oil well operations (Burger & Chorn Reference Burger and Chorn1980), fire fighting (Fabula Reference Fabula1971), transport of suspensions and slurries (Golda Reference Golda1986) and biomedical applications (Greene, Mostardi & Nokes Reference Greene, Mostardi and Nokes1980). In a remarkable and pioneering paper, Virk, Mickley & Smith (Reference Virk, Mickley and Smith1967) performed a careful analysis with an experimental turbulent pipe flow apparatus and showed that if the friction drag for pipe flows is plotted in Prandtl–Kármán coordinates, it departs from the Prandtl–Kármán law (the onset of DR) to its bound, the so-called maximum drag reduction (MDR) or Virk’s asymptote, as a result of an increase in either the Reynolds number, the polymer concentration or the polymer’s molecular weight. Over the years, researchers have successfully analysed relevant aspects of this phenomenon and a significant literature is available, e.g. Hershey & Zakin (Reference Hershey and Zakin1967), Paterson & Abernathy (Reference Paterson and Abernathy1970), Virk, Mickley & Smith (Reference Virk, Mickley and Smith1970), Virk (Reference Virk1975), Bewersdorff (Reference Bewersdorff1982), Bewersdorff & Singh (Reference Bewersdorff and Singh1988), Moussa & Tiu (Reference Moussa and Tiu1994), Gyr & Tsinober (Reference Gyr and Tsinober1995), Kalashnikov (Reference Kalashnikov1998). However, up to now, there has been no definitive consensus concerning the interactions between the turbulent energy and the deformations of the polymer.
Phenomenological explanations for polymer drag reduction gravitate around two major theories. According to the viscous theory, independently proposed by Lumley (Reference Lumley1969) and Seyer & Metzner (Reference Seyer and Metzner1969) and supported by Ryskin (Reference Ryskin1987), polymer stretching in a turbulent flow produces an increase in the effective viscosity in a region outside of the viscous sublayer and in the buffer layer, which suppresses turbulent fluctuations, increasing the thickness of the buffer layer and reducing the wall friction. The elastic theory postulated by Tabor & de Gennes (Reference Tabor and de Gennes1986) assumes that the elastic energy stored by the polymer becomes comparable to the kinetic energy in the buffer layer. Since the corresponding viscoelastic length scale is larger than the Kolmogorov scale, the usual energy cascade is inhibited, which thickens the buffer layer and reduces the drag (see also Joseph Reference Joseph1990).
Numerically, polymer-induced drag reduction theories have been intensively investigated for over a decade since the first simulations conducted by den Toonder, Nieuwstadt & Kuiken (Reference den Toonder, Nieuwstadt and Kuiken1995) and Orlandi (Reference Orlandi1996). Using an inelastic generalized Newtonian fluid to analyse pipe (den Toonder et al. Reference den Toonder, Nieuwstadt and Kuiken1995) and channel (Orlandi Reference Orlandi1996) flows, both researchers argued that DR seems to be closely related to the anisotropy of the elongational viscosity, a parameter that measures the resistance of the fluid against stretching deformations. Such an argument was also presented by Sureshkumar, Beris & Handler (Reference Sureshkumar, Beris and Handler1997), who performed the first self-consistent direct numerical simulation (DNS) of turbulent channel flow of a viscoelastic finitely extensible nonlinear elastic in the Peterlin approximation (FENE-P) fluid (Peterlin Reference Peterlin1961), at a zero shear friction Reynolds number of 125. Their results suggest a partial suppression of turbulence within the buffer layer after the onset of drag reduction, which is linked with an enhanced effective viscosity attributed to the extension of polymers dispersed in the flow.
The explanations proposed in the three papers referred to above (den Toonder et al. Reference den Toonder, Nieuwstadt and Kuiken1995; Orlandi Reference Orlandi1996; Sureshkumar et al. Reference Sureshkumar, Beris and Handler1997) seem to corroborate Lumley’s theory. In an attempt to quantify this viscous scenario, L’vov et al. (Reference L’vov, Pomyalov, Procaccia and Tiberkevich2004) used conservation principles to show that an additional effective viscosity growing linearly with the distance from the wall in the buffer layer has similar effects to those observed by the addition of flexible polymers in turbulent flows. This theoretical prediction was later confirmed by De Angelis et al. (Reference De Angelis, Casciola, L’vov, Pomyalov, Procaccia and Tiberkevich2004), who performed a DNS of Newtonian turbulent flows with an added viscosity profile obtaining results previously observed in viscoelastic FENE-P simulations. Additionally, using this simple linear viscosity model, De Angelis et al. (Reference De Angelis, Casciola, L’vov, Pomyalov, Procaccia and Tiberkevich2004) were able to predict the maximum drag reduction asymptote, a point discussed in detail by Benzi et al. (Reference Benzi, Angelis, L’vov and Procaccia2005).
It is important to note that the elastic theory has also been actively explored. Min et al. (Reference Min, Yoo, Choi and Joseph2003) conducted a DNS of turbulent drag reducing channel flows in which the dilute polymer solution is simulated using the Oldroyd-B model. Their results showed good agreement with previous theoretical and experimental predictions of the onset of DR at specific friction Weissenberg numbers which is interpreted based on the elastic theory. Min et al. (Reference Min, Yoo, Choi and Joseph2003) and Dallas, Vassilicos & Hewitt (Reference Dallas, Vassilicos and Hewitt2010) describe an elastic scenario in which the elastic energy stored in the near-wall region due to the uncoiling of polymer molecules is transported to and, to some extent, released in the buffer and log-law layers. This storage of energy around the near-wall vortices was confirmed by Dubief et al. (Reference Dubief, White, Terrapon, Shaqfeh, Moin and Lele2004), who performed a DNS of turbulent polymer solutions in a channel using the FENE-P model, although, in contrast to Min et al. (Reference Min, Yoo, Choi and Joseph2003) and Dallas et al. (Reference Dallas, Vassilicos and Hewitt2010), they proposed an autonomous regeneration cycle of polymer wall turbulence in which the coherent release of energy occurs in the very near-wall region, just above the viscous sublayer. In order to clarify the dynamics of the polymer–turbulence interaction, Thais, Gatski & Mompean (Reference Thais, Gatski and Mompean2012) used the DNS of a fully developed turbulent channel flow of Newtonian and viscoelastic FENE-P fluids at zero shear friction Reynolds numbers up to 1000 and carefully examined the budgets of turbulent kinetic energy and the elastic energy budget in drag reducing flows. The authors showed that the elastic energy production is small in the very near-wall region, growing with the distance from the wall and reaching a maximum value in the log-law region. This elastic energy production acts simultaneously as the dominant source of elastic energy and as the dominant sink of turbulent energy. This is rather in line with Tabor and De Gennes’s description. However, recently, Thais, Gatski & Mompean (Reference Thais, Gatski and Mompean2013) emphasized that at
 $Re_{\unicode[STIX]{x1D70F}_{0}}=1000$
, the elastic coupling between the turbulence and the polymer does not depend on the drag reduction regime (the level of viscoelasticity), which is in disagreement with the elastic theory.
Despite the discrepancies between the two most prominent theories, what seems to be in accordance with both scenarios is the relevance of the polymer coil–stretch process, which further imposes a transient behaviour on the drag reduction as well as a subsequent polymer degradation, a consequence of polymer elongation (Merrill & Horn Reference Merrill and Horn1984; Pereira, Andrade & Soares Reference Pereira, Andrade and Soares2013; Soares et al. Reference Soares, Sandoval, Silveira, Pereira, Trevelin and Thomaz2015). In order to understand the polymer coil–stretch process, Bagheri et al. (Reference Bagheri, Mitra, Perlekar and Brandt2012) presented direct numerical simulations of turbulent channel flow with passive Lagrangian linear (Oldroyd-B) and nonlinear (FENE) polymers. For the FENE model, the polymers are more elongated within the near-wall region although such extension becomes less heterogeneous as the Weissenberg number increases. Furthermore, a much stronger orientational trend is seen close to the wall, where the polymers are well aligned along the streamwise direction. The authors also verified the alignment of the end-to-end vector with respect to the principal directions of the rate-of-strain tensor and the vorticity vector. Nevertheless, they did not identify possible tensors capable of stretching the polymers, which would reveal more details about the uncoiling mechanism.
It is clear that the DR phenomenon is not completely understood and many aspects of the problem remain unclear. Any attempt to completely elucidate polymer-induced drag reduction must consider, at least, four important issues: the mechanism of polymer coil–stretch; the development of turbulent structures in viscoelastic flows; the exchange of energy between the turbulence and the polymers; and the breaking of the polymer molecules.
In the present paper, we investigate the polymer coil–stretch process with the aid of direct numerical simulations of the turbulent channel flow of a viscoelastic FENE-P fluid taking into account a wide range of zero shear friction Reynolds numbers (from 180 up to 1000). Tensorial and statistical analyses are developed in an attempt to highlight the role played by three relevant kinematic tensor entities in the polymer extension mechanism: the velocity fluctuation product tensor (which can be physically interpreted as an instantaneous Reynolds stress), the rate-of-strain tensor and the rate-of-rotation tensor. As the primary focus, the relative polymer stretch and the alignment between the conformation tensor and these three important tensor entities will be confronted. Additionally, joint probability density functions will be used in order to correlate the polymer–turbulence exchanges of energy and polymer orientations. Lastly, the flow will be divided into two distinct regions, following the
 $Q$
-criterion of vortex identification (see Hunt, Wray & Moin Reference Hunt, Wray and Moin1988): an elliptical (or vortical) part where the second invariant of the velocity gradient tensor is positive and a hyperbolic (or extensional) part which is determined by the negative values of the second invariant of the velocity gradient tensor. The polymer work fluctuation will then be investigated within these regions, separately. The analyses that came out from these tools enable the proposition of a polymer coil–stretch mechanism based on the autonomous regeneration cycle reported by Dubief et al. (Reference Dubief, White, Terrapon, Shaqfeh, Moin and Lele2004), which in turn was based on that conceived for Newtonian turbulent flows, previously presented by Jiménez & Pinelli (Reference Jiménez and Pinelli1999).
Following the description of the physical formulation and numerical methodology presented in § 2, our main results are separated into three parts: §§ 3–5. In the first part (§ 3), some classical time-averaged quantities are initially presented. In § 4, we analyse the distribution of polymer stretch across the wall distance, of which the effects on near-wall vortices and the dependence on
 $L$
and
 $Wi_{\unicode[STIX]{x1D70F}_{0}}$
are investigated as well, as exposed in § 4.1. Tensor analyses are conducted in § 4.2 in an attempt to verify the alignment between the conformation tensor and the other three relevant entities. In § 5, joint probability density functions are used in order to correlate the polymer–turbulence exchanges of energy and polymer alignments (§ 5.1). Additionally, the coil–stretch polymer process is linked with the coherent structures within the flow (§ 5.2). In § 6, these interactions are finally employed to describe a detailed cyclic mechanism of the polymer–turbulence interaction.
2 Physical formulation and numerical methodology
A turbulent channel flow of an incompressible dilute polymer solution is considered. Such a geometry is commonly adopted in direct numerical simulations due to its simplicity as well as its attractiveness for both experimental and theoretical studies of near-wall turbulent interactions. Here, the channel streamwise direction is
 $x_{1}=x$
, the spanwise direction is
 $x_{2}=y$
and the direction normal to the wall is
 $x_{3}=z$
.
The instantaneous velocity field in the respective directions is
 $(u_{x},u_{y},u_{z})=(u,v,w)$
and is solenoidal (
 $\unicode[STIX]{x1D735}\boldsymbol{\cdot }\boldsymbol{u}=0$
, where
 $\boldsymbol{u}$
denotes the velocity vector). The governing equations are scaled with the channel half-width,
 $h$
, the bulk velocity,
 $U_{h}$
, and the fluid density,
 $\unicode[STIX]{x1D70C}$
.
The scaled momentum equations are
 $$\begin{eqnarray}\displaystyle \frac{\unicode[STIX]{x2202}u_{i}}{\unicode[STIX]{x2202}t}+u_{j}\frac{\unicode[STIX]{x2202}u_{i}}{\unicode[STIX]{x2202}x_{j}}=-\frac{\unicode[STIX]{x2202}p}{\unicode[STIX]{x2202}x_{i}}+\frac{\unicode[STIX]{x1D6FD}_{0}}{Re_{h}}\frac{\unicode[STIX]{x2202}^{2}u_{i}}{\unicode[STIX]{x2202}x_{j}^{2}}+\frac{1}{Re_{h}}\frac{\unicode[STIX]{x2202}\unicode[STIX]{x1D6EF}_{ij}}{\unicode[STIX]{x2202}x_{j}}. & & \displaystyle\end{eqnarray}$$
In (2.1),
 $p$
is the pressure,
 $\unicode[STIX]{x1D6FD}_{0}$
is the ratio of the Newtonian solvent kinematic viscosity (
 $\unicode[STIX]{x1D708}_{N}$
) to the total zero shear kinematic viscosity (
 $\unicode[STIX]{x1D708}_{0}=\unicode[STIX]{x1D708}_{N}+\unicode[STIX]{x1D708}_{p0}$
) and the bulk Reynolds number is
 $Re_{h}=U_{h}h/\unicode[STIX]{x1D708}_{0}$
. The extra stress tensor components are denoted by
 $\unicode[STIX]{x1D6EF}_{ij}$
. The formalism of (2.1) includes the assumption of a homogeneous polymer concentration which is governed by the viscosity ratio
 $\unicode[STIX]{x1D6FD}_{0}$
, where
 $\unicode[STIX]{x1D6FD}_{0}=1$
yields the limiting behaviour of the Newtonian case.
The extra stress tensor components (
 $\unicode[STIX]{x1D6EF}_{ij}$
) in (2.1) represent the polymer’s contribution to the stress of the solution. This contribution is accounted for by a single spring–dumbbell model. We employ here the FENE-P kinetic theory (Bird, Armstrong & Hassager Reference Bird, Armstrong and Hassager1987), which is the most preferred one due to its physically realistic finite extensibility of the polymer molecules and to its relatively simple second-order closure. This model employs the phase-averaged conformation tensor,
 $\unicode[STIX]{x1D63E}$
. The components of the extra stress tensor are then
 $$\begin{eqnarray}\displaystyle \unicode[STIX]{x1D6EF}_{ij}=\frac{(1-\unicode[STIX]{x1D6FD}_{0})}{Wi_{h}}(f\{\text{tr}(\unicode[STIX]{x1D63E})\}\unicode[STIX]{x1D60A}_{ij}-\unicode[STIX]{x1D6FF}_{ij}), & & \displaystyle\end{eqnarray}$$
in which
 $Wi_{h}=\unicode[STIX]{x1D706}U_{h}/h$
is the bulk Weissenberg number (
 $\unicode[STIX]{x1D706}$
being the relaxation time scale),
 $\unicode[STIX]{x1D6FF}_{ij}$
is the Kronecker delta operator and
 $f\{\text{tr}(\unicode[STIX]{x1D63E})\}$
is given by the Peterlin approximation
 $$\begin{eqnarray}\displaystyle f\{\text{tr}(\unicode[STIX]{x1D63E})\}=\frac{L^{2}-3}{L^{2}-\text{tr}(\unicode[STIX]{x1D63E})}, & & \displaystyle\end{eqnarray}$$
where
 $L$
is the maximum polymer molecule extensibility and
 $\text{tr}(\cdot )$
represents the trace operator. The governing equation for the conformation tensor are
 $$\begin{eqnarray}\displaystyle \frac{\unicode[STIX]{x2202}\unicode[STIX]{x1D60A}_{ij}}{\unicode[STIX]{x2202}t}+u_{k}\frac{\unicode[STIX]{x2202}\unicode[STIX]{x1D60A}_{ij}}{\unicode[STIX]{x2202}x_{k}}-\frac{\unicode[STIX]{x2202}u_{i}}{\unicode[STIX]{x2202}x_{k}}\unicode[STIX]{x1D60A}_{kj}-\frac{\unicode[STIX]{x2202}u_{j}}{\unicode[STIX]{x2202}x_{k}}\unicode[STIX]{x1D60A}_{ki}+\frac{f(\text{tr}(\unicode[STIX]{x1D63E}))\unicode[STIX]{x1D60A}_{ij}-\unicode[STIX]{x1D6FF}_{ij}}{Wi_{h}}=\left(\frac{1}{Sc_{c}Re_{h}}\right)\frac{\unicode[STIX]{x2202}^{2}\unicode[STIX]{x1D60A}_{ij}}{\unicode[STIX]{x2202}x_{k}^{2}}, & & \displaystyle\end{eqnarray}$$
in which
 $Sc_{c}=\unicode[STIX]{x1D708}_{0}/\unicode[STIX]{x1D705}_{c}$
is the Schmidt number defined as the ratio of the total kinematic zero shear rate viscosity (
 $\unicode[STIX]{x1D708}_{0}$
) to an artificial stress diffusivity
 $\unicode[STIX]{x1D705}_{c}$
. This explicit elliptic diffusion term included in (2.4) is an artefact used to improve numerical stability in pseudo-spectral simulations of viscoelastic fluids. This dissipative term was first introduced in this context by Sureshkumar & Beris (Reference Sureshkumar and Beris1995), and the methodology was subsequently validated under a variety of flows and material parameters (see Housiadas & Beris Reference Housiadas and Beris2003).
Since the numerical scheme for DNS was already given in detail by Thais et al. (Reference Thais, Tejada-Martinez, Gatski and Mompean2011), we present here a brief description of the mathematical and numerical approaches. The hybrid MPI/OPENMP algorithm used was tailored to run properly in massively parallel architectures. The hybrid spatial scheme includes Fourier spectral accuracy in the two homogeneous directions (
 $x$
and
 $y$
) and sixth-order compact finite differences for the first- and second-order wall-normal derivatives (
 $z$
direction). Time marching can be up to fourth-order accurate by the use of the Adams–Moulton scheme for the viscous terms and Adams–Bashforth for the explicit terms. Pressure–velocity coupling is facilitated by a higher-order generalization of the semi-implicit fractional step method on a non-staggered grid arrangement analysed by Armfield & Street (Reference Armfield and Street2000). In order to attenuate high wavenumber energy accumulation, de-aliasing and fourth-order filtering are performed in the two homogeneous and wall-normal directions, respectively.
Parameters for the DNS of Newtonian and FENE-P turbulent channel flows.

The parameters for the turbulent Newtonian and FENE-P channel flows studied here are summarized in table 1. Our simulated cases were chosen keeping in mind that viscoelastic fluids can have significantly different statistical behaviour from a Newtonian fluid. For a given turbulence level, as parametrized by the zero shear friction Reynolds number
 $Re_{\unicode[STIX]{x1D70F}_{0}}$
(defined as
 $Re_{\unicode[STIX]{x1D70F}_{0}}=u_{\unicode[STIX]{x1D70F}}h/\unicode[STIX]{x1D708}_{0}$
, where
 $u_{\unicode[STIX]{x1D70F}}$
denotes the friction velocity), this effect can vary with the friction Weissenberg number,
 $Wi_{\unicode[STIX]{x1D70F}_{0}}$
(where
 $Wi_{\unicode[STIX]{x1D70F}_{0}}=\unicode[STIX]{x1D706}{u_{\unicode[STIX]{x1D70F}}}^{2}/\unicode[STIX]{x1D708}_{0}$
) and the maximum polymer extension length,
 $L$
. In this paper, four Newtonian flows and seven viscoelastic flows were examined, keeping the viscosity ratio
 $\unicode[STIX]{x1D6FD}_{0}$
fixed at 0.9 and taking into account four different values of the zero shear friction Reynolds number (
 $Re_{\unicode[STIX]{x1D70F}_{0}}=180$
,
 $Re_{\unicode[STIX]{x1D70F}_{0}}=395$
,
 $Re_{\unicode[STIX]{x1D70F}_{0}}=590$
and
 $Re_{\unicode[STIX]{x1D70F}_{0}}=1000$
) and two different values of the friction Weissenberg number and the maximum polymer molecule extensibility (
 $Wi_{\unicode[STIX]{x1D70F}_{0}}=50$
;
 $Wi_{\unicode[STIX]{x1D70F}_{0}}=115$
;
 $L=30$
;
 $L=100$
), which provided drag reduction regimes from 28.5 % up to 62.3 %.
The simulations were conducted at constant pressure gradient, leaving the mass flow rate of non-Newtonian flows to increase and then oscillate about a steady state characterized by a new time-averaged Reynolds number,
 $Re_{h}$
. The drag reduction is evaluated as
 $$\begin{eqnarray}\displaystyle DR=1-\unicode[STIX]{x1D707}_{w}^{2(1-n)/n}\left(\frac{Re_{h,NEWT}}{Re_{h}}\right)^{(2/n)}, & & \displaystyle\end{eqnarray}$$
where
 $$\begin{eqnarray}\displaystyle \unicode[STIX]{x1D707}_{w}=\left(\frac{2Re_{\unicode[STIX]{x1D70F}_{0}}\unicode[STIX]{x1D6FD}_{0}}{2Re_{\unicode[STIX]{x1D70F}_{0}}+1-\unicode[STIX]{x1D6FD}_{0}}\right)\langle \unicode[STIX]{x1D70F}_{w}\rangle & & \displaystyle\end{eqnarray}$$
accounts for the shear-thinning property of the FENE-P model (Housiadas & Beris Reference Housiadas and Beris2004). In this expression,
 $Re_{h,NEWT}$
is the bulk Reynolds number related to the corresponding Newtonian case (the Newtonian case at the same
 $Re_{\unicode[STIX]{x1D70F}_{0}}$
),
 ${<}\unicode[STIX]{x1D70F}_{w}>$
denotes the area-averaged wall shear stress and
 $n=1.14286$
is the exponent of the Dean correlation, which relates the bulk and friction Reynolds numbers for Newtonian turbulent channel flow (Dean Reference Dean1978). Time averaging of DNS data is taken in time over some 500 flow snapshots spanning several eddy turnover times, while spatial averaging (indicated by ‘
 $\langle \,\rangle$
’) is taken in the two homogeneous channel directions (
 $x$
,
 $y$
).
Two drag reducing regimes are shown in table 1: the high drag reduction (HDR;
 $DR>40\,\%$
) regime and the low drag reduction (LDR;
 $DR\leqslant 40\,\%$
) regime. Physically, the main difference between these two regimes consists in the fact that for LDR flows, the Reynolds stresses play a major role, whereas in the HDR regime, the near-wall dynamics of the flow is dominated by the polymer stresses (White & Mungal Reference White and Mungal2008).
The channel extent for the flow cases at
 $Re_{\unicode[STIX]{x1D70F}_{0}}$
up to of 590 was
 $Lx\times Ly\times Lz$
=
 $8\unicode[STIX]{x03C0}\times 1.5\unicode[STIX]{x03C0}\times 2.0$
. For the highest zero shear friction Reynolds number flow,
 $Lx\times Ly\times Lz$
=
 $6\unicode[STIX]{x03C0}\times 1.5\unicode[STIX]{x03C0}\times 2.0$
. The number of mesh points (
 $Nx\times Ny\times Nz$
) shown in table 1 for each case corresponds to a grid resolution of
 $8.8\leqslant \unicode[STIX]{x0394}x^{+}\leqslant 12.3$
,
 $5.4\leqslant \unicode[STIX]{x0394}y^{+}\leqslant 7.3$
, and
 $0.2\leqslant \unicode[STIX]{x0394}z^{+}\leqslant 12.1$
. The superscript ‘
 $+$
’ indicates normalization by the friction velocity, defined by
 $u_{\unicode[STIX]{x1D70F}}=\sqrt{\unicode[STIX]{x1D70F}_{w}/\unicode[STIX]{x1D70C}}$
, and the total kinematic zero shear rate viscosity. The Schmidt number
 $Sc_{c}=0.1$
was necessary to keep the algorithm stable and the conformation tensor symmetric positive definite.
3 Statistics of the flow
3.1 Time-averaged statistics
The distributions of the mean velocity in wall coordinates,
 $\langle \overline{U_{x}}^{+}\rangle$
, for turbulent channel flows of Newtonian and viscoelastic solutions are displayed in figure 1(a). The bar indicates the time average and ‘
 $\langle \,\rangle$
’ denotes the
 $x$
–
 $y$
plane average. The grey circles represent the Newtonian mean velocity profile at
 $Re_{\unicode[STIX]{x1D70F}_{0}}=180$
while the other symbols represent the viscoelastic flows. In the viscous sublayer (
 $0<z^{+}<5$
), where the total stress is predominantly associated with viscous effects, the mean velocities converge to the same linear shape
 $\langle \overline{U_{x}}^{+}\rangle =z^{+}$
represented by the solid grey line. As the wall distance increases, the Reynolds stress becomes important and comparable to the viscous stress within the Newtonian buffer layer (
 $5<z^{+}<30$
). Then, the Newtonian mean velocity departs quickly from the linear profile, taking on a logarithmic dependence on
 $z^{+}$
(grey dashed line) in the Newtonian log-law region,
 $z^{+}>30$
,
 $\langle \overline{U_{x}}^{+}\rangle =(1/\unicode[STIX]{x1D705})\ln (z^{+})+A_{1}$
where
 $\unicode[STIX]{x1D705}$
is commonly called the von Kármán coefficient (
 $1/\unicode[STIX]{x1D705}$
is the slope) and
 $A_{1}$
is the intercept at
 $z^{+}=1$
. For Newtonian channel flows over a hydraulically smooth wall,
 $\unicode[STIX]{x1D705}=0.4$
and
 $A_{1}=5.5$
(Kim, Moin & Moser Reference Kim, Moin and Moser1987). In order to better describe our results, we use the boundaries of the viscous sublayer, the buffer layer and the log-law Newtonian regions to define regions I, II and III, respectively. It is important to emphasize, however, that regions II and III do not necessarily represent the buffer layer and the log-law region for the viscoelastic cases, since the polymers can increase the former layer, reducing the latter.
Mean velocity profiles in the streamwise direction (a),
 $\langle \overline{U_{x}}^{+}\rangle$
, and normal components of the Reynolds stress (b–d) for Newtonian and viscoelastic channel flows, against the normalized wall distance.

The interactions between the viscoelastic fluid dynamics and the turbulent flow dynamics result in changes in the mean velocity profile relative to the Newtonian fluid. The polymer drag reduction phenomenon leads to an increased bulk mean velocity, as observed by comparing the viscoelastic profiles plotted in figure 1. When a high enough polymer concentration is used, the maximum level of drag reduction (MDR) is attained. In that state, the velocity profile is commonly represented by the Virk’s asymptote (Virk et al.
Reference Virk, Mickley and Smith1970),
 $\langle \overline{U_{x}}^{+}\rangle =11.7\ln (z^{+})+17.8$
which is a matter of recent controversy (White, Dubief, & Klewicki Reference White, Dubief and Klewicki2012). Experimental and recent numerical results based on DNS (Escudier, Presti & Smith Reference Escudier, Presti and Smith1999; Ptasinski et al.
Reference Ptasinski, Nieuwstadt, Van den Brule and Hulsen2001; Escudier, Nickson, & Poole Reference Escudier, Nickson and Poole2009; Thais et al.
Reference Thais, Gatski and Mompean2012) indicate a parallel upward shift of the logarithmic region of the mean velocity profile with increasing DR, which is clearly perceived at high Reynolds numbers (see Thais et al.
Reference Thais, Gatski and Mompean2013). Such a behaviour suggests a significant extension of the buffer layer region into the channel caused by the polymers. For viscoelastic fluids, the cross-over to a presumed Newtonian plug flow occurs at a distance from the wall where the Reynolds stress momentum flux is no longer negligible compared to that of the polymer/viscous stress. Figure 1(b–d) show the normal components of the Reynolds stress tensor, whose components are defined as the time average of the velocity fluctuation product (
 $\overline{{u^{\prime }}_{i}{u^{\prime }}_{j}}^{+}$
). The mean effect of the polymer on the turbulence is anisotropic and induces an increase in the streamwise normal Reynolds stress component (figure 1
b), while weakening both the spanwise (figure 1
c) and the wall-normal (figure 1
d) terms, as experimentally found by many researchers such as Pinho & Whitelaw (Reference Pinho and Whitelaw1990), Warholic, Massah & Hanratty (Reference Warholic, Massah and Hanratty1999) and White, Somandepalli & Mungal (Reference White, Somandepalli and Mungal2004). This effect is more pronounced as the elasticity increases, as indicated by the solid black arrows. In the most elastic flow at
 $Re_{\unicode[STIX]{x1D70F}_{0}}=180$
(orange inverted triangles), for instance, the peak of
 $\langle \overline{{u^{\prime }}_{x}{u^{\prime }}_{x}}^{+}\rangle$
moves from
 $z^{+}\approx 12$
(region II) to
 $z^{+}\approx 32$
and its value is one order of magnitude greater than the Newtonian one (grey open circles). In addition, the other components also shift away from the wall, but their peaks decrease by one order of magnitude compared to the Newtonian flow. Since vortices produce significant transverse fluctuations, the reduction of both
 ${u^{\prime }}_{y}$
and
 ${u^{\prime }}_{z}$
suggests a strong interaction between these intermittent structures and polymers (Dubief et al.
Reference Dubief, White, Terrapon, Shaqfeh, Moin and Lele2004). Lastly, the dashed arrows indicate that the normal Reynolds stress components are an increasing function of
 $Re_{\unicode[STIX]{x1D70F}_{0}}$
. Their peaks move towards the channel centre with increasing Reynolds number.
(a) Evolution of the mean relative polymer extension,
 $\langle \text{tr}(\overline{\unicode[STIX]{x1D63E}})/L^{2}\rangle$
, against the normalized wall distance. (b) Effects of mean shear stress profile on polymer extension.

The variations in polymer mean stresses across the channel can be highlighted by analysing the polymer mean stretch, which is linked with the former by the Peterlin function (2.3). The distribution of the relative polymer mean stretch
 $\langle \text{tr}(\overline{\unicode[STIX]{x1D63E}})/L^{2}\rangle$
as a function of
 $z^{+}$
is displayed in figure 2(a), for all viscoelastic cases studied in the present paper. As a common point, the polymer molecules exhibit a significant extension at the wall, which increases in the buffer layer, where its peak is attained. This peak magnitude, as well as its location, is a decreasing function of
 $L$
, but increases with increasing
 $Wi_{\unicode[STIX]{x1D70F}_{0}}$
(these trends are discussed in § 4.1). As the wall distance increases further,
 $\langle \text{tr}(\overline{\unicode[STIX]{x1D63E}})/L^{2}\rangle$
becomes less pronounced until achieving its minimum level at
 $z^{+}=180$
. A very simple method to clarify the polymer stretching mechanism consists in solving (2.4) using different mean velocity profiles. The result is illustrated in figure 2(b), where the less elastic flow is considered (grey open circles), as well as the polymer extension produced in this fluid by a turbulent-channel-like velocity profile
 $\overline{U_{x}}=(9/8)[1-(z/h)^{8}]$
(Dallas et al.
Reference Dallas, Vassilicos and Hewitt2010). As the derivative of the mean velocity with respect to the wall-normal direction increases, the polymers stretch considerably, due to the increase of the shear stress. More specifically, the profile of
 $\langle \text{tr}(\overline{\unicode[STIX]{x1D63E}})/L^{2}\rangle$
follows the mean viscous shear stress feature. Comparing the relative polymer extensions obtained from a turbulent-like mean velocity profile (orange inverted triangles) and DNS results (grey open circles), it is interesting to observe that both curves depart from the same level (
 ${\approx}0.54$
), at
 $z^{+}=0$
. However, as the wall distance increases, the discrepancy between them becomes pronounced. In fact, near the wall, the increasing
 $\langle \text{tr}(\overline{\unicode[STIX]{x1D63E}})/L^{2}\rangle$
noticed for the grey circles curve suggests that in this region there is a particular flow topology capable of producing an increase in the polymer extension beyond the viscous mean shear level represented by the orange inverted triangles. In other words, the viscous mean stress is responsible for a relevant polymer stretching, which is incremented since the turbulent structures interact with the polymer molecules, providing a supplementary polymer extension. We believe these intermittent polymer–turbulence interactions are also responsible for the polymer coil–stretch process, which will be analysed in later subsections from statistical and tensorial perspectives.
All the trends discussed above considering
 $Re_{\unicode[STIX]{x1D70F}_{0}}=180$
are also observed at higher zero shear friction Reynolds numbers, as previously reported by Thais et al. (Reference Thais, Gatski and Mompean2012) and Thais et al. (Reference Thais, Gatski and Mompean2013).
4 Polymer stretching and alignment
In order to analyse the effects of instantaneous polymer stretching on the flow, the following data and results were evaluated at the same instant of simulation, after a statistical steady state was achieved. Such an instantaneous analysis is justified by the fact that in turbulent flows, the polymer action is likely to be as intermittent as the near-wall vortices (see Dubief et al. Reference Dubief, White, Terrapon, Shaqfeh, Moin and Lele2004). Hence, these intermittent events may be hidden by a time-averaging procedure. In other words, such an analysis of the instantaneous quantities could reveal less expressive but important events for the DR phenomenon.
The three-dimensional structures represent isosurfaces of vortical regions defined as a positive value of the second invariant of velocity gradient tensor,
 $\unicode[STIX]{x1D735}\boldsymbol{u}$
. The colours indicate the polymer stretching,
 $\text{tr}(\unicode[STIX]{x1D63E})/L^{2}$
.

Although in this subsection we analyse the effects of the elasticity on the stretching and alignment of the polymers at a low zero shear friction Reynolds number,
 $Re_{\unicode[STIX]{x1D70F}_{0}}=180$
, it is important to emphasize that the trends shown below are observed for all viscoelastic cases studied. In other words, the physical aspects of DR discussed here are not affected by low Reynolds number effects.
4.1 Polymer stretching
The three-dimensional structures shown in figure 3 represent the isosurfaces of the vortical regions, defined as the positive second invariant of the velocity gradient tensor,
 $\unicode[STIX]{x1D735}\boldsymbol{u}$
, in Newtonian (a) and viscoelastic (b–e) flows. For incompressible flows, the second invariant of
 $\unicode[STIX]{x1D735}\boldsymbol{u}$
,
 $Q$
, can be used to identify vortical structures, the so-called
 $Q$
-criterion (see Hunt et al.
Reference Hunt, Wray and Moin1988), and simplified as
 $$\begin{eqnarray}\displaystyle Q={\textstyle \frac{1}{2}}(\Vert \unicode[STIX]{x1D652}\Vert ^{2}-\Vert \unicode[STIX]{x1D63F}\Vert ^{2})>0, & & \displaystyle\end{eqnarray}$$
which indicates the spatial regions where the Euclidean norm of the rate-of-rotation tensor,
 $\Vert \unicode[STIX]{x1D652}\Vert$
, dominates that of the rate of strain,
 $\Vert \unicode[STIX]{x1D63F}\Vert$
(the Euclidean norm of a generic second-order tensor
 $\unicode[STIX]{x1D63C}$
is
 $\Vert \unicode[STIX]{x1D63C}\Vert =\sqrt{\text{tr}(\unicode[STIX]{x1D63C}\boldsymbol{\cdot }\unicode[STIX]{x1D63C}^{\unicode[STIX]{x1D64F}})}$
). These structures follow an organized hierarchy across the channel. In the vicinity of the wall (
 $z^{+}<20$
), eddies are found to be pairs of counter-rotating quasi-streamwise vortices, while for
 $z^{+}>30$
, these eddies resemble hairpins (the so-called horseshoe vortices). The formation of such morphologies is induced by combined second-quadrant ejection (
 $u_{x}^{\prime }<0,u_{z}^{\prime }>0$
; Q2 event) and fourth-quadrant sweep (
 $u_{x}^{\prime }>0,u_{z}^{\prime }<0$
; Q4 event) events within the flow (see Adrian Reference Adrian2007). Specifically, the hairpin vortices are composed of three well defined parts. The legs are regions of rotation quasi-aligned with the streamwise direction. The head is a rotation part aligned with the spanwise direction. The necks are the connections between the legs and the head of the hairpin. These three parts, as well as the velocity fluctuations associated with them, can be seen in detail in figure 4, where a typical hairpin extracted from our less elastic flow (
 $Re_{\unicode[STIX]{x1D70F}_{0}}=180$
,
 $Wi_{\unicode[STIX]{x1D70F}_{0}}=50$
and
 $L=30$
) is coloured by the
 $Q$
events.
Typical hairpin extracted from a viscoelastic flow (
 $Re_{\unicode[STIX]{x1D70F}_{0}}=180$
;
 $Wi_{\unicode[STIX]{x1D70F}_{0}}=50$
;
 $L=30$
) with
 $Q=0.7$
and coloured by the Q1 (
 $u_{x}^{\prime }>0,u_{z}^{\prime }>0$
), Q2 (
 $u_{x}^{\prime }<0,u_{z}^{\prime }>0$
), Q3 (
 $u_{x}^{\prime }<0,u_{z}^{\prime }<0$
) and Q4 (
 $u_{x}^{\prime }>0,u_{z}^{\prime }<0$
) events.

Comparing figure 3(a–e), it can be seen that the number of vortices with a value of the
 $Q$
-criterion equal to 0.7 decreases with increasing elasticity (
 $We$
and
 $L$
). For
 $Wi_{\unicode[STIX]{x1D70F}_{0}}=115$
and
 $L=100$
, which provides
 $DR=62.3\,\%$
, the vortices with
 $Q=0.7$
are completely gone and the vortices with
 $Q=0.1$
(figure 3
e) are only found close to the walls. In viscoelastic flows, the vortical structures are significantly weaker than in the Newtonian flow, which is considered fundamental evidence of the polymer–turbulence interactions and the consequent drag reduction (Terrapon et al.
Reference Terrapon, Dubief, Moin, Shaqfeh and Lele2004; Kim et al.
Reference Kim, Li, Sureshkumar, Balachandar and Adrian2007, Reference Kim, Adrian, Balachandar and Sureshkumar2008; White & Mungal Reference White and Mungal2008). As the elasticity increases, some characteristics of the vortices change: their thicknesses and streamwise lengths increase, while their strengths weaken, which is clearly observed by comparing figure 3(a,e). Furthermore, the vortices become more parallel to the wall. In the log-law region, the hairpin head is strongly weakened. It has been experimentally and numerically shown that in drag reducing flows, the streamwise component of the Reynolds normal stresses increases relative to the Newtonian case, while the other components of the Reynolds stress tensors decrease (Wei & Willmarth Reference Wei and Willmarth1992; Warholic et al.
Reference Warholic, Massah and Hanratty1999; Ptasinski et al.
Reference Ptasinski, Nieuwstadt, Van den Brule and Hulsen2001; Kim et al.
Reference Kim, Li, Sureshkumar, Balachandar and Adrian2007; Thais et al.
Reference Thais, Gatski and Mompean2012). These variations seem to be closely connected with the coil–stretch polymer transition and the consequent vortex structural changes (Dimitropoulos et al.
Reference Dimitropoulos, Dubief, Shaqfeh, Moin and Lele2005). The colours in figure 3(b–e) indicate the relative polymer stretch,
 $\text{tr}(\unicode[STIX]{x1D63E})/L^{2}$
. The
 $y$
–
 $z$
planes show that for all four viscoelastic flows, the polymers are more stretched close to the wall (yellow and red regions). In contrast, the polymer extensions are less pronounced in the middle of the channel (blue regions). The isosurface colours and those of the intersections between vortical structures and
 $y$
–
 $z$
planes show that the polymers are more extended around the near-wall vortices.
Normalized conformation tensor as a function of the normalized wall distance. Streamwise normal components of
 $\unicode[STIX]{x1D63E}$
and
 $\text{tr}(\unicode[STIX]{x1D63E})/L^{2}$
(open and solid in a, respectively). Spanwise normal component of
 $\unicode[STIX]{x1D63E}$
(b). Wall-normal component of
 $\unicode[STIX]{x1D63E}$
(c). Cross-components (d).

The stretching of the polymers can be seen more clearly in figure 5(a), where the evolution of the
 $x$
–
 $y$
-plane-averaged normalized trace of the instantaneous conformation tensor,
 $\langle \text{tr}(\unicode[STIX]{x1D63E})/L^{2}\rangle$
, is plotted against the wall distance
 $z^{+}$
(solid symbols) together with the normalized streamwise normal component of the conformation tensor,
 $\langle C_{xx}/L^{2}\rangle$
(open symbols). The percentage of polymer extension,
 $\langle \text{tr}(\unicode[STIX]{x1D63E})/L^{2}\rangle$
, is relatively high at the wall, achieving a peak in the very near-wall region (
 $z^{+}<20$
), the exact location of which varies with
 $L$
and
 $Wi_{\unicode[STIX]{x1D70F}_{0}}$
. This peak is commonly associated with the streamwise vortices (see Dubief et al.
Reference Dubief, White, Terrapon, Shaqfeh, Moin and Lele2004; Dimitropoulos et al.
Reference Dimitropoulos, Dubief, Shaqfeh, Moin and Lele2005; Dallas et al.
Reference Dallas, Vassilicos and Hewitt2010). After this point,
 $\langle \text{tr}(\unicode[STIX]{x1D63E})/L^{2}\rangle$
starts to decrease, until reaching its minimum at the channel centre. In comparing the grey solid circles with the red solid diamonds, or the blue solid triangles with the green solid squares, it can be clearly seen that
 $\langle \text{tr}(\unicode[STIX]{x1D63E})/L^{2}\rangle$
decreases with increasing
 $L$
, for fixed
 $Re_{\unicode[STIX]{x1D70F}_{0}}$
and
 $Wi_{\unicode[STIX]{x1D70F}_{0}}$
, which suggests that the large polymer molecules could be less susceptible to chain scission degradation (Pereira & Soares Reference Pereira and Soares2012). A further comparison of the grey solid circles with the blue solid triangles, or of the red solid diamonds with the green solid squares, reveals that the relative polymer extension becomes greater as the friction Weissenberg number increases, since higher values of the polymer time scale induce the polymer molecules to be influenced by a wider spectrum of time scales of the flow (Dallas et al.
Reference Dallas, Vassilicos and Hewitt2010). Figure 5(a) also shows that the dominant contribution to the trace of the conformation tensor comes from
 $C_{xx}$
, i.e.
 $\langle \text{tr}(\unicode[STIX]{x1D63E})/L^{2}\rangle \approx \langle C_{xx}/L^{2}\rangle$
(especially near the wall and for the highest value of
 $L$
,
 $L=100$
). This distribution suggests a significant stretching of the polymers in the streamwise direction. The other component with a non-zero wall value is the off-diagonal component
 $C_{xz}$
, normalized and displayed in figure 5(d). However, its value at the wall is almost two orders of magnitude smaller than that of the
 $C_{xx}$
component. Moreover, as
 $Wi_{\unicode[STIX]{x1D70F}_{0}}$
and
 $L$
increase, the profile of
 $\langle C_{xz}/L^{2}\rangle$
follows the same tendencies noted in figure 5(a), reaching its peaks at
 $z^{+}$
not much different from those observed for
 $C_{xx}$
. The peak magnitude of the off-diagonal component
 $C_{xz}$
is comparable to that of the
 $C_{zz}$
component (plotted in figure 5
b), although both are only slightly smaller than the peak magnitude of the
 $C_{yy}$
component (shown in figure 5
c). It is worth noting that
 $\langle C_{xz}/L^{2}\rangle$
is an increasing function of the molecular relaxation time (the variations of which are here computed by changing
 $Wi_{\unicode[STIX]{x1D70F}_{0}}$
at fixed
 $Re_{\unicode[STIX]{x1D70F}_{0}}$
) although a saturation effect is observed when increasing the elasticity (the red diamonds and green square curves are close). This saturation effect is also seen for
 $C_{zz}$
(figure 5
b) and
 $C_{yy}$
(figure 5
c). The peak magnitude of the normal components
 $C_{zz}$
and
 $C_{yy}$
are both one order of magnitude smaller than that of the
 $C_{xx}$
component, starting with a zero wall value. Lastly, as
 $Wi_{\unicode[STIX]{x1D70F}_{0}}$
increases,
 $C_{zz}$
and
 $C_{yy}$
increase. The opposite behaviour is observed with increasing
 $L$
. These two normal components exhibit maximum values within region III (
 $60<z^{+}<90$
), as previously reported by Thais et al. (Reference Thais, Gatski and Mompean2012), which is currently linked to the straining flows around the vortices (Dubief et al.
Reference Dubief, White, Terrapon, Shaqfeh, Moin and Lele2004; Dimitropoulos et al.
Reference Dimitropoulos, Dubief, Shaqfeh, Moin and Lele2005).
In figure 5, it is worth noting that
 $C_{xx}\gg C_{yy}>C_{zz}\approx C_{xz}$
indicates a strong anisotropic behaviour of the conformation tensor. This anisotropy seems to dramatically influence the statistics of the fluctuating velocity fields, especially at small scales. The analysis of the trace of the conformation tensor reveals two locations of interest that will be systematically explored in this paper:
 $z^{+}=8.2$
, the approximate position where
 $\langle \text{tr}(\unicode[STIX]{x1D63E})/L^{2}\rangle$
is a maximum;
 $z^{+}=180$
, where the trace of the conformation tensor reaches its minimum value with respect to
 $L^{2}$
.
4.2 Polymer alignment
Figure 6 shows the average values in the
 $x$
–
 $y$
plane of the cosines of the angles
 $\unicode[STIX]{x1D6F9}$
between the first principal direction,
 $e_{1}$
, of our three relevant tensor entities (the eigenvector related to the largest eigenvalue) and the three unit vectors
 $e_{x}$
(streamwise; figure 6
a),
 $e_{y}$
(spanwise; figure 6
b) and
 $e_{z}$
(wall normal; figure 6
c) against the normalized wall distance, for the Newtonian case.
The alignment between the first principal direction of the velocity fluctuation product tensor,
 $\unicode[STIX]{x1D749}^{\prime }$
(whose components are defined by
 $u_{i}^{\prime }u_{j}^{\prime }$
), and
 $e_{x}$
, indicated in figure 6(a) by the blue open triangles, is accentuated near the wall, growing within the buffer layer, where
 $\langle \cos \unicode[STIX]{x1D6F9}(e_{1}^{\unicode[STIX]{x1D749}^{\prime }},e_{x})\rangle$
achieves its peak magnitude (
 ${\approx}0.85$
) at
 $z^{+}\approx 8.2$
. This is consistent with the fact that
 $u_{x}^{\prime }u_{x}^{\prime }$
is the most important component of
 $\unicode[STIX]{x1D749}^{\prime }$
in the near-wall region. However, as the wall distance increases,
 $u_{y}^{\prime }u_{y}^{\prime }$
,
 $u_{z}^{\prime }u_{z}^{\prime }$
and
 $u_{x}^{\prime }u_{z}^{\prime }$
become important while
 $u_{x}^{\prime }u_{x}^{\prime }$
decreases, considerably reducing
 $\langle \cos \unicode[STIX]{x1D6F9}(e_{1}^{\unicode[STIX]{x1D749}^{\prime }},e_{x})\rangle$
in the middle of the channel (
 ${\approx}$
0.57). A different behaviour is observed by analysing the angles between
 $e_{1}^{\unicode[STIX]{x1D749}^{\prime }}$
and both the spanwise and wall-normal directions as functions of
 $z^{+}$
, as shown in figures 6(b) and 6(c), respectively. Firstly, at the wall,
 $\langle \cos \unicode[STIX]{x1D6F9}(e_{1}^{\unicode[STIX]{x1D749}^{\prime }},e_{y})\rangle \approx 0.48$
while
 $\langle \cos \unicode[STIX]{x1D6F9}(e_{1}^{\unicode[STIX]{x1D749}^{\prime }},e_{z})\rangle =0$
. Although an increase in
 $\langle \cos \unicode[STIX]{x1D6F9}(e_{1}^{\unicode[STIX]{x1D749}^{\prime }},e_{z})\rangle$
with
 $z^{+}$
is noted, the buffer layer favours the alignment between
 $\unicode[STIX]{x1D749}^{\prime }$
and the streamwise direction. Consequently,
 $\langle \cos \unicode[STIX]{x1D6F9}(e_{1}^{\unicode[STIX]{x1D749}^{\prime }},e_{y})\rangle$
decreases, reaching a minimum value of
 $0.37$
at
 $z^{+}\approx 15$
. Lastly, in the middle of the channel, both
 $\langle \cos \unicode[STIX]{x1D6F9}(e_{1}^{\unicode[STIX]{x1D749}^{\prime }},e_{y})\rangle$
and
 $\langle \cos \unicode[STIX]{x1D6F9}(e_{1}^{\unicode[STIX]{x1D749}^{\prime }},e_{z})\rangle$
are approximately
 $0.5$
, indicating a random tendency of the alignment of
 $\unicode[STIX]{x1D749}^{\prime }$
with both the
 $y$
and
 $z$
directions.
The orientation of the rate-of-strain tensor presented in figure 6(a–c) exhibits an interesting behaviour as the wall distance increases. Since in the viscous sublayer the Reynolds stress tensor is negligible compared to the viscous stress tensor (Dubief et al.
Reference Dubief, White, Terrapon, Shaqfeh, Moin and Lele2004), the flow in this region is laminar and, consequently,
 $\langle \cos \unicode[STIX]{x1D6F9}(e_{1}^{\unicode[STIX]{x1D63F}},e_{x})\rangle \approx \sqrt{2}/2$
,
 $\langle \cos \unicode[STIX]{x1D6F9}(e_{1}^{\unicode[STIX]{x1D63F}},e_{y})\rangle \approx 0$
, and
 $\langle \cos \unicode[STIX]{x1D6F9}(e_{1}^{\unicode[STIX]{x1D63F}},e_{z})\rangle \approx \sqrt{2}/2$
. In contrast, in the log-law region, the flow is driven by the turbulence, and
 $\langle \cos \unicode[STIX]{x1D6F9}(e_{1}^{\unicode[STIX]{x1D63F}},e_{x})\rangle \approx \langle \cos \unicode[STIX]{x1D6F9}(e_{1}^{\unicode[STIX]{x1D63F}},e_{y})\rangle \approx \langle \cos \unicode[STIX]{x1D6F9}(e_{1}^{\unicode[STIX]{x1D63F}},e_{z})\rangle \approx 0.5$
, which emerges from a weak velocity gradient, of which the tendency of direction is not clear.
The green open squares in figure 6(a–c) show the orientation of the vorticity vector. Following the rate-of-strain tensor, beyond the buffer layer (
 $60<z^{+}<180$
), a chaotic alignment is perceived, since
 $\langle \cos \unicode[STIX]{x1D6F9}(\unicode[STIX]{x1D74E},e_{x})\rangle =\langle \cos \unicode[STIX]{x1D6F9}(\unicode[STIX]{x1D74E},e_{y})\rangle =\langle \cos \unicode[STIX]{x1D6F9}(\unicode[STIX]{x1D74E},e_{z})\rangle \approx 0.5$
. However, close to the wall (
 $z^{+}<20$
), the vorticity vector tends to be strongly aligned with the spanwise direction.
Average values in the
 $x$
–
 $y$
plane of the cosines of the angles between the principal directions of a given tensor and the three unit vectors
 $e_{x}$
,
 $e_{y}$
and
 $e_{z}$
(which represent the streamwise, spanwise and wall-normal directions) against the normalized wall distance.

Average values in the
 $x$
–
 $y$
plane of the cosines of the angles between the principal directions of a given tensor and the three unit vectors
 $e_{x}$
,
 $e_{y}$
and
 $e_{z}$
against the normalized wall distance.

Average values in the
 $x$
–
 $y$
plane of the cosines of the angles between the principal directions of a given tensor and the three unit vectors
 $e_{x}$
,
 $e_{y}$
and
 $e_{z}$
, against the normalized wall distance.

Following the method described above, the effects of a polymer on the average orientation of our three relevant tensor entities are plotted against the wall distance in figures 7 and 8 for two drag reduction regimes: the less elastic (
 $DR=28.5\,\%$
,
 $Wi_{\unicode[STIX]{x1D70F}_{0}}=50$
and
 $L=30$
) and the most elastic (
 $DR=62.3\,\%$
,
 $Wi_{\unicode[STIX]{x1D70F}_{0}}=115$
and
 $L=100$
). In this subsection, we use the acronyms LDR and HDR to refer to these two cases. The orientation of the conformation tensor is also considered.
The polymer alignment in the LDR case is shown in figure 7(a–c). The grey open symbols indicate that in the viscous sublayer, the conformation tensor is well oriented along the streamwise direction. This preferential alignment between
 $e_{1}^{\unicode[STIX]{x1D63E}}$
and
 $e_{x}$
is maintained within the buffer layer. However, it weakens as
 $\langle \cos \unicode[STIX]{x1D6F9}(e_{1}^{\unicode[STIX]{x1D63E}},e_{y})\rangle$
and
 $\langle \cos \unicode[STIX]{x1D6F9}(e_{1}^{\unicode[STIX]{x1D63E}},e_{z})\rangle$
increase from
 $z^{+}=30$
to
 $z^{+}=180$
, at which point both profiles reach a peak (
 ${\approx}0.4$
) and
 $\langle \cos \unicode[STIX]{x1D6F9}(e_{1}^{\unicode[STIX]{x1D63E}},e_{x})\rangle$
exhibits its minimum value (
 ${\approx}0.6$
). Nevertheless, it is worth noting that even in the LDR middle region, where the Reynolds stresses are more pronounced, a slight preferential orientation of
 $\unicode[STIX]{x1D63E}$
with
 $e_{x}$
is observed. A comparison of figures 7 and 8 reveals that
 $\cos \unicode[STIX]{x1D6F9}(e_{1}^{\unicode[STIX]{x1D63E}},e_{x})$
is an increasing function of the elasticity. In the HDR case, the angle between
 $e_{1}^{\unicode[STIX]{x1D63E}}$
and
 $e_{x}$
is approximately zero for all
 $z^{+}$
, indicating that the polymers are strongly aligned with the streamwise direction throughout the whole channel.
The alignment between the first principal direction of
 $\unicode[STIX]{x1D749}^{\prime }$
and
 $e_{x}$
for the LDR case displayed in figure 7(a) is accentuated at the wall (
 ${\approx}0.85$
), where
 $\langle \cos \unicode[STIX]{x1D6F9}(e_{1}^{\unicode[STIX]{x1D749}^{\prime }},e_{x})\rangle$
is approximately
 $6\,\%$
greater than that of the Newtonian case. In addition, the peak magnitude of
 $\langle \cos \unicode[STIX]{x1D6F9}(e_{1}^{\unicode[STIX]{x1D749}^{\prime }},e_{x})\rangle$
, which is located in the buffer layer (
 $z^{+}\approx 8.2$
), is also
 $6\,\%$
larger than for the Newtonian flow. As the wall distance increases, the alignment between
 $e_{1}^{\unicode[STIX]{x1D749}^{\prime }}$
and
 $e_{x}$
decreases, achieving its minimum value (
 $\langle \cos \unicode[STIX]{x1D6F9}(e_{1}^{\unicode[STIX]{x1D749}^{\prime }},e_{x})\rangle \approx 0.6$
) at the middle of the channel. Analysing the angles between
 $e_{1}^{\unicode[STIX]{x1D749}^{\prime }}$
and both spanwise and wall-normal directions, we initially note that at the wall,
 $\langle \cos \unicode[STIX]{x1D6F9}(e_{1}^{\unicode[STIX]{x1D749}^{\prime }},e_{y})\rangle \approx 0.35$
and
 $\langle \cos \unicode[STIX]{x1D6F9}(e_{1}^{\unicode[STIX]{x1D749}^{\prime }},e_{z})\rangle =0$
. The increasing fluctuation in the streamwise velocity in the buffer layer favours the alignment between
 $\unicode[STIX]{x1D749}^{\prime }$
and
 $e_{x}$
, which reduces
 $\langle \cos \unicode[STIX]{x1D6F9}(e_{1}^{\unicode[STIX]{x1D749}^{\prime }},e_{y})\rangle$
to its minimum value (
 ${\approx}0.3$
) at
 $z^{+}\approx 15$
. After this point, similar to the Newtonian behaviour,
 $\langle \cos \unicode[STIX]{x1D6F9}(e_{1}^{\unicode[STIX]{x1D749}^{\prime }},e_{y})\rangle$
and
 $\langle \cos \unicode[STIX]{x1D6F9}(e_{1}^{\unicode[STIX]{x1D749}^{\prime }},e_{z})\rangle$
increase, reaching their peak magnitude (
 ${\approx}0.45$
) at the middle of the channel. Since, at this location,
 $\langle \cos \unicode[STIX]{x1D6F9}(e_{1}^{\unicode[STIX]{x1D749}^{\prime }},e_{x})\rangle \approx 0.6$
, we can conclude that the addition of a polymer reduces the initial random tendency of the orientation of
 $\unicode[STIX]{x1D749}^{\prime }$
observed for the Newtonian flow. This polymer effect is more clearly perceived in figure 8(a–c). In the HDR case,
 $\langle \cos \unicode[STIX]{x1D6F9}(e_{1}^{\unicode[STIX]{x1D749}^{\prime }},e_{x})\rangle$
changes from
 $0.96$
, at the wall, to the maximum value of
 $0.98$
within the region II. In contrast,
 $\langle \cos \unicode[STIX]{x1D6F9}(e_{1}^{\unicode[STIX]{x1D749}^{\prime }},e_{x})\rangle$
decreases across the region III, reaching its minimum value (
 ${\approx}0.85$
) at
 $z^{+}=180$
. Additionally,
 $\langle \cos \unicode[STIX]{x1D6F9}(e_{1}^{\unicode[STIX]{x1D749}^{\prime }},e_{y})\rangle$
changes from
 $0.12$
, at
 $z^{+}=0$
, to
 $0.1$
, in the region II, after which it starts to increase, achieving its peak magnitude (
 ${\approx}0.26$
) at
 $z+=180$
. Moreover,
 $\langle \cos \unicode[STIX]{x1D6F9}(e_{1}^{\unicode[STIX]{x1D749}^{\prime }},e_{z})\rangle$
smoothly increases from zero to
 $0.22$
across one half of the channel. Lastly, it is important to note that in the HDR case,
 $\langle \cos \unicode[STIX]{x1D6F9}(e_{1}^{\unicode[STIX]{x1D749}^{\prime }},e_{x})\rangle >0.85$
and
 $\langle \cos \unicode[STIX]{x1D6F9}(e_{1}^{\unicode[STIX]{x1D749}^{\prime }},e_{z})\rangle <\langle \cos \unicode[STIX]{x1D6F9}(e_{1}^{\unicode[STIX]{x1D749}^{\prime }},e_{y})\rangle <0.3$
for all
 $z^{+}$
. In other words, the addition of polymers induces a preferable alignment of
 $\unicode[STIX]{x1D749}^{\prime }$
with the streamwise direction in the whole channel.
The effects of a polymer on the orientation of the rate of strain in the LDR case are indicated by the red open diamonds in figure 7(a–c). In the viscous sublayer, a laminar characteristic eigenvector emerges. Consequently,
 $\langle \cos \unicode[STIX]{x1D6F9}(e_{1}^{\unicode[STIX]{x1D63F}},e_{x})\rangle =\langle \cos \unicode[STIX]{x1D6F9}(e_{1}^{\unicode[STIX]{x1D63F}},e_{z})\rangle \approx \sqrt{2}/2$
, and
 $\langle \cos \unicode[STIX]{x1D6F9}(e_{1}^{\unicode[STIX]{x1D63F}},e_{y})\rangle \approx 0$
. These typical orientations gradually change to random orientations at
 $z^{+}=180$
, which differs from the fast transition observed in the Newtonian case, for which a chaotic tendency of alignment is noted throughout the entire log-law region. In the HDR regime, the alignment is not random, as can be seen in figure 8(a–c). The angle between
 $e_{1}^{\unicode[STIX]{x1D63F}}$
and
 $e_{x}$
is equal to
 $45^{\circ }$
from the wall to
 $z^{+}=155$
. In addition,
 $\langle \cos \unicode[STIX]{x1D6F9}(e_{1}^{\unicode[STIX]{x1D63F}},e_{y})\rangle <0.5$
and
 $\langle \cos \unicode[STIX]{x1D6F9}(e_{1}^{\unicode[STIX]{x1D63F}},e_{z})\rangle >0.4$
for all
 $z^{+}$
. Such a behaviour is consistent with the fact that polymers weaken the normal components of
 $\unicode[STIX]{x1D63F}$
while no significant difference is perceived for its off-diagonal terms compared with the Newtonian case. Thus, polymers act in the flow by partially suppressing the turbulence, making the rate-of-strain tensor more laminar.
Figure 7(a–c) also shows the orientation of the vorticity vector in the LDR regime. The green open squares indicate that although the variations of
 $\langle \cos \unicode[STIX]{x1D6F9}(\unicode[STIX]{x1D74E},e_{\unicode[STIX]{x1D6FC}})\rangle$
across the half-channel are smoother than those for the Newtonian flow, there are similarities between both the LDR and the Newtonian cases, such as the preferable alignment of
 $\unicode[STIX]{x1D74E}$
with the
 $y$
direction in the region I, and the chaotic orientation of this vector within the region III. Nevertheless, the analysis of the alignment of the vorticity for the HDR flow displayed in figure 8(a–c) reveals that an increasing elasticity amplifies
 $\langle \cos \unicode[STIX]{x1D6F9}(\unicode[STIX]{x1D74E},e_{y})\rangle$
, which results from the fact that polymers weaken both
 $\langle \unicode[STIX]{x1D714}_{x}\rangle$
and
 $\langle \unicode[STIX]{x1D714}_{z}\rangle$
in the region III, but do not affect
 $\langle \unicode[STIX]{x1D714}_{y}\rangle$
.
Figures 6–8 bring out the complexity of the near-wall dynamics in a Newtonian turbulent flow and how much this region is affected by polymers. In the high drag reduction regime, polymer effects are perceived even far from the wall (
 $60<z+<180$
). The most evident polymer effects shown in these figures are the strong alignment of
 $\unicode[STIX]{x1D63E}$
and
 $\unicode[STIX]{x1D749}^{\prime }$
with
 $x$
, which increase with increasing elasticity. These preferable streamwise orientations indicate not only that the most significant turbulence–polymer energy exchanges should occur in the
 $x$
direction, but also that
 $\unicode[STIX]{x1D63E}$
and
 $\unicode[STIX]{x1D749}^{\prime }$
present an significant alignment between them, which can be linked with the coil–stretch process of the polymer. Thus, in order to clarify the role played by the three considered tensors in the polymer extension mechanism, it is convenient to compute their alignments with respect to the local conformation tensor (the eigenvectors of
 $\unicode[STIX]{x1D63E}$
are the local reference frames), as shown in figures 9 and 10 for the same LDR and HDR regimes previously analysed in this subsection.
Average values in the
 $x$
–
 $y$
plane of the cosines of the angles between the principal directions of the conformation tensor and other relevant entities.

The cosines of the angles between the eigenvectors of
 $\unicode[STIX]{x1D63E}$
and
 $e_{1}^{\unicode[STIX]{x1D749}^{\prime }}$
in the LDR case are displayed in figure 9. Following the blue open triangles in figure 9(a), we notice that
 $\langle \cos \unicode[STIX]{x1D6F9}(e_{1}^{\unicode[STIX]{x1D63E}},e_{1}^{\unicode[STIX]{x1D749}^{\prime }})\rangle$
departs from an accentuated value at the wall (
 ${\approx}0.85$
). Furthermore, the alignment between
 $e_{1}^{\unicode[STIX]{x1D63E}}$
and
 $e_{1}^{\unicode[STIX]{x1D749}^{\prime }}$
becomes more pronounced while moving across the viscous sublayer, achieving its peak magnitude (
 ${\approx}0.9$
) at
 $z^{+}=8.2$
, the exact same location as the maximum polymer extension (
 $\langle \text{tr}(\unicode[STIX]{x1D63E})/L^{2}\rangle \approx 0.8$
) observed in figure 5. This peak is maintained until
 $z^{+}\approx 12$
, from which point
 $\langle \cos \unicode[STIX]{x1D6F9}(e_{1}^{\unicode[STIX]{x1D63E}},e_{1}^{\unicode[STIX]{x1D749}^{\prime }})\rangle$
starts to decrease to its minimum value (
 ${\approx}0.58$
), located at the middle of the channel. In contrast,
 $\langle \cos \unicode[STIX]{x1D6F9}(e_{2}^{\unicode[STIX]{x1D63E}},e_{1}^{\unicode[STIX]{x1D749}^{\prime }})\rangle$
and
 $\langle \cos \unicode[STIX]{x1D6F9}(e_{3}^{\unicode[STIX]{x1D63E}},e_{1}^{\unicode[STIX]{x1D749}^{\prime }})\rangle$
exhibit opposite behaviours across the channel, as shown by the blue open triangles in figure 9(b,c), respectively. The former is small at the wall and, after reaching its minimum value (
 ${\approx}0.27$
) at
 $z^{+}=8.2$
, tends to
 $0.5$
. The latter is very close to zero in the viscous sublayer. However, it slightly increases as the wall distance increases, achieving a peak of
 $0.4$
at
 $z^{+}=180$
. In the HDR case, shown in figure 10(a–c),
 $\langle \cos \unicode[STIX]{x1D6F9}(e_{1}^{\unicode[STIX]{x1D63E}},e_{1}^{\unicode[STIX]{x1D749}^{\prime }})\rangle$
changes from
 $0.96$
, at the wall, to
 $0.98$
at
 $z^{+}\approx 10$
, which represents a peak magnitude
 $9\,\%$
greater than that of the LDR case. This value is sustained until
 $z^{+}\approx 15$
, from which point the alignment between
 $e_{1}^{\unicode[STIX]{x1D63E}}$
and
 $e_{1}^{\unicode[STIX]{x1D749}^{\prime }}$
gently decreases to its minimum value (
 ${\approx}0.85$
), situated at the centre of the channel. In the opposite sense, increasing elasticity decreases
 $\langle \cos \unicode[STIX]{x1D6F9}(e_{2}^{\unicode[STIX]{x1D63E}},e_{1}^{\unicode[STIX]{x1D749}^{\prime }})\rangle$
and
 $\langle \cos \unicode[STIX]{x1D6F9}(e_{3}^{\unicode[STIX]{x1D63E}},e_{1}^{\unicode[STIX]{x1D749}^{\prime }})\rangle$
. It is worth noting that the alignment between the first eigenvectors of
 $\unicode[STIX]{x1D63E}$
and
 $\unicode[STIX]{x1D749}^{\prime }$
is significant even at the middle of the channel, where
 $\langle \cos \unicode[STIX]{x1D6F9}(e_{1}^{\unicode[STIX]{x1D63E}},e_{1}^{\unicode[STIX]{x1D749}^{\prime }})\rangle$
is approximately
 $47\,\%$
greater than in the case of the LDR. This indicates that the interaction between
 $\unicode[STIX]{x1D63E}$
and
 $\unicode[STIX]{x1D749}^{\prime }$
is an increasing function of the elasticity, whose effects are perceptible not only near the wall, but also in the region III.
Average values in the
 $x$
–
 $y$
plane of the cosines of the principal directions of the conformation tensor and other relevant entities.

The open symbols show the normalized instantaneous streamwise work fluctuating terms against the normalized wall distance. The solid symbols in (c,d) show the profiles of
 $\langle \text{tr}(\unicode[STIX]{x1D63E})/L^{2}\rangle$
and
 $\langle \cos \unicode[STIX]{x1D6F9}(e_{1}^{\unicode[STIX]{x1D63E}},e_{1}^{\unicode[STIX]{x1D749}^{\prime }})\rangle$
across the channel half-width, respectively.
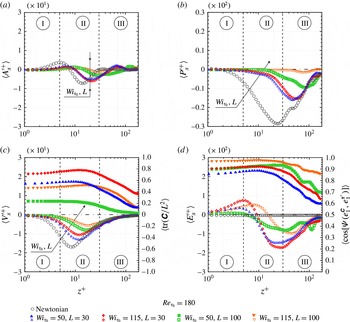
In the viscous sublayers of both the low and the high drag reduction regimes (figures 9 and 10, respectively), while
 $e_{2}^{\unicode[STIX]{x1D63E}}$
and
 $e_{1}^{\unicode[STIX]{x1D63F}}$
are almost orthogonal, there is an angle of
 ${\approx}45^{\circ }$
between
 $e_{3}^{\unicode[STIX]{x1D63E}}$
and
 $e_{1}^{\unicode[STIX]{x1D63F}}$
, as well as between
 $e_{1}^{\unicode[STIX]{x1D63E}}$
and
 $e_{1}^{\unicode[STIX]{x1D63F}}$
. Interestingly,
 $\unicode[STIX]{x1D6F9}(e_{1}^{\unicode[STIX]{x1D63E}},e_{1}^{\unicode[STIX]{x1D63F}})$
is maintained across the channel. In contrast, in the LDR scenario, both
 $\unicode[STIX]{x1D6F9}(e_{3}^{\unicode[STIX]{x1D63E}},e_{1}^{\unicode[STIX]{x1D63F}})$
and
 $\unicode[STIX]{x1D6F9}(e_{2}^{\unicode[STIX]{x1D63E}},e_{1}^{\unicode[STIX]{x1D63F}})$
become random as the wall distance increases. However, in the HDR regime, this tendency of chaotic alignment within the region III is attenuated, and, in consequence,
 $\langle \cos \unicode[STIX]{x1D6F9}(e_{3}^{\unicode[STIX]{x1D63E}},e_{1}^{\unicode[STIX]{x1D63F}})\rangle \approx 0.6$
and
 $\langle \cos \unicode[STIX]{x1D6F9}(e_{2}^{\unicode[STIX]{x1D63E}},e_{1}^{\unicode[STIX]{x1D63F}})\rangle \approx 0.25$
. Thus, as
 $Wi_{\unicode[STIX]{x1D70F}_{0}}$
and
 $L$
increase, the polymer becomes more exposed to the rate-of-strain tensor not only in regions I and II, but also in region III.
Near the wall, the polymer molecules exhibit a weak tendency to lie in the plane perpendicular to
 $\unicode[STIX]{x1D74E}$
since
 $\langle \cos \unicode[STIX]{x1D6F9}(e_{1}^{\unicode[STIX]{x1D63E}},\unicode[STIX]{x1D74E})\rangle$
and
 $\langle \cos \unicode[STIX]{x1D6F9}(e_{3}^{\unicode[STIX]{x1D63E}},\unicode[STIX]{x1D74E})\rangle$
are almost zero, as can be seen in figures 9 and 10. However, one can note that in this region,
 $\langle \cos \unicode[STIX]{x1D6F9}(e_{2}^{\unicode[STIX]{x1D63E}},\unicode[STIX]{x1D74E})\rangle \approx 1.0$
. This occurs because, near the wall,
 $e_{2}^{\unicode[STIX]{x1D63E}}$
is oriented along the
 $e_{y}$
direction (not shown here), as is
 $\unicode[STIX]{x1D74E}$
(see figures 7 and 8).
5 Polymer–turbulence energy transfer
5.1 Global exchanges of energy
As pointed out in previous subsections, near-wall polymers are highly aligned with
 $\unicode[STIX]{x1D749}^{\prime }$
and, consequently, strongly exposed to flow stress fluctuations. The latter are responsible for the generation of intermittent quasi-streamwise vortices, which play a very important role in the momentum exchange as well as in the increase of the turbulent friction drag (see Kravchenko, Choi & Moin Reference Kravchenko, Choi and Moin1993). Hence, our tensorial and statistical analyses suggest that polymers primarily interact with these intermittent structures, exchanging energy with them. Aiming to characterize such energy exchanges, we consider the work fluctuation terms. These energy terms are that exclusively related to the fluctuating fields which appear in the right-hand side of the work fluctuation equation, which in turn is obtained by decomposing the variables of the momentum equation into mean flow (
 $\overline{U}_{\unicode[STIX]{x1D6FC}}^{+}$
,
 $\overline{p}^{+}$
and
 $\overline{\unicode[STIX]{x1D6EF}}_{\unicode[STIX]{x1D6FC}j}^{+}$
) and fluctuations (
 ${u_{\unicode[STIX]{x1D6FC}}^{\prime }}^{+}$
,
 ${p^{\prime }}^{+}$
and
 ${\unicode[STIX]{x1D6EF}_{\unicode[STIX]{x1D6FC}j}^{\prime }}^{+}$
), and then multiplying the resulting equation by the streamwise velocity fluctuations (
 ${u_{\unicode[STIX]{x1D6FC}}^{\prime }}^{+}$
). A detailed deduction of the work equations is provided in appendix A. The work terms exclusively linked with the fluctuating fields are then:
 ${E_{\unicode[STIX]{x1D6FC}}^{\prime }}^{+}=({u_{\unicode[STIX]{x1D6FC}}^{\prime }}^{+}(\unicode[STIX]{x2202}{\unicode[STIX]{x1D6EF}_{\unicode[STIX]{x1D6FC}j}^{\prime }}^{+}/\unicode[STIX]{x2202}x_{j}^{+}))$
,
 ${A_{\unicode[STIX]{x1D6FC}}^{\prime }}^{+}=[{-u_{\unicode[STIX]{x1D6FC}}^{\prime }}^{+}(\unicode[STIX]{x2202}({u_{\unicode[STIX]{x1D6FC}}^{\prime }}^{+}{u_{j}^{\prime }}^{+})/\unicode[STIX]{x2202}x_{j}^{+})]$
,
 ${P_{\unicode[STIX]{x1D6FC}}^{\prime }}^{+}=({-u_{\unicode[STIX]{x1D6FC}}^{\prime }}^{+}(\unicode[STIX]{x2202}{p^{\prime }}^{+}/\unicode[STIX]{x2202}x^{+}))$
and
 ${V_{\unicode[STIX]{x1D6FC}}^{\prime }}^{+}=[(\unicode[STIX]{x1D6FD}_{0}){u_{\unicode[STIX]{x1D6FC}}^{\prime }}^{+}(\unicode[STIX]{x2202}^{2}{u_{\unicode[STIX]{x1D6FC}}^{\prime }}^{+}/\unicode[STIX]{x2202}{x_{j}^{+}}^{2})]$
. Since the turbulent energy exchanges in the
 $x$
direction constitute more than
 $90\,\%$
of that considering the streamwise, the spanwise and the wall-normal directions, we analyse here only the streamwise work fluctuation terms (
 $\unicode[STIX]{x1D6FC}=x$
). Hence, the instantaneous polymer work term,
 ${E_{x}^{\prime }}^{+}$
, indicates the amount of energy stored (
 ${E_{x}^{\prime }}^{+}<0$
) or released (
 ${E_{x}^{\prime }}^{+}>0$
) by the polymers from the fluctuating velocity field in the streamwise direction,
 ${u_{x}^{\prime }}^{+}$
(the fluctuations are denoted by the superscript ‘
 $\prime$
’). The supplementary fluctuating work terms denote the advection,
 ${A_{x}^{\prime }}^{+}$
, the pressure redistribution,
 ${P_{x}^{\prime }}^{+}$
, and the viscous stress,
 ${V_{x}^{\prime }}^{+}$
. The sum
 ${A_{x}^{\prime }}^{+}+{P_{x}^{\prime }}^{+}+{V_{x}^{\prime }}^{+}$
is referred to as the Newtonian fluctuating work,
 ${N_{x}^{\prime }}^{+}$
.
The open symbols show the normalized instantaneous streamwise work fluctuating terms against the normalized wall distance. The solid symbols in (c,d) show the profiles of
 $\langle \text{tr}(\unicode[STIX]{x1D63E})/L^{2}\rangle$
and
 $\langle \cos \unicode[STIX]{x1D6F9}(e_{1}^{\unicode[STIX]{x1D63E}},e_{1}^{\unicode[STIX]{x1D749}^{\prime }})\rangle$
across the channel half-width, respectively.

In figures 11 and 12, the
 $x$
–
 $y$
plane average of the instantaneous streamwise work fluctuating terms against the normalized wall distance are considered. In addition, both
 $\langle \text{tr}(\unicode[STIX]{x1D63E})/L^{2}\rangle$
and
 $\langle \cos \unicode[STIX]{x1D6F9}(e_{1}^{\unicode[STIX]{x1D63E}},e_{1}^{\unicode[STIX]{x1D749}^{\prime }})\rangle$
are plotted. These quantities are denoted by the solid symbols in figures 11(d) and 11(f), respectively. Different levels of elasticity are considered in figure 11 fixing the Reynolds number, while the effects of
 $Re_{\unicode[STIX]{x1D70F}_{0}}$
are shown in figure 12 maintaining
 $Wi_{\unicode[STIX]{x1D70F}_{0}}=115$
and
 $L=100$
. Our lowest Reynolds number case (
 $Re_{\unicode[STIX]{x1D70F}_{0}}=180$
) and the seven viscoelastic flows detailed in table 1 are considered.
Very close to the wall (I), where the turbulent stresses are negligible, the work fluctuation terms are close to zero. The streamwise viscous work fluctuation (figures 11
c and 12
c) and the streamwise polymer work fluctuation (figures 11
d and 12
d) exhibit a different behaviour in the vicinity of the wall. For the less elastic case (blue open triangles), the former decreases from the wall to
 $z^{+}\approx 10$
, where its minimum value is located. The latter, one order of magnitude smaller than
 $V_{x}^{\prime }$
, increases throughout the viscous sublayer, reaching its peak magnitude at
 $z^{+}\approx 5$
. It is worth noting that both the inflexion point of
 $\langle {E_{x}^{\prime }}^{+}\rangle$
and the minimum value of
 $\langle {V_{x}^{\prime }}^{+}\rangle$
are located at the same wall distance for each case analysed here. Additionally, the maximum values of
 $\langle \text{tr}(\unicode[STIX]{x1D63E})/L^{2}\rangle$
(solid symbols in figures 11
c and 12
c) and
 $\langle \cos \unicode[STIX]{x1D6F9}(e_{1}^{\unicode[STIX]{x1D63E}},e_{1}^{\unicode[STIX]{x1D749}^{\prime }})\rangle$
(solid symbols in figures 11
d and 12
d), quantities which develop parallel profiles, are observed at the same location (
 $z^{+}\approx 10$
for the less elastic case). Both the advection and pressure terms become less pronounced as elasticity increases, playing a less important role in the fluctuating energy budget under LDR flow conditions (figure 11). In the opposite trend, more significant values of
 $\langle {A_{x}^{\prime }}^{+}\rangle$
and
 $\langle {P_{x}^{\prime }}^{+}\rangle$
are observed at higher
 $Re_{\unicode[STIX]{x1D70F}_{0}}$
(figure 12).
The black arrows in figure 11 indicate that increasing elasticity makes
 $\langle {A_{x}^{\prime }}^{+}\rangle$
,
 $\langle {P_{x}^{\prime }}^{+}\rangle$
, and
 $\langle {V_{x}^{\prime }}^{+}\rangle$
close to zero. This effect of increasing elasticity is more pronounced in the viscous term and, consequently, in the Newtonian term (
 ${A_{x}^{\prime }}^{+}+{P_{x}^{\prime }}^{+}+{V_{x}^{\prime }}^{+}$
) of which the minimum value changes from
 $\langle {N_{x}^{\prime }}^{+}\rangle \approx 0.225$
for the Newtonian case to
 $\langle {N_{x}^{\prime }}^{+}\rangle \approx -0.07$
for the most elastic case (not shown). Furthermore, the minimum and the maximum values observed in figure 11 move away from the wall as
 $Wi_{\unicode[STIX]{x1D70F}_{0}}$
and
 $L$
increase. On the other hand, as indicated by the black arrows in figure 12, for a fixed elasticity, the magnitude of the energy budget terms increases with increasing Reynolds number.
Intermittent energy transfers may be hidden even by instantaneous spatial-averaging procedures. Further evidence regarding such energy transfers are provided by figure 13, which shows five different joint probability density functions (JPF) for the
 $x$
–
 $y$
planes related to the less elastic case and located at
 $z^{+}\approx 5.0$
, where
 $\langle {E_{x}^{\prime }}^{+}\rangle$
is a maximum, as well as that situated at
 $z^{+}\approx 50$
, where
 $\langle {E_{z}^{\prime }}^{+}\rangle$
is a minimum (not shown here). The black solid line represents the JPF of
 $E_{\unicode[STIX]{x1D6FC}}^{\prime }$
versus
 $u_{\unicode[STIX]{x1D6FC}}^{\prime }$
(where
 $\unicode[STIX]{x1D6FC}$
can denote either
 $x$
or
 $z$
), whereas the red solid line represents the JPF which considers the instantaneous streamwise polymer work fluctuation and the cosine of the angle between the first principal directions of
 $\unicode[STIX]{x1D63E}$
and
 $\unicode[STIX]{x1D749}^{\prime }$
. Similar JPFs are displayed in figure 14 for the Newtonian work fluctuation at the same
 $x$
–
 $y$
planes. The work fluctuation terms were normalized by their temporal root mean square spatially averaged over the corresponding
 $x$
–
 $y$
plane. In this figure, the most probable events are indicated by internal lines. Although only our less elastic fluid is treated in this figure, all the supplementary viscoelastic cases present qualitatively similar trends.
Joint probability density functions of instantaneous polymer work versus instantaneous velocity fluctuation for the
 $x$
–
 $y$
planes located at
 $z^{+}=5.0$
(a,b) and
 $z^{+}=50$
(c,d). Fluctuation terms are normalized by their temporal root mean square spatially averaged over the corresponding
 $x$
–
 $y$
plane.

Joint probability density functions of instantaneous Newtonian work versus instantaneous velocity fluctuation over the
 $x$
–
 $y$
planes located at
 $z^{+}=5.0$
(a,b) and
 $z^{+}=50$
(c,d). Fluctuation terms are normalized by their respective temporal root mean square spatially averaged over the corresponding
 $x$
–
 $y$
plane.

Firstly, with regard to figure 13(a), it is important to observe that the polymer molecules are allowed to coil (
 $E_{x}^{\prime }>0$
) and stretch (
 $E_{x}^{\prime }<0$
) within the near-wall region (
 $z^{+}\approx 5.0$
). At such a location, the polymer molecules are predominantly injecting energy into the flow (
 $E_{x}^{\prime }>0$
) and, as a consequence, increasing both the negative and the positive streamwise velocity fluctuations as well as the absolute value of
 $T_{x}^{\prime }$
(see figure 11). Moreover, this injection of energy is closely related (has a higher probability) to negative values of
 $u_{z}^{\prime }$
, as shown in figure 13(b). Interestingly, the red solid lines in figure 13(b) reveal that more pronounced polymer–turbulence exchanges of energy occur when the conformation tensor is predominantly oriented along the first principal direction of
 $\unicode[STIX]{x1D749}^{\prime }$
(
 $\cos \unicode[STIX]{x1D6F9}(e_{1}^{\unicode[STIX]{x1D63E}},e_{1}^{\unicode[STIX]{x1D749}^{\prime }})\approx 1$
), which reinforces the relevance of the alignment between
 $\unicode[STIX]{x1D63E}$
and
 $\unicode[STIX]{x1D749}^{\prime }$
for the polymer–turbulence exchange of energy.
Figure 13 also shows that at
 $z^{+}\approx 50$
, polymers primarily extract energy from the flow (
 $E_{z}^{\prime }<0$
), which preferentially occurs where
 $u_{x}^{\prime }<0$
(figure 13
c) and
 $u_{z}^{\prime }<0$
(figure 13
d). However, the suppression of ejection flows (
 $u_{x}^{\prime }<0$
and
 $u_{z}^{\prime }>0$
; Q2 region) is also a moderately likely event.
Comparing figures 13 and 14, it is interesting to note that in the very near-wall region,
 $E_{x}^{\prime }$
and
 $N_{x}^{\prime }$
tend to have opposite signs. Hence, at
 $z^{+}\approx 5$
, injection events are strongly related to
 $E_{x}^{\prime }>0$
and
 $N_{x}^{\prime }<0$
. Similarly, at
 $z^{+}\approx 50$
, the ejection and injection events are linked with
 $E_{z}^{\prime }<0$
and
 $N_{z}^{\prime }>0$
.
5.2 Elliptical and hyperbolic exchanges of energy
In order to better understand the polymer coil–stretch process from the energy perspective, we divide the flow into three different regions by using the
 $Q$
-criterion discussed in § 4.1. Instead of the usual approach, where a threshold is chosen to produce a Boolean picture of the flow, as in figure 3, for example, we adopt the
 $Q$
-criterion as a measure of the intensity of stretching/rotation activity, i.e. we plot the
 $Q$
field. To this end,
 $Q$
is normalized in order to produce values between 0 and 1 (Martins et al.
Reference Martins, Pereira, Mompean, Thais and Thompson2016) and thus takes the form
 $$\begin{eqnarray}\displaystyle Q_{norm}=\frac{1}{\unicode[STIX]{x03C0}}\cos ^{-1}\left(\frac{\Vert \unicode[STIX]{x1D652}\Vert ^{2}-\Vert \unicode[STIX]{x1D63F}\Vert ^{2}}{\Vert \unicode[STIX]{x1D652}\Vert ^{2}+\Vert \unicode[STIX]{x1D63F}\Vert ^{2}}\right). & & \displaystyle\end{eqnarray}$$
Normalized values
 $0\leqslant Q_{norm}<0.5$
represent swirling-like or elliptical regions, whereas
 $0.5<Q_{norm}\leqslant 1$
indicates a non-swirling-like or hyperbolic region. A value of
 $Q_{norm}=0.5$
represents transition surfaces where the magnitudes of
 $\unicode[STIX]{x1D652}$
and
 $\unicode[STIX]{x1D63F}$
are equal. This normalized vortex identification criterion was applied to the centre
 $x{-}z$
plane (at
 $y=0.75\unicode[STIX]{x03C0}$
) for all viscoelastic flows corresponding to
 $Re_{\unicode[STIX]{x1D70F}_{0}}=180$
, as shown in figure 15. The vortical regions (swirling-like) are shown in blue, while the extensional regions (non-swirling-like) are shown in red. Green indicates the transition regions, generally referred to as parabolic, where the intensities of the rotational and extensional motions are close to each other. The lines around vortical regions represent the intersections between the
 $x$
–
 $y$
plane and vortices with
 $Q=0.01$
(consequently, the lines surround the blue parts). These lines are black or white, which indicates polymer stretching (
 $E_{x}^{\prime }<0$
) or coiling (
 $E_{x}^{\prime }>0$
) in the streamwise direction, respectively.
Contour of normalized
 $Q$
-criterion,
 $Q_{norm}$
. The lines around vortical regions (blue and green regions) represent intersections between the
 $x$
–
 $y$
plane and vortices with
 $Q=0.01$
. These lines are black or white, which indicates polymer stretching or coiling, respectively.

Analysing figure 15, we first notice that both the vortical and extensional motion are weakened by increasing elasticity. Hence, green regions are more frequent in the HDR cases (c,d). Furthermore, the lines indicate that the morphology of the vortices changes with an increase of
 $Wi_{\unicode[STIX]{x1D70F}_{0}}$
and/or
 $L$
, since their thicknesses and streamwise lengths increase, while they become more parallel to the wall, something also seen in figure 3. Concerning the polymer–vortex interactions, it is apparent that the lines around the elliptical parts are predominantly black. Such a result reveals that polymers essentially stretch in such a region, extracting energy from the vortices. In addition, we note that far from the wall, polymers also store a significant amount of energy from the hyperbolic regions, which are mostly surrounded by black lines as well (not shown for clarity).
The extraction of energy from the elliptical and hyperbolic structures by the polymer is further explored in figure 16, where the contours of the normalized
 $Q$
-criterion were applied to the centre
 $y$
–
 $z$
plane (at
 $x=4.0\unicode[STIX]{x03C0}$
) for our less elastic case. The arrows in figure 16(a) indicate the direction and the sense of the vectors resulting from
 $u_{y}^{\prime }$
and
 $u_{z}^{\prime }$
, while those in figure 16(b) illustrate the direction and the sense of the vectors resulting from polymer force fluctuations (
 $f_{\unicode[STIX]{x1D6FC}}^{\prime }=E_{\unicode[STIX]{x1D6FC}}^{\prime }/u_{\unicode[STIX]{x1D6FC}}^{\prime }$
) in both the spanwise and wall-normal directions (the vector magnitudes are not considered in these figures). Comparing both of these figures, it is apparent that, fundamentally, the polymer forces oppose the vortical motion (blue regions) by imposing a counter-torque around such structures. However, it is important to stress that in the extensional structures (yellow and red regions) the polymer forces also oppose the fluctuating velocities. Similar results were obtained for the other case (not shown here).
Velocity (a) and polymer body force (b) fluctuation vectors on the
 $y$
–
 $z$
plane at
 $x=4.0\unicode[STIX]{x03C0}$
. Contours of the normalized
 $Q$
-criterion,
 $Q_{norm}$
, are also overlaid, with blue regions indicating large swirling strength and red regions representing large extensional deformations.

The energy exchanges between the polymers and turbulent structures are highlighted by the open symbols in figures 17 and 18, where the
 $x$
–
 $y$
plane average of the streamwise polymer work fluctuations (a) and the streamwise Newtonian work fluctuations (b) are plotted against the wall distance for both the elliptical (c,d) and the hyperbolic (e,f) regions, separately. Additionally, a similar analysis is displayed for
 $\langle \cos \unicode[STIX]{x1D6F9}(e_{1}^{\unicode[STIX]{x1D63E}},e_{1}^{\unicode[STIX]{x1D749}^{\prime }})\rangle$
plotted against
 $z^{+}$
(solid symbols in figures a,c,e).
The open symbols show the normalized streamwise polymer (a,c,e) and Newtonian (b,d,f) work fluctuations against the wall (
 $z^{+}$
) distance considering the whole channel (a,b) as well as the elliptical (c,d) and hyperbolic (e,f) regions, separately. The solid symbols in (a,c,e) show the profile of
 $\langle \cos \unicode[STIX]{x1D6F9}(e_{1}^{\unicode[STIX]{x1D63E}},e_{1}^{\unicode[STIX]{x1D749}^{\prime }})\rangle$
against the wall distance, in the same three domains.

The open symbols show the normalized streamwise polymer (a,c,e) and Newtonian (b,d,f) work fluctuations against the wall (
 $z^{+}$
) distance considering the whole channel (a,b) as well as the elliptical (c,d) and hyperbolic (e,f) regions, separately. The solid symbols in (a,c,e) show the profile of
 $\langle \cos \unicode[STIX]{x1D6F9}(e_{1}^{\unicode[STIX]{x1D63E}},e_{1}^{\unicode[STIX]{x1D749}^{\prime }})\rangle$
against the wall distance, in the same three domains.

Considering the whole channel evaluated in figures 17(a,b) and 18(a,b) it is found that polymers essentially release energy within the viscous sublayer, since
 $\langle {E_{x}^{\prime }}^{+}(z^{+}<5)\rangle >0$
. In contrast, after reaching its maximum value at
 $z^{+}\approx 5.0$
,
 $\langle {E_{x}^{\prime }}^{+}\rangle$
becomes negative and reaches expressive negative values in region II (
 $20\leqslant z^{+}\leqslant 30$
). Negative values of
 $\langle {E_{x}^{\prime }}^{+}\rangle$
are also observed within region III. Hence, the polymers store turbulent energy in both regions II and III (
 $E_{\unicode[STIX]{x1D6FC}}^{\prime }<0$
), and release it into the viscous sublayer (
 $E_{x}^{\prime }>0$
) by coiling along the streamwise direction, which increases the streamwise velocity fluctuations (see figure 1
b).
Inside the elliptical and hyperbolic structures, the streamwise polymer work fluctuation profiles follow the same trends as those described for the whole channel. Polymers release energy to elliptical (figures 17
c and 18
c) and hyperbolic (figures 17
e and 18
e) parts located in the near-wall region (I), which had been previously extracted from such structures in regions II and III. These results corroborate those shown in figure 15. On the other hand, in the wall-normal direction as well as in the spanwise direction (not shown here), the polymer molecules predominantly store turbulent energy from the elliptical and hyperbolic structures by stretching in region III, which reinforces our remarks concerning figure 16. It is important to emphasize that the polymer–turbulence exchanges of energy are more pronounced in hyperbolic regions, especially in the streamwise direction. Lastly, regarding
 $\langle \cos \unicode[STIX]{x1D6F9}(e_{1}^{\unicode[STIX]{x1D63E}},e_{1}^{\unicode[STIX]{x1D749}^{\prime }})\rangle$
(solid symbols), the more significant alignments between
 $\unicode[STIX]{x1D63E}$
and
 $\unicode[STIX]{x1D749}^{\prime }$
are situated in the hyperbolic regions (figures 17
e and 18
e). These alignments decrease monotonically from the viscous sublayer to the centre of the channel.
More significant elastic and inertial effects are observed for
 $\langle {N_{x}^{\prime }}^{+}\rangle$
(figures 17
b and 18
b), which is essentially negative along
 $z^{+}$
and reaches its minimum value in the region II (
 $z^{+}\approx 20$
). This term is one order of magnitude greater than
 $\langle {E_{x}^{\prime }}^{+}\rangle$
and becomes close to zero as
 $Wi_{\unicode[STIX]{x1D70F}_{0}}$
and
 $L$
increase, and
 $Re_{\unicode[STIX]{x1D70F}_{0}}$
decreases. Within the elliptical region (figures 17
d and 18
d), no positive values of
 $\langle {N_{x}^{\prime }}^{+}\rangle$
are observed (figures 17
d and 18
d). However, in the hyperbolic regions (figures 17
f and 18
f), after achieving its minimum value,
 $\langle {N_{x}^{\prime }}^{+}\rangle$
increases and reaches a positive peak magnitude at
 $z^{+}\approx 70$
.
Concerning figures 17 and 18, it is also important to note that, for each viscoelastic case, the profiles given by the sum of the energy terms shown in figure 17(c,e), and in figure 18(c,e) at each
 $z^{+}$
are approximately equal to those displayed in figures 17(a) and 18(a), respectively, which is also valid for figures 17(b,d,f) and 18(b,d,f). Such a result indicates that the amount of energy exchanged between the polymers and turbulence in the parabolic regions is negligible compared to that occurring in elliptical or hyperbolic regions.
The three-dimensional structures represent the isosurfaces of hyperbolic regions defined as a negative value of the second invariant of the velocity gradient tensor,
 $\unicode[STIX]{x1D735}\boldsymbol{u}$
. The colours indicate polymer stretching,
 $\text{tr}(\unicode[STIX]{x1D63E})/L^{2}$
.

In order to illustrate the role played by the addition of a polymer in the hyperbolic structures of the domain, consider the hyperbolic counterpart of figure 3. Since the magnitude of the second invariant of the velocity gradient is not altered when one interchanges the Euclidean norms of
 $\unicode[STIX]{x1D63F}$
and
 $\unicode[STIX]{x1D652}$
, a negative value of
 $Q$
with the same magnitude as the ones depicted in figure 3 would give the hyperbolic structure an intensity corresponding to the elliptical structure intensity of that figure, as measured by
 $Q$
. In this connection, what is seen in figure 19 is a distribution over the domain of hyperbolic structures corresponding to:
 $Q=-0.7$
for the Newtonian (figure 19
a);
 $Q=-0.7$
for the viscoelastic case with
 $Wi_{\unicode[STIX]{x1D70F}_{0}}=50$
,
 $L=30$
(figure 19
b);
 $Q=-0.7$
for the viscoelastic with
 $Wi_{\unicode[STIX]{x1D70F}_{0}}=115$
,
 $L=30$
(figure 19
c);
 $Q=-0.7$
for the viscoelastic case with
 $Wi_{\unicode[STIX]{x1D70F}_{0}}=50$
,
 $L=100$
(figure 19
d); and
 $Q=-0.1$
for the viscoelastic case with
 $Wi_{\unicode[STIX]{x1D70F}_{0}}=115$
,
 $L=100$
(figure 19
e). A direct comparison between figures 3 and 19 shows a remarkable similarity in the intensity of the structures. Although there are clear differences in the morphology of the corresponding hyperbolic structures, figure 19 shows that these turbulent entities are also weakened by the action of the polymer. As the elastic character of the polymer becomes more prominent, the hyperbolic structures are reduced in intensity and size in a quite similar fashion to what happened with the elliptical structures displayed in figure 3. We can deduce that the polymer molecules interact with the turbulence, damping the elliptical and hyperbolic turbulent structures and leading to a tendency of a dominant parabolic character in the flow domain.
Sketch of the polymer-induced drag reduction mechanism.

6 The DR mechanism
Recently, Andrade, Pereira & Soares (Reference Andrade, Pereira and Soares2014) experimentally showed that the polymer drag reduction phenomenon undergoes at least three stages over time: A, B and C, as shown in figure 20(a). In stage A, referred to as the developing time (
 $t_{d}$
), the DR is first negative, due to an instantaneous increase in the local extensional viscosity caused by a large and abrupt polymer stretching. This initial process requires a significant energy input, which comes predominantly from the mean flow (Pereira et al.
Reference Pereira, Mompean, Thais and Soares2017), besides a lesser but still important amount of energy that is extracted from the elliptical and hyperbolic structures, since the polymers are strongly exposed to
 $\unicode[STIX]{x1D749}^{\prime }$
. After reaching a minimum value (
 $DR_{min}$
), the polymers start their coil–stretch cycle and, in consequence, the DR increases in response to the polymer-flow interactions, achieving a maximum value (
 $DR_{max}$
), which makes for the beginning of stage B. The duration of stage B is referred to as the resistance time (
 $t_{r}$
). Such a stage is characterized by a negligible polymer degradation, during which the DR is maintained at its maximum value. In order to describe the polymer coil–stretch mechanisms during stage B, we invoke the autonomous regeneration cycle discussed by Dubief et al. (Reference Dubief, White, Terrapon, Shaqfeh, Moin and Lele2004), in which we include new details concerning the polymer–turbulent exchanges of energy shown in figure 20(b). This autonomous cycle is originally based on that put forward by Jiménez & Pinelli (Reference Jiménez and Pinelli1999) and conceived for Newtonian turbulent flows. In the viscous sublayer, the polymers are highly exposed to the mean flow, which acts as a source of elastic potential energy (see Thais et al.
Reference Thais, Gatski and Mompean2013). Additionally, just above the viscous sublayer (
 $z^{+}\approx 5$
), the polymers enhance the streamwise momentum in the elliptical and hyperbolic regions by releasing streamwise turbulent energy (
 $E_{x}^{\prime }>0$
) to such structures (see figure 17). However, polymers can be also pulled around the near-wall vortices, passing through hyperbolic regions and experiencing a significant strain within both these turbulent structures. Thereby, as shown in figure 17, the polymers store turbulent energy from the elliptical and hyperbolic parts (
 $E_{\unicode[STIX]{x1D6FC}}^{\prime }<0$
) in regions II and III (where they probably also release a non-negligible amount of energy to the mean flow). Lastly, the polymer can be injected (or re-injected) into the very near-wall region, there releasing streamwise turbulent energy and being more exposed to the mean shear. It is worth mentioning that, as shown by the red JPF in figure 13(b), more pronounced polymer–turbulence exchanges of energy occur where
 $\cos \unicode[STIX]{x1D6F9}(e_{1}^{\unicode[STIX]{x1D63E}},e_{1}^{\unicode[STIX]{x1D749}^{\prime }})\approx 1$
.
Since the amount of energy stored by the polymer from the fluctuating velocity field in regions II and III is greater than that released just above the viscous sublayer, there is a weakening of the elliptical and hyperbolic turbulent structures, as indicated by both the blue and red arrows in figure 20(c), resulting in the growth of the parabolic domain. This flow parabolization trend is accompanied by the reduction of the Newtonian work fluctuation as the elasticity increases.
During their coil–stretch cycle, polymer molecules can be mechanically degraded as a result of excessive polymer stretching, which reduces their ability to act as energy exchange agents. Hence, when polymer degradation becomes pronounced, the DR decreases, as represented by stage C in figure 20(a), until achieving an asymptotic value (
 $DR_{asy}$
), which indicates that the degradation has stopped and the molecular weight distribution has reached a steady state.
The coil–stretch mechanism discussed above and sketched in figure 20 highlights the role played by the polymers in the self-sustained wall turbulence interacting with the mean shear, nonlinear interactions, near-wall elliptical and hyperbolic structures in viscoelastic drag reducing flows, considering a DR which evolves over time from the very start of the phenomenon until reaching its asymptotic value.
7 Concluding remarks
The statistical and tensorial analysis of the polymer coil–stretch mechanism in a drag reducing channel flow were conducted by using direct numerical simulations employing the viscoelastic FENE-P model. Four Newtonian flow and seven viscoelastic flows were examined, keeping the viscosity ratio
 $\unicode[STIX]{x1D6FD}_{0}$
fixed at 0.9 and taking into account four different values of the zero shear friction Reynolds number (
 $Re_{\unicode[STIX]{x1D70F}_{0}}=180$
,
 $Re_{\unicode[STIX]{x1D70F}_{0}}=395$
,
 $Re_{\unicode[STIX]{x1D70F}_{0}}=590$
and
 $Re_{\unicode[STIX]{x1D70F}_{0}}=1000$
) and two different values of the friction Weissenberg number and the maximum polymer molecule extensibility (
 $Wi_{\unicode[STIX]{x1D70F}_{0}}=50$
;
 $Wi_{\unicode[STIX]{x1D70F}_{0}}=115$
;
 $L=30$
;
 $L=100$
), which provided drag reduction regimes from 28.5 % up to 62.3 % (the simulation details are in table 1, § 2).
The polymer modifies the mean flow velocity, increasing its streamwise component, which departs from the Prandtl–Kármán law (the onset of DR) up to Virk’s asymptote, as
 $Wi_{\unicode[STIX]{x1D70F}_{0}}$
and
 $L$
increase. A similar effect is found for the streamwise Reynolds stress normal component, although the other normal components of this tensor decrease (figure 1 in § 3). Concerning the relative polymer extension, the polymer molecules exhibit a significant stretch level close to the wall, which reaches its maximum within the buffer layer but is minimal, yet still relevant, at the centre of the channel. Such an extension profile cannot, however, be sustained exclusively by the mean flow, although the mean viscous shear stress is the most relevant stretch agent in the very near-wall region (figure 2 in § 3). As pointed out in § 4, the stretching produced by the mean flow is increased, since the turbulent structures interact with the polymers molecules, providing a supplementary polymer extension. In fact, polymer molecules are strongly exposed to flow stress fluctuations, which is evidenced by the high degree of alignment between the instantaneous conformation tensor and the instantaneous velocity fluctuation product tensor (especially in the very near-wall region). As
 $Wi_{\unicode[STIX]{x1D70F}_{0}}$
and
 $L$
increase, this alignment between both the first principal directions of the conformation tensor (
 $\unicode[STIX]{x1D63E}$
) and the velocity fluctuation product tensor (
 $\unicode[STIX]{x1D749}^{\prime }$
) becomes more pronounced.
The thickening of the buffer layer was also evidenced by the tensorial and statistical analysis, as shown in § 4.2. For the most viscoelastic flow, for instance, the angle between
 $e_{1}^{\unicode[STIX]{x1D63F}}$
and
 $e_{x}$
is equal to
 $45^{\circ }$
from the wall to
 $z^{+}=155$
, a typical orientation which indicates that the polymers act on the flow by partially suppressing the turbulence, making the rate-of-strain tensor more laminar, viscometrically speaking.
The
 $Q$
-criterion was used as a measure of the intensity of elliptical (vortices) and hyperbolic structures. A normalized dimensionless version of this criterion was constructed in order to partition the domain into elliptical, hyperbolic and parabolic regions. The strong interactions between the polymers and intermittent turbulent structures were investigated using perspective of the
 $Q$
-criterion (§ 5). Figure 16 showed that the previously documented counter-torque action (see Kim et al.
Reference Kim, Li, Sureshkumar, Balachandar and Adrian2007, Reference Kim, Adrian, Balachandar and Sureshkumar2008) on the turbulent elliptical structures (vortices) corresponding to blue regions where
 $Q_{norm}<0.5$
(or
 $Q>0$
) is accompanied by a counter-stretch force acting on the hyperbolic structures corresponding to red regions where
 $Q_{norm}>0.5$
(or
 $Q<0$
). To illustrate the polymer–turbulence interactions in the hyperbolic structures, figure 19 showed how these structures are weakened as the elasticity is increased from the Newtonian to our maximum drag reduction case. The similarities with respect to the effect on the elliptical structures in terms of the intensity of the structures are remarkable (see figure 3). The conclusion reached at this point was schematically represented in figure 20(c). An important consequence of the addition of a polymer to turbulent shear flows is the weakening of elliptical and hyperbolic structures, inducing the enhancement of the parabolic domain, which is typical of a viscometric laminar response to an imposed shear flow.
The instantaneous turbulent energy exchange represented by the streamwise work fluctuation terms (§ 5) was analysed in this paper by splitting the domain into elliptical and hyperbolic flow regions. Such analyses, combined with the tensorial and statistical ones, allowed us to include more details concerning the polymer coil–stretch mechanism on the autonomous regeneration cycle discussed by Dubief et al. (Reference Dubief, White, Terrapon, Shaqfeh, Moin and Lele2004) and originally based on that put forward by Jiménez & Pinelli (Reference Jiménez and Pinelli1999) conceived for Newtonian turbulent flows. The Newtonian fluctuating term,
 $\langle {N_{x}^{\prime }}^{+}\rangle$
exceeds by one order of magnitude the elastic fluctuating term,
 $\langle {E_{x}^{\prime }}^{+}\rangle$
, revealing an important manifestation of the nonlinearity of the problem, and, therefore, needs to be taken into account in the description of the DR mechanism. We have noticed higher intensities of these quantities in the hyperbolic domain than in the elliptical ones. In the very near-wall region, polymers not only release energy to the streaks (as previously pointed out by Dubief et al.
Reference Dubief, White, Terrapon, Shaqfeh, Moin and Lele2004; Terrapon et al.
Reference Terrapon, Dubief, Moin, Shaqfeh and Lele2004), but also to the elliptical and hyperbolic structures. However, these two turbulent structures are damped within the buffer layer. Joint probability functions have shown that more pronounced polymer–turbulence exchanges of energy occur when the conformation tensor is predominantly oriented along the first principal direction of
 $\unicode[STIX]{x1D749}^{\prime }$
(figure 13). Fundamentally, in elliptical regions, the polymer stores turbulent energy by applying a counter-torque around the vortices, damping the ejection (Q2) and sweep (Q4) events, while, in the hyperbolic regions, polymers take energy from the flow by opposing the extensional deformation. Lastly, it is important to remark that a polymer release of energy occurs almost exclusively in the streamwise direction since
 $\langle {E_{y}^{\prime }}^{+}\rangle \leqslant 0$
and
 $\langle {E_{z}^{\prime }}^{+}\rangle \leqslant 0$
across the channel half-width (not shown here), which is in agreement with the increase in the velocity streamwise fluctuation observed in drag reducing flows. Polymers store energy from the mean flow (as recently reported by Thais et al.
Reference Thais, Gatski and Mompean2013) in order to have a considerable stretch in the very near-wall region, and we believe that they can also release energy to the mean flow within the buffer layer, a fact with which the increase in
 $u_{x}^{\prime }$
could be also related, since the mean flow also acts as a source of turbulent kinetic energy in this region.
Acknowledgements
We would like to express our sincere gratitude to Professors E. Calzavarini and S. Berti from the Laboratoire de Mécanique de Lille of Université Lille Nord de France for their useful comments and suggestions. This research was granted access to the HPC resources of IDRIS under the allocation 2014-i20142b2277 made by GENCI. The authors would also like to express their acknowledgement and gratitude to the Brazilian Scholarship Program ‘Science Without Borders,’ managed by CNPq (Brazilian Research Council), for partial financial support of this research.
Appendix A
In this work, we are focusing our analysis on the energy terms exclusively related with the fluctuating fields. As shown in § 4, our tensorial and statistical analyses indicate that the conformation tensor is considerably exposed to the Reynolds stress tensor, which suggests a strong energy transfer between the polymers and the turbulent structures. Aiming to characterize such energy exchanges, we consider the work fluctuating terms. These energy terms are those exclusively related to the fluctuating fields which appear in the right-hand side of the work equations, which in turn are obtained by decomposing the variables of the momentum equations into mean components (
 $\overline{U}_{\unicode[STIX]{x1D6FC}}$
,
 $\overline{p}$
and
 $\overline{\unicode[STIX]{x1D6EF}}_{\unicode[STIX]{x1D6FC}j}$
) and fluctuation ones (
 $u_{\unicode[STIX]{x1D6FC}}^{\prime }$
,
 $p^{\prime }$
and
 $\unicode[STIX]{x1D6EF}_{\unicode[STIX]{x1D6FC}j}^{\prime }$
), and then multiplying the resulting equations by the velocity fluctuation (
 $u_{\unicode[STIX]{x1D6FC}}^{\prime }$
).
We provide below a deduction of the work equations considering, initially, the scaled momentum equations:
 $$\begin{eqnarray}\displaystyle \frac{\unicode[STIX]{x2202}u_{\unicode[STIX]{x1D6FC}}}{\unicode[STIX]{x2202}t}+u_{j}\frac{\unicode[STIX]{x2202}u_{\unicode[STIX]{x1D6FC}}}{\unicode[STIX]{x2202}x_{j}}=-\frac{\unicode[STIX]{x2202}p}{\unicode[STIX]{x2202}x_{\unicode[STIX]{x1D6FC}}}+\frac{\unicode[STIX]{x1D6FD}_{0}}{Re_{h}}\frac{\unicode[STIX]{x2202}^{2}u_{\unicode[STIX]{x1D6FC}}}{\unicode[STIX]{x2202}x_{j}^{2}}+\frac{1}{Re_{h}}\frac{\unicode[STIX]{x2202}\unicode[STIX]{x1D6EF}_{\unicode[STIX]{x1D6FC}j}}{\unicode[STIX]{x2202}x_{j}}. & & \displaystyle\end{eqnarray}$$
The variables of the momentum equations are then decomposed into mean components (
 $\overline{U}_{\unicode[STIX]{x1D6FC}}$
,
 $\overline{p}$
and
 $\overline{\unicode[STIX]{x1D6EF}}_{\unicode[STIX]{x1D6FC}j}$
) and fluctuating ones (
 $u_{\unicode[STIX]{x1D6FC}}^{\prime }$
,
 $p^{\prime }$
and
 $\unicode[STIX]{x1D6EF}_{\unicode[STIX]{x1D6FC}j}^{\prime }$
):
 $$\begin{eqnarray}\displaystyle & & \displaystyle \frac{\unicode[STIX]{x2202}(\overline{U}_{\unicode[STIX]{x1D6FC}}+u_{\unicode[STIX]{x1D6FC}}^{\prime })}{\unicode[STIX]{x2202}t}+(\overline{U}_{j}+u_{j}^{\prime })\frac{\unicode[STIX]{x2202}(\overline{U}_{\unicode[STIX]{x1D6FC}}+u_{\unicode[STIX]{x1D6FC}}^{\prime })}{\unicode[STIX]{x2202}x_{j}}\nonumber\\ \displaystyle & & \displaystyle \quad =-\frac{\unicode[STIX]{x2202}(\overline{p}+p^{\prime })}{\unicode[STIX]{x2202}x_{\unicode[STIX]{x1D6FC}}}+\frac{\unicode[STIX]{x1D6FD}_{0}}{Re_{h}}\frac{\unicode[STIX]{x2202}^{2}(\overline{U}_{\unicode[STIX]{x1D6FC}}+u_{\unicode[STIX]{x1D6FC}}^{\prime })}{\unicode[STIX]{x2202}x_{j}^{2}}+\frac{1}{Re_{h}}\frac{\unicode[STIX]{x2202}(\overline{\unicode[STIX]{x1D6EF}}_{\unicode[STIX]{x1D6FC}j}+\unicode[STIX]{x1D6EF}_{\unicode[STIX]{x1D6FC}j}^{\prime })}{\unicode[STIX]{x2202}x_{j}}.\end{eqnarray}$$
Then,
 $$\begin{eqnarray}\displaystyle & & \displaystyle \frac{\unicode[STIX]{x2202}(\overline{U}_{\unicode[STIX]{x1D6FC}})}{\unicode[STIX]{x2202}t}+\frac{\unicode[STIX]{x2202}(u_{\unicode[STIX]{x1D6FC}}^{\prime })}{\unicode[STIX]{x2202}t}+(\overline{U}_{j})\frac{\unicode[STIX]{x2202}(\overline{U}_{\unicode[STIX]{x1D6FC}})}{\unicode[STIX]{x2202}x_{j}}+(\overline{U}_{j})\frac{\unicode[STIX]{x2202}(u_{\unicode[STIX]{x1D6FC}}^{\prime })}{\unicode[STIX]{x2202}x_{j}}+(u_{j}^{\prime })\frac{\unicode[STIX]{x2202}(\overline{U}_{\unicode[STIX]{x1D6FC}})}{\unicode[STIX]{x2202}x_{j}}+(u_{j}^{\prime })\frac{\unicode[STIX]{x2202}(u_{\unicode[STIX]{x1D6FC}}^{\prime })}{\unicode[STIX]{x2202}x_{j}}\nonumber\\ \displaystyle & & \displaystyle \quad =-\frac{\unicode[STIX]{x2202}(\overline{p})}{\unicode[STIX]{x2202}x_{\unicode[STIX]{x1D6FC}}}-\frac{\unicode[STIX]{x2202}(p^{\prime })}{\unicode[STIX]{x2202}x_{\unicode[STIX]{x1D6FC}}}+\frac{\unicode[STIX]{x1D6FD}_{0}}{Re_{h}}\frac{\unicode[STIX]{x2202}^{2}(\overline{U}_{\unicode[STIX]{x1D6FC}})}{\unicode[STIX]{x2202}x_{j}^{2}}+\frac{\unicode[STIX]{x1D6FD}_{0}}{Re_{h}}\frac{\unicode[STIX]{x2202}^{2}(u_{\unicode[STIX]{x1D6FC}}^{\prime })}{\unicode[STIX]{x2202}x_{j}^{2}}+\frac{1}{Re_{h}}\frac{\unicode[STIX]{x2202}(\overline{\unicode[STIX]{x1D6EF}}_{\unicode[STIX]{x1D6FC}j})}{\unicode[STIX]{x2202}x_{j}}+\frac{1}{Re_{h}}\frac{\unicode[STIX]{x2202}(\unicode[STIX]{x1D6EF}_{\unicode[STIX]{x1D6FC}j}^{\prime })}{\unicode[STIX]{x2202}x_{j}}.\qquad\end{eqnarray}$$
Rearranging the terms,
 $$\begin{eqnarray}\displaystyle & & \displaystyle \frac{\unicode[STIX]{x2202}(\overline{U}_{\unicode[STIX]{x1D6FC}})}{\unicode[STIX]{x2202}t}+\frac{\unicode[STIX]{x2202}(u_{\unicode[STIX]{x1D6FC}}^{\prime })}{\unicode[STIX]{x2202}t}=\left[-\overline{U}_{j}\frac{\unicode[STIX]{x2202}\overline{U}_{\unicode[STIX]{x1D6FC}}}{\unicode[STIX]{x2202}x_{j}}\right]+\left[-\frac{\unicode[STIX]{x2202}\overline{p}}{\unicode[STIX]{x2202}x_{\unicode[STIX]{x1D6FC}}}\right]+\left[\frac{\unicode[STIX]{x1D6FD}_{0}}{Re_{h}}\frac{\unicode[STIX]{x2202}^{2}\overline{U}_{\unicode[STIX]{x1D6FC}}}{\unicode[STIX]{x2202}x_{j}^{2}}\right]+\left[\frac{1}{Re_{h}}\frac{\unicode[STIX]{x2202}\overline{\unicode[STIX]{x1D6EF}}_{\unicode[STIX]{x1D6FC}j}}{\unicode[STIX]{x2202}x_{j}}\right]\nonumber\\ \displaystyle & & \displaystyle \quad +\,\left[-\overline{U}_{j}\frac{\unicode[STIX]{x2202}u_{\unicode[STIX]{x1D6FC}}^{\prime }}{\unicode[STIX]{x2202}x_{j}}\right]+\left[-u_{j}^{\prime }\frac{\unicode[STIX]{x2202}\overline{U}_{\unicode[STIX]{x1D6FC}}}{\unicode[STIX]{x2202}x_{j}}\right]\nonumber\\ \displaystyle & & \displaystyle \quad +\,\left[-u_{j}^{\prime }\frac{\unicode[STIX]{x2202}u_{\unicode[STIX]{x1D6FC}}^{\prime }}{\unicode[STIX]{x2202}x_{j}}\right]+\left[-\frac{\unicode[STIX]{x2202}p^{\prime }}{\unicode[STIX]{x2202}x_{\unicode[STIX]{x1D6FC}}}\right]+\left[\frac{\unicode[STIX]{x1D6FD}_{0}}{Re_{h}}\frac{\unicode[STIX]{x2202}^{2}u_{\unicode[STIX]{x1D6FC}}^{\prime }}{\unicode[STIX]{x2202}x_{j}^{2}}\right]+\left[\frac{1}{Re_{h}}\frac{\unicode[STIX]{x2202}\unicode[STIX]{x1D6EF}_{\unicode[STIX]{x1D6FC}j}^{\prime }}{\unicode[STIX]{x2202}x_{j}}\right].\end{eqnarray}$$
Multiplying the resulting equations by the velocity fluctuations (
 $u_{\unicode[STIX]{x1D6FC}}^{\prime }$
):
 $$\begin{eqnarray}\displaystyle & & \displaystyle u_{\unicode[STIX]{x1D6FC}}^{\prime }\frac{\unicode[STIX]{x2202}(\overline{U}_{\unicode[STIX]{x1D6FC}})}{\unicode[STIX]{x2202}t}+u_{\unicode[STIX]{x1D6FC}}^{\prime }\frac{\unicode[STIX]{x2202}(u_{\unicode[STIX]{x1D6FC}}^{\prime })}{\unicode[STIX]{x2202}t}\nonumber\\ \displaystyle & & \displaystyle \quad =\left[-u_{\unicode[STIX]{x1D6FC}}^{\prime }\overline{U}_{j}\frac{\unicode[STIX]{x2202}\overline{U}_{\unicode[STIX]{x1D6FC}}}{\unicode[STIX]{x2202}x_{j}}\right]+\left[-u_{\unicode[STIX]{x1D6FC}}^{\prime }\frac{\unicode[STIX]{x2202}\overline{p}}{\unicode[STIX]{x2202}x_{\unicode[STIX]{x1D6FC}}}\right]+\left[u_{\unicode[STIX]{x1D6FC}}^{\prime }\frac{\unicode[STIX]{x1D6FD}_{0}}{Re_{h}}\frac{\unicode[STIX]{x2202}^{2}\overline{U}_{\unicode[STIX]{x1D6FC}}}{\unicode[STIX]{x2202}x_{j}^{2}}\right]+\left[u_{\unicode[STIX]{x1D6FC}}^{\prime }\frac{1}{Re_{h}}\frac{\unicode[STIX]{x2202}\overline{\unicode[STIX]{x1D6EF}}_{\unicode[STIX]{x1D6FC}j}}{\unicode[STIX]{x2202}x_{j}}\right]\nonumber\\ \displaystyle & & \displaystyle \quad +\,\left[-u_{\unicode[STIX]{x1D6FC}}^{\prime }\overline{U}_{j}\frac{\unicode[STIX]{x2202}u_{\unicode[STIX]{x1D6FC}}^{\prime }}{\unicode[STIX]{x2202}x_{j}}\right]+\left[-u_{\unicode[STIX]{x1D6FC}}^{\prime }u_{j}^{\prime }\frac{\unicode[STIX]{x2202}\overline{U}_{\unicode[STIX]{x1D6FC}}}{\unicode[STIX]{x2202}x_{j}}\right]\nonumber\\ \displaystyle & & \displaystyle \quad +\,\left[-u_{\unicode[STIX]{x1D6FC}}^{\prime }u_{j}^{\prime }\frac{\unicode[STIX]{x2202}u_{\unicode[STIX]{x1D6FC}}^{\prime }}{\unicode[STIX]{x2202}x_{j}}\right]+\left[-u_{\unicode[STIX]{x1D6FC}}^{\prime }\frac{\unicode[STIX]{x2202}p^{\prime }}{\unicode[STIX]{x2202}x_{\unicode[STIX]{x1D6FC}}}\right]+\left[u_{\unicode[STIX]{x1D6FC}}^{\prime }\frac{\unicode[STIX]{x1D6FD}_{0}}{Re_{h}}\frac{\unicode[STIX]{x2202}^{2}u_{\unicode[STIX]{x1D6FC}}^{\prime }}{\unicode[STIX]{x2202}x_{j}^{2}}\right]+\left[u_{\unicode[STIX]{x1D6FC}}^{\prime }\frac{1}{Re_{h}}\frac{\unicode[STIX]{x2202}\unicode[STIX]{x1D6EF}_{\unicode[STIX]{x1D6FC}j}^{\prime }}{\unicode[STIX]{x2202}x_{j}}\right].\end{eqnarray}$$
Lastly, since the flow is incompressible (
 $\unicode[STIX]{x1D735}\boldsymbol{\cdot }\boldsymbol{u}=0$
), we can rewrite the advection terms as
 $[-u_{\unicode[STIX]{x1D6FC}}^{\prime }\overline{U}_{j}(\unicode[STIX]{x2202}\overline{U}_{\unicode[STIX]{x1D6FC}}/\unicode[STIX]{x2202}x_{j})]=[-u_{\unicode[STIX]{x1D6FC}}^{\prime }(\unicode[STIX]{x2202}(\overline{U}_{\unicode[STIX]{x1D6FC}}\overline{U}_{j})/\unicode[STIX]{x2202}x_{j})]$
,
 $[-u_{\unicode[STIX]{x1D6FC}}^{\prime }\overline{U}_{j}(\unicode[STIX]{x2202}u_{\unicode[STIX]{x1D6FC}}^{\prime }/\unicode[STIX]{x2202}x_{j})]=[-u_{\unicode[STIX]{x1D6FC}}^{\prime }(\unicode[STIX]{x2202}(u_{\unicode[STIX]{x1D6FC}}^{\prime }\overline{U}_{j})/\unicode[STIX]{x2202}x_{j})]$
,
 $[-u_{\unicode[STIX]{x1D6FC}}^{\prime }u_{j}^{\prime }(\unicode[STIX]{x2202}\overline{U}_{\unicode[STIX]{x1D6FC}}/\unicode[STIX]{x2202}x_{j})]=[-u_{\unicode[STIX]{x1D6FC}}^{\prime }(\unicode[STIX]{x2202}(\overline{U}_{\unicode[STIX]{x1D6FC}}u_{j}^{\prime })/\unicode[STIX]{x2202}x_{j})]$
, and
 $[-u_{\unicode[STIX]{x1D6FC}}^{\prime }u_{j}^{\prime }(\unicode[STIX]{x2202}u_{\unicode[STIX]{x1D6FC}}^{\prime }/\unicode[STIX]{x2202}x_{j})]=[-u_{\unicode[STIX]{x1D6FC}}^{\prime }(\unicode[STIX]{x2202}(u_{\unicode[STIX]{x1D6FC}}^{\prime }u_{j}^{\prime })/\unicode[STIX]{x2202}x_{j})]$
. Hence, the work equations assume the following form:
 $$\begin{eqnarray}\displaystyle & & \displaystyle \left[u_{\unicode[STIX]{x1D6FC}}^{\prime }\frac{\unicode[STIX]{x2202}(\overline{U}_{\unicode[STIX]{x1D6FC}})}{\unicode[STIX]{x2202}t}\right]+\left[\frac{1}{2}\frac{\unicode[STIX]{x2202}({u_{\unicode[STIX]{x1D6FC}}^{\prime }}^{2})}{\unicode[STIX]{x2202}t}\right]\nonumber\\ \displaystyle & & \displaystyle \quad =\left[-u_{\unicode[STIX]{x1D6FC}}^{\prime }\frac{\unicode[STIX]{x2202}(\overline{U}_{\unicode[STIX]{x1D6FC}}\overline{U}_{j})}{\unicode[STIX]{x2202}x_{j}}\right]+\left[-u_{\unicode[STIX]{x1D6FC}}^{\prime }\frac{\unicode[STIX]{x2202}\overline{p}}{\unicode[STIX]{x2202}x_{\unicode[STIX]{x1D6FC}}}\right]+\left[\frac{\unicode[STIX]{x1D6FD}_{0}}{Re_{h}}u_{\unicode[STIX]{x1D6FC}}^{\prime }\frac{\unicode[STIX]{x2202}^{2}\overline{U}_{\unicode[STIX]{x1D6FC}}}{{\unicode[STIX]{x2202}x_{j}}^{2}}\right]+\left[\frac{1}{Re_{h}}u_{\unicode[STIX]{x1D6FC}}^{\prime }\frac{\unicode[STIX]{x2202}\overline{\unicode[STIX]{x1D6EF}}_{\unicode[STIX]{x1D6FC}j}}{\unicode[STIX]{x2202}x_{j}}\right]\nonumber\\ \displaystyle & & \displaystyle \quad +\,\left[-u_{\unicode[STIX]{x1D6FC}}^{\prime }\frac{\unicode[STIX]{x2202}(u_{\unicode[STIX]{x1D6FC}}^{\prime }\overline{U}_{j})}{\unicode[STIX]{x2202}x_{j}}\right]+\left[-u_{\unicode[STIX]{x1D6FC}}^{\prime }\frac{\unicode[STIX]{x2202}(\overline{U}_{\unicode[STIX]{x1D6FC}}u_{j}^{\prime })}{\unicode[STIX]{x2202}x_{j}}\right]\nonumber\\ \displaystyle & & \displaystyle \quad +\,\underbrace{\left[-u_{\unicode[STIX]{x1D6FC}}^{\prime }\frac{\unicode[STIX]{x2202}(u_{\unicode[STIX]{x1D6FC}}^{\prime }u_{j}^{\prime })}{\unicode[STIX]{x2202}x_{j}}\right]}_{A_{\unicode[STIX]{x1D6FC}}^{\prime }}+\underbrace{\left[-u_{\unicode[STIX]{x1D6FC}}^{\prime }\frac{\unicode[STIX]{x2202}p^{\prime }}{\unicode[STIX]{x2202}x_{\unicode[STIX]{x1D6FC}}}\right]}_{P_{\unicode[STIX]{x1D6FC}}^{\prime }}+\underbrace{\left[\frac{\unicode[STIX]{x1D6FD}_{0}}{Re_{h}}u_{\unicode[STIX]{x1D6FC}}^{\prime }\frac{\unicode[STIX]{x2202}^{2}u_{\unicode[STIX]{x1D6FC}}^{\prime }}{{\unicode[STIX]{x2202}x_{j}}^{2}}\right]}_{V_{\unicode[STIX]{x1D6FC}}^{\prime }}+\underbrace{\left[\frac{1}{Re_{h}}u_{\unicode[STIX]{x1D6FC}}^{\prime }\frac{\unicode[STIX]{x2202}\unicode[STIX]{x1D6EF}_{\unicode[STIX]{x1D6FC}j}^{\prime }}{\unicode[STIX]{x2202}x_{j}}\right]}_{E_{\unicode[STIX]{x1D6FC}}^{\prime }}.\end{eqnarray}$$
In order to evaluate the contribution of each work term as a function of its direction, the summation is not applied to the subscript
 $\unicode[STIX]{x1D6FC}$
(
 $\unicode[STIX]{x1D6FC}=x$
or
 $\unicode[STIX]{x1D6FC}=y$
or
 $\unicode[STIX]{x1D6FC}=z$
).
The work terms exclusively linked with the fluctuating fields in the right-hand side of the work equations are then:
 $A_{\unicode[STIX]{x1D6FC}}^{\prime }=[-u_{\unicode[STIX]{x1D6FC}}^{\prime }(\unicode[STIX]{x2202}(u_{\unicode[STIX]{x1D6FC}}^{\prime }u_{j}^{\prime })/\unicode[STIX]{x2202}x_{j})]$
,
 $P_{\unicode[STIX]{x1D6FC}}^{\prime }=(-u_{\unicode[STIX]{x1D6FC}}^{\prime }(\unicode[STIX]{x2202}p^{\prime }/\unicode[STIX]{x2202}x))$
,
 $V_{\unicode[STIX]{x1D6FC}}^{\prime }=[(\unicode[STIX]{x1D6FD}_{0}/Re_{h})u_{\unicode[STIX]{x1D6FC}}^{\prime }(\unicode[STIX]{x2202}^{2}u_{\unicode[STIX]{x1D6FC}}^{\prime }/\unicode[STIX]{x2202}{x_{j}}^{2})]$
and
 $E_{\unicode[STIX]{x1D6FC}}^{\prime }=1/Re_{h}(u_{\unicode[STIX]{x1D6FC}}^{\prime }(\unicode[STIX]{x2202}\unicode[STIX]{x1D6EF}_{\unicode[STIX]{x1D6FC}j}^{\prime }/\unicode[STIX]{x2202}x_{j}))$
. Since the turbulent energy exchanges in the
 $x$
direction constitute more than
 $90\,\%$
of those exchanges, we analyse only the streamwise work fluctuation terms (
 $\unicode[STIX]{x1D6FC}=x$
). Hence, the instantaneous polymer work term,
 $E_{x}^{\prime }$
, indicates the amount of energy stored (
 $E_{x}^{\prime }<0$
) or released (
 $E_{x}^{\prime }>0$
) by the polymers from the fluctuating velocity field in the streamwise direction,
 $u_{x}^{\prime }$
(the fluctuations are denoted by the superscript ‘
 $\prime$
’). The supplementary fluctuating work terms denote the advection,
 $A_{x}^{\prime }$
, the pressure redistribution,
 $P_{x}^{\prime }$
and the viscous stress,
 $V_{x}^{\prime }$
. The sum
 $A_{x}^{\prime }+P_{x}^{\prime }+V_{x}^{\prime }$
is referred to as the Newtonian fluctuating work,
 $N_{x}^{\prime }$
.



