1. Introduction
Particle–wall and interparticle interactions lie at the heart of numerous natural and artificial processes of wide applicability and relevance. A major challenge, however, is that of effecting contact between surfaces within time scales dictated by the allied physical process. This is crucial to numerous processes such as self-assembly of components (Cui et al. Reference Cui, Wang, Liang and Qiu2023), enzyme docking (Zhou & Pang Reference Zhou and Pang2018), catalysis (Vogt & Weckhuysen Reference Vogt and Weckhuysen2022) and vesicular transport (Casadevall et al. Reference Casadevall, Nosanchuk, Williamson and Rodrigues2009) that rely on particles approaching one another and achieving surface-to-surface contact in finite time. This is trivially achieved in a number of macroscale processes that exhibit immediate surface-to-surface contact. For instance, magnets rapidly attach to one another, or to ferromagnetic materials, with an audible ‘snap’. However, at smaller length scales, as with the vast majority of the aforementioned processes, surfaces encounter a viscous, fluid film barrier that ought to be squeezed out before contact can be effectuated. The hydrodynamic resistance, or drag, rendered by the thin film can be understood using the framework of lubrication theory, which posits that the drag force scales inversely with the thickness of the fluid film. Consequently, two ideal surfaces (i.e. void of surface roughness) approaching one another under the influence of a constant force can attain contact only in infinite time (Stone Reference Stone2005).
It is despite this impediment that we observe particles and particle analogues achieving contact in finite time in a wide variety of scenarios spanning natural and engineered realms. In fact, in biological processes the sustenance of biochemical processes (e.g. enzyme docking) often relies on particles overcoming the separation due to the surrounding solvent. More importantly, the process of achieving ‘first contact’ has to happen in finite time – at a scale relevant to the reaction rate,
 $\,10^{-6} {-} 10^{0}$
s (Agarwal Reference Agarwal2006). Another instance where this is relevant is in the process of cell wall deposition in plant and fungal cells (Verma Reference Verma2001; Casadevall et al. Reference Casadevall, Nosanchuk, Williamson and Rodrigues2009). The process relies on the timely deposition of a cellulose matrix onto a newly formed cell barrier by individual spherical vesicles within the time constraints imposed by the process of cell division (Thiele et al. Reference Thiele, Wanner, Kindzierski, Jürgens, Mayer, Pachl and Assaad2009). Similarly, at smaller spatial scales, we have the adsorption of phoretic particles (intracellular macromolecules, colloids, etc.) onto channel walls and onto one another. Once again, the relevant binding processes tend to manifest at rates far higher than those expected for such particles, given the existence of a thin film of fluid at the interface (Leckband & Israelachvili Reference Leckband and Israelachvili2001; Xu et al. Reference Xu, Choi, Nagella and Takatori2023).
A number of relevant mechanisms have been explored to rationalise these observations. First, inertial motion of particles with higher momentum than that is dissipated by viscous drag can effect collisions in finite time (Birwa et al. Reference Birwa, Rajalakshmi, Govindarajan and Menon2018). Depending on their elastic properties, particles can encounter ‘sticking collisions’ (Serayssol & Davis Reference Serayssol and Davis1986). Second, increased lubrication pressures resulting from squeezing the thin fluid film may deform the surfaces (Davis, Serayssol & Hinch Reference Davis, Serayssol and Hinch1986; Chastel & Mongruel Reference Chastel and Mongruel2019) shifting the local flow configuration in a manner amenable to draining the intercalant fluid. Third, for very stiff materials, it has been proposed that a lubricant film of a Newtonian fluid will begin to exhibit non-Newtonian properties, proceeding to mitigate high lubrication pressures (Skotheim & Mahadevan Reference Skotheim and Mahadevan2004). Fourth, similar to the effect of elastic deformations, non-negligible roughness and surface asperities can aid surfaces in close proximity to achieve ‘first contact’ (Cawthorn & Balmforth Reference Cawthorn and Balmforth2010). Lastly, a particle can attain finite-time contact if driven by spatially varying forces, such as London– van der Waals dispersion interactions, that rapidly accelerate it near contact (Serayssol & Davis Reference Serayssol and Davis1986).
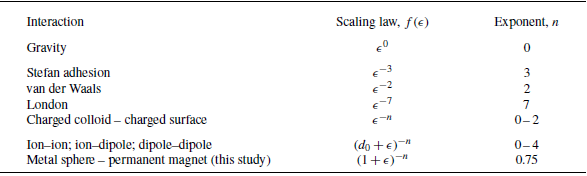
The latter most mechanism is evocative of magnetic interactions, which have recently been exploited in accelerating self-assembly within mixtures (Niu et al. Reference Niu, Du, Esposito, Ng, Brenner, McEuen and Cohen2019; Ku et al. Reference Ku, Lei, Lin, Yan, Chen and Guo2022). While different from van der Waals and other dispersion forces (refer table 1) in its origin, the induced magnetic force acting on a particle approaching a permanent magnet also sequentially accelerates it towards its surface. To isolate the effects of magnetic driving forces on particle–wall contact, in this work we limit our focus to microscale systems where the role of inertia is diminished, and to smooth, non-deformable surfaces.
As a model system that is both experimentally and theoretically tractable, we invoke the classical framework of a spherical particle approaching a rigid plane (a wall or floor) in a quiescent fluid, as illustrated in figure 1(a) (see Appendix A for details of the experimental set-up and methods). Here, a sphere of radius,
 $a$
, approaches a flat plane in a semi-infinite fluid domain, driven by a force,
 $F$
. At any given instant, the sphere’s centre is at a height,
 $z$
, above the floor plane, which is fixed at
 $z=0$
. To illustrate this process, we consider the simple experimental system where a steel sphere (radius
 $a=1$
mm) settles under its own weight, i.e.
 $F =\textrm{const.}$
, in a cuboidal container of silicone oil. The sphere’s unidirectional, downward trajectory is observed orthogonally using a camera, focusing on the region close to the floor (interface) to capture its final path as it overcomes lubrication stresses. As expected, the initial trajectory is linear when the sphere is far away from the plane, and the terminal settling velocity is consistent with Stokes’ drag formula (§ 2.1). Closer to the surface, i.e. when the sphere’s position is comparable to the particle radius,
 $z\approx a$
, drag increases, and the vertical speed decays (figure 1
b). After a few tens of seconds, movement is no longer detected.
(a) Schematic of the settling experiment system. A metallic sphere of radius
 $a$
approaches a flat plane at the base driven by a force
 $F$
and subject to hydrodynamic drag
 $F_D$
in a column of viscous silicone oil. The instantaneous centre of the sphere is denoted by
 $z$
(non-dimensional position,
 $\zeta = z/a$
) and the corresponding separation between the sphere and plane, i.e. the smallest gap is given by
 $\delta$
(non-dimensional gap,
 $\epsilon = \delta /a$
). Experimentally determined trajectories of a sphere of radius
 $a = 1\,\textrm{mm}$
: (b) settling under gravity, i.e. a constant force, and (c) driven by magnetic attraction to the stationary permanent magnet placed at the base.

By introducing a commercially available permanent magnet (Appendix A) at the base of the fluid container for the sphere to settle onto, we introduce a spatially decaying magnetic field in the fluid domain. In turn, the metal sphere behaves as an induced spherical magnet, effecting a net attractive force,
 $F$
, that depends on
 $z$
, and is strongest at the floor plane. As with the gravity-driven settling experiments, we track the trajectory of the sphere as it approaches the base magnet. We note two major differences between the gravitational (figure 1
b) and magnetic cases (figure 1
c). First, the induced magnet reaches the surface approximately a hundred times faster (the absolute time saved depends, of course, on the magnet’s strength, discussed in § 3.1). Second, it appears that the spatially varying force has extended the linear regime, i.e. the Stokes-like motion. A clear deviation from the linear trajectory is thus only observed when the particle–wall separation
 $\delta \approx 0.1 a$
(non-dimensional gap,
 $\epsilon \approx 0.1$
) is comparatively small.
To explore the origins of these quantitative and qualitative effects, we conducted the experiment described above using spheres of eight different diameters
 $2a = 1, 2, 2.5, 3.2, 3.5, 4, 4.5, 5$
mm, tracking their end trajectories when driven by gravitational and magnetic forces. The broad range of radii,
 $a$
, allows us to scope smaller non-dimensional gaps,
 $\epsilon = \delta /a$
. In the following sections, we will first develop the theoretical framework (§ 2) and conduct a formal analysis of the experimental data. This entails a description of the hydrodynamic drag, its mathematical form and its implications in § 2.1. We will see that the trajectory of a sphere approaching a plane under the influence of a general force,
 $F$
, whose spatial dependence is captured by a function,
 $f(\epsilon )$
, such that
 $F \sim f(\epsilon )$
, follows
 \begin{equation} \frac {\dot {\epsilon }}{\epsilon } + f(\epsilon ) = 0, \end{equation}
which governs the evolution of the non-dimensional gap,
 $\epsilon$
, and serves as a master equation for subsequent analyses. It represents a competition between hydrodynamic drag near contact (the first term) and a driving force that varies as
 $f(\epsilon )$
. In the subsequent sections, we will begin with an analysis of the drag term in § 2, and the effects of the two types of driving forces we explore experimentally in this study. We will begin with the case of gravity-driven settling, which corresponds to
 $f(\epsilon ) = 1$
in (1.1), which also serves as a first validation of the theoretical model, in § 2.2. This is followed by the study of magnetically driven particles in § 3. Furthermore, we will utilise the outcomes to show that one can determine the nature of unknown spatially varying forces from kinematic observations in § 3.2. The benefits of such analyses are two fold – one, a wide variety of binding forces relevant to biology and microscale systems that are inaccessible for direct force measurements can be determined from non-invasive kinematic observations; two, the results can conversely be used to design self-assembly systems that utilise specific types of interparticle interactions to overcome the lubrication barrier, to achieve desired structures. In § 4 we will then extend the validated model to other varying forces whose spatial dependence is known and explore their outcomes, followed by a brief discussion in § 5.
2. Theoretical framework
Our system, introduced in the previous section, consists of a cuboidal reservoir of highly viscous fluid, in which a metallic sphere of radius,
 $a$
, travels in pure translation (i.e. without rotation) vertically downward along its centre, as depicted in figure 1(a). The fluid used in our experimental set-up is a silicone oil of density
 $\rho _f = 980 \ \textrm{kg m}^{-3}$
and dynamic viscosity
 $\mu = 59 \ \textrm{Pa s}$
(
 ${\thickapprox}6 \times 10^4$
times more viscous than water). The coordinate of the centre of the sphere is
 $z$
at any instant
 $t$
. The instantaneous gap between the two surfaces, i.e. the floor plane (at
 $z = 0$
) and the base of the sphere, is therefore
 $\delta = z - a$
. Normalising all length scales in the system by the radius,
 $a$
, we have the non-dimensional centre coordinate
 $\zeta = z/a$
and non-dimensional gap thickness
 $\epsilon = \delta /a$
, related by
 $\zeta = 1+\epsilon$
.
We use the above coordinate system to write the equation governing the motion of the sphere. The total force experienced by the immersed particle is the sum of net body forces and surface stresses acting on it, i.e.
 \begin{equation} \boldsymbol{F}_{\boldsymbol{total}} = \int\limits_{V} \boldsymbol{f_b} \textrm{d}V + \int\limits_{S} \boldsymbol{\sigma \boldsymbol{\cdot}n} \textrm{d}S ,\end{equation}
where
 $\boldsymbol{f_b}$
is an arbitrary body force (such as gravity or magnetic attraction; see figure 1) acting over the volume
 $V$
of the particle and
 $\boldsymbol{\sigma }$
denotes surface stresses over
 $S$
, the surface area of the particle. The local normal vector on
 $\textrm{d}S$
is denoted by
 $\boldsymbol{n}$
. Surface stresses acting over the bounds of the particle may be of myriad origins. For example, for dielectric particles in an external electric field,
 $\boldsymbol{\sigma }$
will constitute Maxwell stresses (Wang, Miksis & Vlahovska Reference Wang, Miksis and Vlahovska2022), and for colloids in an electrolytic medium, it will include solute–surface interactions (Michelin & Lauga Reference Michelin and Lauga2014).
Regardless of the specific interactions dominant in a given scenario, particles in all fluid systems will encounter hydrodynamic stresses. Hence, it is prudent to separate the total force,
 $\boldsymbol{F}_{\boldsymbol{total}}$
, into two components: the total hydrodynamic drag,
 $\boldsymbol{F_D}$
, and the net external driving force,
 $\boldsymbol{F}$
. As the particle motion is unidirectional along a vertical, rectilinear path in our settling experiments, vector notation can be dropped. Therefore, we can simply write the force balance along the vertical
 $z$
axis as
 $F_{\textit{total}} = F - F_D$
. Adopting this simpler notation allows us to resolve the hydrodynamics problem separately from that of the driving force,
 $F$
. We can immediately write, for the case of gravitational settling,
 $F = F_g = (\rho _s - \rho _f)V g = \textrm{const.}$
, where
 $\rho _s$
and
 $\rho _f$
are respectively the densities of the sphere and the surrounding fluid,
 $V$
is the volume of the sphere and
 $g$
is acceleration due to gravity. Similarly, a spatially varying force, such as the induced magnetic attraction in our system, can be written as
 \begin{equation} F = F_0 f(\epsilon ). \end{equation}
Here,
 $F_0$
is a constant (with dimensions of force) and
 $f(\epsilon )$
is a function of the non-dimensional gap,
 $\epsilon$
. Following this general notation,
 $F_g$
is a special instance of the generalised force
 $F$
for
 $F_0 = F_g$
and
 $f(\epsilon ) = 1$
.
Irrespective of the nature of the driving force, the sphere is subject to hydrodynamic drag,
 $F_D$
, which depends on its proximity to the wall. Hence, the effective trajectory of the particle is determined by the interplay between the driving force and fluid drag:
 \begin{equation} \rho _s V z^{\prime \prime } = F - F_D. \end{equation}
Here
 $()^\prime$
denotes derivatives with respect to dimensional time,
 $t$
.
Since the left-hand side of (2.3) represents the inertia of the particle, we can immediately examine its relevance in determining its trajectory. To do so, we can estimate the starting/stopping time for inertial motion of the particle at speed
 $u$
as the ratio of the particle’s momentum (
 ${\sim} \rho_{s}\kern-1.3pt V\kern-1pt u$
) and the hydrodynamics forces (
 ${\sim} \mu u a$
) retarding its motion as
 $\rho _s V / \mu a \approx 10^{-4}$
s. Hence, compared with the kinematics of the settling trajectories we study that span
 ${\sim} 10^{-1} {-} 10^2$
s, any inertial motion of the sphere in the experiment, translational or rotational, is instantaneously brought to rest. In addition, we can inspect the typical Reynolds number,
 $\textit{Re} ={\rho_f} \textit{Ua}/ {\mu}$
, characteristic to the fluid motion induced by the translating sphere. In fact, the choice of fluid in our experiments was inspired by the numerous examples of interparticle and surface–particle interactions invoked in the previous section that share the feature that particle kinematics are slow and restricts the relevant Reynolds number to
 $\textit{Re} \ll 1$
. The maximum
 $\textit{Re}$
encountered in our experiments is
 ${\approx} 5 \times 10^{-6}$
. In combination, we can compare the inertia of the particle to the viscous drag it encounters, characterised by the Stokes number,
 $\textit{St} = ( {2}/{9}) \textit{Re} ( {\rho _s}/{\rho _f})$
, where
 $\rho _s/\rho _f \approx 8$
(see Appendix A), which gives
 $\textit{St} \ll 1$
. As a result, we can ignore the inertial term, simplifying the force balance in (2.3) further, as we will see in the next section. What we now require to determine the trajectory,
 $z(t)$
, of the particle are the expressions for the driving force,
 $F$
, or more specifically, the function
 $f(\epsilon )$
, and that of the hydrodynamic drag,
 $F_D$
. To this end, we first look at the drag force experienced by a sphere that is approaching a flat plane.
2.1. Hydrodynamic drag
Leveraging the low-Reynolds-number dynamics of fluid motion, the quasi-steady particle trajectory can be deduced to simplify (2.3) and follow the force balance
 $F = F_{D}$
. Furthermore, as we are interested in the dynamics close to contact, we ought only to focus on the thin gap limit, i.e.
 $\epsilon \rightarrow 0$
. Nonetheless, we begin by briefly exploring how hydrodynamic drag evolves as a particle approaches a plane, from an initially unbounded region (‘sky’) to the thin film limit (‘floor’), which is explicitly manifested in a sedimentation system such as ours. At least three distinct drag regimes can be identified from observing the path of a settling sphere. We first consider the free regime where the particle moves in an unrestricted, infinite fluid domain whose walls impose no effect on the particle’s motion. Far away from the floor, i.e.
 $\epsilon \rightarrow \infty$
or equivalently
 $\zeta \gg 1$
, the sphere progresses at a constant velocity. This is the unbounded or Stokes’ regime, where the hydrodynamic drag experienced by the sphere is given by
 $F_{\textit{Stokes}} = - 6 \pi \mu a u$
. The negative sign captures the direction of the force on the particle with respect to the direction of motion. In the experiments, spheres of radius
 $a = 1$
mm descend with speed
 $u = 0.255 \pm 0.003 \ \textrm{mm s}^{-1}$
, in agreement with the calculated Stokes speed,
 $u = F_g/(6 \pi \mu a) = 0.252 \ \textrm{mm s}^{-1}$
(using values reported in Appendix A). As the sphere approaches the floor, the velocity and pressure fields are modified by the proximal presence of the planar surface, both fields no longer decay symmetrically away from the particle whereby the hydrodynamic drag increases, and transitions from
 $F_{\textit{Stokes}}$
to
 $F_D = F_{\textit{Stokes}}(1 + ({9}/{8})\zeta^{-1})$
. This may be referred to as the Lorentz regime (Lorentz Reference Lorentz1897; Hasimoto Reference Hasimoto1996). Note that, here, the additional drag varies inversely with the instantaneous coordinate of the sphere centre,
 $\zeta = 1 + \epsilon$
. This regime is relevant where
 $\zeta \gtrsim 10$
but finite (see § 7.4 of Happel & Brenner Reference Happel and Brenner1983).
Finally, towards the end of its trajectory, as the sphere and the floor is separated only by a relatively thin film of fluid between them, i.e. as
 $\epsilon \rightarrow 0$
, hydrodynamic drag is dominated by lubrication pressures. At this limit, the drag force converges to the form
 \begin{equation} F_{D} = F_{\textit{Stokes}} \left [ \frac {1}{\epsilon } + \frac {1}{5}\ln {\frac {1}{\epsilon }} + k \right ], \end{equation}
where
 $k = 0.971264$
is a constant that recovers numerical accuracy with the full series solution derived by Cox & Brenner (Reference Cox and Brenner1967).
Having established a relatively complete physical picture of the approach, we once again focus on the experimental system (figure 1), i.e. the final trajectory of the sphere as it approaches the flat plane. In this limit, we can further simplify (2.4) by retaining only the dominant term, to recover the familiar lubrication drag law, attributed to G. I. Taylor (Cox & Brenner Reference Cox and Brenner1967):
 \begin{equation} F_D = F_{\textit{Stokes}} \frac {1}{\epsilon } = - 6 \pi \mu a^2 \frac {\epsilon ^\prime }{\epsilon }. \end{equation}
This asymptotic simplification deviates from the exact solution (Cox & Brenner Reference Cox and Brenner1967 – see equation (2.2) therein) by only
 ${\sim} 3 \,\%$
even as
 $\epsilon \sim 1/2$
and is as exact as
 $\epsilon \rightarrow 0$
. (As we will see in later sections, our experimental data also falls within this range of
 $\epsilon$
.)
The notable feature of the drag, (2.5), at this limit is that
 $F_D$
varies inversely with the non-dimensional thin film gap,
 $\epsilon$
. Consequently, the dynamic law governing the trajectory of the sphere, (2.3), becomes
 \begin{equation} 6 \pi \mu a^2 \frac {\epsilon ^\prime }{\epsilon } + F_0 f(\epsilon ) = 0. \end{equation}
Finally, simplifying this leads to the non-dimensional equation for the temporal evolution of the non-dimensional gap,
 $\epsilon$
, recovering (1.1),
 ${\dot {\epsilon }}/{\epsilon } + f(\epsilon ) = 0$
, where the time scale that emerges,
 $T = {6 \pi \mu a^2}/{F_0}$
, is used to normalise time, giving the non-dimensional time,
 $\tau = t/T$
. Henceforth, differentiation by
 $\tau$
will be denoted by
 $\dot {()}$
.
Now that we have simplified (2.3) to (1.1) at the thin gap limit, we are ready to analyse the two distinctive driving forces we have investigated experimentally. To this end, we begin by substantiating the methodology using the familiar case of gravity-driven sedimentation (
 $f(\epsilon ) = 1$
).
2.2. Gravity-driven sedimentation
To gauge the validity of (1.1), we begin by considering the case of the sphere settling under gravity, where
 $f(\epsilon ) = 1$
, and compare it against the trajectory data,
 $\epsilon - \tau$
, presented in figure 2. In this case, the constant driving force,
 $F$
, is the effective weight of the particle,
 $F_g = \rho _s V ( 1 - \sigma ) g$
, where
 $\rho _s V$
is the mass of the sphere of volume
 $V \sim a^3$
and density
 $\rho _s$
, and
 $g$
is acceleration due to gravity. The density of the fluid,
 $\rho _f$
, is normalised by the density of the particle,
 $\rho _s$
, to give
 $ \sigma = \rho _f / \rho _s$
. Since the particle is heavier than the surrounding fluid,
 $\sigma \ll 1$
. In (1.1), along with
 $f(\epsilon ) = 1$
, we therefore have
 $F_0 = F_g$
and
 $T = {9 \mu }/{2 \rho _s (1 - \sigma ) a g}$
, giving
 \begin{equation} \frac {\dot {\epsilon }}{\epsilon } + 1 = 0,\end{equation}
the solution to which is
 \begin{equation} \epsilon (\tau ) = \epsilon _0 {\rm e}^{ -(\tau - \tau _0) } ,\end{equation}
where
 $\epsilon _0 = \epsilon (\tau _0)$
is the initial condition, with
 $\tau _0$
representing the time beyond which the above asymptotic solution holds. This exponential evolution of gap closure under a constant force such as gravity takes us back to our initial discussion about how the efficiency of thin film lubrication manifests unintentionally as a primary barrier to various natural, biological and artificial processes that require interparticle and particle–wall contact to occur in finite time. The concurrence of experimental data with the solution (2.8) is evident in figure 2, where the experimental data, with length and time scales respectively normalised by
 $a$
and
 $T$
, are plotted. The black line is (2.8), where the initial condition,
 $\tau _0$
, is chosen such that
 $\epsilon _0 \rightarrow 1/2$
, per the condition for the validity and accuracy of this limiting solution that was discussed in § 2.1 (below (2.5)).
End trajectories
 $\epsilon - \tau$
of spheres of eight different diameters,
 $2 a$
, settling under gravity. Error bars indicate standard deviations from at least four repetitions. The expected exponential trajectory, (2.8), is the black line.

Here, the expression for the sedimentation time scale,
 $T \sim (\rho _s a)^{-1}$
, suggests that a larger, heavier particle will fall at a smaller (dimensional) time scale of the exponential decay, even though gap closure would still occur only as
 $\tau \rightarrow \infty$
no matter what the magnitude of the constant force is. This well-studied result (Mongruel et al. Reference Mongruel, Lamriben, Yahiaoui and Feuillebois2010; Xu et al. Reference Xu, Choi, Nagella and Takatori2023), which we have also revalidated experimentally, underlies the familiar problem of ‘infinite contact time’ in interparticle adhesion (Serayssol & Davis Reference Serayssol and Davis1986; Stone Reference Stone2005; Israelachvili Reference Israelachvili2011).
It is in this context that the strategy of using a non-constant, spatially varying driving force becomes relevant. In fact, systems in the natural world, where particles or surfaces approach each other in a fluid medium, are rarely driven by constant forces, especially at smaller spatial scales (Brangbour et al. Reference Brangbour, du Roure, Helfer, Démoulin, Mazurier, Fermigier, Carlier, Bibette, Baudry and Spudich2011). In the following section, we explore how forces that follow a non-trivial law,
 $f(\epsilon )$
, such as induced magnetic forces, modify the kinematics of sedimentation.
3. Particles driven by spatially varying forces
As we have seen in the illustrative experimental data presented in figure 1(c), the sphere driven by a magnet approaches the floor plane at a much higher rate than the one settling under its own weight (figure 1 b). This qualitative observation is intuitively expected, as the key feature, and advantage, of spatially varying attractive forces is that they accelerate the particle at higher magnitudes in a sequential manner. Broadly, such forces between particles, particle analogues, surfaces and interfaces are often cumulative forces originating from their material properties and those of the surrounding fluid. This is quickly recognisable in colloidal systems where the forces between surfaces depend on their surface charges, and the electrical properties of surrounding electrolytes (Squires, Messinger & Manalis Reference Squires, Messinger and Manalis2008).
A brief survey of such forces relevant to surfaces in close proximity reveals that there are two primary classes of spatially varying forces that are characterised by their dependence,
 $f(\epsilon )$
, on the thickness of the instantaneous gap separating the surface (
 $\epsilon$
). First, we have forces that follow
 $f(\epsilon ) = (d_0+\epsilon )^{-n}$
, where
 $d_0$
is a (non-dimensional) length scale and
 $n$
is an exponent that depends on the origin and nature of the interactions as well the geometry of the system. This includes all classical centre-to-centre forces such as electro/magnetostatic forces between uniformly charged spheres, where
 $d_0$
corresponds to the sum of their radii,
 $(d_0+\epsilon )$
is the distance between their centres. At the limit of a sphere and a semi-infinite plane, as in the case we study here,
 $(d_0+\epsilon )$
is thedistance between the plane and the position of the effective induced dipole (see, for instance, § 11.2 of Purcell Reference Purcell2013). When the dipole coincides with the geometric centre of the sphere,
 $d_0 = 1$
, i.e. the radius of the particle. Thus, the magnetic driving force in our experiments follow
 $f(\epsilon )=(1+\epsilon )^{-n}$
. As we see later in § 3.2, for finite systems,
 $d_0$
may not identically be equal to 1. Second, a number of well-known dispersion forces follow a power law of the form
 $f(\epsilon ) = \epsilon ^{-n}$
. The primary example of this class of forces is the family of van der Waals interactions.
In table 1 we catalogue a selection of interactions that exhibit a power-law behaviour of either form. The exponent,
 $n$
, in
 $f(\epsilon )$
is the primary factor that dictates the kinematics of the particle, and the values or ranges of
 $n$
for a spherical particle driven towards a plane are tabulated. Constant forces such as gravity is trivially retrieved for
 $n=0$
. A notable classical example in table 1 is the van der Waals adhesion between a sphere and a plane, which follows the power law
 $f(\epsilon ) = \epsilon ^{-n}$
for
 $n=2$
. (Note that
 $n$
depends on the geometry of the interacting surfaces. While we have limited our analysis to the sphere–plane geometry in this work, it can be extended to particle pairs of other geometries. For a selection of force relations for van der Waals interactions between other geometries, we refer the reader to § 13.2 of Israelachvili Reference Israelachvili2011).)
A condensed list of known interactions of various origins. Such spatially varying forces typically exhibit a power-law relation with the gap
 $\epsilon$
, of the form
 $f(\epsilon ) = \epsilon ^{-n}$
or
 $f(\epsilon ) = (d_0 + \epsilon )^{-n}$
, where
 $d_0$
is a length scale inherent to the system. The numerical range into which the value of the exponent,
 $n$
, for each force type is listed. For well-known named interactions,
 $n$
is determined from the corresponding interaction energy,
 $\mathit{U}$
, as
 $F = -\boldsymbol{\nabla } \mathit{U}$
. For the other interactions, the value of
 $n$
depends on other system parameters, and its range is summarised from prominent literature (Leckband & Israelachvili Reference Leckband and Israelachvili2001; Israelachvili Reference Israelachvili2011).

The role of van der Waals interactions on sphere–wall interactions have been previously explored theoretically (Serayssol & Davis Reference Serayssol and Davis1986), and have been shown to effect finite-time contact, overcoming lubrication stresses. However, their low magnitude,
 $F_0 \sim 10^{-12} {-} 10^{-8} \textrm{N}$
, and short range of influence,
 $\epsilon \sim 10^{-6} {-} 10^{-5}$
, make them unamenable to experimental probing at the single particle level. Looking beyond dispersion forces, macroscale systems exhibiting electrolyte mediated colloidal interactions show similar behaviour, i.e.
 $f(\epsilon ) = \epsilon ^{-n}$
, where
 $n$
has been theoretically shown to depend on reaction/adsorption rates and surface charge densities (Yariv Reference Yariv2016, table 1). While it is challenging to explore colloid–wall systems experimentally at the single particle level, our magnetic experiments are easily implemented for individual particles. Surprisingly, in contrast to power-law forces of the form
 $f(\epsilon ) = \epsilon ^{-n}$
that enable a scale-free descent assuring particle–wall contact in finite time (§ 4), we will see that despite ‘pulling’ the particle with increasing force, the magnetically driven particle succumbs to an exponential trajectory towards the end of its travel (§ 3.1).
3.1. The trajectory of a magnetically driven sphere
Invoking (1.1), the dynamics of the magnetically driven sphere can be written for
 $f(\epsilon ) = (1+\epsilon )^{-n}$
as
 \begin{equation} \frac {\dot {\epsilon }}{\epsilon } + \frac {1}{(1 + \epsilon )^{n}} = 0. \end{equation}
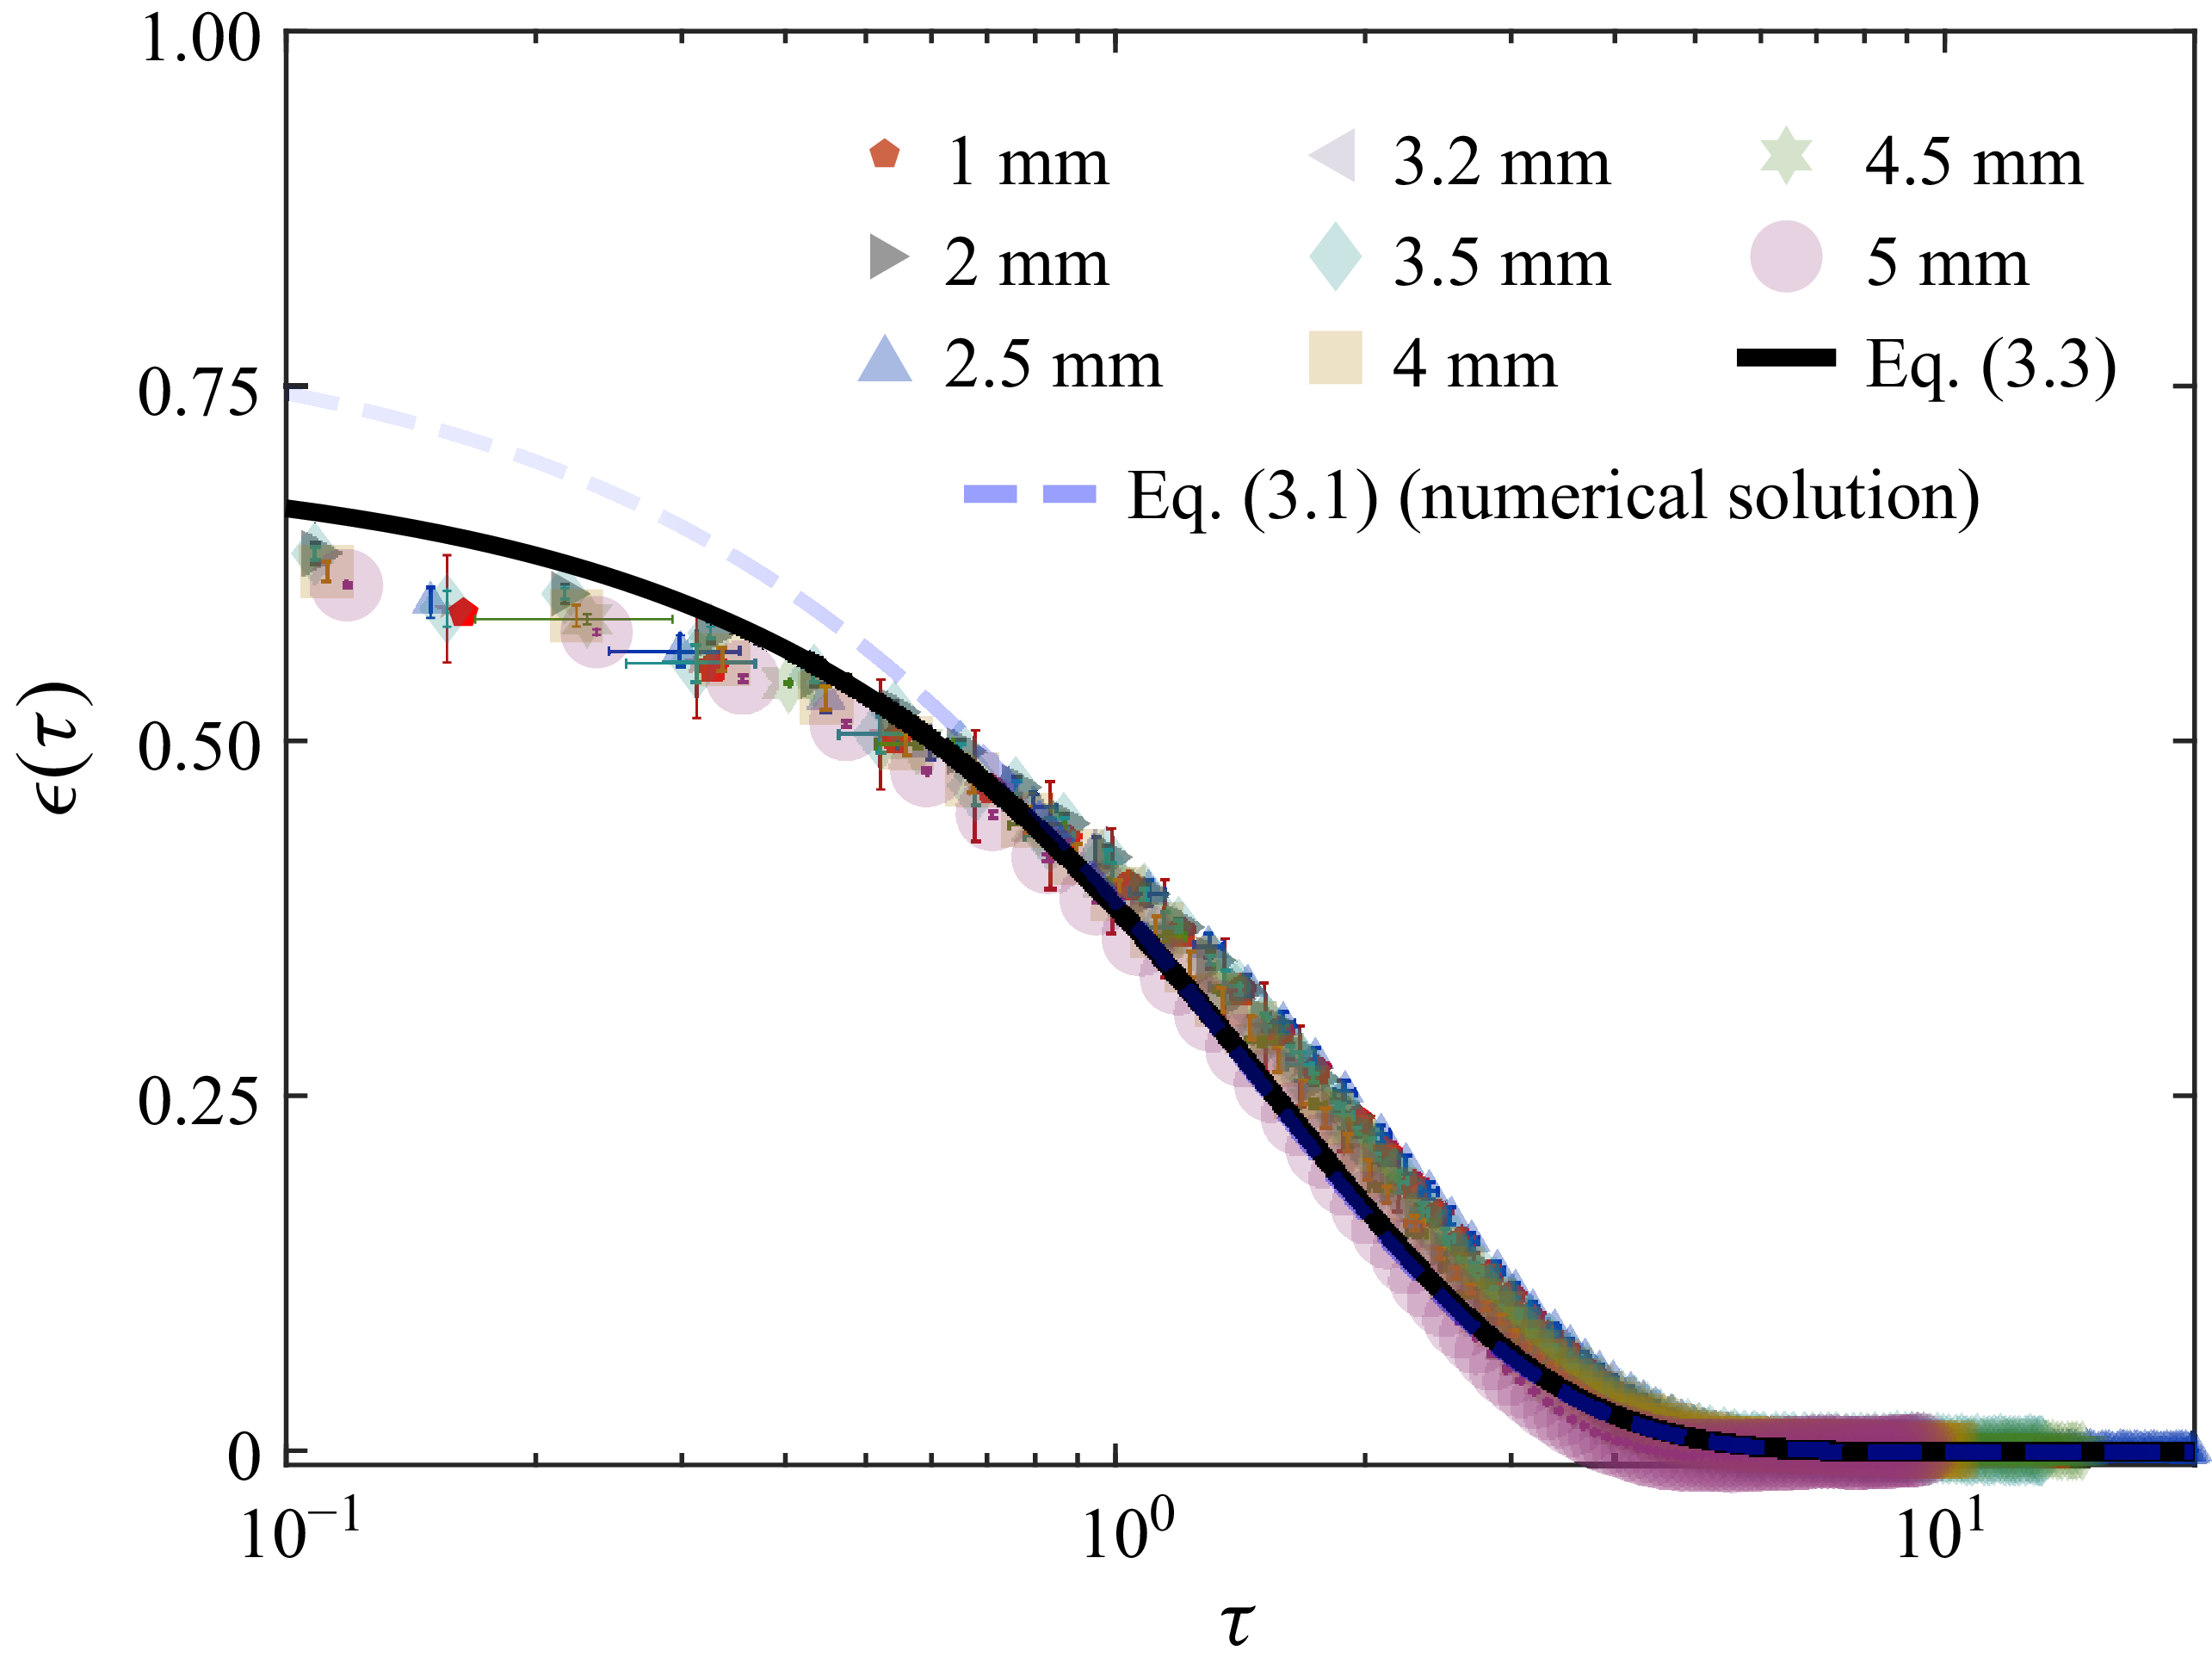
Equation (3.1) is solved numerically and presented as a dashed blue line in figure 3. To seek an analytical solution, we can further simplify (3.1) using a Taylor expansion of
 $f(\epsilon )$
to leading order at the limit
 $\epsilon \rightarrow 0$
, whereby (3.1) becomes
 \begin{equation} \dot {\epsilon }+ \epsilon - n \epsilon ^2 = 0. \end{equation}
This equation is an instance of the Bernoulli differential equation, the solution to which is
 \begin{equation} \epsilon (\tau ) = \frac {\epsilon _0}{ n \epsilon _0 + \left (1- n {\epsilon _0} \right ){\rm e}^{\tau - \tau _0} }. \end{equation}
Consistent with the gravity-driven case (2.8) the initial condition is
 $\epsilon _0 = \epsilon (\tau _0)$
, and the non-dimensional time is
 $\tau = t/T$
, where
 $T = {6 \pi \mu a^2}/{F_0}$
. We have seen that, for the case of gravity-driven settling,
 $F_0 = F_g$
, and thence the characteristic time is
 $T \propto a^{-1}$
. For power-law interactions, however, the qualitative and quantitative dependence on particle size,
 $a$
, differs. First, we note that in the present case, the magnetic attraction in full dimensional form is
 $F = M / (a + \delta )^n$
, where
 $M = F_0 a^n$
and
 $\delta = a \epsilon$
, as previously defined (see figure 1
a). The classical approach to calculating induced dipole interactions in a sphere placed in a uniform external magnetic field suggests that the coefficient,
 $M$
, scales with the volume,
 $V\sim a^3$
, of the sphere (see, for example, § 9.08 of Smythe Reference Smythe1989). Incorporating this, we get
 $F_0 = ma^{3-n}$
for
 $M = m a^3$
. Consequently, the time scale over which magnet-driven settling occurs scales as
 $T \propto a^{-(1-n)}$
. It is worth noting that both (3.1) and (3.2) are valid only when
 $\epsilon \lt 1/2$
, limited by the accuracy of the drag term (see (2.5)). This is clear from figure 3 where (3.3) (solid black line) merges with the numerical solution to (3.1) (dashed blue line) and experimental data (points) only as
 $\epsilon \lt 0.5$
.
End trajectories of spheres of different radii,
 $a$
, approaching the surface under magnetic forcing, a varying force of the form
 $F = F_0/(1+\epsilon )^{n}$
. The black line denotes the analytical solution (3.3) for the limit
 $\epsilon \rightarrow 0$
, and conjoins the numerical solution to (3.2) (dashed blue line) as
 $\epsilon \lt 1/2$
. Here, the best-fit values
 $m = 10^{5.8}$
for
 $F_0 = ma^{3-n}$
, proportional to induced magnetisation, and
 $n = 0.75$
, are consistent with direct force measurements (see § 3.2 and figure 5). Error bars indicate standard deviations from at least four repetitions.

To comprehend what the solution, (3.3), entails intuitively, we revisit (3.2) and examine the asymptotic limit where the
 $\mathcal{O}(\epsilon ^2)$
term becomes insignificant. We are immediately left with the equation
 $\dot {\epsilon }+ \epsilon = 0$
, which is the same as (2.7). This implies that the final trajectory exhibits the exponential decay characteristic of a constant driving force (in our experiments, gravity), sufficiently close to the surface, but over a different time scale
 $T = {6 \pi \mu a^2}/{F_0}$
. We observe exactly this behaviour in the trajectory data shown in figure 3. The effect of a variable force that follows
 $f(\epsilon ) = (1+\epsilon )^{-n}$
manifests as a quick descend towards the surface, followed by an exponential fall over the rest of the path. In the magnet-driven trajectory laid out in figure 1(c), the sphere traverses the distance from
 $\epsilon = 0.1$
to
 $\epsilon = 0.01$
in 0.0832 s, as opposed to 10.06 s for the gravity-driven sphere in figure 1(b). The solutions to (3.3) for other values of
 $n$
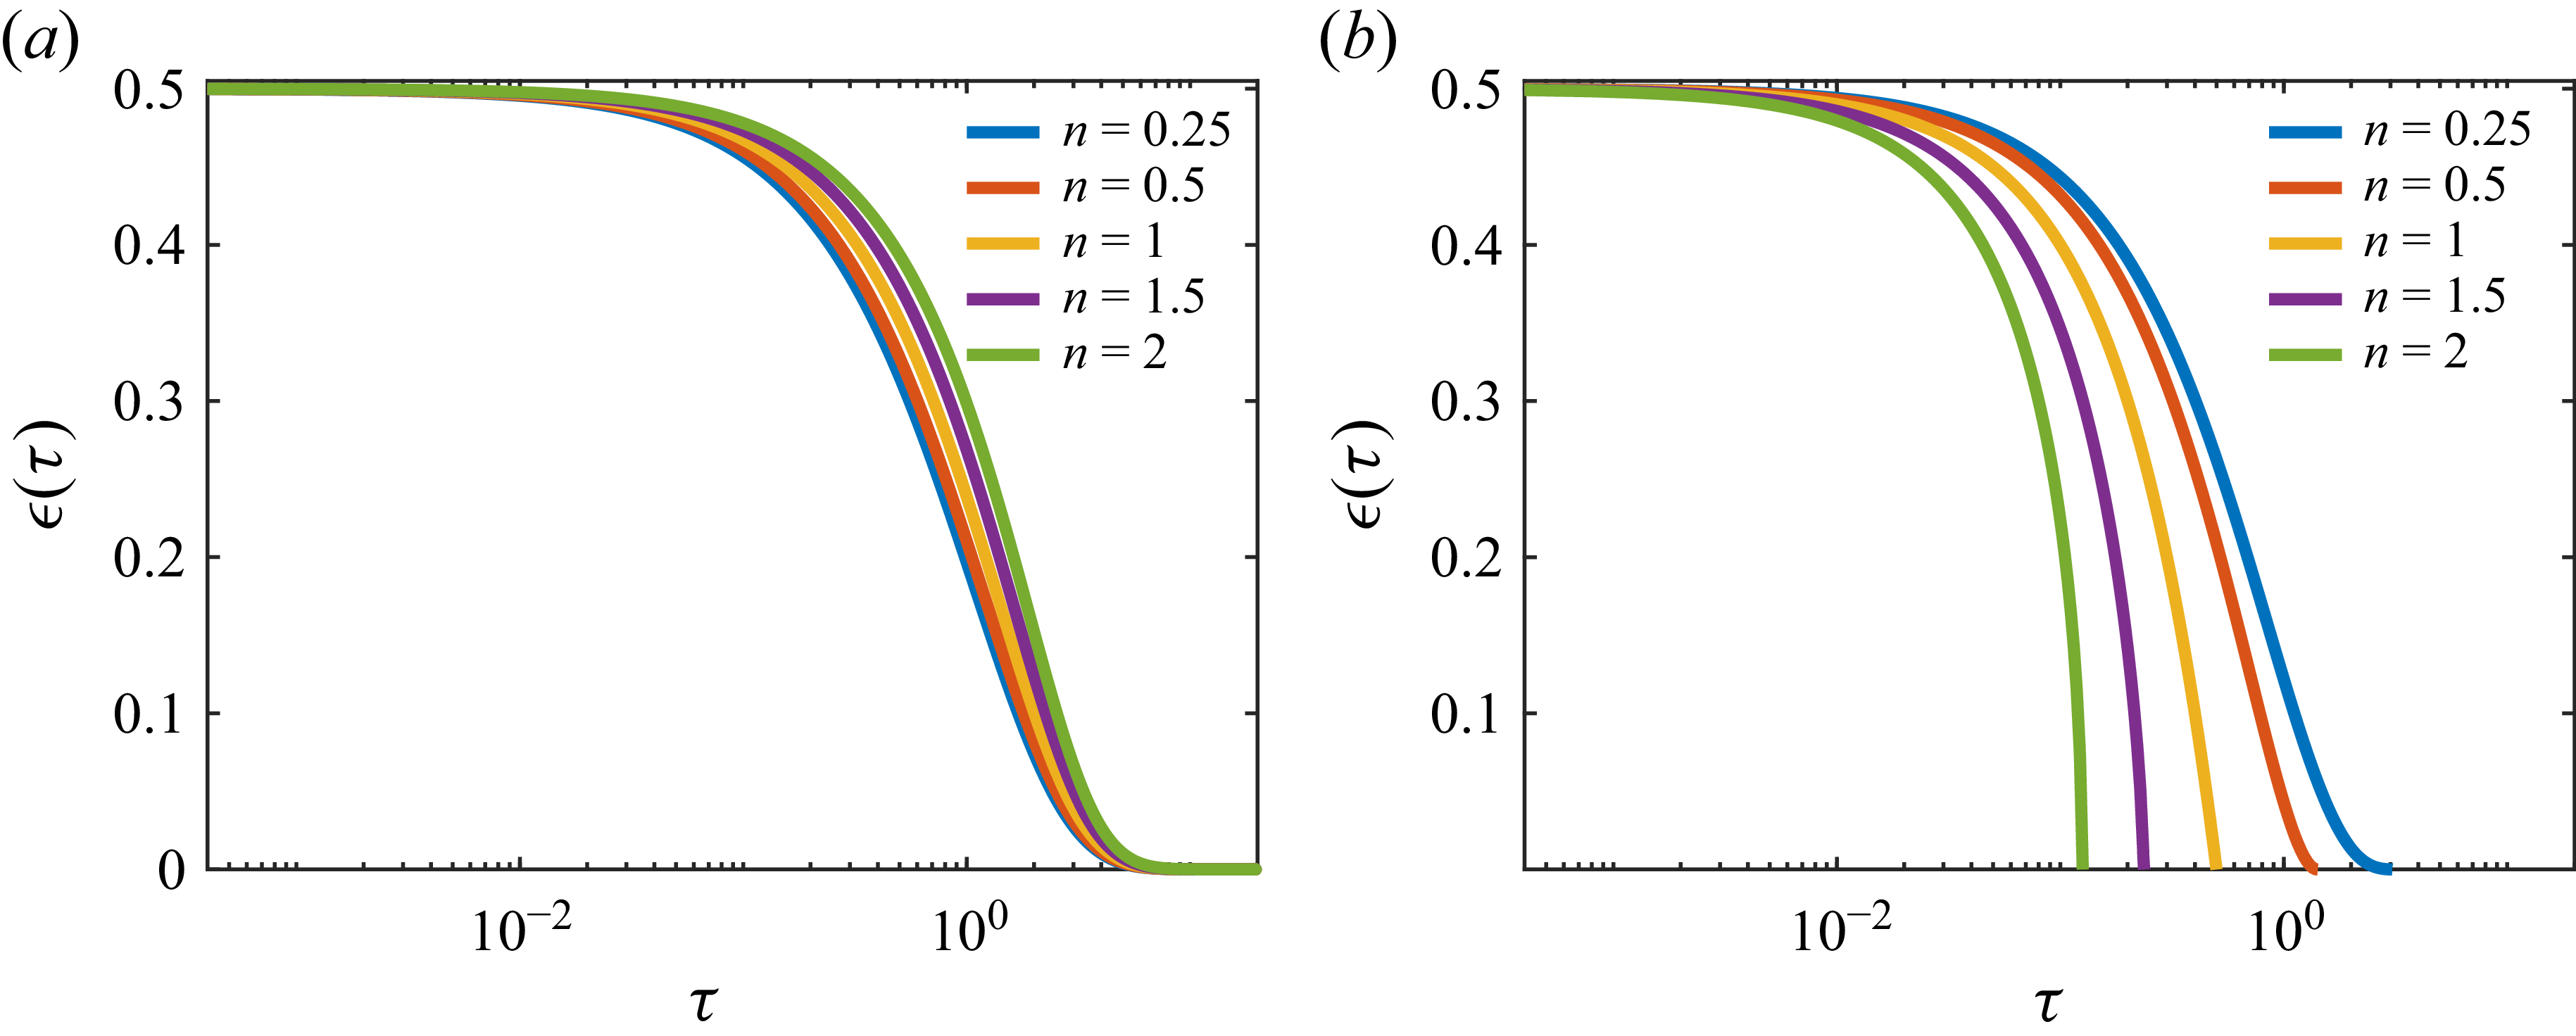
are plotted in figure 4(a), where the deviation of the particle’s trajectory away from the constant-force case (i.e.
 $n = 0$
) with increasing values of
 $n$
is evident. Here,
 $F_0$
is the magnitude of the driving force
 $F$
at
 $\epsilon = 0$
. As the value of
 $n$
increases,
 $F$
drops more rapidly, leading to a quicker transition of (3.2) to (2.7).
Family of particle trajectories approaching a flat surface in response to spatially varying driving forces. The plots indicate the effect of the exponent,
 $n$
(see table 1), for forces of the same magnitude
 $F_0$
, with the same initial condition
 $\epsilon (0) = \epsilon _0 = 0.5$
. (a) Solutions of (3.1) where a spherical particle is driven by a force of the form
 $f(\epsilon ) = (1 + \epsilon )^{-n}$
, such as by magnetic forcing realised in our experiments. (b) Solutions to (4.1) that govern particle kinematics in response to
 $f(\epsilon ) = \epsilon ^{-n}$
for different values of
 $n$
(see table 1). Note that these trajectories achieve contact, i.e.
 $\epsilon = 0$
in finite time, at
 $\tau = \epsilon _0^n /n$
. Furthermore, the particle is seen to briefly decelerate prior to contact when
 $n\lt 1$
, while it ‘snaps’ onto the surface when
 $n\gt 1$
.

This counterintuitive result contradicts the behaviour expected for a sequentially accelerated particle. Since the lubricant film mitigates magnetic forcing prior to contact, we can quantify the effect of the spatially varying force in reducing the overall time to contact, by exploring where the transition to ‘constant-force’ behaviour sets in. To do so, we can take a look at the nature of
 $\dot {\epsilon }$
and inflections in the rate at which the gap closes, which corresponds to the relative dominance of the drag term over the driving force. From the plots of
 $\epsilon (\tau )$
in figure 3, note that the rate of descend (slope) increases over time, and briefly achieves maximum velocity, before dropping exponentially towards the end of its trajectory. Seeking the local maxima of
 $\dot {\epsilon }$
, setting
 $\ddot {\epsilon } = 0$
, we find that the critical point is
 $\epsilon _c = 1/2n$
at non-dimensional time
 $\tau _c = \tau _0 + \ln {[n \epsilon _0/(1 - n \epsilon _0)]}$
. Beyond this critical point, the exponential solution begins to dominate the kinematics of the sphere. Thus, it can be concluded that the sphere driven by such a force,
 $F \sim (1+\epsilon )^{-n}$
, traverses the thin gap beginning at
 $\epsilon _0(\tau _0)$
faster than when settling under a constant force of the same magnitude,
 $F_0$
, by a duration of approximately
 $\Delta \tau \approx \ln {[n \epsilon _0/(1 - n \epsilon _0)]}$
. The dependence of
 $\Delta \tau$
on
 $n$
is once again evident in figure 4(a), which indicates how
 $\epsilon (\tau )$
deviates farther from the exponential trajectory corresponding to
 $n = 0$
with increasing values of
 $n$
.
3.2. Determining
 $f(\epsilon )$
from kinematic data

In the preceding analysis, while we retained the generality of
 $n$
and
 $F_0$
, we saw that the experimental data are consistent with the model for the values of
 $F_0 = ma^{3-n}$
for
 $m = 10^{5.8}$
and
 $n = 0.75$
found by a least-squares fit. In this section we see that these values correspond to those determined from independent, direct measurements of the force
 $F(z)$
(and hence
 $f(\epsilon )$
). Details of the experimental set-up are furnished in Appendix A.
Returning to the general formulation of the magnetic interaction implemented in our experimental system, the specific functional form of
 $f(\epsilon )$
can be understood from a brief consideration of classical electromagnetic/electrostatic interactions between point charges, dipoles, etc., whose dependence on the separation are well understood (Smythe Reference Smythe1989), of which the inverse square law for point charges is perhaps the most familiar example. In these cases, the spatial dependence is typically a function of the centre-to-centre distance, i.e.
 $ \epsilon + d_0$
, the sum of the gap,
 $\epsilon$
, and the total geometric length,
 $d_0$
(also normalised here by
 $a$
). For ideal point charge/dipole interactions,
 $n$
is typically a positive integer. However, we are faced with a new challenge when dealing with particles/surfaces in close proximity, as the cumulative forces between them deviate from a point-like behaviour. Hence,
 $n$
is not necessarily an integer in these cases. This is because, in physical systems, the net forces are the result of cumulative local dielectric interactions and dispersion forces between the molecular constituents of the particles and intercalant media, and their geometry (Van Saarloos et al. Reference Van Saarloos, Vitelli and Zeravcic2023). In general, the immediate consequence of this is reflected in the function
 $f(\epsilon )$
as a general ambiguity in the definition of the length scale,
 $d_0$
. For the case of our experimental system where a large planar permanent magnet interacts with a sphere of radius
 $a$
,
 $d_0$
depicts the distance between the place and the effective centre of induced magnetisation in the sphere. The position of the effective magnetic dipole within the sphere coincides with its geometric centre for all
 $a$
when the external field is uniform. However, as the magnitude of the field due to the permanent magnet varies with
 $\zeta$
, and is stronger at the base of the sphere, the effective dipole is shifted below the sphere’s centre by
 $(1-d_0)$
. In our experimental system with a large planar permanent magnet interacting with a sphere whose dimensions are smaller, in comparison, which emulates a semi-infinite, uniform, strong magnet, the position of the effective induced dipole is expected to coincide approximately with the geometric centre of the sphere due to symmetry, whereby
 $d_0 \approx 1$
.
As we saw in § 3.1, the magnetic driving force is given by
 $F = F_0/(1+\epsilon )^n$
where
 $F_0 = ma^{3-n}$
. Here,
 $m$
can be interpreted as a magnetic force density and is proportional to the induced magnetisation of the ferromagnetic sphere and
 $m \sim (8 \pi )/(3 \mu _0 \mu _r)$
(see, e.g. § 9.03 of Smythe Reference Smythe1989), where
 $\mu _0 = 4 \pi \times 10^{-7}$
is the magnetic permeability of free space and
 $\mu _r$
is the relative permeability of the material of the sphere (for steel,
 $\mu _r \approx 10$
). This gives
 $ m \sim 10^{(6 + \text{log}_{10}[2/3])} \approx 10^{5.824}$
, closely matching the value obtained from least-squares fitting of measured force-gap data and kinematic measurements (figure 3).
Direct force measurements of the magnetic attraction induced in metallic spheres are presented as
 ${F}/{F_0} - (1 + \epsilon )$
for spheres of eight different diameters,
 $2a$
. The force follows a power law of the form
 $f(\epsilon ) = (1+\epsilon )^{-n}$
that is plotted as the dashed line for the best-fit value of
 $n = 0.75$
. Here
 $F_0 = ma^{3-n}$
, where
 $m = 10^{5.8}$
, validating the force law estimated from purely kinematic data in § 3.1 and figure 3. The force data shows deviations from the power law for
 $f(\epsilon )$
, for larger spheres as their effective dipole may not coincide with their geometric centres (see § 3.2).

The force data are produced in figure 5, where the measured force
 $F$
is normalised by
 $F_0$
. The dashed line is the equation
 $F/F_0 = 1/(1+\epsilon )^{n}$
for
 $m = 10^{5.8}$
and
 $n = 0.75$
. Unsurprisingly, the force data does not collapse onto the theory line for all radii,
 $a$
, for the aforementioned reasons. Qualitatively, spheres of smaller diameters,
 $2a$
, appear to collapse to the dashed line in figure 5, especially for large
 $\epsilon$
, suggesting that
 $d_0 \approx 1$
in the far field. However, when the sphere is close to the surface, the effective dipole centre may shift from the centre of the sphere, closer to the base, due to the large local gradient in the magnetic field. We observe that this shift is pronounced only in spheres of larger radii. Therefore, while not inconsistent with the experimental data for the broad range of radii presented in this work, our analysis applies more accurately to relatively smaller values of
 $a$
, where the induced dipole remains coincident with the geometric centre, i.e.
 $d_0 \approx 1$
, keeping with the various examples that has motivated this study.
This method could be of special relevance to studying immersed particle systems where in-situ force measurements are impossible to realise, such as in biological samples. In order to implement this, the spatial resolution of data capture must be adequate to probe the range
 $\epsilon \ll 1$
with a temporal resolution
 ${\sim} T$
. For instance, for a vesicle (
 $a \sim 1 \,\unicode{x03BC} \mathrm{m}$
) driven by cytokinetic actin–myosin networks with a force of magnitude
 ${\sim} 100 \,{\unicode{x03BC} N}$
(Phillips Reference Phillips2013), this corresponds to an image resolution of
 ${\sim} 0.01 \,\unicode{x03BC} \mathrm{m}$
in time steps of
 $ \sim 2 \,\unicode{x03BC} \mathrm{s}$
. Microscopy being the primary non-invasive tool available to us, data of such resolution will allow extracting information of
 $n, F_0$
from kinematic data.
4. Effecting particle–wall contact in finite time
In the preceding sections, we encountered the counterintuitive result that despite enhancing the force on a particle near contact temporally, induced magnetic forces and other interactions of the form
 $f(\epsilon ) = (1+\epsilon )^{-n}$
fall short of overcoming hydrodynamic drag at the thin gap limit. As the analysis of the above phenomenon revealed, while the trajectories of magnet-driven spheres in figure 3 approach the plane at faster rates, they transition to an exponential path towards the end of their paths. This leaves a major question in our investigation unanswered: Can a particle traverse the intercalant fluid at the thin gap limit in finite time? Furthermore, what types of interactions can effect a ‘snap’ contact, i.e. when the particle does not slow down prior to contact?
To answer these questions, we first resort to the classical concept that van der Waals type forces can overcome the thin gap singularity characteristic of lubrication drag (Serayssol & Davis Reference Serayssol and Davis1986; Leckband & Israelachvili Reference Leckband and Israelachvili2001), which has been explored widely in the context of immersed collisions and colloidal coagulation (Zeichner & Schowalter Reference Zeichner and Schowalter1979).
In our work, this corresponds to the second major class of
 $f(\epsilon )$
, namely forces that vary as
 $\epsilon ^{-n}$
. Several familiar, well-formulated forces, such as van der Waals interactions, London dispersion forces and Stefan adhesion follow such a power law, the respective values of
 $n$
for which are consolidated in table 1. Notably, this class of interactions are devoid of additional (geometric) length scales such as
 $d_0$
, unlike the magnetic force contrived in our experimental set-up. While these short-range forces are challenging to implement experimentally, we will extend our theoretical model that has been validated experimentally for the two cases (gravitational and magnetic driving forces) discussed in previous sections. Once again, rewriting (1.1) for this case (
 $f(\epsilon ) = \epsilon ^{-n}$
) as
 \begin{equation} \frac {\dot \epsilon }{\epsilon } + \frac {1}{\epsilon ^{n}} = 0, \end{equation}
we see that, in contrast to the corresponding (3.1), we can directly integrate (4.1) to yield
 \begin{equation} \epsilon (\tau ) =\left [ \epsilon _0^n -n \left ( \tau - \tau _0 \right ) \right ]^{\frac {1}{n}}. \end{equation}
It is worthwhile to visualise the above solution for an expository set of values of
 $n$
to highlight two of its notable features, depicted in figure 4(b). The first remarkable consequence of such a trajectory is the scale-free evolution of the gap in time. Thus, the particle is guaranteed to achieve contact in a finite time, crossing the thin film barrier from
 $\epsilon _0(\tau _0)$
to
 $\epsilon = 0$
within the duration,
 $\Delta \tau = \epsilon _0^n /n$
. Secondly, we can focus on the slope of the curves at touch down. From (4.1), we readily have
 $\dot {\epsilon } = - \epsilon ^{1-n}$
. Clearly, for
 $n = 1$
, the trajectory falls at a constant rate of
 $-1$
. This is a peculiar case where both the driving force and fluid drag scales inversely with
 $\epsilon$
, and balances one another perfectly. It is interesting to note that
 $n=1$
forces have not been reported, to the best of our knowledge, and hence, do not appear in table 1, which is consolidated with examples from prominent literature. For
 $n\lt 1$
, typically observed between macroscale particles or clusters of point dipoles,
 $\dot {\epsilon }$
can be seen to diminish as the gap closes, decelerating briefly before contact. In contrast, when
 $n\gt 1$
, i.e. for short-range forces such as van der Waals, London and Stefan interactions, the magnitude of
 $\dot {\epsilon }$
increases prior to contact, such that the particle may be considered to ‘snap’ onto the planar surface.
5. Concluding remarks
Particle–wall contact is central to numerous biological, chemical and artificial processes. Though, these processes are mostly fluid mediated, the role of hydrodynamic drag and its interplay with arbitrary forces of myriad origins driving their dynamics are often neglected. This work utilises a magnetic driving force as an analogue for such spatially varying forces and isolates its effect on achieving contact between a spherical particle and a flat plane. Specifically, the magnetic interaction implemented in the experimental system imitates spatially varying forces that follow a power law of the form
 $f(\epsilon ) = (1+\epsilon )^{-n}$
. We report the counterintuitive result that though this force sequentially accelerates the sphere towards contact, its effect is mitigated by lubrication drag near contact. We saw that while such forces eventually result in an exponentially devolving trajectory akin to that due to a constant force, it delays the onset of the exponential behaviour to much smaller gap heights. On the other hand, forces of the form
 $f(\epsilon ) = \epsilon ^{-n}$
definitively achieves contact in finite time. We ought to remember that both types of forces coexist in physical systems. Revisiting table 1, we see that forces that follow
 $f(\epsilon ) = \epsilon ^{-n}$
are typically short-range dispersion forces, which become dominant only at very close proximity between interacting surfaces or particles. Hence, we can presume that regardless of the form and magnitude of the driving force at finite separation, towards the end of its trajectory, a particle may be brought to contact by a short-range dispersion force, i.e. particles on paths plotted in figure 4(a) could transition to trajectories in figure 4(b) prior to contact. Extending this classical concept, we show that
 $n \geqslant 1$
can lead to a ‘snap’ contact. This can be relevant to colloidal dynamics and may be achieved via exploiting tunable chemical reaction rates (Yariv Reference Yariv2016) or active polymer grafts (Xu et al. Reference Xu, Choi, Nagella and Takatori2023).
It is interesting to note that one may come across force laws that do not immediately follow from standard interaction forces. Namely, following the standard assumption that interaction energies,
 $\mathit{U}$
, are additive (Israelachvili Reference Israelachvili2011), one may encounter cases where particles exhibit the counterintuitive law,
 $f(\epsilon ) = 1/(1-\epsilon )$
, which follows from the infinite geometric series
 $\sum _{k=0}^{\infty } \epsilon ^k = 1/(1 - \epsilon )$
for
 $|\epsilon | \lt 1$
, consistent with our range of
 $\epsilon$
, when a particle experiences a combination of numerous repulsive, dispersion forces of similar magnitude.
An alternative approach to realise finite-time contact would be to modify the effect fluid drag,
 $F_D$
, at the thin film limit, (2.5), so that the obstructive force no longer scales as
 $\epsilon ^{-1}$
. Efforts to realise this have made use of modifications to the surface properties of the particle/wall to introduce surface interactions that evolve over time scales comparable to
 $T$
, using polymeric surface patches (Xu et al. Reference Xu, Choi, Nagella and Takatori2023) or relaxing the no-slip condition at the wall surface by introducing micropillars (Chastel & Mongruel Reference Chastel and Mongruel2019).
A major consequence of our analysis is the possibility of estimating the driving force,
 $F \sim f(\epsilon )$
, from kinematic data, as elucidated in § 3.2. Conversely, a better deterministic understanding of varying forces afforded by our analysis may be exploited to improve processes that are reliant on surface interactions, given the advent of self-assembly as a major tool in fabrication processes. Since this study was motivated by our experiments, where a varying force was realised using steel spheres interacting with a permanent magnet, our focus has been limited to rigid, smooth particles. Nonetheless, our analysis may, in principle, be extended to systems of other geometries (Stone Reference Stone2005), where the same interplay of forces can be observed between surfaces in close proximity. In numerous scenarios, transient deformations of interacting surfaces can result in more complex dynamics, which we leave for future investigations.
Declaration of interests
The authors report no conflict of interest.
Appendix A. Experimental details
A.1. Experimental set-up and data capture
The experimental system briefly described in § 1 and depicted schematically in figure 1(a), comprises a transparent, cuboidal acrylic box of side 10 cm, bearing a high viscosity silicone oil (Sigma–Aldrich 200) with a kinematic viscosity of
 $60,000$
cSt (at
 $25^\circ$
C) and aspecific gravity of 0.98. Steel ball bearings (WJMY Precision Chrome Steel Bearings) of eight different diameters,
 $2a = 1, 2, 2.5, 3.2, 3.5, 4, 4.5, 5$
mm, were used. The density of the steel alloy was
 $\rho _s = 7780\ \textrm{kg m}^{-3}$
. The spheres were cleaned and wetted using the same oil prior to carefully dropping them into the fluid bath along the centre of the container.
The trajectories of each sphere were captured using a high-speed camera (Chronos 1.4, Kron Technologies). As each sphere translates at a different rate, and traverses the height of the frame over different durations, the maximum possible frame rate was chosen for each sphere. Temporal resolution therefore ranged from 0.9 to 5.6 ms across the experiments. The spatial resolution of the image data was in the range 2.23–2.32
 $\unicode{x03BC} \textrm{m/pixel}$
. For each radius, the experiment was repeated at least four times each for gravity-driven and magnet-driven cases. From the video data, the trajectory was extracted by tracking a single point at the border of the sphere that is seen as a circle in the backlit frames, as shown in figure 6. The calibrated data from the multiple repetitions were binned and compiled, and presented in figures 2 and 3, where error bars denote standard deviations within each time bin. For magnet-driven settling experiments, modifications were made only to the settling tank, which are described below.
A montage of selected frames from the end trajectory of a
 $a = 1.25$
mm sphere settling under magnetic attraction captured using a high-speed camera with a spatial resolution of
 $2.23 \,\unicode{x03BC} \mathrm{m}$
. The time interval between successive frames is
 $0.953 \,\textrm{ms}$
. The red arrows denote the measured quantity, the gap,
 $\delta$
.

A.2. The magnetic system
The concept behind the implementation of the magnetic, spatially varying force in our experiments is rather straightforward. Placing a permanent magnet of infinite extents beneath the fluid reservoir in the sedimentation apparatus described in the preceding section would overlay a uniformly directed magnetic field with its magnitude decaying from its peak strength at the base (
 $z=0$
) towards the top of the tank. However, since all finite magnets exhibit edge effects, we modify the system further using what we label as a ‘diffuser lens’ for the magnetic field lines. The magnet used at the base of the reservoir is a cylindrical neodymium (N45) magnet of diameter 70 mm and height 35 mm (Supermagnete, Germany). From the magnetic field data reported by Abelmann, Gwag & Sung (Reference Abelmann, Gwag and Sung2024) (see figures 3 and 4 therein), for a magnet of the same dimensions, make and source, we identify a region of uniform, axisymmetric field around the central axis of the magnet. However, at the limit of thin gaps that we investigate in this work, both the magnetic field and its gradients are strong enough to induce transverse forces on the sphere, given the axisymmetry of the magnetic field.
To improve the uniformity in the direction of the magnetic field, and consequently the force experienced by the sphere to be unidirectional along
 $z$
, we draw inspiration from the concept of Halbach arrays (Choi & Yoo Reference Choi and Yoo2008). Noting the stacked arrangement of slender grains on a cuboidal ferrite magnet of side 25 mm, we place it within the tank, to act as a diffuser/lens for the magnetic field. In order to avoid skewing of the magnetic field due to the presence of the ferrite block, we first allow the block magnet to come to its rest position, and perturb it over several cycles, till it consistently returns to the equilibrium position. The uniformity of the diffused field is noticeable at once from particle trajectories, which remain staunchly vertical. For the magnetic experiments, the metallic sphere settles onto the top surface of the submerged ferrite block, which is defined as
 $z = 0$
, rather than the base of the reservoir.
A.3. Experimental set-up for magnetic force measurements
In order to validate the theoretical model describing the magnet-driven trajectory, namely, the exponent
 $n$
and
 $F_0$
that manifests as the denominator in the characteristic time scale,
 $T$
, we make direct measurements of the induced magnetic attraction. A selection of spheres is attached to a pedestal extending from the tip of a cantilever load cell (TAL221, HT Sensor Technology Co.; HX711 ADC, M5Stack). The purpose of the pedestal is to isolate any magnetic attraction that the metallic load cell tip may experience directly, and is therefore made of a polymer (PETG).
The force data are recorded at different values of gap separation,
 $\delta$
, along the centreline of the reservoir, retracing the same path along which the spheres travel to determine
 $F = F_0 f(\epsilon )$
relevant to our experiments. Gap thickness is found using the same video camera.