
I. INTRODUCTION
Titanium diboride (TiB2) is a covalent ceramic with hexagonal unit cell symmetry (space group P6/mmm). Reference Vallauri, Adrián and Chrysanthou1 It is a very compelling material for use in military and civilian applications requiring high strength and superior abrasion resistance due to its high modulus of elasticity (E = 565 GPa) at 298 K, low temperature coefficient of elastic modulus ([dE/dT] = −0.032 GPa/K), and an ultrahigh Vicker’s hardness (25–34 GPa at 298 K). Reference Ziemnicka-Sylwester2,Reference Panda and Ravi Chandran3 It is also known as an effective neutron absorber. Reference Ray4 In addition, TiB2’s ultrahigh melting temperature (T m = 3225 ± 20 °C Reference Cutler5 ) makes it a material of interest for high temperature applications. Reference Chiang, Birnie and Kingery6–Reference Li, Lü, Lai, Li and Liu9 Besides, TiB2 is being utilized as an electrode material in electrolytic processing of aluminum due to its chemical inertness. Reference Li, Lü, Lai, Li and Liu9 Furthermore, TiB2 is also used as an additive to obtain fine grain size in aluminum castings. Reference Li, Lü, Lai, Li and Liu9,Reference Mohanty and Gruzleskit10 That is so because of TiB2’s surface thermodynamic compatibility with and its low solubility in molten aluminum. Reference Mohanty and Gruzleskit10 And, despite being a strongly covalent solid, it also exhibits good metallic and thermal conduction, i.e., ∼15 × 10−6 Ω cm at 298 K and 96 W/m K at 298 K, respectively. Reference Huang, Vanmeensel, Malek, Van der Biest and Vleugels11
The major challenge in processing of TiB2 powder is its poor sinterability into a dense polycrystalline solid due to low self-diffusivities of species in covalently bonded ceramics and its high tendency for oxidation. Generally, commercial submicron TiB2 powder contain ∼2 wt% oxygen, whereas the same in coarser powder is typically ∼1 wt% oxygen. Reference Kulpa and Troczynski12 Surface oxidation due to residual oxygen during powder synthesis is typically considered to be the root cause of accelerated grain coarsening and poor sinterability of TiB2. Reference Baik and Becher13 An earlier work Reference Ferranti and Thadhani14 on TiB2 has established that residual oxygen is partitioned between the titanium and boron forming their respective oxides, i.e., TiO2 and B2O3. Hence, sintering aids such as carbon are preferred to ensure the proper reducing conditions during sintering whereby oxidation of TiB2 can be prevented. Reference Kulpa and Troczynski12,Reference Baik and Becher13
Polycrystalline TiB2 powder can be densified to near full density by utilizing a plethora of processing methods including conventional sintering, Reference Suskin and Chepovetsky15–Reference Einarsrud, Hagen, Pettersen and Grande19 hot pressing, Reference Tennery, Finch, Yust, Clark, Viswanadham, Rowcliffe and Gurland20 hot isostatic pressing, Reference Torizuka and Kishi16,Reference Torizuka, Nishio and Kishi17,Reference Holcombe and Dykes21–Reference Muraoka, Yoshinaka, Hirota and Yamaguchi23 microwave sintering, Reference Holcombe and Dykes21 and dynamic compaction. Reference Wang and Wixom24 However, the aforementioned low self-diffusivities of the constituent ions require a densification temperature of at least 2000 °C (∼2/3T m where T m = 3225 ± 20 °C Reference Rudy25–Reference Duschanek, Rogl and Lukas27 ). Such high densification temperatures also favor grain growth that is not desirable. Most importantly, the large anisotropy of the hexagonal unit cell causes internal stresses that ultimately lead to spontaneous microcracking during cooling from high temperature after sintering is completed. Reference Raju28–Reference Matsushita and Sano30 Prior studies have shown that grain growth in TiB2 can be limited while enhancing densification by using sintering aids such as Cr, CrB2, C, Ni, NiB, and Fe in 1–10 wt% concentration. Reference Raju28–Reference Matsushita and Sano30 In doing so, the densification temperature can be reduced to 1700–1800 °C, concomitantly keeping the densification time below 60 min. Reference Raju28–Reference Matsushita and Sano30 It was also shown that TiB2 can be sintered to higher densities by the hot pressing technique at temperatures as low as 1425 °C in 2–8 h if Ni additions are used. Reference Tennery, Finch, Yust, Clark, Viswanadham, Rowcliffe and Gurland20 Although such sintering aids have proven to be very beneficial in obtaining a dense polycrystalline ceramic by sintering, the unavoidable partial grain boundary segregation of such additives leads to a decrease in high temperature fracture strength and creep rupture stress. Reference Tennery, Finch, Yust, Clark, Viswanadham, Rowcliffe and Gurland20
Recently, it has been demonstrated that ceramic materials can be hot consolidated (sintered) at temperatures that are typically 30–70% of their conventional densification temperatures and in unprecedented sintering times that are 1–2 orders of magnitude smaller than the fastest sintering rates ever achieved by any method in any system. This process is called flash sintering Reference Cologna, Rashkova and Raj31 (FS) or burst mode densification Reference Akdoğan, Şavklıyıldız, Biçer, Paxton, Toksoy, Zhong and Tsakalakos32 (BMD). For instance, yttria stabilized tetragonal zirconia can be fully densified in 5 s at 850 °C by applying a nominal 120 V/cm dc electric field (conventional sintering temperature is >1200 °C) so as to induce FS and/or BMD. Reference Cologna, Rashkova and Raj31 The BMD technique has been successfully applied to a wide range of oxide ceramics including Co2MnO4, Ce0.8Gd0.2O1.9, and MgO doped Al2O3. Reference Grasso, Hu, Maizza, Kim and Sakka33–Reference Hao, Liu, Wang, Qiao and Sun35 And, very recently, the BMD technique was also successfully applied to B4C leading to densification over 95% the x-ray density in ∼324 s at 711 °C under an applied field of 45 V/cm. Reference Biçer, Akdoğan, Visser, Şavklıyıldız, Özdemir, Zhong and Tsakalakos36 In the B4C system, as in the case of other properly BMD’ed ceramics, no significant Joule heating was observed. Reference Raj37 While the exact origins of the ultrafast and ultralow thermally activated mass transport in BMD remains unknown, it is currently believed that grain boundary controlled complex electromigration processes that are completely absent under zero electric field conditions play an important role. Reference Akdoğan, Şavklıyıldız, Biçer, Paxton, Toksoy, Zhong and Tsakalakos32–Reference Hao, Liu, Wang, Qiao and Sun35
It follows from the preceding explanations that the successful hot consolidation of TiB2 ceramics depends strongly on the mode and manner in which a given TiB2 in particulate system responds to the applied superimposed applied thermal and electric fields. Although there are some reports on the oxidation behavior of TiB2 in the literature, Reference Kulpa and Troczynski12,Reference Baik and Becher13,Reference Graziani, Landi and Bellosi38–Reference Lee, Lee and Kim43 one is deprived of studies focusing on electric field induced oxidation in this material which is what this study attempts to remedy by bringing ultrafast, in situ and time-resolved ultrahigh energy dispersive x-ray diffraction (EDXRD) to bear. While attempting to elucidate the response of TiB2 to superimposed applied electric and thermal fields, we discovered peculiar electric field induced changes in chemical and phase equilibria in nano-TiB2 containing residual TiO2 and TiBO3 from synthesis which is frequently the case in commercially available powder. As such, the present study provides a detailed quantitative account of electric field effects on nano-TiB2 containing TiO2 and TiBO3 while being heated. We will show that the consequences of the applied electric field are vastly electrochemical rather than thermal in the temperature range of interest.
This article is organized as follows: in Sec. II, we give a detailed account of the experimental method used in this study since there is no precedent to the approach reported herein. The experimental results are presented in Sec. III where we describe the electric field driven and thermally activated evolution of multiphase equilibria in the TiB2 system. In Sec. IV, we provide an in depth discussion on the effects of electric field on chemical and phase equilibria based on fundamental thermodynamics and kinetic concepts as well as relevant computational work. We conclude the article with Sec. V where we conclude that the phenomena observed in this study is of electrochemical origin and speculate on potential new avenues for further work in this line of research.
II. EXPERIMENTAL
The experimental study reported herein was carried out at the superconducting wiggler beam line X17-B1 in the National Synchrotron Light Source (NSLS) of Brookhaven National Laboratory (BNL), Upton, New York. We have used polychromatic radiation with photon energies as high as 200 keV for this in situ ultrahigh EDXRD study. The said high photon energies enabled us to collect data with a time resolution (Δt) as low as 2 s that is otherwise not possible with conventional laboratory or soft x-ray synchrotron techniques based on the Bragg–Brentano technique. Reference Akdoğan, Şavklıyıldız, Biçer, Paxton, Toksoy, Zhong and Tsakalakos32
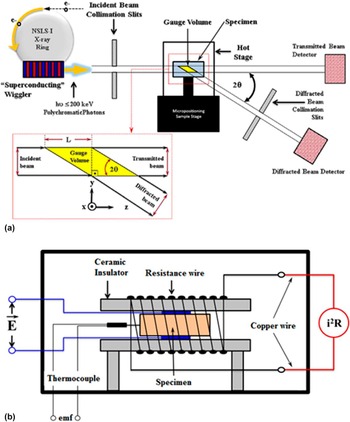
Figure 1(a) Reference Akdoğan, Şavklıyıldız, Biçer, Paxton, Toksoy, Zhong and Tsakalakos32 depicts a schematic illustrating the specifics of the diffraction technique we utilized in this study. Here, an ultrahigh energy polychromatic incident beam of photons is scattered at a fixed Bragg angle as shown and scattered intensity is measured by a germanium solid state detector. Reference Li, Weidner, Chen, Vaughan and Davis44,Reference Wang, Durham, Getting and Weidner45 The incident and scattered beam collimating slit openings, and the fixed Bragg angle define the so-called gauge volume [GV; see the inset in Fig. 1(a)]. The said GV is translated in the specimen and placed on its body center at which point it becomes the diffraction volume. In other words, the said technique is essentially a transmission method (Laue mode Reference Spence, Zatsepin and Li46 ) where the specimen under test is stationary and so is the diffraction volume. Reference Steuwer, Santisteban, Turski, Withers and Buslaps47 An in-house custom-made hot stage (HS), as illustrated in Fig. 1(b), Reference Akdoğan, Şavklıyıldız, Biçer, Paxton, Toksoy, Zhong and Tsakalakos32 was used to heat the sample while a dc electric field was applied to it in the parallel plate geometry. Reference Akdoğan, Şavklıyıldız, Biçer, Paxton, Toksoy, Zhong and Tsakalakos32 The HS is comprised of a spring loaded ceramic (insulator) specimen holder that is resistively heated to which leads are attached to apply the electric field. The said HS enclosure is mounted on the positioning stage and exposed to the beam (see Fig. 1). Reference Akdoğan, Şavklıyıldız, Biçer, Paxton, Toksoy, Zhong and Tsakalakos32
Schematic illustration of (a) ultrahigh energy dispersive x-ray diffractometry X17-B1 beamline at NSLS I, BNL. The inset shows the geometrical relationships between the gauge (diffraction) volume and the incident and diffracted beams, (b) custom HS used in the in situ study wherein the specimen is mounted in the parallel plat capacitor geometry that is resistively heated. Reference Akdoğan, Şavklıyıldız, Biçer, Paxton, Toksoy, Zhong and Tsakalakos32

The governing EDXRD equation, which was obtained by combining the Bragg’s law 48 nλ = 2d hkl sin θ hkl (here n is the order of reflection and λ the wave length of the radiation used) with the Planck–Einstein equation Reference Kubaschewski and Komarek49 E = hν where ν = c/λ (here ν is the linear frequency and λ is the wave length), as shown in Eq. (5)
 $${1 \over {{d_{hkl}}}} = \left( {{{2\,\sin \,{\theta _{hkl}}} \over {hc}}} \right){E_{hkl}} = \left| {{Q_{hkl}}} \right|\quad ,$$
was used to obtain the lattice parameters of the phases of interest as a function of time. Here, d hkl is the interplanar spacing of the atomic plane with Miller indices (hkl), θ is the Bragg angle (1.5° in this study), h is the Planck’s constant (6.626 × 10⁻³⁴ J s), c is the speed of light (2.9979 × 10⁸ m/s), E hkl is the scattered energy from lattice plane (hkl), and |Q hkl | is the magnitude of the reciprocal lattice vector pertaining to (hkl) in real space. Here, E hkl is the measured quantity. As such, measuring E hkl is equivalent to measuring the magnitude of the reciprocal lattice vector Q hkl directly, which is why one is able to determine d hkl with great accuracy. Here, the energy calibration was accomplished by using Ag, Au, Cu, CeO2, TiO2, and LaB6 (NIST SRM 660) standards. Reference Holtz, Holtz, Munro and Asher50 The patterns were cross checked against the powder diffraction database by which standard qualitative and quantitative x-ray phase analyses were accomplished. The patterns were then indexed, and the hexagonal lattice constants (a and c) of the TiB2 were computed. Reference Pais51–Reference Aivazov and Domashev53
Commercial TiB2 powder Reference Baur and Khan54 of 58 nm primary particle size, as reported by the manufacturer, 48 and 125 nm median aggregate size (secondary), as measured by laser diffraction was used. Binder-free disks of 12 mm diameter and ∼2.5 mm in thickness were uniaxially pressed under 4 tons. Figure 2 depicts a scanning electron microscopy (SEM) image of the as-received powder. Typical as-pressed densities of such specimens were ∼%50 of the x-ray density.
SEM micrograph of the commercial TiB2 powder used in this study. The primary particle size is 58 nm.

In the first part of this experimental study, TiB2 specimens were heated with 20 °C/min heating rate under zero electric field to 600 °C while data were collected with Δt = 3 s, resulting in over 500 time resolved x-ray spectra. In the second part of this study, TiB2 specimens were heated with 20 °C/min heating rate to 650 °C while dc electric fields of either 16 V/cm or 40 V/cm in magnitude were applied. The temperature and leakage current through specimens were monitored. Data were collected with Δt = 3 s and Δt = 2 s in the experiments performed with 16 V/cm or 40 V/cm, respectively. Each specimen was cooled to room temperature under zero field once 600 °C was reached while data collection continued with the same Δt. All experiments were carried out in an inert atmosphere using Argon gas (99.9995% purity) the estimated oxygen content of which was <0.5 ppm. In addition, we have collected x-ray spectra at 298 K in the beginning and after the completion of each experiment with a Δt = 10 s to establish the net footprint of the superimposed thermal and electrical cycle to which the specimens were subjected.
III. RESULTS
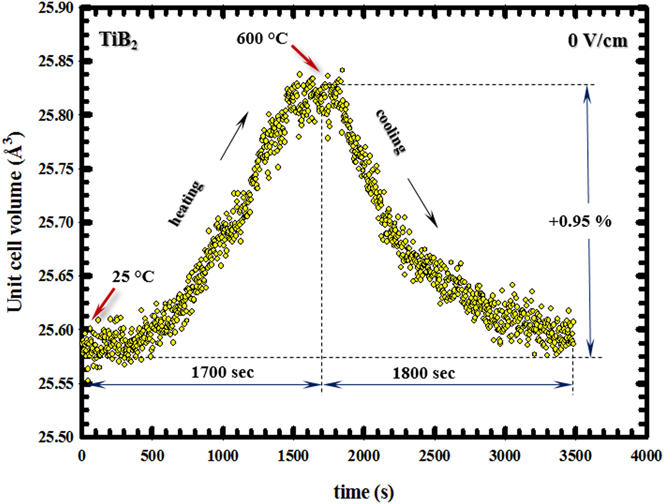
Figure 3 shows the response of the nano-TiB2 hexagonal unit volume to the applied thermal field over the range RT–600 °C in the absence of an electric field. Here, the temporal range from 0 to 1700 s refers to the ramp up (heating) while the range 1700–3500 s is the cool down. The volumetric hexagonal unit cell expansion reached 0.95% at 600 °C. Regression analysis to the hexagonal lattice parameters (not shown) yielded a linear thermal expansion of 6.60 × 10⁻⁶ K−1 for the basal plane ([100] direction) and 9.28 × 10⁻⁶ K−1 along the hexagonal axis ([001] direction). The response depicted in Fig. 3 was used as the baseline in the ensuing analysis because the unit cell expansions due to thermal and electric fields are additive as per the superposition principle. In what follows, we shall assess the effect of a superimposed applied electric field on the hexagonal unit cell volume of TiB2 while it is being heated with the same heating rate as in the zero electric field experiment.
Variation of TiB2 unit cell volume from RT to 600 °C under zero field. Heating rate was 20 °C/min in pure argon atmosphere. The cooling curve is also included. The data represent pure thermal expansion and contraction.
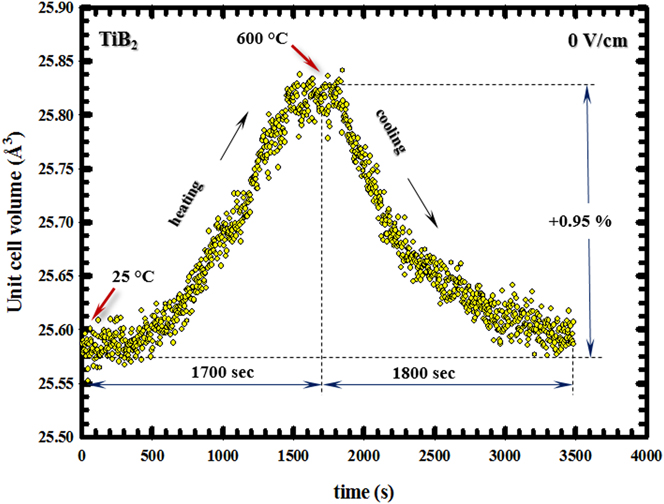
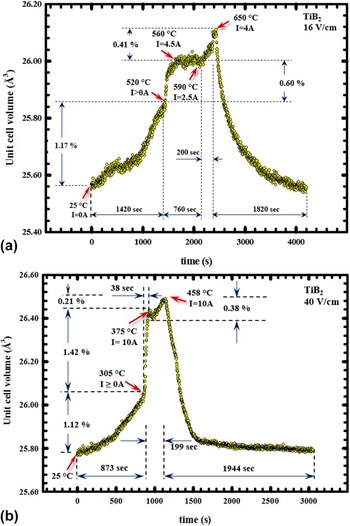
Figure 4(a) depicts the effect of 16 V/cm electric field on the nano-TiB2’s unit cell volume while it was heated 20 °C/min to 650 °C. The unit cell volume expansion reached 1.17% in 1420 s, and the nano-TiB2 system became conductive at 520 °C. From 520 to 560 °C, which covers a span of ∼60 s, the current rapidly increased from 0.1 to 4.5 A and is accompanied by 0.6% dilation of the hexagonal unit cell volume. Thermal expansion considerations suggest that the volume dilation from 520 to 560 °C that is thermally induced should be 0.03%. The balance of the volumetric dilation (0.6%) is, therefore, 0.57% which we postulate as an adiabatic process involving a burst of charge through the unit cell corresponding to the 4.5 A current spike at 560 °C. The burst to 4.5 A at 560 °C was followed by a plateau in unit cell volume dilation spanning 700 s over which the current declined to 2.5 A at 590 °C. Another rapid current rise from 2.5 A to 4.0 A occurred from 590 °C to 650 °C in 200 s that was accompanied by 0.41% unit cell dilation of which 0.05% is attributed to thermal expansion and the balance is postulated as an adiabatic process involving a burst of charge through the unit cell corresponding to the 4.0 A current spike at 650 °C. Figure 4(b) shows the effect of 40 V/cm electric field on the nano-TiB2’s unit cell volume while it was heated 20 °C/min to 460 °C—the point of the maximum current cut off. The unit cell volume expansion reached 1.12% in 873 s, and at 305 °C the nano-TiB2 system became conductive. From 305 to 375 °C, which covers a span of ∼40 s, the current rapidly climbed from 0.1 to 10.0 A and is accompanied by an enormous 1.42% dilation in the hexagonal unit cell volume. Thermal expansion considerations suggest that the volume dilation due to the thermal field from 305 to 375 °C should be 0.6%. The balance of the volumetric dilation is, therefore, 0.82% which we postulate as an adiabatic process involving a burst of charge through the unit cell corresponding to the 10.0 A current spike at 375 °C. The burst to 10.0 A at 375 °C was followed by a plateau in unit cell volume dilation spanning 87 s over which the current declined to 5.0 A. Another rapid current rise from 5.0 A to 10.0 A occurred where a peak temperature of 458 °C was reached. The said rapid rise in current was accompanied by a 0.38% unit cell dilation of which 0.03% is attributed to thermal expansion. The remaining 0.35% expansion is postulated as an adiabatic process involving a burst of charge through the unit cell corresponding to the 10.0 A current spike at 458 °C. Interestingly, neither the TiO2 nor the TiBO3 phases underwent any observable anomalous unit cell dilation. This observation indicated that the bulk of the current burst was carried by the TiB2 phase which we attribute to its high conductivity. Reference Huang, Vanmeensel, Malek, Van der Biest and Vleugels11 However, substantial and peculiar changes in chemical and phase composition were observed due to the applied electric field on which we will elaborate in what follows.
Variation of TiB2 unit cell volume (a) under 16 V/cm from RT to 650 °C and (b) under 40 V/cm from RT to 458 °C. The heating rate was 20 °C/min in pure argon atmosphere. The cooling curve from 650 °C–RT under zero field is also included.

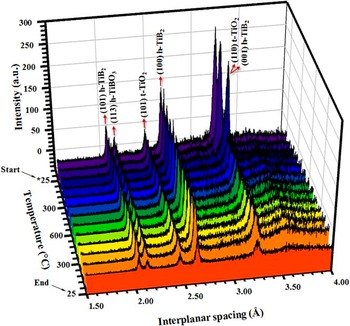
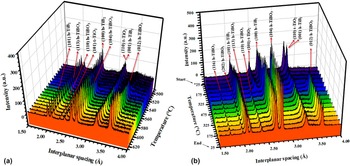
Figure 5 depicts selected representative EDXRD spectra (chosen out of >500 measured spectra) of TiB2 powder that underwent a thermal cycle consisting of heating from room temperature (25 °C) to 600 °C at 20 °C/min without an applied electric field, followed by cooling back to room temperature under identical conditions. No new Bragg peaks in the TiB2 spectra were observed when the sample was heated and cooled under the indicated conditions. No discernable increase in the intensity of all three phases’ Bragg peaks was observed which is indicative that the thermal treatment applied to the system did not change the phase composition in the considered temperature range. Furthermore, no changes in peak widths were observed which leads one to conclude that there were no changes in the crystallinity of the phases. In other words, the thermal treatment had no observable impact on the system in the range RT–600 °C and under null electric field. On the other hand, Fig. 6 demonstrates the evolution of phase equilibria under 16 V/cm [Figs. 6(a)] and 40 V/cm [Fig. 6(b)] applied electric field magnitudes while the system was heated with 20 °C/min to 650 and 458 °C, respectively. As it can be easily discerned on Figs. 6(a) and 6(b), the applied electric field caused changes in the phase composition of the system over the aforementioned temperature range as manifested by the appearance of new Bragg peaks that are otherwise absent under zero electric field conditions which we will discuss next.
Time/temperature resolved synchrotron EDXRD spectra of the nano-TiB2–TiO2–TiBO3 when heated from RT to 650 °C under zero field with 20 °C/min in pure argon. The spectra on cooling to RT under zero field are also included. No changes in phase composition are seen, i.e., indicative of no oxidation of TiB2 in pure argon atmosphere. Here, h represents hexagonal, t represents tetragonal, and * on the temperature axis shows the starting point of the experiment.

Time/temperature resolved synchrotron EDXRD spectra of the nano-TiB2–TiO2–TiBO3 when heated at 20 °C/min in argon (a) under 16 V/cm from RT to 650 °C and (b) under 40 V/cm from RT to 458 °C. The burst in current occur at 520 °C and 305 °C for 16 V/cm and 40 V/cm, respectively, causing changes in phase composition. Here, h represents hexagonal and t represents tetragonal. The temperature scale that is different between (a) and (b) is used for illustrative purposes to show the changes in phase compositions as temperature range in which changes are observed are different under 16 V/cm and 40 V/cm.

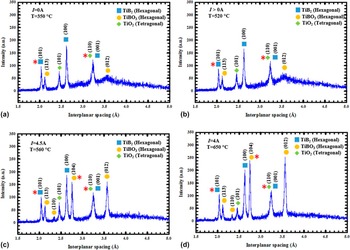
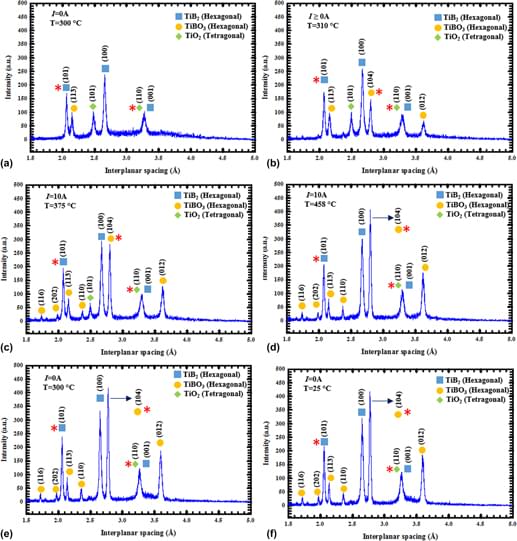
The data in Fig. 7 show selected representative x-ray spectra (chosen out of >500 measured spectra) that appertain to the oxidation of TiB2 when a dc electric field of 16 V/cm was applied while being heated to 650 °C with 20 °C/min. Here, one firstly observes the precipitous appearance of the TiBO3 (012) in the spectrum, the intensity of which reached ∼66% of that of the TiB2 (100) peak in t < 10 s, as soon as the temperature reached 560 °C. The TiBO3 (104) peak appeared after the TiBO3 (012) peak, reaching an intensity of ∼150 a.u. in ∼30 s. The intensities of the TiBO3 (113) and TiO2 (101) peaks, which were already present at RT prior to the experiment, did not change appreciably as compared to the (012) and (104) peaks of TiBO3. Normally, the (104) Bragg reflection in the TiBO3 system is the strongest and is followed by the (012) according to the literature. Reference Aivazov and Domashev53 Specifically, TiBO3 (104) and TiBO3 (012) are the 100% and 64.6% Bragg reflections, respectively. Reference Aivazov and Domashev53 However, in the experiment reported herein, one observes that the final peak intensities of the TiBO3 (104) and (012) reflections are approximately equal to each other. This finding is indicative that the applied field induced some texture to the crystallites in the powder along (012). The TiB2 (100) peak also exhibited a slight rise in intensity with the first burst in current but no appreciable change in peak intensity occurred due to the second current burst.
Selected synchrotron EDXRD spectra of nano-TiB2–TiO2–TiBO3 at different instants of the experiment under 16 V/cm when heated from RT to 650 °C showing changes in phase composition due to current bursts at 520 °C. Here, * on the spectra represents 100% peaks as listed in Powder Diffraction File database.

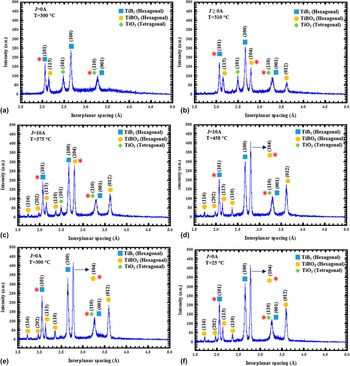
Figure 8 depicts selected representative x-ray spectra (chosen out of more than 500 measured spectra) that appertain to the oxidation of TiB2 when a dc electric field of 40 V/cm was applied while being heated to 460 °C as before. In this case, the specimen becomes conductive in 14 min at ∼305 °C. Here, the TiBO3 (012) Bragg reflection appears in the EDXRD spectrum precipitously (t < 10 s) as soon as current leakage exceeded 0.1 A with increasing temperature under nonisothermal heating. The precipitous appearance of TiBO3’s (012) reflection is followed by the (104) reflection. The intensities of the TiBO3 (012) and (104) Bragg reflections reached 70 and 150 a.u. within 20 and 16 s; successively. We have also observed an increase in the TiB2 (100) peak intensity as the temperature and current reached 305 °C and 0.1 A, respectively. Maximum intensity of the TiBO3 (104) Bragg peak reached ∼450 a.u. while that of the TiB2 (100) reached only ∼340 a.u. The observed temporal evolution of phases under nonisothermal conditions and as a function of electric field was analyzed by quantitative phase analysis by utilizing all full set of data (over 500 spectra per experiment) which will be discussed next.
Selected synchrotron EDXRD spectra of nano-TiB2–TiO2–TiBO3 at different instants of the experiment under 40 V/cm when heated from RT to 458 °C, showing changes in phase composition due to current bursts at 305 °C. Here, * on the spectra represents 100% peaks as listed in powder diffraction file database.

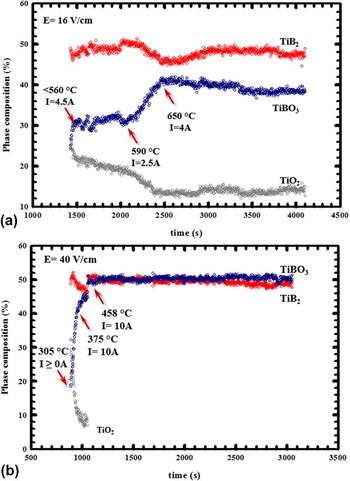
Figure 9 depicts the results of time resolved quantitative EDXRD phase analysis as a function of applied electric field magnitude. The formation of the TiBO3 phase from TiB2 and TiO2 phases is triggered by the current with an onset temperature of 520 °C [see Fig. 9(a)] and 305 °C [see Fig. 9(b)] for 16 V/cm and 40 V/cm applied electric field magnitudes, respectively. The said onset temperature is found to be inversely proportional to the applied electric field magnitude. By comparing Figs. 9(a) and 9(b), one also notices that the rate of TiB2 conversion into TiBO3 upon reacting with TiO2 exhibited a pronounced electric field dependence with the rate increasing as the applied electric field magnitude is increased. Focusing on the case for 16 V/cm, one observes that the formation of TiBO3 from TiB2 and TiO2 takes place in three nonisothermal stages: (i) from 520 to 560 °C at a rate of 0.2%/s increase in TiBO3 with a peak current draw of 4.5 A, (ii) from 560 to 590 °C no change in TiBO3 content (within experimental scatter) for 490 s over which the current draw decreases from 4.5 to 2.5 A, and (iii) from 590 to 650 °C at a rate of 0.025%/s increase in TiBO3 with a peak current draw of 4.0 A. Moreover, one also observes that the increase in the TiBO3 phase composition is accompanied by respective decreases in the phase compositions of TiB2 and TiO2. This, in turn, suggested that the formation of TiBO3 is due to a solid state reaction between TiB2 and TiO2 and is induced by the applied electric field. Here, the range spanning t > 2500 represents cooling to room temperature under zero electric field during which no further changes in chemical and phase equilibria are observed. On the other hand, a close look to the data appertaining to the formation of TiBO3 from TiB2 and TiO2 under 40 V/cm [see Fig. 9(b)] also reveals three nonisothermal stages: (i) from 305 to 375 °C at a rate of 0.4%/s increase in TiBO3 with a peak current draw of 10.0 A, (ii) from 375 to 455 °C at a discernably low rate of 0.06%/s over 110 s with the current draw staying level at 10 A, and (iii) from 455 to 458 °C at a rate of 2.0%/s increase in TiBO3 with a peak current draw of 10 A. As compared to the case with 16 V/cm, the formation of TiBO3 consumes the TiO2 more and in a shorter period of time, resulting in a binary TiB2–TiBO2 phase equilibrium. This result suggests that the reaction between TiB2–TiO2 goes further toward completion under the action of the electric field and in a lower temperature range. In addition, the 40 V/cm applied electric field compresses the temporal range of the three-stages that were observed in the conversion of TiB2 into TiBO3 at 16 V/cm besides reducing the onset temperature which is indeed very peculiar (see Figs. 7 and 8). That is so because the applied electric field not only affects the thermodynamics of the process by decreasing the TiBO3 formation temperature, but also the kinetics of its formation. Specifically, the rate of TiBO3 formation increases with decreasing temperature which is very peculiar since the rate of chemical reactions or phase transformations involving diffusion would normally increase with increasing temperature. Reference Laidler56,Reference Christian57 The said thermodynamic and kinetics aspects of the two phenomena are mutually opposite in terms of the temperature response under zero field conditions. Reference Laidler56,Reference Guggenheim58 What appears to be a dichotomy will be thoroughly elaborated on in the ensuing discussion.
Time evolution of x-ray phase composition in nano-TiB2–TiO2–TiBO3 when heated at 20 °C/min in argon (a) under 16 V/cm when heated from RT to 650 °C and (b) 40 V/cm when heated from RT to 458 °C, showing an increase in TiBO3 formation rate (a kinetic effect), decrease in formation temperature range, and shift in the TiB2 → TiBO3 reaction to the right (both thermodynamic effects).

IV. DISCUSSION
Two important phenomena were discovered in study: (i) changes in chemical and phase equilibria due to the applied electric field which is a thermodynamic effect, and (ii) increases in the rate of a solid state reaction in the system which is a kinetic effect. Both effects will be analyzed in what follows. But before, we will firstly establish the extent of Joule heating that is theoretically possible in the experiments discussed herein.
A. Adiabatic internal temperature due to Joule heating
Firstly, we will assume that the specimen does not loose thermal energy to the surroundings when the current rapidly rises above 0.1 A. Of course, the thermal energy we consider here originated from dissipative processes associated with Joule heating. Secondly, we will compute what is known as the adiabatic temperature of the specimen that designates the highest temperature theoretically achievable due to Joule heating in the system thanks to this assumption.
The energy absorbed (W) by the specimen (or equivalently the work down by the applied electric field on the specimen) follows from the definition of power [P(t) = ∂W(t)/∂t] and its current (i)–voltage (V) relation P(t) = V⋅i(t), and is given by
 $$W = V\int_{{t_{\rm{i}}}}^{{t_{\rm{f}}}} {i(t)\,{\rm{d}}t} \quad ,$$
as all results reported in here were obtained under constant electric field. In Eq. (2) Δt = t f − t i is the time interval in which there is current flow through the specimen. Under adiabatic conditions, the energy absorbed by the specimen due the passage of current will result in an increase in the internal temperature of the system for which energy conservation requires that
 $$W = \eta \cdot \Delta H^\circ (T)\quad ,$$
where η is the number of moles of specimen and ΔH°(T) is the isobaric enthalpy increment of the specimen that is given by Reference Guggenheim58
 $$\Delta H^\circ (T) = \left[ {{\xi _{{\rm{Ti}}{{\rm{B}}_2}}}\int_{{T_{\rm{o}}}}^{{T^*}} {c_{\rm{p}}^{{\rm{Ti}}{{\rm{B}}_2}}\,{\rm{d}}T} + {\xi _{{\rm{Ti}}{{\rm{O}}_2}}}\int_{{T_{\rm{o}}}}^{{T^*}} {c_{\rm{p}}^{{\rm{Ti}}{{\rm{O}}_2}}\,{\rm{d}}T} + {\xi _{{\rm{TiB}}{{\rm{O}}_3}}}\int_{{T_{\rm{o}}}}^{{T^*}} {c_{\rm{p}}^{{\rm{TiB}}{{\rm{O}}_3}}\,{\rm{d}}T} } \right]\quad .$$
In Eq. (4), ξ is the mole fraction, c
p is the isobaric heat capacity, T
o is the temperature at which the first rise in current occurs and
 ${T^ * }$
is the final adiabatic internal temperature of the specimen after which we are. In Eq. (4), the contributions of the experimentally observed oxide phases to the overall enthalpy content of the system was included because the TiB2 powder used for this study contained considerable amounts of TiO2 and TiBO3. The molar amounts (ηξi where i: TiB2, TiO2 or TiBO3) of each phase was determined from the x-ray diffraction pattern at the temperature of interest. Since heat capacity data for TiBO3 is unavailable in the literature, the c
p data for TiB2
Reference Huber and Deiseroth55
and TiO2
Reference Huber and Deiseroth55
was used to estimated it using an averaging technique.
Reference Kubaschewski and Komarek49
The adiabatic temperature
 ${T^ * }$
was obtained by equating Eqs. (2) and (4) via Eq. (3) and solving the resultant equations numerically. Using the current–time data (not shown), the work done by the electric field on the system was computed by numeric integration as per Eq. (3). For the 16 V/cm case, the work down was obtained as 124.4 J. And by assuming perfect adiabatic conditions and perfect electrical to thermal energy conversion the internal temperature was computed as 740 °C for 16 V/cm which is only 90 °C higher than the maximum furnace temperature reached in the experiment (650 °C). Following the same approach for the 40 V/cm experiment, the work done on the system was computed as 297.3 J for which the corresponding adiabatic temperature was computed as 842 °C. This adiabatic temperature is 384 °C higher than the maximum furnace temperature reached in the experiment (458 °C).
Next, we will analyze the effects of applied electric field on the kinetics and thermodynamics of TiBO3 formation. In so doing, we will establish the ramifications of thermal and electrochemical effects on the electric field driven formation of TiBO3 while also evaluating the Joule heating hypothesis.
B. Effect of electric field on the kinetics of TiBO3 formation
It was shown that an increase in the applied electric field from 16 V/cm to 40 V/cm caused an increase in the precipitous current burst beyond a certain onset temperature, which in turn increased the rate of the TiB2 → TiBO3 conversion (see Fig. 9). This result would be in conformity with the so-called absolute reaction rate theory (ARRT) in chemical kinetics Reference Laidler56 if there were Joule heating in the system arising from the current induced by the applied electric field. That is so because the rate (ξ) of a chemical reaction increases with increasing temperature following an Arrhenius type of variation as ξ = ξ′e−Q/kT , where ξ′ is the pre-exponential factor, Q is the activation energy, k is the Boltzmann constant, and T is the absolute temperature. Reference Laidler56 However, solid state reactions such as the one considered here are also known to be diffusion limited as per the core-shell model. Reference Radmilovic, Ophus, Marquis, Rossell, Tolley, Gautam, Asta and Dahmen59 Here, we postulate that the rate limiting step is diffusion of oxygen vacancies from TiO2 (the supplier of oxygen) to TiB2 (the receiver) since the phase composition of both species decrease while that of TiBO3 increases (see Fig. 9). The impacts of the applied electric field on vacancy diffusion are unavoidable because they enhance the chemical potential of oxygen vacancies (μo) according to μo* = μo + z o Fϕo Reference Guggenheim58 where z o is the charge on oxygen vacancies, F is the Faraday constant, and ϕo is the local potential arising from the Lorentz field at the vacancy site with μo = μ′ + kNT ln(a o), Reference Guggenheim58 where μ′ is the chemical potential at the standard state, k is the Boltzmann constant, N is Avogadro’s number, T is the absolute temperature, and a o is the chemical activity for oxygen vacancies. For a nonzero electric field (∇ϕo ≠ 0), the oxygen diffusion flux (J o) will be increased by z o F∇ϕo per the Fick’s first law which is given by
 $${J_{\rm{o}}} = - {D_{\rm{o}}}kNT\left[ {\nabla \ln ({a_{\rm{o}}})} \right] - {D_{\rm{o}}}{z_{\rm{o}}}F\left[ {\nabla {\phi _{\rm{o}}}} \right]\quad ,$$
where D o is the diffusivity of oxygen which itself has an Arrhenius type of dependence. In view of the foregoing discussion, we note that the increased rate of TiB2 → TiBO3 conversion has a purely thermal component via the chemical reaction rate ξ and an electrochemical component via −D o z o F∇ϕo both of which are operational concurrently in the experiment considered herein. Hence, J o can be substantially high even at lower temperatures if ∇ϕo is sufficiently large. Reference Guggenheim58 Consequently, one arrives at the conclusion that substantial Joule heating is not a necessity for high TiBO3 formation rates for as long as an electric field of sufficient magnitude is used to induce electrochemically driven mass transport.
C. Effect of electric field on the thermodynamics of TiBO3 formation
The thermodynamics of the TiB2 → TiBO3 process, on the other hand, also exhibited applied electric field dependence (see Fig. 9). Firstly, it was established that an increase in the applied electric field magnitude decreased the nonisothermal temperature range in which TiBO3 formed from TiB2 and TiO2 (see Fig. 9). Secondly, the TiB2 → TiBO3 reaction shifted to the right with increasing applied electric field magnitude, i.e., the higher the applied electric field, the more TiO2 reacted with TiB2, and the more the reaction progressed toward completion. Such a shift in the equilibrium of a chemical reaction is governed by the so-called Van’t Hoff relation Reference Guggenheim58 that expresses the variation of the equilibrium constant (K) with temperature as
 $${{\partial \ln K} \over {\partial \left( {{1 \mathord{\left/ {\vphantom {1 T}} \right. \kern-\nulldelimiterspace} T}} \right)}} = - {{\Delta H} \over R}\quad ,$$
where ΔH is the enthalpy of the reaction of interest. Based on the study by Kulpa et al., Reference Kulpa and Troczynski12 the formation of TiBO3 can only be represented by the following chemical reaction as no free B2O3 could be detected by x-ray diffractometry (see Figs. 5–8):
 $${\rm{Ti}}{{\rm{O}}_2}({\rm{s}}) + {\rm{Ti}}{{\rm{B}}_2}({\rm{s}}) + 2{{\rm{O}}_2}({\rm{g}}) \⇌\ 2{\rm{TiB}}{{\rm{O}}_3}({\rm{s}})\quad .$$
Although no formation enthalpy data are available for TiBO3, the reaction depicted in Eq. (7) has to be exothermic (ΔH < 0) because it represents the oxidation of TiB2 by TiO2 and residual trace amount of oxygen in the system. Reference Kubaschewski and Komarek49 It follows from Eq. (6) that an increase in temperature due to Joule heating would reduce the amount of TiBO3 which is contradictory to the experimental results as depicted in Fig. 9. Therefore, the primary effect of the applied electric cannot be Joule heating. Remembering that TiO2 is a solid electrolyte in which oxygen vacancy diffusion is the governing atomic migration mechanism, Reference Schaub, Wahlström, Rønnau, Lægsgaard, Stensgaard and Besenbacher60–Reference Pan, Yang, Fu, Zhanga and Xu62 one needs to include the chemical potential due to electric field-oxygen vacancy coupling ηo Fϕo, where ηo is the effective charge carried by the oxygen vacancy (+2), Reference Schaub, Wahlström, Rønnau, Lægsgaard, Stensgaard and Besenbacher60–Reference Pan, Yang, Fu, Zhanga and Xu62 F is the Faraday constant, and ϕo is the local potential at the defect site. Hence, the equilibrium constant for the chemical reaction in Eq. (6) becomes a function T and ϕo and takes the following form:
 $$\ln (K) = {{\Delta S} \over R} - {{\Delta H} \over {RT}} + {{{\eta _{\rm{o}}}F{\phi _{\rm{o}}}} \over {RT}}\quad ,$$
from which the corresponding thermal and electrochemical Van’t Hoff relations can be obtained as
 $${{\partial \ln (K)} \over {\partial ({1 \mathord{\left/ {\vphantom {1 T}} \right. \kern-\nulldelimiterspace} T})}} = - {{\Delta H} \over R} + {{{\eta _{\rm{o}}}F{\phi _{\rm{o}}}} \over R}$$
and
 $${{\partial \ln (K)} \over {\partial ({\phi _{\rm{o}}})}} = {{{\eta _{\rm{o}}}F} \over {RT}}\quad ,$$
respectively. Here, ϕo is a function of the applied electric field and the permittivity of the medium. Reference Landau, Pitaevskii and Lifshitz63 Since ΔH < 0 and the electrochemical term (ηo Fϕo) > 0 for the reaction in Eq. (7), the slope of ln(K) versus (1/T) as given by Eq. (9a) is positive. As such, the lower the temperature, the higher the K and the more TiBO3 is formed, which, of course, precludes the possibility of an appreciable internal temperature rise due to Joule heating. Moreover, the slope of ln(K) versus ϕo as given by Eq. (9b) is also positive which suggests that the higher the ϕo (hence, the higher the applied field), the higher the K and the more TiBO3 is formed, which does not even require any consideration of Joule heating.
V. CONCLUDING REMARKS
No changes were observed in the nano-TiB2 system containing TiO2 and TiBO3 when it was heated to 600 °C with 20 °C heating rate in an inert atmosphere under zero electric field. When an electric field (16 and 40 V/cm) is superimposed on the thermal field and the experiment is carried out under identical conditions, changes in the chemical and phase equilibria of the nano-TiB2–TiO2–TiBO3 ternary system are observed second phases in the range RT–650 °C that are otherwise completely absent. High current bursts passing through the system above certain critical temperatures for a given applied electric field magnitude produce electrochemical effects that govern both thermodynamics and kinetics phenomena controlling the chemical and phase equilibria in the nano-TiB2–TiO2–TiBO3 ternary system. While self-consistent internal temperature calculations based on the adiabatic approximation suggest a maximum temperature as high as 842 °C for 40 V/cm applied electric field; analyses based on a modified Van’t Hoff relation, taking into account electrochemical effects in conjunction with experimental results, preclude the possibility of appreciable Joule heating. That is because the formation of TiBO3 from TiB2 and TiO2 is favored at lower temperatures since it is a solid state oxidation process. Higher internal temperatures due to Joule heating would suppress the oxidation reaction with increasing temperature. The effect of the applied electric field is to enhance the thermodynamic driving force by coupling to the oxygen vacancies in TiO2 via the electrochemical potential ηo Fϕo in a solid state oxidation reaction between TiB2 and a solid state electrolyte TiO2. In other words, the TiB2 → TiBO3 conversion consumes the driving force provided by the applied electric field which is the very reason why TiB2 exhibits poor sinterability even with ultrahigh current based hot consolidation processes. Reference Kulpa and Troczynski12,Reference Baik and Becher13,Reference Graziani, Landi and Bellosi38,Reference Tampieri and Bellosi39,Reference Koh, Lee and Kim41–Reference Lee, Lee and Kim43,Reference Park, Lee, Koh and Kim64
ACKNOWLEDGMENTS
The authors wish to express their gratitude for the financial support provided by the Office of Naval Research (ONR) under Contract No. N00014-10-1-042. The authors wish to thank Dr. Lawrence Kabacoff of the ONR for his valuable technical feedback and support to this project. E.K.A. thanks Dr. L. Fabris various technical discussions. This research was carried out in part at the National Synchrotron Light Source at Brookhaven National Laboratory, which is supported by the U.S. Department of Energy, Division of Material Sciences and Division of Chemical Sciences, under Contract No. DE-AC02-76CH00016.