

Introduction
One of the most common criteria for classifying pension systems is based on their funding. From that standpoint, we distinguish between systems of (i) distribution (or sharing, or PAYG – ‘pay as you go’) systems and (ii) capitalisation (or funded). In the former, pensions are contributed by current workers; that is, it is a transfer of funds between generations. On the contrary, in the latter, each generation contributes to their own pension through a fund that can be individual or collective (Reference YermoYermo, 2002). Usually, we identify distribution with public systems and capitalisation with private ones. However, in recent years, some countries (such as Spain), have created reserve funds within public systems. In any case, within the European Union (EU), public pension systems based on the sharing criterion are predominant. In addition, private funded schemes are usually voluntary. And, despite recent growth in certain countries, they cover a relatively small percentage of the labour force (OECD, 2016).
Having recognised the importance of the public pension system in the EU, it is easy to identify the basic variables that determine its functioning. On the one hand, there are variables that affect number of retirees (or, more generally, ageing). Other variables determine the ability to contribute (the labour force or, more specifically, employment). The recent debate on fiscal austerity has revived the interest on public pension systems. In particular, we discuss whether the current level of pension coverage can be ensured without compromising the sustainability of public debt, given the principal demographic and economic trends.
The aim of this work is to analyse these trends and their implications for public pension spending in the EU. This task will be undertaken following the next steps. First, we will conduct a survey of the literature. After that, we will identify the basic variables that influence public pension systems. Then, based on the available statistical projections, we will verify that the European population will be ageing in the coming decades. From there, we will determine the future evolution of potential (labour force) and effective (employment) contributors to the social security system. Thereafter, having quantified both potential pension applicants and the number of contributors, we will be able to construct some dependency indicators and establish its likely future evolution. The next step will be to determine the overall effects on public pension spending. At that point, we will determine the relation between an ageing population and the intensity of efforts to reduce public pension spending. On that basis, some considerations will be made regarding public actions that can be undertaken. Finally, conclusions will be presented.
Related literature
The demographic changes that have occurred since the mid-twentieth century have triggered the so-called ‘age of ageing’ (Reference MagnusMagnus, 2008). Studies on the impact of such changes on pensions have proliferated ever since. These contributions have taken a variety of approaches. Thus, at an academic level, Grech (Reference Grech2015a) presents a classification of studies according to several criteria and distinguishes between cross country studies (Atkinson, Bourguignon, O'Donoghue, Sutherland, & Utili, Reference Atkinson, Bourguignon, O'Donoghue, Sutherland and Utili2002; Reference Dekkers, Buslei, Cozzolino, Desmet, Geyer, Hofmann and VerschuerenDekkers et al., 2009; Reference Dusek and KopecsniDusek & Kopecsni, 2008; Reference Ferraresi and MonticoneFerraresi & Monticone, 2009; Reference FultzFultz, 2006; Reference Holzmann and GuvenHolzmann & Guven, 2009; Reference Martin and WhitehouseMartin & Whitehouse, 2008; Sefton, Evandrou, Falkingham, & Vlachantoni, Reference Sefton, Evandrou, Falkingham and Vlachantoni2011; Soede, Vrooman, Ferraresi, & Segre, Reference Soede, Vrooman, Ferraresi and Segre2004; Reference Zaidi, Makovec, Fuchs, Lipszyc, Lelkes, Rummel and De VosZaidi et al., 2006); country-specific studies (Reference Bottazzi, Jappelli and PadulaBottazzi, Jappelli, & Padula, 2006; Reference Bridgen, Meyer and Seeleib-KaiserBridgen & Meyer, 2008; Reference Flood, Klevmarken, Mitrut, Klevmarken and LindgrenFlood, Klevmarken, & Mitrut, 2008; Reference Fonseca and SopraseuthFonseca & Sopraseuth, 2005; Reference Frommert and HeienFrommert & Heien, 2006; Reference Fultz, Steinhilber, Fultz, Ruck and SteinhilberFultz & Steinhilber, 2003; Reference Goodman, Brewer, Emmerson, Muriel, Browne and TetlowGoodman et al., 2007; Reference Orban and PalotaiOrban & Palotai, 2005; Van de Coevering et al., Reference Van de Coevering, Foster, Haunit, Kennedy, Meagher and Van den Berg2006) and simulation studies (Reference Falkingham, Johnson, Falkingham and HillsFalkingham & Johnson, 1995; Reference Kotlikoff, Marx and RizzaKotlikoff, Marx, & Rizza, 2006).
From a demographic point of view, it has become a stylised fact that the fall of fertility rates is causing the progressive ageing of population in certain countries. And that, in turn, raises the burden on employees that provide funds for the sustainability of social security programmes, in general, and for the pension system, in particular. Despite being a global phenomenon, the situation seems most severe in Europe (Börsch-Supan, Härtl, & Ludwig, Reference Börsch-Supan, Härtl and Ludwig2014). A so-called ‘demographic time bomb’ is ticking away in Europe (Reference HewittHewitt, 2008) and the preoccupation for the sustainability of pensions is planted in the social debate. Thus, international agencies have conducted studies and have shown special concern for the effects of ageing on the pension systems.
These proposals, however, have not reached general consensus. For instance, Altiparmakov (Reference Altiparmakov2015) criticises the methods employed by the World Bank (1994) that recommend the development of privately managed mandatory savings systems to overcome the ageing crisis. In fact, with the burst of the financial crisis of 2008, some countries of Eastern Europe considerably reduced the amount of obligatory pensions assigned to private pension funds. That was criticised by the World Bank itself, arguing that those measures would only fix a short-term problem by compromising the future of the system (Reference Schwarz and AriasSchwarz & Arias, 2014). A different focus is that of Ediev (Reference Ediev2014). It demonstrates how the increase of longevity may favour the PAYG relatively to the funded system. The logic is that workers would find it cheaper to pay pensions of current retirees than their own, as their life expectancy is superior and would imply a larger fund to finance.
Besides projections by international organisms, theoretical works show us an ‘unpleasant arithmetic’ (Reference Cipriani and MakrisCipriani & Makris, 2012). Moreover, some arguments blame the public pension system itself for the fall in fertility. The argument is as follows: As long as public pension systems guarantee a minimum income, incentives for parents to have children to look after them in the future decrease. Then, the public pension system destroys its own basis (Reference Cigno and WerdingCigno & Werding, 2007). In this line is to be found the empirical work of Zhang and Zhang (Reference Zhang and Zhang2004). Using data from 64 countries, a negative relationship between social security programmes and fertility is detected. From a theoretical perspective, Fanti and Gori (Reference Fanti and Gori2012) build a model in which the fall of fertility does not necessarily come with a decrease of pensions in the long term. In sum, the connection between fertility and pensions require additional analytical effort that sometimes contradicts simplistic views of this phenomenon.
That said, demographic elements are not the only determinants of the sustainability of a pension system: Economic factors matter as well. In fact, the decrease in the number of employees caused by the fall in fertility may be compensated with greater productivity, so that the flow of income towards pensioners can be maintained. One possible way to increase productivity is indicated by Cipriani (Reference Cipriani2014). To understand it, let us consider the following: The capital-per-worker ratio increases when the number of workers decreases. Under certain assumptions, this would imply labour productivity growth.
Investment in education may as well be included as a variable to affect productivity (Reference Cremer, Gahvari and PestieauCremer, Gahvari, & Pestieau, 2011). It ought to be said that the evolution of productivity is hardly predictable as the next form of technology is unknown. And, if we ignore future productivity changes, we also ignore future economic growth. Thus, the margin of error in assessing the sustainability of the pension system is sizeable. Moreover, at this point it has to be acknowledged that the relationship between education, labour productivity and income should be nuanced when presented at an aggregate level. For example, Price (Reference Price, Miles and Probert2008) shows, taking the United Kingdom as reference, that the presence of dependent children in the household explains income inequality between men and women better than educational level does. Consequently, understanding cultural patterns of roles distribution within families is substantially relevant to understand not only the financial dependency of women, but also (as mentioned below) inequality in received pension levels.
The consequences of ageing and economic growth on convergence between countries are also a subject of interest in Europe. Grech (Reference Grech2015b) indicates that employment policies to improve young people's labour opportunities are especially important for Southern European countries. More generally, the literature survey by Crespo, Loichinger, and Vincelette (Reference Crespo, Loichinger and Vincelette2016) finds a concerning slowdown in the speed of income convergence across European countries.
Apart from convergence, the projected dynamics have implications for equity amongst different social groups. Let us focus on the differences between men and women. First, the majority of countries where the legal age of retirement used to be greater for men than for women (such as the United Kingdom) have progressively eliminated this difference. This has happened within a general tendency towards labour activity prolongation (OECD, 2011). Nonetheless, the fact that retirement ages have been equalised between genders does not imply that they will have access to equivalent pensions, in practice. The most obvious explanation is that, in many systems, pensions are established in function of contribution bases and years of labour activity. Therefore, women end up worse off, owing to the wage gap and to their shorter and more discontinuous contribution careers. Additionally, as pointed out by Lain and Vickerstaff (Reference Lain, Vickerstaff, Harper and Hamblin2014), the context of individual decision making is important in understanding income differences between men and women at retirement. Differences in age, health, qualification, employment probability among others, can also explain the difference in living conditions of men and women after retirement.
On the basis of the above, the projected demographics and, to a larger extent, economics that condition the pension systems are under heated discussion, which explains the proliferation of studies on their subject. We find references to EU-wide inter-country comparisons, or even to simulations of possible future outcomes for the pension systems under various scenarios (Reference GrechGrech, 2015a). Nonetheless, to our knowledge, none realises a comparative global view on different member states, on top of detecting the possible convergence or divergence of demographic and economic projections, as well as their potential social implications.
Bridging this gap is one of the objectives pursued by this work. For this endeavour, our basis will be the most solvent existing projections in order to value their implication in the public pension spending in the EU. On this subject, the OECD publishes, since 2005, a report entitled Pension at a Glance providing information about various member countries. Also, at the EU level, the European Commission has published, since 2009, three Aging Report (European Commission, 2009, 2012, 2015) featuring economic and budgetary projections on variables that affect pensions in its member countries. Analysing their data will allow us to bring objectivity into the debate surrounding the current public pension system and its potential reform guidelines within the EU.
Data
The essence of demographic projections does not reside in methodological differences. After all, the techniques employed are based on an initial structure. Then, several hypotheses on survival, fertility and migration are applied. From them stems the diversity of estimates. Thus, there is a particular interest in understanding the basis of these underlying assumptions. At European level, Eurostat publishes data related to demography and migration, based on the information provided by national statistical institutes. This information is used by the European Commission to prepare regular reports on the possible long-term impacts of population ageing in Europe. At time of this writing, the last full report dates from 2014 (European Commission, 2014). Disaggregated data will allow us to shed light on the differences between the various EU member states. And, judging by the established projections, we will be able to tell whether these differences will decline over the years.
Eurostat's latest population projections scenario, EUROPOP2013, implies convergence in demographic variables. More specifically, the assumptions in relation to the variables of interest are:
Fertility. Fertility rates of EU member states will converge towards those of the North European countries, which we qualify as forerunners.
Mortality. Mortality trajectories will also converge, assuming that countries with lower life expectancy will converge to those with higher life expectancy.
Migration. It is assumed that, in the following decades, the EU will have positive net migration possibly amounting to 10% of the 2060 population. It is convenient to indicate that projections were made before knowledge of United Kingdom's decision to abandon the EU (‘Brexit’). Nonetheless, a recent study by Armstrong and Van de Ven (Reference Armstrong and Van de Ven2016) concluded that the effect of migratory changes occasioned by the Brexit would only be of minor impact relative to the costs entailed by ageing population.
The following section will discuss, in some detail, the assumptions underlying the projections of fertility, mortality and international migration. These are the inputs to predict the population volume, and, most importantly for our purposes, the age composition of the population. Therefrom, we can glimpse the ageing trend of the EU population, which can significantly affect the solvency of their pension systems.
Projections
Most of the time, political decisions on matters such as pensions have to be taken before academics have reached a consensus. Yet, it is logical that they necessitate a reference framework. In the particular case of pension politics, statistical projections are essential for asserting the suitability of certain measures. In the EU framework, statistical databases are provided by European institutions themselves. This section will analyse the demographic and economic trends that are defined for the long run, in order to derive the most likely scenario for the pension demands of population.
Demographic projections
The demographic determinants of the future evolution and potential ageing of the population are mainly three: fertility rates, mortality rates and net migration. Table 1 presents Eurostat's projections from 2013 (the base year) to 2060.

Regarding the fertility rate, we first notice that a general increase is assumed. Exceptions are to be found in Ireland, France and Sweden, where the fertility rate is meant to decrease slightly, and in the United Kingdom, where it remains stable. Precisely, these countries are those that have the highest fertility rates in 2013. The assumption of convergence of this rate is clearly visible through the coefficient of variation (defined as the percentage ratio of the standard deviation to the mean), going from 14.13 in the base year, to 7.68. Strikingly, no country reaches the natural replacement rate (i.e. 2.1 children per woman). Therefore, although the fertility rate for the EU as a whole is expected to increase during the period under consideration (from 1.59 to 1.76 children per woman), population is not expected to increase through this channel.
The projected life expectancy at birth for both men and women anticipates a significant increase in all countries, even though they may conserve substantial gaps in their levels. In the EU as a whole, life expectancy for men will grow by slightly more than 7 years, to the level of 84.7 years. For women, it will increase by 6 years, to the level of 89.1 years. Again, the coefficient of variation confirms the underlying hypothesis of convergence. It may be interesting to note that the dispersion of life expectancy for men starts off being slightly higher than that of life expectancy for women. Yet, after the projection, the respective coefficients of convergence align. In other words, convergence will be much more marked in the trajectories of life expectancy for men than in those of life expectancy for women.
Finally, as previously noted, it is assumed that the EU will have a positive net migration flow in 2060 that will account for 10% of the population (equivalently, about 55 million of people). In particular, the main countries of the current Eurozone will absorb the largest inflows of immigrants; meanwhile, the Baltic countries and, to a lesser extent, Ireland, Greece, Bulgaria and Romania, will accumulate negative net migration flows. It is worth noting that no country in the EU will have a negative migration balance in 2060.
According to the report of the European Commission (2014), the result of the previous projections implies that the population of the EU will barely grow in the coming decades (from 507 million in 2013, to 523 million in 2060) although there are expected to be disparate trends member states. The most dramatic change is expected regarding the demographic age structure: the base of the ‘population pyramid’ will narrow as the percentage aged 65 and above grows. The diagnosis seems evident:
The numerous population cohorts born in the 50s and 60s, along with increased life expectancy and sustained fertility rates below the replacement level that are not offset by the expected migration flows, will cause ageing of the population in the EU.
Economic projections
To proceed with our task of assessing the sustainability of PAYG pension systems, we ought to analyse the potential and effective contributors to the system. Respectively, these are the labour force and the employed.
Regarding the labour force, the method used by the European Commission (2014) consists of applying some estimates of the activity rate to the projected population. The description of the so-called cohort simulation model (CSM) is to be found in Carone (Reference Carone2005). In particular, it is worth keeping in mind four sets of stylised facts that are important to activity rates: (1) social factors: extension of school age and change of women's attitude to the labour market; (2) demographic factors: declining fertility and delayed motherhood; (3) institutional factors: legal changes over the age of retirement; (4) economic factors: assumed evolution of unemployment, rents and sectorial structure of the economy. The third set of factors, institutional ones, is a particularly important force, not just in the EU, but in the entire OECD: most of their members have launched legislative measures to favour remaining in the labour market. The main measures have been three: increasing the legal retirement age, establishing financial incentives to further increase retirement age, and discouraging early retirement. Without getting into particular cases, whose details can be found in OECD (2011), it might be sufficient to note that many countries have increased the retirement age. The impact of these reforms is likely to cause an increase in the effective retirement age for both men and women.
As for the employed population, the European Commission (2014) does not directly estimate it. Rather, they take the difference between the labour force and the unemployed. That is, they rely on the predictive capacity of economic evolution to define unemployment and, ultimately, employment. Here is to be found one of the most objectionable aspects of the presented projections: It assumes that unemployment will follow its trend, ignoring economic cycles that are difficult (if not impossible) to predict.
Therefore, it is natural that labour market projections are subject to a greater margin of error than demographical ones. Still, both are essential to set up an adequate framework for decision making in general, and for decisions affecting the pension system in particular. Table 2 presents the projections to 2060 by the European Commission (2014) with respect to the participation rate (PR) and the employment rate (ER) of the population between 20 and 64 years. First, it is assumed that the combined effect of the continued increase of women's activity and of the measures to retain workers in the labour market will cause a general increase of PR in all countries (except Ireland and Romania, where it would drop slightly). In the EU as a whole, the participation rate would increase from 76.5 in 2013 to 80.1 in 2006. Nevertheless, the dispersion of the rate is barely altered: the coefficient of variation would stay around 6%.

Regarding the ER, a general increase is also observed, with the exception of Romania. This is particularly striking in Spain and Greece, where the increase in the period considered is of more than 20 points. The EU-wide ER would rise up to 75.1 in 2060, according to these projections. The dispersion between countries is also expected to fall: the coefficient of variation would decrease by almost 3 points.
Evolution of dependency
In the previous sections, we found that according to projections by the European Commission (2014), based on the statistical information provided by Eurostat, the European population will tend to ageing in the coming decades and, in parallel, the activity and employment rates will increase. In this subsection, we will combine both sets of trends to analyse the outcome in different European countries of a key determinant of the sustainability of the pension system: the dependency ratio.
Let us define the demographic old-age dependency ratio (DD) and effective economic old-age dependency ratio (ED) according to the following expressions


which are useful references for the demographic and economic dependency in the EU, respectively. The results are shown in Table 3.

In all countries, without exception, a significant increase in both DD and ED is to be expected, as they have been defined. A variety of trajectories is expected as well, that being the logical consequence of cross-country differences in the projections for these ratios’ input variables. Growth of the DD in the period 2013–2060 can be expected to range from 11.3 points in Sweden to 47.4 points in Slovakia. The EU average would go from 27.8 in 2013 to 50.1 in 2060, i.e. by 22.3 points. A similar pattern of behaviour is observed when we look at the ED: Significant and widespread increases are expected in in all countries, with a diversity of circumstances that is maintained over time. In this case, the largest increase is to be found once again in Slovakia, with a variation of 62.3 points; and the lowest is to be expected in Denmark with 10.9. The EU average would increase by 26.5 points, from 42.3 in 2013 to 68.8 in 2060.
Effects on pension spending
In light of what has been put forward up to this point, ageing of the European population can be expected to increase (demographic and economic) dependency ratios despite predicted increases in participation and employment rates. The next step will be to analyse the impact that this increased pressure in productive population will have in pension expenditure, highlighting differences across countries.
Table 4 shows that public pension spending (PPS) as a proportion of gross domestic product (GDP) will barely change between 2013 and 2060, staying around 11%.

However, the EU average masks important cross-country differences. The underlying disparity is the natural consequence of unequal projected (economic and demographic) dynamics. But not only are departing PPS/GDP levels very heterogeneous; trajectories are too. The difference between projected evolutions of the above mentioned quotient can be noted in Figure 1. While some countries experience appreciable decreases (such as France or Italy), others (Germany and United Kingdom, among others) expect to face an increase of the importance of PPS in GDP.
Projected change from 2013 to 2060 in public pension spending as a percentage of gross domestic product (PPS/GDP), by country. Source: Compiled from European Commission (2015).

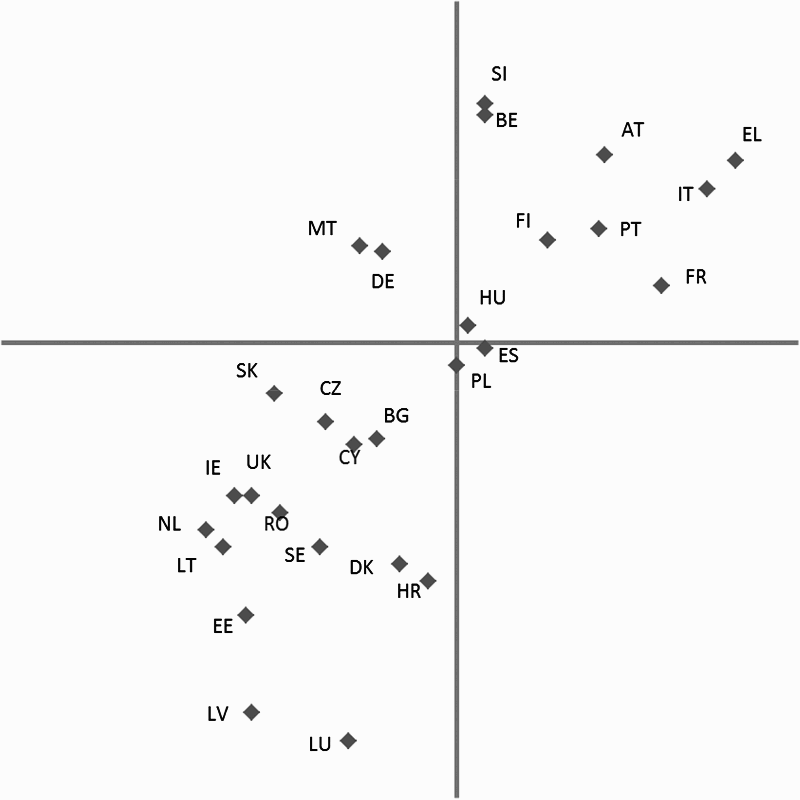
Nevertheless, Figure 2 displays that positions relative to the EU average hardly change. That is, countries that were below average in 2013 will also be below average in 2060 (bottom left quadrant). Analogously, those that were above average in 2013 will also be above average in 2060 (top right quadrant). The only states that deviate from position immobility are Germany and Malta, that were below average in 2013 but above average in 2060 (top left quadrant), and Spain, that was above average in 2013 but falls below average in 2060 (bottom right quadrant).
Public pension expenditure (PPS) as a percentage of gross domestic product (GDP), by country as a deviation of the EU average. 2013–2060. Countries to the left (right) of the vertical axis had a lower (higher) PPS / GDP than the EU average in 2013 (11.3%); countries above (below) the horizontal axis had a PPS / GDP higher (lower) than the EU average in 2060 (11.1%). Source: Compiled from European Commission (2015).

The next step is to decompose the PPS/GDP ratio into several factors. Such an approach has been relatively frequent (Reference Jimeno, Rojas and PuenteJimeno, Rojas, & Puente, 2008). For our part, given the information available, we propose the following breakdown:

We denote each of these three factors as follows:
Demographic factor [(Population 65+) / (Population 20–64)]. It is similar to what we previously called demographic dependency. The only difference is in the denominator since, given the lack of information, we use the stratum of population between 20 and 64 and not between 15 and 64. It is an indicator of the influence that the ageing of population has in pension expenditure as a percentage of GDP.
Economic factor [(Population 20–64) / (Employed 20–64)]. It is an approximation to the inverse of the employment rate. We could take it as a proxy for the degree of economic performance and, in particular, of the performance of the labour market.
Institutional factor
 . The numerator approximates the average pension. The denominator approximates production per employee, i.e. productivity. This factor could be an indicator of the effort exerted by the working generation with relation to the average pension. Thus, it may be considered a measure of the degree of generosity of the pension system that is defined in the legislative framework of each country.

As indicators are built, the changes over time of the percentage of PPS over GDP must be equal to the sum of changes in demographic, economic and institutional factors. Thus, Table 4 details the importance of each factor in the change in public pension expenditure as a proportion of GDP in each EU country. As it might have been expected, the demographic factor is the sole factor explaining the increase in PPS/GDP. Note that the other two, save the economic one in the case of Romania, are always negative. In other words, the ageing of the population is the main factor behind the increase in public pension expenditure as a proportion of GDP, although its importance varies significantly between countries.
The economic factor, except in the case of Romania (it should be noted that it is the only country in which the employment rate is expected to fall over the period under consideration), helps mitigate the impact of ageing on public pension expenditure as a proportion of GDP, albeit very moderately. The most important values are found in Greece (−5.5) and Spain (−3.5). The explanation is simple: Countries that in 2013 had the lowest employment rates are supposed to see a gradual disappearance of their cyclical unemployment; thus, to experience job creation at a faster rate than other European countries, until they catch up with their levels.
For its part, the institutional factor is negative in all cases and, in some, higher in absolute value than the demographic factor. That is, in all EU states, without exception, pension systems are expected to be less ‘generous’, as the difference between the average pension (pension expenditure / population 65+) and the average apparent labour productivity (GDP / Employed 20–64) increases.
The last statement deserves an additional comment. Indeed, one of the underlying hypotheses of the analysed projections is that the productive capacity of workers will grow faster than the average pension perceived by workers. Conventional economic analysis featured in elementary Economics textbooks (Reference MankiwMankiw, 2014) postulate a tight relationship between labour productivity and wages. Therefore, what is being projected is, ultimately, an increasing difference between labour wages and pensions. As long as productivity increments spill over to wages but not to pensions, this evolution is contributing to the sustainability of the system.
The above reasoning depends on the type of pension calculation used by the system. Basically, we can distinguish two kinds: those that calculate pensions inputting the average received wage per worker (defined benefit, DB) and those that depend on a fund being provided by the worker himself (defined contribution, DC). Thus, in DB systems, there is a way to translate productivity increments to pensions. Meanwhile, in DC systems, pensions depend on each worker's individual effort. In some cases, the connection between productivity and DB system pensions has been weakened through political actions. Those are, for instance, policies that impose a maximum pension or some updating in function of inflation (rather than in function of wages). On the contrary, in other cases, they have opted for a strengthening of DC systems. For example, the OECD (2016) noted high growth figures for private pension funds in certain countries, among which some European ones (Denmark, the Netherlands and United Kingdom). Regardless, we must insist on that projections by the EU imply that the evolution of the mean pension-to-productivity ratio will contribute to containing the growth of the share of public pension spending on GDP in all countries.
Lastly, it is worth commenting on the relationship between changes in demographic and institutional factors, as shown in Figure 3. The trend line indicates an inverse relationship between them. In other words, it seems that countries where population ageing is more severe are making greater efforts to contain public pension system. And that is done through the implementation of institutional mechanisms that aim to reduce the generosity of the pension system. Still, such a trend does not necessarily imply a deterministic relationship. In fact, a detailed analysis of the data and of the figure reveals a diversity of dynamics which have a similar departure points. For example, Belgium and France start off very close in terms of demographic conditioners. However, their institutional factor projections are widely disparate. In an analogous fashion, demographic factors of Spain and Denmark contribute unequally to the growth of public pension system over GDP. And yet, their institutional factors evolve quite alike. Considering this mismatch between starting circumstances and trajectories leads us to consider the potential role of policies in this area.
Relationship between changes of the demographic and institutional factor in the EU28. 2013–2060. Source: Compiled from European Commission (2015).

The role of policies
Naturally, projections in social sciences are not inexorable trends. Rather, they should be understood as reference frameworks. Unpredictable random shocks risk appearing; among which, political actions can influence the course of our relevant variables and make them deviate from the predicted path. Regarding demographic projections, data stubbornly demonstrates that population ageing is inescapable, especially in Europe. That raises challenges that demand political action. One of them is providing for an increasing population that abandons the labour market, but that demands a minimal amount of resources to guarantee their wellbeing. The issue becomes severe as the social pact, by which current workers finance retirees in exchange for being financed when they become retirees themselves, becomes unsustainable.
One line of action could attempt to expand the number of contributions to the system. Thus, incentives to increase the number of births, delay the age of retirement or promote immigration could help to increase the number of workers. However, voluntarism is not enough to meet objectives. First, stimuli to natality rates will come into effect, at best, in the long term. Second, the increase of the retirement age does not guarantee that the oldest will be hired or that they will conserve their former productivity. At last, immigration risks of becoming a source of conflict for collectives that feel that they are ‘losing out’ which adds a hardly quantifiable complexity to the relationship between migrations and pensions. Neither do these measures seem likely to curb the demographic and economic dependency rates’ growth, which is expected to be experienced by all current members of the EU.
From a rather economic point of view, policies targeting occupation can be considered. By increasing employment and reducing unemployment, the number of workers can grow regardless of the level of active population. Thus, the number of contributors grows as well, which ultimately means that funds that feed pensions and other social benefits do too. So, even if it is national governments that are liable for employment policies, European institutions have boldly asserted that ‘to counteract the impact of demographic ageing’ the following points must be pursued: ease the transition from school to work; facilitate the process of finding a job; make it easier for workers to move freely around the EU; supports training, skills development and entrepreneurship; etc. (European Union, 2017). Besides that, after the effects of the latest economic and financial crisis on certain EU member states’ labour markets, the design of integral demand-side policies to fight unemployment have become popular. Regarding this point, it is noteworthy that available projections imply the progressive disappearance of cyclical unemployment. The only unemployment to exist would have structural causes, so that it may be preferably reduced with market reforms that facilitate demand and supply adjustments. The increase of employment rates would help mitigate the impact of ageing on public pension system in almost all countries of the EU. Yet, projections implicitly assume that its contribution will be a modest one.
On the contrary, measures that will decisively contain pension-to-GDP growth (as implicitly acknowledged by projections) are those acting upon the so-called institutional factor (that is, the quotient of the average pension to productivity). In this context, it could be thought that significant increases in labour productivity could generate sufficient resources to finance pension commitments without the need of reforming the system. The problem of this type of argument is whether productivity increments will translate to wages. As pensions are calculated in function of salaries perceived during the working life of the employee, it may be, thus, that pension spending in relation to GDP may not change much. Ultimately, the key is on ‘disconnecting’ labour productivity, or equivalently, prevailing wage rates, from pensions, so that the generosity of the system may be diminished. This can be achieved in an indirect and progressive manner – for instance, either indexing pensions to inflation rather than to wages), either reforming the pension system itself.
These measures are not free of inconveniences. For example, it has to be kept in mind that the transition towards a capitalisation system would impose costs to the workers that ought to finance their own pensions as well as those of the current retirees. Thus, it is pertinent to set an adequate pace for the transition, so as to prevent the imposition of all charges on a single generation.
The previously analysed demographic and economic projections are not based in particular politics, but the data does implicitly assume some lines of action for the EU. It is in evidence that those countries in which ageing is more important are, in general, those undertaking stronger policies to contain public pension system, through the expansion of the gap with prevailing wages. Logically, this does not imply that pensions will reach an acceptable level or that their purchasing power will increase. Instead, pensions will grow less than productivity and wages. An optimist scenario may be backed by substantial productivity increments that are induced by technological change, which would favour generating more goods and services for the population as a whole, in and outside the labour market.
Projections do not imply, either, the need to abandon PAYG schemes. In principle, such a system may still work as long as we accept its limitations. One of them stems from the way in which contributions from employers and employees affect employment. From a strictly economic perspective, social contributions are a tax to employment that creates a gap between what the employer pays and what the employee receives. As a consequence, when contributions are increased provide more resources for pensions or health care, employment may be perturbed. Ultimately, this may alter the system's revenue-raising capacity. It is understandable that some countries have consequently proposed alternative ways to finance social security or to guarantee pensions for the retirees.
The discussion above tends to be framed within a controversy on the desirable weight to give to each of the pillars popularised by the World Bank (1994): public pensions; occupational pensions; and personal pensions. Basically, these reforms, that seek to make the system sustainable, are about strengthening the second pillar (occupational pensions) and the third pillar (personal pension) taking into account the weaknesses identified in the first pillar (public pensions). In this sense, besides fiscal incentives, financial education of the population can be important (OECD, 2016). Nonetheless, it is evident that improving pension education of individuals does not guarantee, on its own, the success of the policies suggested. It has to be acknowledged that transitioning towards DC schemes does not only involve risks and uncertainty, but also that many workers – whose link with the productive system is not strong enough – will find it difficult to create a fund guaranteeing them a pension that will cover their basic needs once retired. In this context, there are groups that are especially vulnerable, such as women with caring responsibilities. Therefore, perhaps the debate should feature, in addition to arguments surrounding the sustainability of the pension system, the impact of the proposed policies on certain social collectives.
Public pensions are still vital to explain the income of the old aged in the EU. But the outcome has been that the importance of other pillars has grown in the recent years, especially that of occupational pensions, whose provision is associated to the employment of the worker and represent a good complement to the retiree's income. These plans were set by the employees with the occasional collaboration of unions, and have gained prominence in the EU in the last decades. Yet, there exist major differences between countries, as well as across sectors of the economy in which they are applied (Reference WissWiss, 2015). A ‘multi-pillar architecture’ does not clear up all uncertainty. The recent crisis served as a reminder of the vulnerability of financial assets – in particular, of those that finance pension systems – to market fluctuations (Reference EbbinghausEbbinghaus, 2015). Accordingly, the debate may be augmented with more general arguments, surrounding the prospective role of the public sector in market economies.
There is one extra element that deserves an additional note. Within the EU, political action is articulated within programmes that require the endorsement of the constituents in order to be implemented. As the consequences of pension-affecting politics span several electoral, perhaps political parties and social agents should strive to reach an agreement. In fact, if we aim for convergence of the member states of the EU – not only in the economic area but also in the social sphere – the adequate framework for this debate might be supranational.
Conclusions
The sustainability of public pension systems in the EU basically depends on the relation between the number of pensioners and the contributions generated by taxpayers. Accordingly, it is desirable to have appropriate projections in order to anticipate potential disruptions that could occur. In this paper we have analysed the implications and assumptions on which Eurostat projections are based.
First of all, the thesis of an ageing European population has been confirmed. Demographic projections assume fertility rates below replacement levels, increased life expectancy and insufficient migration flows to compensate the ageing of the population.
The projections for the labour market are based on the increase in both activity rates and employment rates. The increase in activity rates would be justified by the increased participation of women and by the measures that have been established to retain older workers for longer in the labour market. As we assume a process of convergence and declining unemployment in the entire EU, an increase in the employment rates is expected – most importantly in the cases of Spain and Greece.
The ageing trend in the population is important enough to generate notable increases in the projections made both demographic and economic dependency, in spite of the anticipated increases in participation rates and employment. Notwithstanding, within this overall trend, different behaviours across countries have been detected.
The final effect of the projections results in a sustainment of public pension expenditure over GDP in the entire EU. Yet, in this case, the disparity of situations is remarkable to the point that we can foresee an increase in the degree of dispersion in said variable over time. In this respect, it is striking that some countries may depart from similar situations to take significantly different paths. For example, both Denmark and Germany had a PPS/GDP of around 10% in 2013. Yet, according to projections to 2060, Denmark's will have fallen by over 3.1 points by then, while Germany's will have increased by 2.7 points.
An analysis of the latest paths mentioned shows that, in all cases, demographic factors related to the ageing of the population are explaining the pressure to increase public pension spending as a percentage of GDP. We also discover that it is economic (job creation-related) and institutional factors (reforms aimed at decreasing the generosity of the pension system) that contribute in varying degrees to mitigate the impact of demographic factors. In this context, we have shown that states in which the ageing of the population weights more in the explanation of the growth of public pension expenditure as a percentage of GDP are, in general terms, the ones that plan greater efforts to control this spending. Yet, once again, substantial heterogeneity of circumstances is detected.
Despite the differences in dynamics that separate some countries, policy alternatives share a common ground in the EU framework, if we suppose that the goal is convergence of indicators that are not only economic but also social. In particular, the implications of the demographic and economic projections assign a limited capacity to policies aiming to enhance active population or occupation in order to offset the effects of ageing on public pension spending. Measures aimed at reducing the generosity of the system (or, in other words, those that amplify the gap between prevailing wages and pensions) are gaining momentum. As a result, we cannot escape a conflict of interest. Consensus seeking will be necessary to prevent, as far as possible, adjustment costs from increasing inequality between social groups.
Acknowledgements
I am grateful for the remarks and suggestions of two anonymous referees. Their contributions have allowed me to substantially amend, enhance and overall ameliorate an earlier version of this paper. All errors are my own.
Disclosure statement
No potential conflict of interest was reported by the author.