I. INTRODUCTION
Surface roughness and finite sample thickness are major sources of error in the nanoindentation measurements of thin films. The former makes it difficult to determine the effective contact point between the indenter and sample surface. Such difficulty may be avoided by using depths of indentation at least ∼20 times the roughness depth to negate the surface roughness effect. However, the latter limits the usable depth range of indentation to be no more than ∼10% of the film thickness. For a film/substrate system with a large elastic modulus mismatch, the upper limit of the depth range can decrease further. There is thus no window of usable indentation depth for many thin films with rough surfaces used for practical applications. Although a polishing technique can reduce the surface roughnesses of some materials, it is difficult to apply it to a material in thin-film form as it can easily cause delamination or material loss. Not to mention, the use of a polishing technique that alters the mechanical properties or/and residual stress state of the material (e.g., mechanical polishing for metals and alloys) must be avoided. To address this long-standing problem of nanoindentation, a robust method is presented for determining the mechanical properties of thin films with inherently rough surfaces by nanoindentation. The present method is demonstrated for amorphous diamond-like carbon (DLC) coatings commonly used for tribological, optical and electrical applications.
II. THEORY
A. Background
Nanoindentation determines the contact depth of the indenter, h c, using the procedure developed by Oliver and Pharr Reference Oliver and Pharr1 as
 $${h_{\rm{c}}} = h - 0.75{P \mathord{\left/ {\vphantom {P S}} \right. \kern-\nulldelimiterspace} S}\quad ,$$
where h is the vertical displacement of the indenter from the instance of first contact with the ideally flat and smooth sample surface, P is the applied load, and S is the contact stiffness. The projected area, A, of the indentation is obtained as a function of h c using a pre-determined area function, A = f(h c). Reference Oliver and Pharr1 Since the hardness, H, and the reduced elastic modulus, E r, which takes into account the elastic deformations of both the sample and indenter, are defined as being equal to P/A and directly proportional to S/A 1/2, respectively, Reference Oliver and Pharr1 an inaccuracy in determining h directly impacts the accuracy of H and E r measurements.
To determine h, the point of first surface contact is detected as the instance at which the measured contact load signal begins to rise from zero or reaches a pre-set threshold slightly above zero, depending on the type and signal measurement resolution of the instrument. For instruments with continuous stiffness measurement capabilities, the contact stiffness signal can be a more useful basis for determining the initial contact point. Reference Oliver and Pharr1 Where the signal measurement resolution is insufficient to permit the use of a near-zero threshold for contact point detection, however, the detected point fails to correctly identify the actual point of first surface contact. If the depth of surface roughness is non-trivial compared to the indentation depths at which measurements are required, the use of the actual initial contact point in working out h does not necessarily yield the true contact depth via Eq. (1). In either case, an effective contact point, h = h 0, that defines the initial engagement of the indenter with a horizontal plane effectively representing the local surface height profile of the sample is extrapolated using contact mechanics theories applicable to individual contact mechanical conditions. To reflect the effective contact point in the analysis, Eq. (1) is re-written as
 $${h_c} = \left( {h - {h_0}} \right) - 0.75\left( {P - {P_0}} \right)/S\quad ,$$
where h − h 0 is the displacement of the indenter from the representative plane of the sample surface and P − P 0 is the contact load.
There are methods of extrapolation based on Hertz theory of elastic contact intended for spherical indentation. Reference Chudoba, Schwarzer and Richter2,Reference Kalidindi and Pathak3 In the method proposed by Chudoba et al., Reference Chudoba, Schwarzer and Richter2 the initial elastic portion of the load–displacement curve is fitted with a power-law function of the form P = C(h − h 0)3/2, where C is a constant, so as to extrapolate the effective contact point at zero force. In the method developed by Kalidindi and Pathak, Reference Kalidindi and Pathak3 the continuously measured S as well as h and P signals are fitted with a relation of the form S = 1.5(P − P 0)/(h − h 0) by finding the amounts of h 0 and P 0 needed to achieve the best fit using the least-squares method. Where the measurement of hardness is also required, however, it is essential to use a pyramidal or conical indenter to ensure that the indentation strain imposed on the sample does not change with depth. The initial elastic contact deformation associated with the blunted section of a pointed indenter may conform to either model in some cases but not if the sample has a considerably rough surface comprising multiple asperities. There have been attempts in depth-sensing (micro-scale) hardness testing with a pyramidal indenter to back-extrapolate the effective contact point by fitting a second-order polynomial function to a portion of the load–displacement curve outside of the initial elastic deformation regime on the implicit assumption that the universal hardness of the material is constant with depth. Reference Grau, Berg, Fränzel and Meinhard4,Reference Ullner5 However, these attempts proved not entirely successful largely because of the limited validity of the mathematical function to describe the mechanical responses of materials. Reference Ullner5 In fact, the assumption of constant hardness is often unrealistic in nano-scale indentation testing not only because of its sensitivity to the indenter tip geometry that is often imperfect at small length scales but also because of its dependence on the size of indentation observed for some materials. Reference Nix and Gao6 Moseson et al. Reference Moseson, Basu and Barsoum7 proposed a method specifically for a bulk homogeneous material in contact with a spherical indenter of radius R, for which the radius of the circle of contact is conveniently described as a = (2Rh c − h c 2)1/2. Given direct proportionality between S and a (∝A 1/2) for a material with spatially constant E r, the method forces the S versus a curve to form a straight line that goes through the origin by adjusting the values of h 0 and P 0. Reference Moseson, Basu and Barsoum7 The actual adjustment process involves calculating h c from Eq. (2) using the three signals with varied amounts of h 0 and P 0 and finding a combination of h 0 and P 0 that results in the highest degree of direct proportionality between S and (2Rh c − h c 2)1/2 through an iterative process. Reference Moseson, Basu and Barsoum7 Despite being limited to a strictly spherical indenter geometry, one useful aspect of this method lies in its ability to adopt any fitting range in a higher load region where the measured signals are reliable so that the effective contact point can be back-extrapolated from there back through the origin, thus eliminating the artifactual influence of sample surface roughness on the test result.
B. Present approach
The new method presented in this work also relies on the ability of the Oliver–Pharr method to monitor the changing contact dimensions during indentation, but differs substantially in its detailed design to be able to deal with samples in thin-film form through removing the surface roughness and substrate effects simultaneously.
The present method first assumes that the Young's modulus and Poisson's ratio of the sample, E, ν, respectively, and those of the underlying substrate, E s, νs, respectively, are spatially constant, and that the thickness, t, and ν of the sample and E s and νs of the substrate are known a priori. The thickness of the film sample can be measured from the image of its cross-section, the Poisson's ratios of the sample and substrate may be reasonably assumed to have values (of the same or similar materials) available in the literature, and the Young's modulus of the substrate can be calculated from the reduced modulus of the uncoated substrate measured by nanoindentation along with the Poisson's ratio.
If the sample thickness relative to the indentation depth is large enough to negate the influence of the underlying substrate, the reduced elastic modulus (E r) defined as 1/E r = (1 − ν2)/E + (1 − νi 2)/E i, where νi = 0.07 and E i = 1140 GPa are the Poisson's ratio and Young's modulus, respectively, of the diamond indenter, satisfies the following relation Reference Oliver and Pharr1
 $${S \mathord{\left/ {\vphantom {S {(2\beta a)}}} \right. \kern-\nulldelimiterspace} {(2\beta a)}} = {E_r}\quad ,$$
where a is the radius of a circle having an area equivalent to the projected contact area of the indenter, β is a geometric constant of the indenter on the order of unity, and S/(2βa) is the normalized contact stiffness. From Eq. (3), a is obtainable as a function of S for a bulk reference material of known Young's modulus and Poisson's ratio provided that the material has a sufficiently flat and smooth surface. The contact depth is determined from the three signals h, P and S via Eq. (2), wherein h 0 may be determined by the aforementioned extrapolation procedure of Chudoba et al. Reference Chudoba, Schwarzer and Richter2 using the initial elastic portion of the load–displacement curve, and P 0 is readily determinable as the load recorded while the indenter is out of contact by the use of an instrument that allows the indenter tip to be lifted from the sample surface immediately prior to indentation loading. Plotting the obtained a and h c against each other, one is thus able to identify the shape profile of the three-dimensional indenter in a two-dimensional fashion provided that the deformation of the diamond indenter is substantially smaller than that of the sample surface. In the case of a pyramidal indenter, the obtained a–h c curve reveals the shape profile of its equivalent conical indenter. Through slight modification of the standard indenter area function, Reference Oliver and Pharr1 the a–h c curves of a number of important indenter geometries including cone, pyramid, sphere and tip-blunted cone or pyramid may be described using the function of the form
 $$a = {C_1}{h_c} + {C_2}\mathop {{h_{\rm{c}}}}\nolimits^{1/2} +\; {C_3}\mathop {{h_{\rm{c}}}}\nolimits^{1/4} + \ldots + {C_9}\mathop {{h_{\rm{c}}}}\nolimits^{1/256} \quad ,$$
where C 1, C 2, C 3, … C 9 are constants determinable by the least-squares method.
For a sample in thin-film form, Eq. (3) no longer holds as a mismatch in Young's modulus between the film and underlying substrate causes S/(2βa) on the left-hand side of the equation to approach the Young's modulus of the substrate with increasing indentation depth whereas E r on the right-hand side of the equation is forced to remain constant. However, there are several closed-form models of film/substrate systems Reference Gao, Chiu and Lee8–Reference Hay and Crawford15 that allow to predict the change of S/(2βa) as a function of the normalized contact radius, a/t, using the material property constants of the film sample (E, ν), substrate (E s, νs) and indenter (E i, νi). The present method adopts the Hay–Crawford model Reference Hay and Crawford15 that was developed based on the earlier models of Gao et al. Reference Gao, Chiu and Lee8 and Song and colleagues Reference Song11,Reference Rar, Song, Pharr, Ozkan, Freund, Cammarata and Gao12 in an effort to extend the applicability of the original models to a wider range of the film-to-substrate elastic modulus mismatch ratios. Using this model, a is now related to S in closed form as Reference Hay and Crawford15
 $${\left( {{S \over {2\beta a}}} \right)^{ - 1}} = \left( {1 - {\nu _{\rm{a}}}} \right)\left( {{{1 - {I_0}} \over {{{{E_{\rm{s}}}} \over {1 + {\nu _{\rm{s}}}}} + 0.0626{I_0}{E \over {1 + \nu }}}} + {{{I_0}} \over {{E \over {1 + \nu }}}}} \right) + {{1 - \nu _{\rm{i}}^2} \over {{E_{\rm{i}}}}}\quad ,$$
where I 0 is a weighting function derived by Gao et al., Reference Gao, Chiu and Lee8 defined as
 $${I_0} = {2 \over \pi }\,{\tan ^{ - 1}}\left( {{t \over a}} \right) + {1 \over {2\pi \left( {1 - {\nu _{\rm{a}}}} \right)}}\left[ {\left( {1 - 2{\nu _{\rm{a}}}} \right)\left( {{t \over a}} \right)\ln \left( {{{1 + {{\left( {{t \mathord{\left/ {\vphantom {t a}} \right. \kern-\nulldelimiterspace} a}} \right)}^2}} \over {{{\left( {{t \mathord{\left/ {\vphantom {t a}} \right. \kern-\nulldelimiterspace} a}} \right)}^2}}}} \right) - {{{t \mathord{\left/ {\vphantom {t a}} \right. \kern-\nulldelimiterspace} a}} \over {1 + {{\left( {{t \mathord{\left/ {\vphantom {t a}} \right. \kern-\nulldelimiterspace} a}} \right)}^2}}}} \right]\quad ,$$
and νa is the apparent Poisson's ratio of the composite system due to Song, Reference Song11 defined as
 $${\nu _{\rm{a}}} = 1 - {{\left( {1 - {\nu _{\rm{s}}}} \right)\left( {1 - \nu } \right)} \over {1 - {I_1}{\nu _{\rm{s}}} - \left( {1 - {I_1}} \right)\nu }}\quad ,$$
where I 1 is another weighting function of Gao et al., Reference Gao, Chiu and Lee8 defined as
 $${I_1} = {2 \over \pi }\,{\tan ^{ - 1}}\left( {{t \over a}} \right) + {{{t \mathord{\left/ {\vphantom {t a}} \right. \kern-\nulldelimiterspace} a}} \over \pi }\ln \left( {{{1 + {{\left( {{t \mathord{\left/ {\vphantom {t a}} \right. \kern-\nulldelimiterspace} a}} \right)}^2}} \over {{{\left( {{t \mathord{\left/ {\vphantom {t a}} \right. \kern-\nulldelimiterspace} a}} \right)}^2}}}} \right)\quad .$$
Given that all material property constants in the model are known a priori except one unknown constant associated with the Young's modulus of the sample (E), it is possible to obtain a of the film/substrate system as a function of S if a correct value of the constant E is substituted therein. In the case of a bulk sample for which the substrate effect is completely negligible, the model automatically reduces to Eq. (3) through substitution of I 1 = 1 in Eq. (7) and I 0 = 1 in Eq. (5).
A film-to-substrate elastic modulus mismatch adds to the substrate effect via another route by affecting the ability of the Oliver–Pharr method to determine h c as the presence of a stiffer or more compliant substrate beneath the film can alter the extent to which the film material piles up or sinks in, depending on the direction as well as the degree of modulus mismatch, and the indentation depth relative to the film thickness. Reference Hay and Crawford15 Through a series of elastic finite element analyses for a conical indenter the shape of which is two-dimensionally analogous to the Berkovich indenter, Hay and Crawford Reference Hay and Crawford15 showed that the error in determining h c caused by a modulus mismatch is below ∼5% for a E/E s mismatch ratio of 0.1–2 so long as the analysis is performed at indentation depths below ∼15% of the film thickness. Since P 0 is readily determinable as the load recorded while the indenter is out of surface contact prior to indentation, Eq. (2) allows h c of the film/substrate system to be determined below 15% of the film thickness if a correct value of h 0 is substituted into the equation as described in the procedure below.
The contact radius, a = f(S, E), and the contact depth, h c = f(h, P, S, h 0), of the film/substrate system are computed for combinations of ranges of E and h 0 so as to obtain the indenter shape profile due to every combination of E and h 0. On the basis that the a–h c curve of the rigid indenter contacting the film/substrate system should be identical to the pre-determined indenter shape profile function, the present method extrapolates the values of E and h 0 as the pair that uniquely minimizes the root-mean-square error (RMSE) between the two shape profiles over a valid contact depth range. The contact radius (a) is then re-calculated from the indenter shape profile function of Eq. (4) using h c that had been re-calculated with the extrapolated value of h 0 via Eq. (2). Solving Eq. (5) for E using the procedure developed by Hay and Crawford Reference Hay and Crawford15 (details not shown) and substituting S and re-calculated a in the equation, the Young's modulus of the film (E, now being a variable) is finally given as a function of the normalized contact radius.
III. EXPERIMENTAL
A. Materials
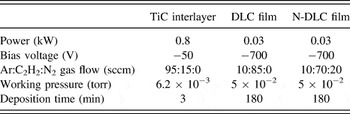
Pure DLC and nitrogen-doped DLC (N-DLC) films were synthesized by a hybrid PVD + CVD coating system operated at 300 °C under the base pressure of 2 × 10⁻⁵ torr. Single crystalline silicon (100) substrates, cut from the same piece of a polished, prime-grade Si wafer (660–690 μm thickness, LG Siltron Inc., Gumi, Gyeongsangbuk, Korea), were ultrasonic cleaned sequentially in acetone, ethanol and distilled water prior to film deposition. For adequate film adhesion onto the substrate, a thin TiC interlayer was deposited on the cleaned substrate from a titanium target in Ar + C2H2 atmosphere by the high-power impulse magnetron sputtering (HiPIMS) technique for a duration of 3 min. Subsequently, a pure or nitrogen-doped DLC film was deposited in Ar + C2H2 gas mixture by the DC plasma enhanced chemical vapor deposition (DC-PECVD) technique. The detailed deposition parameters are summarized in Table I. The thicknesses of the pure and doped DLC films, measured from the scanning electron micrographs of the respective cross-sections, were 1.45 μm and 1.16 μm, respectively, inclusive of the interlayer (∼40 nm). The interlayer thickness was minimized to be ∼3% of the total film thickness so as to ensure that the bilayer system may be modeled effectively as a single layer system. For the Young's modulus, Poisson's ratio and thickness of the silicon substrate, E s = 170 GPa, νs = 0.25 (Ref. Reference Saha and Nix13) and t = 675 μm were used throughout this work.
Deposition parameters used for pure and nitrogen-doped DLC films.

B. Surface preconditioning
The instrument used in this study monitors thermal drift at a constant contact load prior to indentation and works out the time-mean drift rate to correct the indentation displacement data for thermal drift. However, the monitored displacement signal of either film varied non-linearly with time due to the local deformation of surface asperities, making it impossible to perform drift correction accurately. To enable accurate determination of thermal drift prior to indentation, each film was polished over a 20 μm × 20 μm square region by raster scanning a spherical diamond probe of ∼150 nm tip radius at a contact load of ∼50 μN for a total of 20 passes using the scanning probe microscopy (SPM) imaging capability of the TI 950 TriboIndenter® (Hysitron, Inc., Eden Prairie, MN, USA). The polished film surfaces were thoroughly cleaned with cotton swabs containing ethanol.
C. Surface roughness characterization
The topographic images of the pure and nitrogen-doped DLC films were obtained over a 4 μm × 4 μm square region in the center of the polished region using the SPM imaging capability of the TI 950 TriboIndenter fitted with a sharp probe (cube corner diamond probe of ∼20 nm tip radius) at a low imaging force of ∼0.5 μN.
D. Nanoindentation
All indentation tests in this study were performed using the nanoDMA® III dynamic indentation module (Hysitron, Inc., Eden Prairie, MN, USA) incorporated in the TI 950 TriboIndenter. All tests were conducted at room temperature using the same Berkovich diamond indenter having a tip radius of ∼80 nm. The geometric constant of the pyramidal indenter (β) was assumed to be 1.05.
Reference Oliver and Pharr1
The use of the dynamic indentation module allowed the continuous measurement of contact stiffness by applying a gradually increasing quasi-static force while simultaneously superimposing a small oscillatory force at the default excitation frequency of 200 Hz. The load-rate over load ratio
 $\left( {{{\dot P} \mathord{\left/ {\vphantom {{\dot P} P}} \right. \kern-\nulldelimiterspace} P}} \right)$
was kept constant at ∼0.15 s−1 during indentation loading so as to maintain a constant strain rate. Results obtained using this method should not depend on the excitation frequency or the load-rate over load ratio for time-independent materials such as DLC films. The Poisson's ratios of the pure and doped DLC films were both assumed to be ν = 0.22.
Reference Cho, Lee, Eun, Hahn and Ko16
IV. RESULTS AND DISCUSSION
A. Surface topography
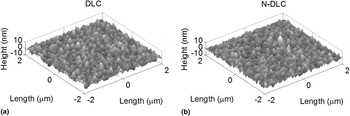
The topographic images of the pure and nitrogen-doped DLC films (after the surface preconditioning) are shown in Figs. 1(a) and 1(b), respectively, where both films exhibit rough surfaces of similar roughness dimensions. The peak-to-valley roughness values of the pure and doped DLC films were ∼15 nm and ∼20 nm, respectively. The peak-to-valley roughness of the doped DLC reduces to ∼15 nm by excluding the tallest bump seen about a half microns away from the center of the image [Fig. 1(b)]. The peak-to-valley roughness of either film measured over a 4 μm × 4 μm square area in a non-preconditioned region was ∼23 nm or ∼21 nm, respectively. The RMS roughness of each film was about 2 nm, which was about 2/3 of the RMS roughness prior to the surface preconditioning.
SPM images of (a) pure DLC film and (b) nitrogen-doped DLC film.

B. Indenter shape profile function
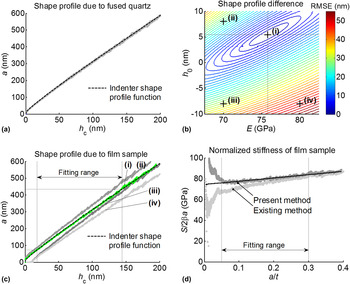
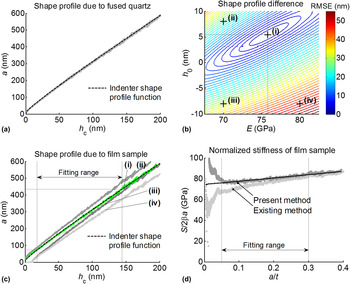
Figure 2(a) shows the contact radius versus contact depth (a–h c) curves of the Berkovich indenter obtained from n = 4 dynamic indentation tests of fused quartz as a bulk reference material of known property values (E = 72 GPa, ν = 0.17). The shape profile function of the indenter, shown as the dashed line in the figure, was obtained by fitting the mathematical function of Eq. (4) to the a–h c curves of fused quartz. The indenter shape profile function describes the experimental curves accurately over the measurement range. Since the Young's modulus of fused quartz is only ∼6% of that of the diamond indenter, the deformation of the indenter must have been negligibly small compared to that of fused quartz. Thus, the obtained function may be taken to represent the two-dimensional shape profile of the indenter.
(a) Contact radius (a) versus contact depth (h c) curves of Berkovich indenter obtained from n = 4 dynamic indentation tests of fused quartz, with the indenter shape profile function of Eq. (4) fitted to the a–h c curves; (b) calculated RMSEs between the indenter shape profile function and the a–h c curve of pure DLC film as a function of the two fitting constants E and h 0, showing a unique global minimum at (E, h 0) = (75.8 GPa, 5.4 nm); (c) a–h c curves of the same test (of the same film) obtained (i) at the global minimum of (75.8 GPa, 5.4 nm), (ii) at (70 GPa, 8 nm), (iii) at (70 GPa, −8 nm) and (iv) at (80 GPa, −8 nm); (d) normalized stiffness [S/(2βa)] versus normalized contact radius (a/t) of the same test obtained with present method (h 0 = 5.4 nm) and existing method of Chudoba et al. (h 0 = 1.85 nm) along with prediction by the Hay–Crawford model for (E, h 0) = (75.8 GPa, 5.4 nm) in solid line.
C. Effective contact point
The RMSE between the indenter shape profile function and the a–h c curve of each test of each film was calculated for every combination of E in the range of 75 ± 7.5 GPa with 0.1 GPa increment (i.e., n = 151) and h 0 in the range of 0 ± 10 nm with 0.1 nm increment (i.e., n = 201) over the contact depth range corresponding to 0.05 ≤ a/t ≤ 0.30 of the indenter shape profile function. The use of this curve fitting range allowed exclusion of the signals severely affected by the rough sample surface at shallow indentation depths (h − h 0) as well as those at indentation depths above ∼15% of the film thickness, where the determination of h c by the Oliver–Pharr method may not be as reliable. The calculated RMSEs of one of the test results of the pure DLC film are plotted as a function of the two constants E and h 0 in Fig. 2(b), where a unique global minimum is observed at (E, h 0) = (75.8 GPa, 5.4 nm). A unique global minimum in RMSE was observed for all tests performed on the DLC films in this work. In generating the shape profile difference plot in the form of Fig. 2(b), it is necessary to set the E and h 0 parameter ranges such that the global minimum lies within the respective parameter ranges. One may initially set the E parameter range according to the range of the Young's modulus values obtained at a plurality of test locations using the existing extrapolation method [see Fig. 3(b)]. The h 0 parameter range may be set to be 0 ± the peak-to-valley surface roughness. One may have to adjust the respective parameter ranges not only to ensure that the global minimum is identified in the plot but also to minimize the computational time needed. The a–h c curve of the same test obtained (i) at the global minimum of (75.8 GPa, 5.4 nm) is plotted together with the indenter shape profile function in dashed line in Fig. 2(c), showing good agreement of the a–h c curve with the indenter shape profile function. The a–h c curves of the same test obtained away from the global minimum (ii) at (70 GPa, 8 nm), (iii) at (70 GPa, −8 nm), and (iv) at (80 GPa, −8 nm) are also plotted in Fig. 2(c) to give an idea of how the shape profile looks when incorrect combinations of E and h 0 are used in the calculation. Re-calculating a from the indenter shape profile function of Eq. (4) using h c that had been re-calculated with the extrapolated h 0 value for the same test, S/(2βa) or the normalized stiffness is now given as a function of the normalized contact radius (a/t). Figure 2(d) shows the S/(2βa) versus a/t curve of the same test obtained by the present contact point extrapolation method (h 0 = 5.4 nm) and that obtained by the existing method of Chudoba et al. Reference Chudoba, Schwarzer and Richter2 using the initial elastic portion of the P–h curve below 15 μN (h 0 = 1.85 nm). It is noted in this figure that the difference between the two curves increases to a significant level with decreasing normalized contact radius toward the lower end of the fitting range. The solid line in the figure shows the prediction by the Hay–Crawford model for (E, h 0) = (75.8 GPa, 5.4 nm), which closely approximates the experimental relationship obtained with the present extrapolation method, as expected.
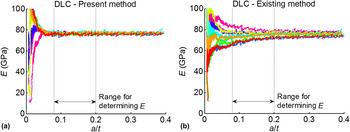
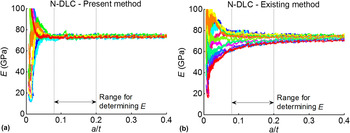
Young's modulus (E) versus normalized contact radius (a/t) of pure DLC film (n = 10) obtained with (a) present and (b) existing methods.

D. Young's modulus
To extract the intrinsic Young's modulus of the solid DLC material, 3 out of 13 tests of the pure DLC film and 4 out of 16 tests of the nitrogen-doped DLC film that showed significantly higher RMSE minima, suggestive of local defects of the film material, were excluded from further consideration. The E versus a/t curves obtained with the present and existing extrapolation methods are plotted for the remaining 10 tests of the pure DLC film in Fig. 3 and for the remaining 12 tests of the nitrogen-doped DLC film in Fig. 4. From these figures, the existing extrapolation method of Chudoba et al. Reference Chudoba, Schwarzer and Richter2 resulted in a considerable scatter of the Young's modulus near the surface of either film, leading to a (false) conclusion that these film materials are elastically heterogeneous near the surface. The present extrapolation method was found to eliminate the modulus scatter down to the lower limit of the fitting range (a/t = 0.05) only at the expense of increasing the scatter well below the lower limit, where the obtained results are unusable anyway being severely affected by the multiple asperity contact. More importantly, all valid test results of either film performed at various surface locations were collapsed into a single horizontal line not only within the fitting range (0.05 ≤ a/t ≤ 0.30) but also above the range (a/t ≥ 0.30), thus verifying the original assumption that the Young's modulus of the film material is indeed spatially constant. The Young's modulus of each test was calculated as the mean E value in the a/t range of 0.08–0.2, the upper limit of which corresponds to ∼10% of the film thickness in indentation depth.
Young's modulus (E) versus normalized contact radius (a/t) of nitrogen-doped DLC film (n = 12) obtained with (a) present and (b) existing methods.

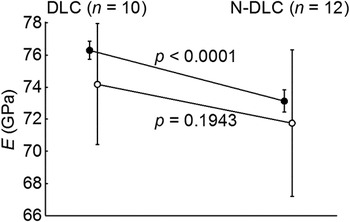
The Young's moduli of the pure and nitrogen-doped DLC films, determined as the means ± standard deviations of the n = 10 and n = 12 tests, respectively, are shown in Fig. 5. The mean Young's moduli of the pure and doped DLC films obtained with the existing extrapolation method were found to be few percent smaller than those obtained with the present method. This finding may be attributed to the inability of the Berkovich indenter having a large included angle of 142.3° to reach the troughs of the rough surfaces, which would cause the mean indentation depth to be overestimated and hence the mean Young's modulus to be underestimated with the existing extrapolation method.
Young's moduli (mean ± standard deviation) of the selected tests of pure DLC film (n = 10) and nitrogen-doped DLC film (n = 12) using present (filled circles) and existing (open circles) methods.

The unpaired t-test results between the pure and doped DLC films show that the difference in modulus obtained with the existing extrapolation method is not statistically significant with a p value of 0.1943, whereas the difference obtained with the present extrapolation method is statistically significant with a p value of <0.0001. The present method of extrapolating the effective contact point thus confirms the known effect of nitrogen doping to reduce the Young's modulus of the DLC by altering the bonding structures in such a way as to increase the degree of graphitization of the carbon material. Reference Lenardi, Baker, Briois, Nobili, Piseri and Gissler17 Whereas the existing extrapolation method was unable to confirm the same effect. The Young's modulus of the solid DLC material decreased by ∼4% due to nitrogen doping.
E. Limitations of the present method
One well-known problem with using Eq. (2) in determining the contact depth is that it does not account for pile-up of material around the contact impression. Reference Oliver and Pharr1 When pile-up occurs, the contact depth predicted by the equation underestimates the actual contact depth. Reference Oliver and Pharr1 The occurrence of material pile-up thus compromises the accuracy of the present method. Based on the topographic images of the residual indent impressions taken of both films (not shown), we were able to confirm the absence of material pile-up, hence the validity of the analyses performed on the films using the present method.
As established in Sec. II, Eq. (2) is valid in the indentation depth range up to ∼15% of the film thickness for a film-to-substrate modulus mismatch ratio in between 0.1 and 2. For modulus mismatch ratios outside of this range, the upper limit of the valid indentation depth range is reduced. Based on the elastic solution of Yu et al. Reference Yu, Sanday and Rath18 for the contact of a rigid conical punch on a layered half-space, Han and Vlassak Reference Li and Vlassak19 developed a more rigorous approach to contact depth determination that requires iterative numerical calculations. This numerical approach may be used in place of Eq. (2) so as to increase the valid ranges of indentation depths and modulus mismatch ratios for the present method.
The present method utilizes the dynamic indentation data of a film/substrate system (with a film-to-substrate modulus mismatch ratio of 0.1–2) over the indentation depth range up to ∼15% of the film thickness in performing the tip shape analysis. Since the dynamic indentation data in the indentation depth range below the depth of surface roughness (peak-to-valley roughness) is unusable for the tip shape analysis, the greater the roughness depth of the sample, the narrower the indentation depth range available for performing the analysis. The ratio of surface roughness depth to film thickness was well below 2% for either film studied in this work. For roughness depth to film thickness ratios, say, above ∼5%, the tip shape analysis may not be as reliable as the lower limit of the usable indentation depth range (∼5% of film thickness) is rather close to the upper limit (∼15% of film thickness).
V. CONCLUSIONS
A robust method for extracting the mechanical properties of thin films with rough surfaces was developed. The method uses two-dimensional shape profile of the indenter obtainable from the dynamic indentation test result of the film/substrate system as a basis for determining the effective contact point between the indenter and sample surface in that test. The method demonstrated its ability to reduce the error several times in determining the Young's moduli of DLC films doped and undoped with nitrogen at indentation depths as shallow as ∼50 nm despite high peak-to-valley surface roughness of the order of ∼15 nm. The method further demonstrated its ability to verify the original assumption that the Young's moduli of both DLC films are spatially constant. We were thus able to confirm the effect of nitrogen incorporation to mildly reduce the Young's modulus of the DLC material. It is noted that the present method assumes no pile-up of the material around the contact impression and requires the film-to-substrate modulus ratio to be within the range of 0.1–2 so as to be able to perform the tip shape analysis over the indentation depth range below ∼15% of the film thickness. As the surface roughness inevitably lifts the lower limit of the indentation depth range over which the analysis can be performed, the present method will be unsuitable for analyzing film/substrate systems with roughness depths comparable to ∼15% of the film thickness.
ACKNOWLEDGMENTS
This study was supported by Global Frontier Program through the Global Frontier Hybrid Interface Materials (GFHIM) of the National Research Foundation of Korea (NRF) funded by the Ministry of Science, ICT & Future Planning (2013M3A6B1078873 and 2013M3A6B1078874). The authors also acknowledge support from Hysitron, Inc. on the state-of-the-art TI 950 TriboIndenter® nanomechanical test instrument used for this work.