The populations of several developed countries are ageing at unprecedented rates. The ageing of the general population is directly linked to increased age-related disease burden and healthcare utilisation(Reference Atella, Piano Mortari and Kopinska1). Maintaining the independence of healthy older people is important for reducing these economic burdens.
Coffee and tea are consumed worldwide, with green tea being especially popular in Asia. The consumption of these beverages has been reported to be inversely associated with the risk of death(Reference Chen, Zhang and Zhang2) and incidences of disease and disability(Reference Zhu, Hu and Liu3). Although these beverages contain substances that have beneficial effects on health, such as polyphenols, they also contain caffeine(Reference van Dam, Hu and Willett4), for which an upper limit of intake (400 mg/d) has been established(Reference Wikoff, Welsh and Henderson5,Reference van Dam and Hu6) . Excessive caffeine consumption can lead to increased sympathetic activity and circulating catecholamine concentrations through stimulation of the central nervous system(Reference Corti, Binggeli and Sudano7), which may result in significant cardiovascular stress(Reference Svatikova, Covassin and Somers8) and sleep disorders(Reference Temple, Bernard and Lipshultz9). Therefore, evaluating the association between caffeine intake and health outcomes is necessary for determining the safety of habitual coffee and tea consumption.
While several epidemiological studies have indicated an inverse association between caffeine intake and the risk of mortality in adults(Reference Chen, Li and Gao10–Reference Mineharu, Koizumi and Wada13), there are fewer studies compared with those on coffee and green tea consumption and health outcomes(Reference Zhu, Hu and Liu3,Reference Poole, Kennedy and Roderick14) . Moreover, previous studies have focused on the relationship between quartiles of caffeine intake and the risk of death but not on the dose–response relationship between mortality risk and caffeine consumption. To our knowledge, no study has examined the relationship between caffeine consumption and the risks of mortality and disability in older adults.
In this cohort study, we aimed to evaluate the associations between caffeine, green tea and coffee consumption and mortality and disability among older adults. Considering previous reports(Reference Chen, Li and Gao10–Reference Mineharu, Koizumi and Wada13), we hypothesised that moderate caffeine, coffee and green tea consumption is inversely associated with the risks of mortality and disability in older adults.
Material and methods
Study population
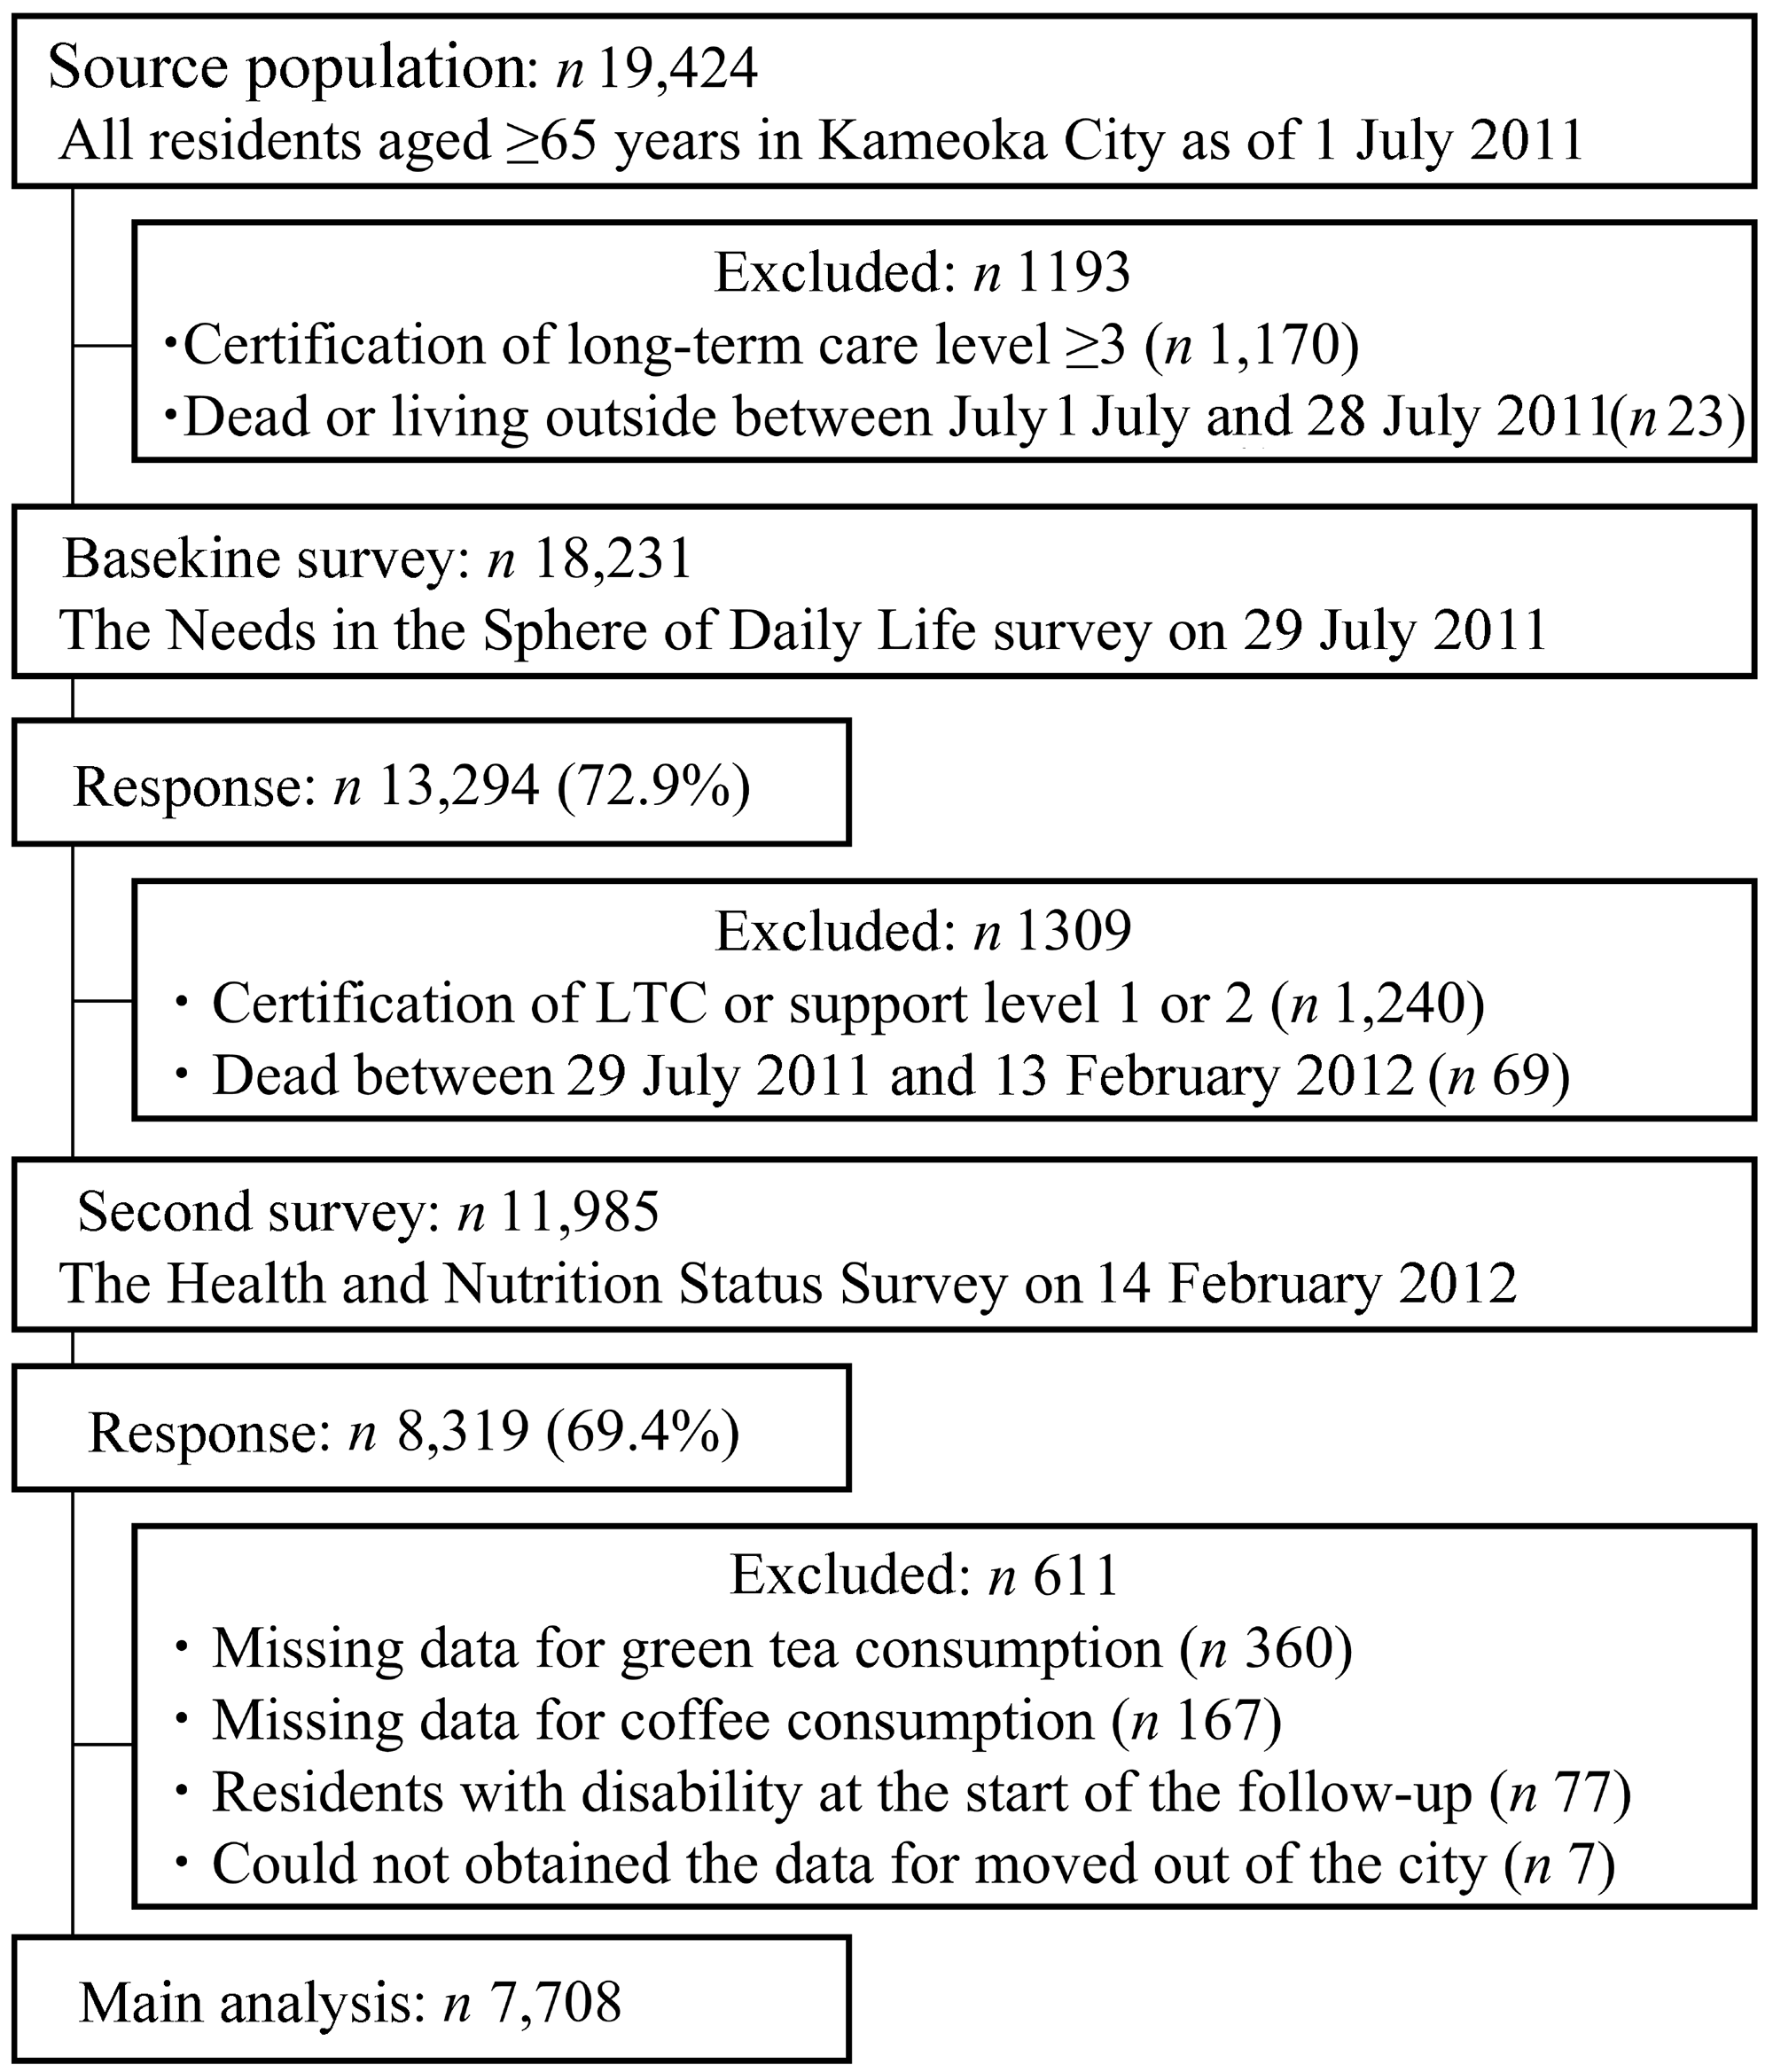
This prospective cohort study examined the data of older adults aged ≥ 65 years who reside in Kameoka City, Kyoto Prefecture, Japan(Reference Watanabe, Yoshida and Yamada15–Reference Nanri, Yamada and Itoi21). Of the individuals selected from the residents of Kameoka City aged ≥ 65 years (n 19 424), those who required long-term care (n 1170) and those who died between 1 July 2011 and 28 July 2011 (n 23) were excluded (Figure 1). The remaining 18 231 participants completed the baseline survey on 29 July 2011. Of the residents whom the survey questionnaire was sent to, 13 294 responded (response rate: 72·9 %). On 13 February 2012, we excluded the respondents who died or required long-term care. The remaining 11 985 respondents underwent an additional survey on 14 February 2012, which included completing a FFQ that assesses dietary intake. Of the 11 985 respondents, 8370 returned the questionnaire. Among them, 8319 (response rate, 69·4 %) provided valid responses, were individually identifiable from the questionnaire responses and had sex information consistent with that obtained from the first and second surveys. Of those who participated in the additional survey (n 8319), we excluded the respondents whose green tea (n 360) and coffee (n 167) consumption data were missing, those with a disability at the start of the follow-up (n 77) and those with no data on the date they moved out of Kameoka City (n 7). Thus, 7708 participants were included in this study.
Participant flow diagram for the analysis of the relationship between caffeine, green tea and coffee consumption and disability and mortality in the Kyoto–Kameoka study. LTC, long-term care.

This study was conducted in accordance with the principles of the Declaration of Helsinki and approved by the Institutional Review Boards of the following institutions: National Institutes of Biomedical Innovation, Health and Nutrition (NIBIOHN-76-2); Kyoto University of Advanced Science (No. 20-1); and Kyoto Prefectural University of Medicine (RBMR-E-363). Informed consent was obtained from all participants upon receiving their responses to the mail-in survey.
Dietary assessment
Dietary intake was evaluated using a self-administered FFQ that consisted of forty-seven items on food and beverage intake(Reference Tokudome, Goto and Imaeda22). We previously validated the FFQ using dietary records (DR)(Reference Watanabe, Nanri and Yoshida18,Reference Imaeda, Goto and Sasakabe23) and doubly labelled water method(Reference Watanabe, Nanri and Sagayama17). The participants responded to questions regarding foods and beverage intake, including the amount of green tea and coffee consumed in the past year. The FFQ used in this study did not include questions about the brewing method of coffee or green tea. This FFQ consisted of the following eight response categories: never or seldom, 1–3 times per month, 1–2 times per week, 3–4 times per week, 5–6 times per week, once a day, twice a day and three or more times a day. The following weights for beverage consumption frequencies were assigned to the above-mentioned response categories: 0, 0·1, 0·2, 0·5, 0·8, 1·0, 2·0 and 3·0, respectively. Portion size was determined according to sex using a fixed value calculated from a 1-d weighted DR (green tea: 220 g for men, 200 g for women, coffee: 100 g for both sexes)(Reference Tokudome, Goto and Imaeda22). Green tea (r = 0·56 in both sex) and coffee consumption (r = 0·51 in men and 0·52 in women) estimated from this FFQ showed a moderate correlation with energy-adjusted green tea and coffee consumption assessed from the non-consecutive 3-d weighed DR at 3-month intervals over four seasons in Japanese adults(Reference Imaeda, Goto and Sasakabe23). Furthermore, the mean intake of green tea and coffee estimated from the FFQ and DR did not differ significantly in both men (green tea: FFQ, 278 g/d; DR, 246 g/d and coffee: FFQ, 142 g/d; DR, 143 g/d) and women (green tea: FFQ, 306 g/d; DR; 289 g/d and coffee: FFQ, 155 g/d; DR, 128 g/d)(Reference Imaeda, Goto and Sasakabe23). The caffeine content of coffee and green tea was set at 60 mg and 20 mg per 100 g, respectively, based on the data in the Standard Tables of Food Composition in Japan(24). Dietary intake, including caffeine consumption, was calculated from the intake frequency and portion size of each food and beverage using a programme based on the Standard Tables of Food Composition in Japan(24).
Other covariates
All covariate data were obtained from a baseline questionnaire survey(Reference Yamada, Nanri and Watanabe20). BMI was calculated by dividing the self-reported body weight by the height squared (kg/m2). Data on the following covariates were also collected: smoking status (‘Do you smoke?’: almost daily; sometimes; used to, but quit; never), drinking status (‘Do you drink alcohol?’: almost daily, sometimes, almost never, never), sleep duration (minutes), living status (‘What is your family structure?’: living alone, living with family, other), education attainment (years), socio-economic status (‘Financially, how does your life feel currently?’: hard, somewhat hard, somewhat easy, easy), oral status (‘Do you use dentures?’: yes, no), taking medication (number) and chronic disease (‘Do you have a disease (presence of hypertension, stroke, heart disease, diabetes, hyperlipidaemia, gastrointestinal disease, respiratory disease, urological diseases, and cancer)?’: yes, no). Co-morbidity scores were calculated from the data obtained on the nine co-morbidity statuses. The summed value yielded a total score ranging from 0 (no co-morbidity) to 9 (poor status). The previous week’s physical activity and sitting time per day were evaluated using the International Physical Activity Questionnaire-Short Form. Frailty was defined as a score ≥ 7 out of twenty-five items on the validated self-administered Kihon checklist(Reference Watanabe, Yoshida and Watanabe25).
Mortality and disability status
The survival status of the participants during the follow-up period was assessed using data from the Basic Resident Register maintained by the Kameoka City Hall, whereas disability was determined using the Japanese Long-term Care Insurance Program(Reference Watanabe, Yoshida and Yamada19,Reference Yamada and Arai26) . In the Japanese Long-Term Care Insurance Program, when an individual or their family perceived a need for care, an application for long-term care certification was submitted to the local municipal office. Following the application, a certified investigator – either a municipal employee or a contracted professional – visited the applicant’s home to conduct a standardised assessment comprising seventy-four items to evaluate the individual’s physical and mental functions. Subsequently, the Long-Term Care Certification Committee, composed of physicians and other health and welfare professionals, reviewed all relevant information and determined the applicant’s disability level. Because information on the disability status of residents is managed by municipalities, outcome data were provided by officials of the Kameoka City Hall and collected between 15 February 2012 and 30 November 2016. Participants whose records were administratively moved or removed from the municipality were censored.
Statistical analysis
Several previous studies have reported a 14 % to 23 % difference in the hazard ratios (HR) for mortality when comparing the second and the first quartiles (or categories) of caffeine intake(Reference Chen, Li and Gao10–Reference Tsujimoto, Kajio and Sugiyama12). Based on this information, we used the ‘power cox’ command in STATA to estimate the required sample size. A sample size of 460 to 1381 would provide 80 % power (1 − β error) at a 5 % significance level to detect such differences. Therefore, the sample available for this study was deemed sufficiently large.
We classified the participants into the following caffeine intake categories according to the distribution of the exposure variables: < 100 mg/d (n 2662), 100–149 mg/d (n 2161), 150–199 mg/d (n 1411) and ≥ 200 mg/d (n 1474). Coffee and green tea consumption was classified into the following four groups based on information from a previous study(Reference Nanri, Yamada and Itoi21): none, < 1 cup/d, 1–2 cups/d and ≥ 3 cups/d. The descriptive statistics for continuous and categorical variables were presented as means with standard deviation and frequencies with proportions, respectively. In cases of missing data, missing indicators were created for all the covariates.
We calculated each participant’s person-years of follow-up from the date the additional questionnaire was returned to the date of death or disability, relocation from the study area, or end of follow-up, whichever occurred first. The all-cause mortality and disability rates for each caffeine, green tea and coffee consumption group are shown as the number of events per 1000 person-years. The multivariable Cox proportional hazards model included baseline covariates that were adjusted for the confounders associated with caffeine, green tea and coffee consumption and mortality or disability. The model assumptions were confirmed using the Schoenfeld residual test (P = 0·619). The results are presented as HR with 95 % CI, estimated using the lowest caffeine, green tea and coffee consumption group as a reference. To evaluate the dose–response relationship between caffeine consumption and outcomes, we performed a multivariable-adjusted restricted cubic spline analysis with three knots (10th, 50th and 90th percentiles) based on the distribution of caffeine consumption. The results are presented as HR (95 % CI), with the HR calculated using 0 mg/d as the reference value. The linear trend P value was estimated by considering caffeine, green tea and coffee consumption as continuous variables. We did not adjust for multiple comparisons in this study. As noted in previous literature(Reference Streiner27), adjustment for multiple testing is not always necessary or appropriate, particularly in confirmatory analyses where the hypotheses are specified a priori. Unlike exploratory analyses involving a large number of variables or hypotheses, given the hypothesis-driven nature of our analysis and the limited number of predefined comparisons, we determined that multiple comparison adjustment was not warranted.
Sensitivity analysis was conducted using the following three methods: (1) exclusion of events (mortality: 31 women and 50 men; disability: 8 women and 9 men) recorded in the initial 1 year of follow-up to minimise the possibility of reverse causation, (2) performance of a similar analysis using a dataset wherein missing data for all covariates were imputed with multiple imputations and (3) running a multivariable sub-distribution hazard model proposed by Fine and Gray to eliminate the problem of a cause-specific hazard model in which a ‘competing event is censored’. In this analysis, disability was the event of interest, and mortality was a competing event. The multiple imputation analysis involved the evaluation of pooled analysed results from twenty datasets created with random numbers. The multiple imputation method was employed to impute the missing of all covariates using the ‘mi estimate’ command in STATA. Missing values were presumed to be random.
The covariates used for the multivariable analysis included the potential confounders reported in previous studies(Reference Chen, Li and Gao10–Reference Mineharu, Koizumi and Wada13,Reference Watanabe, Yoshida and Watanabe16) . Model 1 included age (continuous), sex (female/male) and population density (≥ 1000 or < 1000 people/km2). Model 2 was adjusted for the variables in model 1 and BMI (< 18·5, 18·5–24·9, 25–29·9, ≥ 30 kg/m2 or missing), alcohol consumption (never drank, past drinker, current drinker or missing), smoking status (never smoked, past smoker, current smoker or missing), family structure (living alone, living with others or missing), education level (≤ 9, 10–12, ≥ 13 years or missing), economic status (high, low or missing), energy intake (continuous), physical activity (< 150, 150–299, ≥ 300 min/week or missing), sleep duration (< 360, 360 to < 420, 420 to < 480, ≥ 480 min/d or missing), sitting time (< 5, 5 to < 7, 7 to < 9, ≥ 9 h/d or missing), use of dentures (yes, no or missing), medication use (none, 1, 2, 3, 4, ≥ 5 or missing), number of chronic diseases (continuous) and frailty status (yes or no).
A two-tailed probability of less than 5 % was considered statistically significant. All statistical analyses were conducted using STATA MP (version 15.0; StataCorp LP).
Results
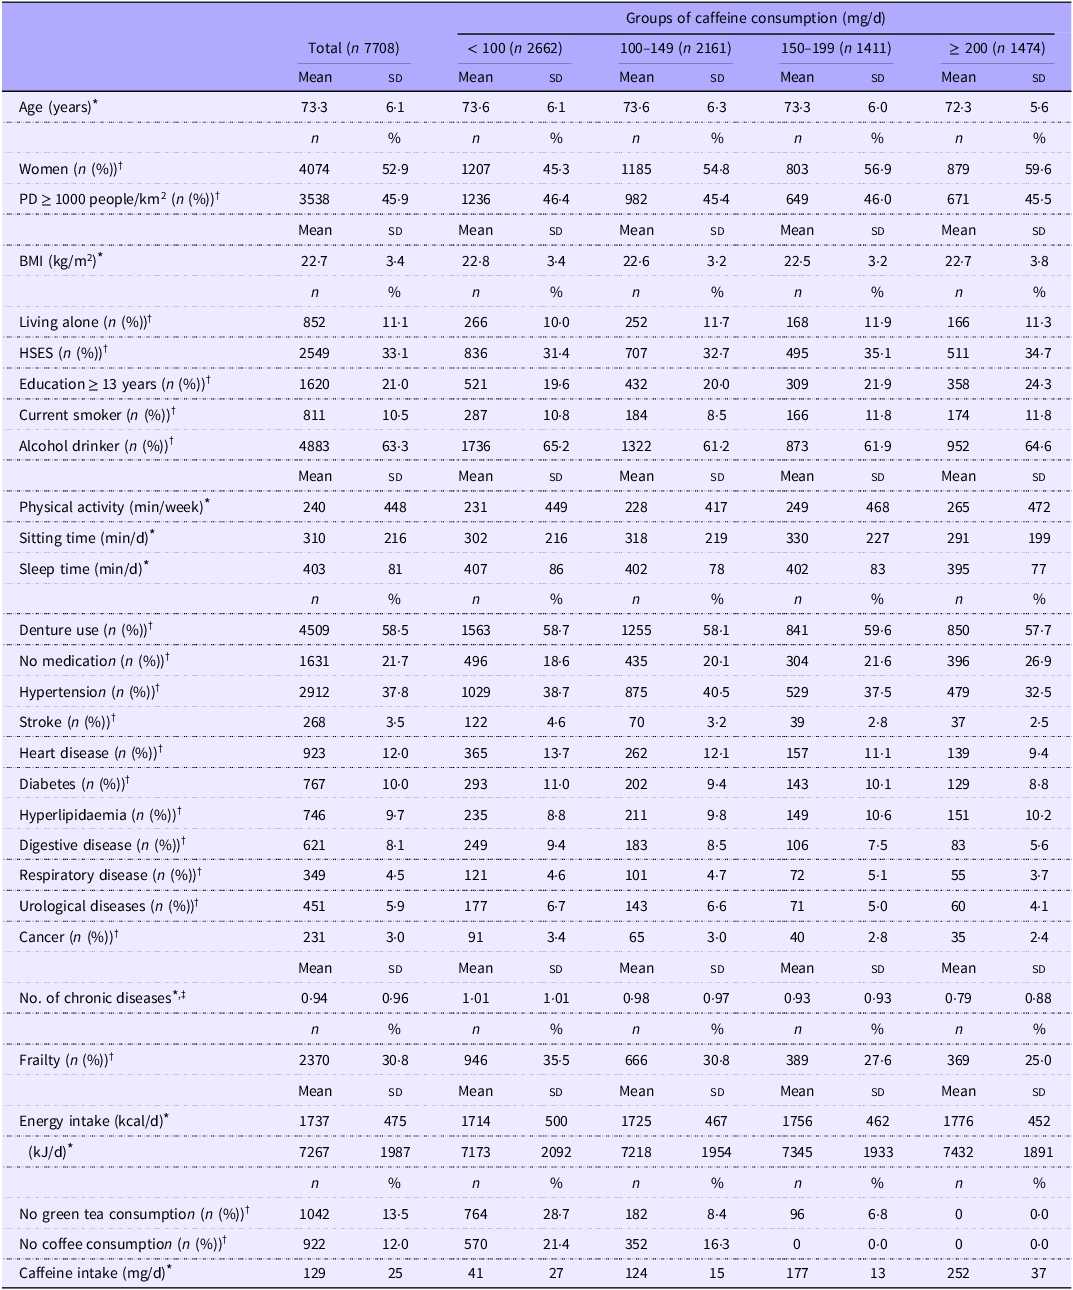
Table 1 shows the baseline characteristics of the participants according to the caffeine consumption groups. The mean (standard deviation) caffeine consumption level of the participants was 129 (25) mg/d. The groups with high caffeine consumption levels consisted of younger participants; more women; and more participants with high educational attainment, who engaged in high levels of physical activity, and who were not on medications than the group with caffeine consumption level of < 100 mg/d.
Baseline characteristics of the study participants according to group of caffeine consumption (Mean values and standard deviations)

HSES, high socio-economic status; PD, population density.
Number of missing values for the variables are as follows: BMI, n 28 (0·4 %); family structure, n 566 (7·3 %); socio-economic status, n 344 (4·5 %); educational attainment, n 842 (10·9 %); smoking status, n 317 (4·1 %); alcohol drinking, n 278 (3·6 %); physical activity, n 197 (2·6 %); sitting time, n 811 (10·5 %); sleep time, n 359 (4·7 %); denture use, n 193 (2·5 %); medications use, n 574 (7·4 %); and frailty status, n 950 (12·3 %). BMI was calculated as body weight (kg) divided by height squared (m2).
* Continuous values are shown as mean (standard deviation).
† Categorical values are shown as number (percentage).
‡ From the data obtained on the disease status (including the presence of hypertension, stroke, heart disease, diabetes, hyperlipidaemia, digestive disease, respiratory disease, urological diseases and cancer), the co-morbidity scores were summed to obtain a total score ranging from 0 (no co-morbidity) to 9 (poor status).
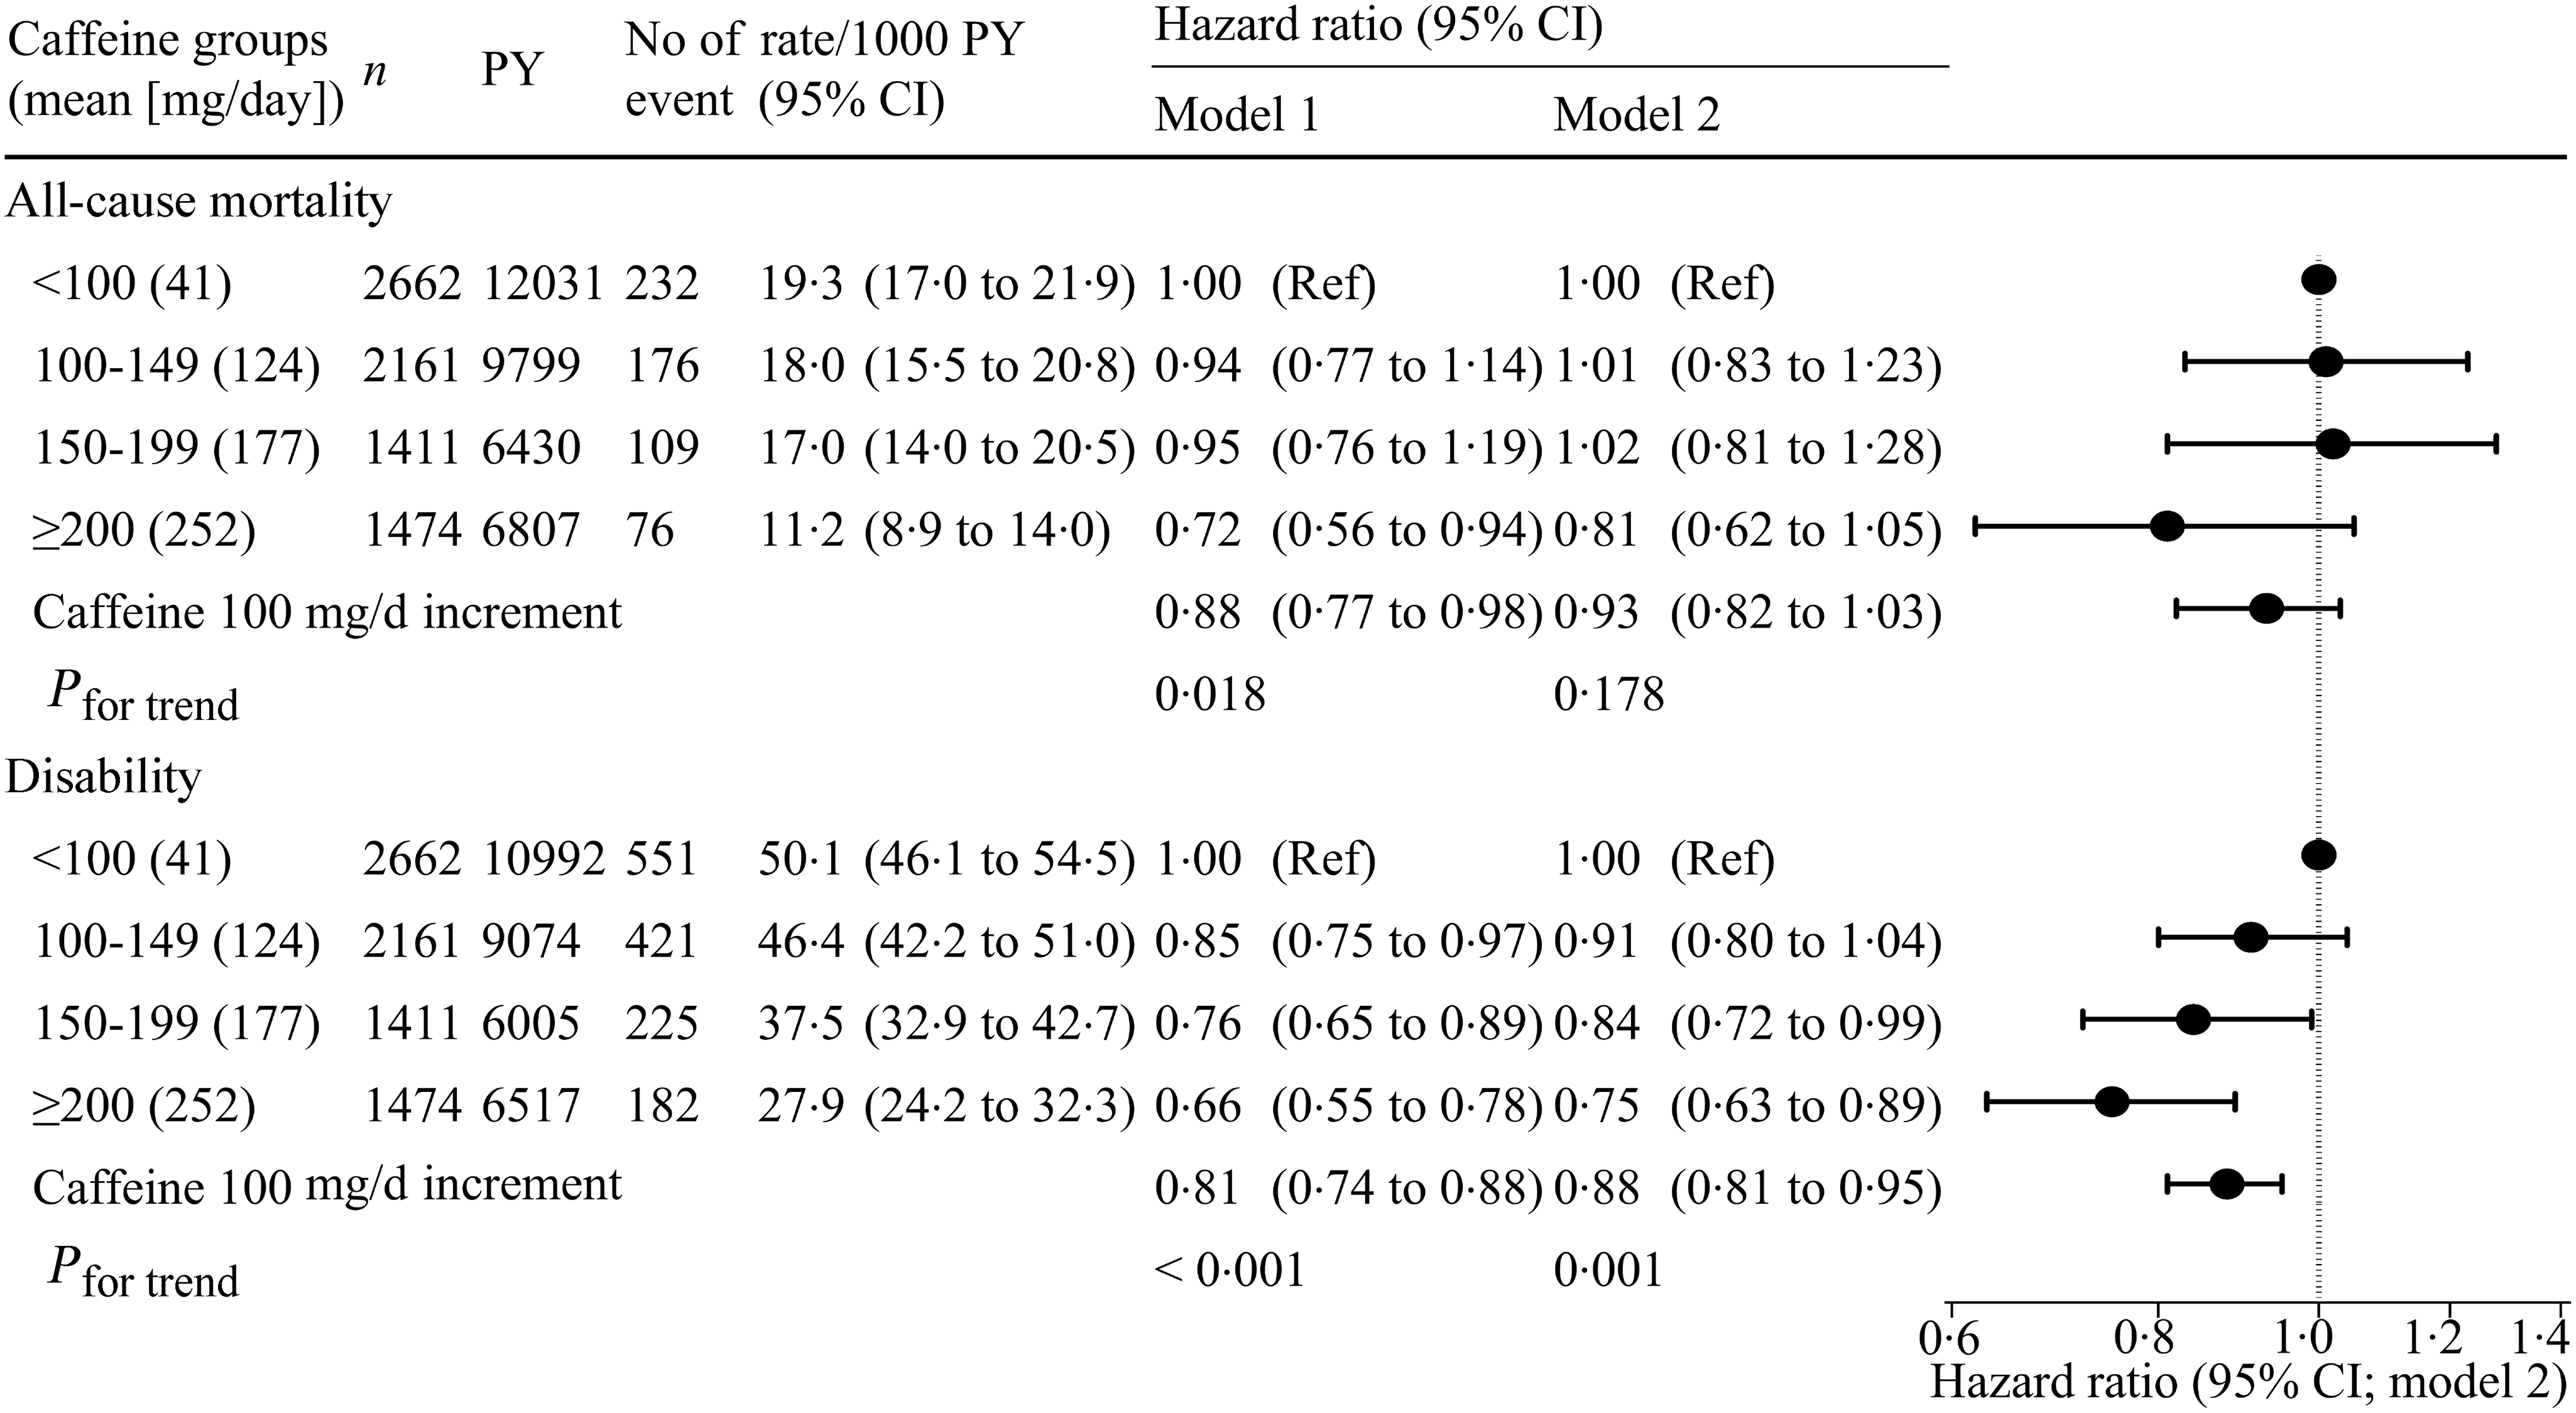
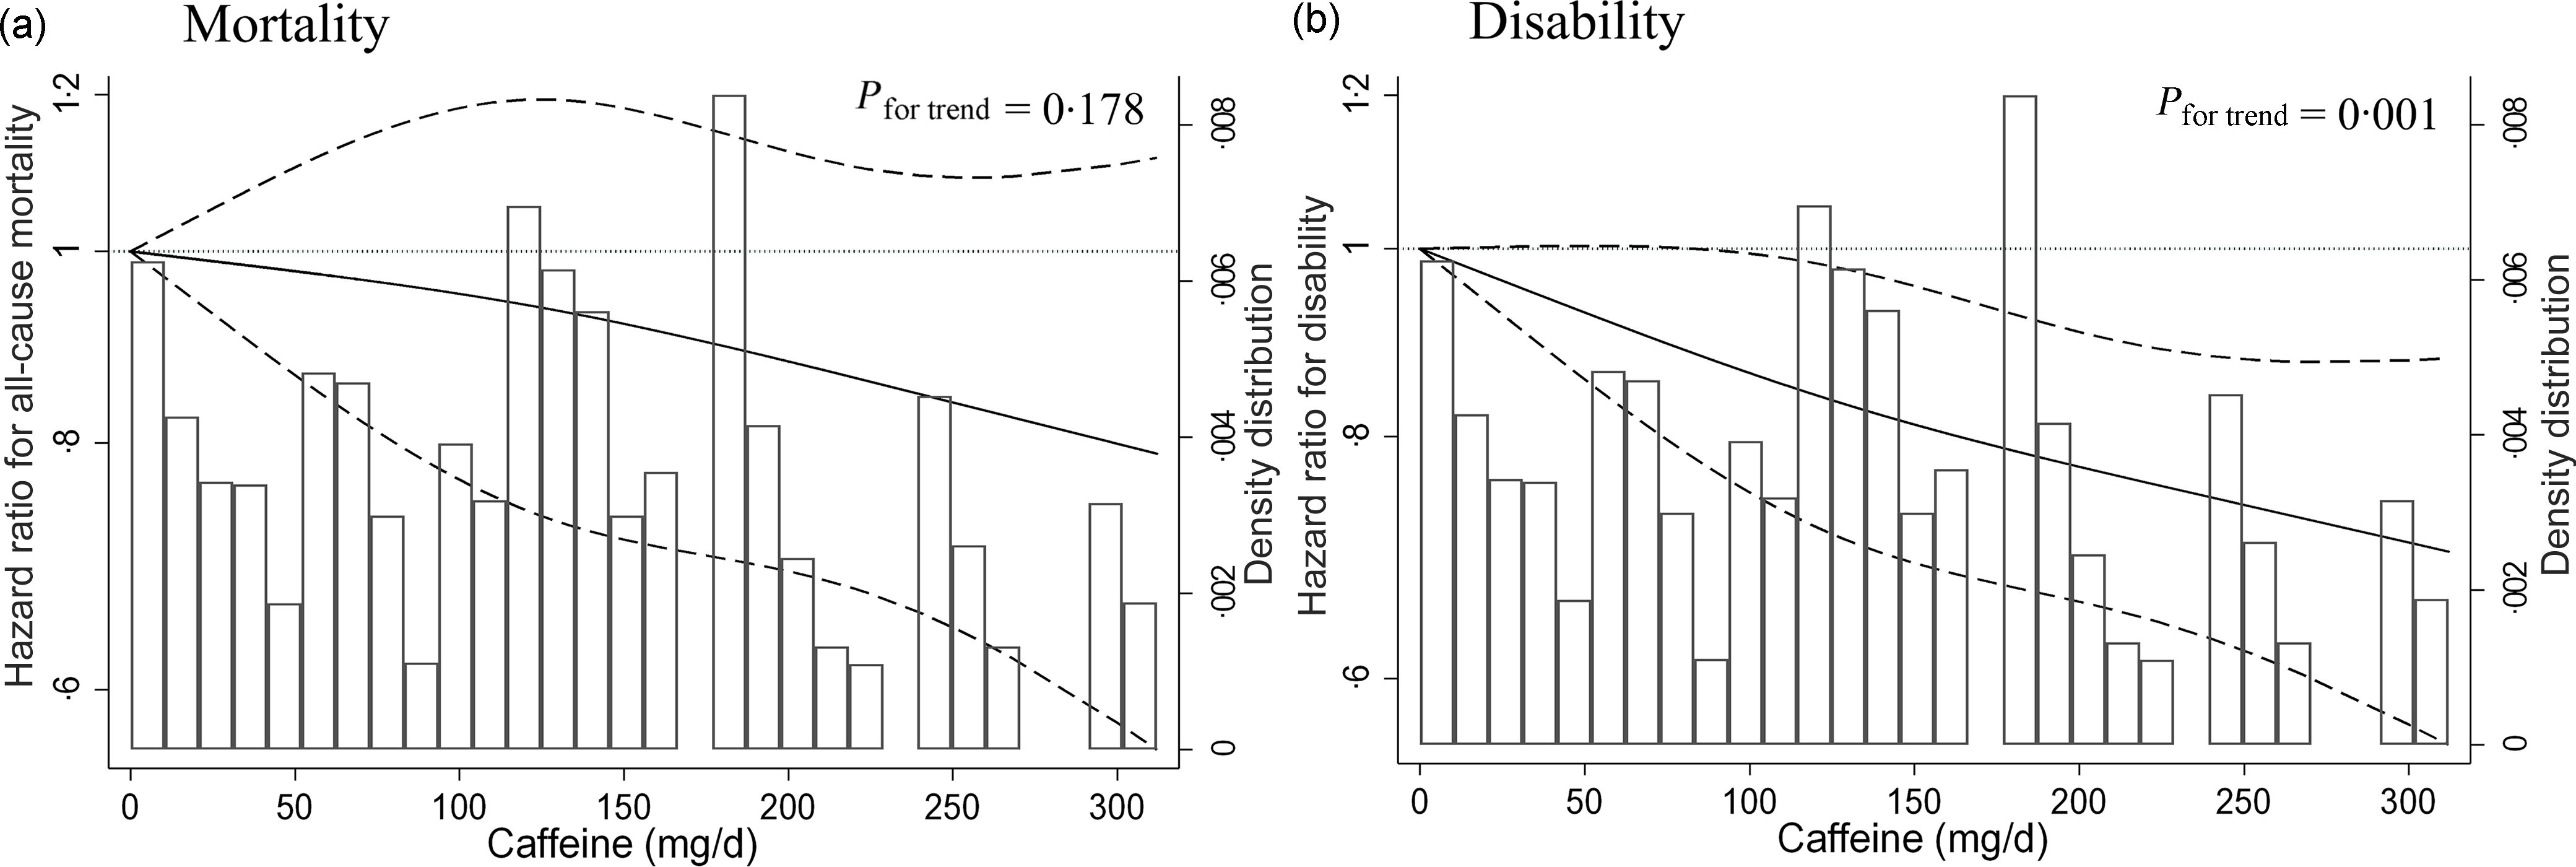
The associations between caffeine consumption, mortality and disability are shown in Figures 2 and 3. The median follow-up period in this study was 4·75 years (interquartile range, 4·75–4·75 years). A total of 593 individuals (7·7 %) died during the follow-up period (35 067 person-years), whereas 1379 (17·9 %) incidences of disabilities occurred during the follow-up period (32 588 person-years). After adjusting for confounders such as medical history and lifestyle, caffeine consumption was inversely associated with the incidence of disability (< 100 mg/d: reference; 100–149 mg/d: HR, 0·91 (95 % CI 0·80, 1·04); 150–199 mg/d: HR, 0·84 (95 % CI 0·72, 0·99); ≥ 200 mg/d: HR, 0·75 (95 % CI 0·63, 0·89), P for trend = 0·001) but not all-cause mortality. These association were similar to the results observed in the spline model (Figure 3). In addition, similar results were obtained in the sensitivity analyses (online Supplementary Tables 1–3).
Forest plot of hazard ratios for mortality and disability according to the caffeine consumption, calculated using multivariable Cox proportional hazards analysis. Model 1 was adjusted for age, sex and population density; model 2 was additionally adjusted for BMI, family structure, economic status, educational attainment, smoking status, alcohol consumption status, energy intake, physical activity, sitting time, sleep time, denture use, medication use, number of chronic diseases and frailty status. The x-axis of the plot is on a log scale. PY, person-years.

Multivariable-adjusted restricted cubic spline model for caffeine consumption with mortality and disability among older adults. The histogram shows the distribution of caffeine consumption. The hazard ratio based on the 0 mg/d of caffeine consumption as reference was calculated. The adjustment factors are age, sex, population density, BMI, family structure, economic status, educational attainment, smoking status, alcohol consumption status, energy intake, physical activity, sitting time, sleep time, denture use, medication use, number of chronic diseases and frailty status. Solid lines represent hazard ratios, and dashed lines represent 95 % CI.

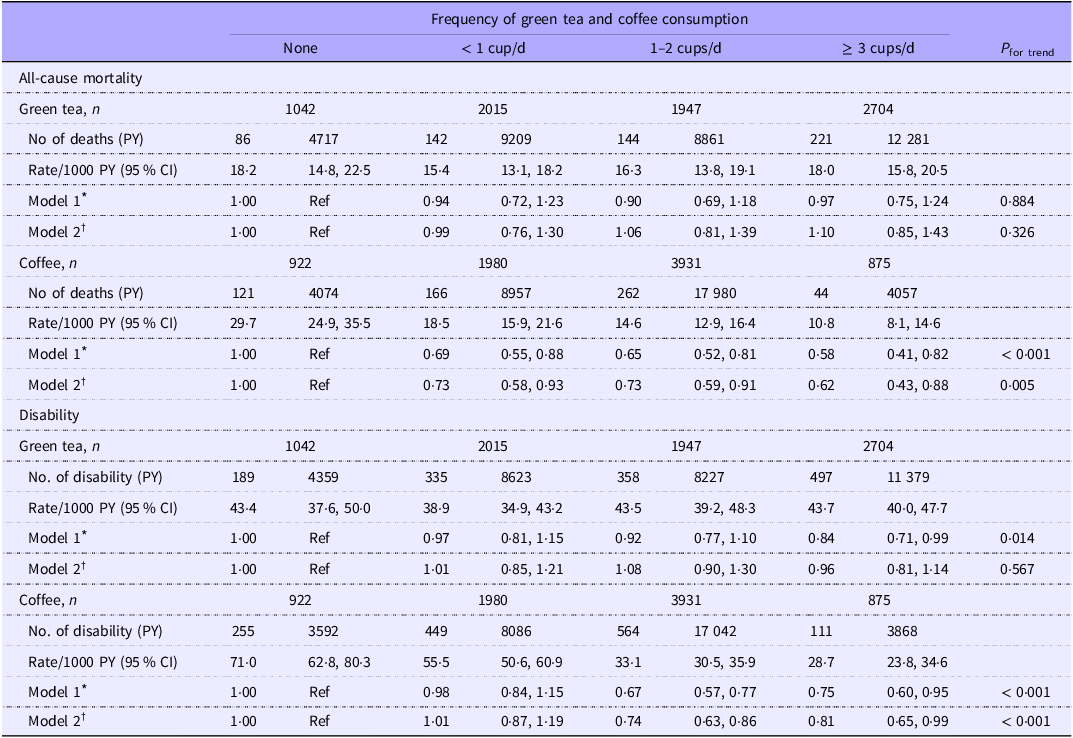
Table 2 shows the associations between green tea and coffee consumption and mortality and disability among older adults. High coffee consumption was inversely associated with mortality (≥ 3 cups/d: HR, 0·62 (95 % CI 0·43, 0·88)) and disability (≥ 3 cups/d: HR, 0·81 (95 % CI 0·65, 0·99)) compared with non-consumption. However, green tea consumption was not associated with mortality and disability.
Hazard ratios for all-cause mortality and disability according to the green tea and coffee consumption frequency, calculated using multivariable Cox proportional hazards analysis

PY, person-years.
* Model 1: Adjusted for age, sex and population density. Results are shown as hazard ratios (95 % CI).
† Model 2: In addition to the factors listed in model 1, adjusted for BMI, family structure, economic status, educational attainment, smoking status, alcohol consumption status, energy intake, physical activity, sitting time, sleep time, denture use, medication use, number of chronic diseases and frailty status. Results are shown as hazard ratios (95 % CI).
Discussion
The results of this study revealed a log-linear inverse relationship between caffeine consumption and disability but not mortality and that coffee consumption, but not green tea consumption, was inversely associated with mortality and disability. To the best of our knowledge, this is the first study to evaluate the associations of caffeine, green tea and coffee consumption with both incident mortality and disability.
The average caffeine consumption of our study sample was 129 mg/d. In a previous study of healthy Japanese adults aged 30–69 years, the average mean caffeine consumption estimated from the 16-d DR of the participants was approximately 260 mg/d(Reference Yamada, Sasaki and Murakami28). In addition, previous studies have shown that middle-aged and older Japanese adults consume approximately 200 mg of caffeine per d(Reference Iso, Date and Wakai29), whereas older Americans with hypertension consume 146 mg of caffeine per d(Reference Chen, Li and Gao10). The estimated caffeine intake in our study was lower than that estimated in other studies, possibly because we calculated caffeine consumption using only two beverages (green tea and coffee) and because of differences in the methods used to estimate beverage intake, including portion size and consumption frequency. However, the most common categories of caffeine consumption among American adults are reported to be > 0 to ≤ 100(Reference Wang, Li and He11) and 10–99 mg/d(Reference Tsujimoto, Kajio and Sugiyama12), consistent with our findings. Therefore, although we could assess the relationship between health outcomes and the presence or absence of caffeine consumption in the present study, caffeine consumption should be estimated in future studies using more accurate dietary assessment methods to determine the dose–response relationship (especially at high doses) between caffeine intake and health outcomes.
Caffeine and coffee consumption, but not green tea consumption, was found to be inversely associated with mortality and disability. In several previous studies, caffeine(Reference Chen, Li and Gao10–Reference Mineharu, Koizumi and Wada13) and coffee(Reference Mineharu, Koizumi and Wada13,Reference Poole, Kennedy and Roderick14) consumption has been reported to be inversely associated with the risk of mortality, similar to our results. However, in some studies, green tea consumption was found to be inversely associated with mortality(Reference Mineharu, Koizumi and Wada13) and the risks of disability(Reference Tomata, Kakizaki and Nakaya30) and diabetes(Reference Iso, Date and Wakai29). In many previous studies, green tea consumption was estimated using questionnaires such as the FFQ, and mortality or disability data were obtained from public sources such as city halls(Reference Tsujimoto, Kajio and Sugiyama12,Reference Tomata, Kakizaki and Nakaya30) . Therefore, no significant difference was observed between the methods used for the assessments of exposure factors and outcomes in the present study and in previous studies. In further studies, important factors, including population characteristics, that mediate the relationship between green tea consumption and health outcomes need to be clarified.
Consumption of up to 400 mg of caffeine per d is considered safe, and moderate coffee consumption can be included as part of a healthy lifestyle for most individuals(Reference Wikoff, Welsh and Henderson5,Reference van Dam and Hu6) . However, a U-shaped relationship has been found between caffeine intake and the prevalence of CVD(Reference Zhou and Hypponen31). Given that Japan’s dietary guidelines do not include an upper limit for caffeine consumption and a description of its health benefits, our findings may provide valuable information for determining the optimal levels of caffeine consumption.
The reasons underlying the inverse association between coffee consumption and mortality and/or disability observed were unclear. However, the results can be attributed to two plausible reasons: First, coffee consumption is positively associated with skeletal muscle mass(Reference Kawakami, Tanisawa and Ito32,Reference Iwasaka, Yamada and Nishida33) and grip strength (positive trend)(Reference Iwasaka, Yamada and Nishida33) in Japanese people. Maintenance of skeletal muscle mass and grip strength has been shown to be inversely associated with mortality and disability in older adults(Reference Kitamura, Seino and Abe34). However, the association between green tea consumption and skeletal muscle mass and grip strength has not been reported to date. The differences in the effects of these beverages support our results, which showed no association between green tea consumption and death or disability. Given that the beneficial effect of coffee consumption on skeletal muscle mass may not be related to its anti-inflammatory property as a mediator(Reference Iwasaka, Yamada and Nishida33) and the antioxidant chlorogenic acid is only absorbed to approximately 33 % in humans(Reference Olthof, Hollman and Katan35), other substances such as caffeine may be involved in the health benefits of coffee consumption. Second, moderate caffeine consumption has multiple health benefits. Caffeine consumption has been reported to be inversely associated with the risk of depression(Reference Lucas, Mirzaei and Pan36). In addition, consumption of coffee containing 4 mg of caffeine per body weight has been found to increase energy expenditure and fat oxidation compared with consumption of decaffeinated coffee(Reference Acheson, Zahorska-Markiewicz and Pittet37). In our previous cohort study, depressive status(Reference Watanabe, Yoshida and Yamada15) and BMI(Reference Watanabe, Yoshida and Watanabe16) were associated with the risk of mortality; hence, the multiple beneficial effects of caffeine consumption may be related to improved prognosis in older people(Reference van Dam, Hu and Willett4,Reference van Dam and Hu6) . However, interventional and basic research is needed to identify the causal relationship between caffeine and coffee consumption and health outcomes and clarify the underlying mechanisms.
The primary strength of this study was that we evaluated the relationships between caffeine, green tea, and coffee consumption and mortality and disability in a large cohort of older adults from Kameoka City. However, this study had some methodological limitations. First, the dietary intake estimated using the self-administered FFQ may have been affected by the self-reporting errors related to participant characteristics(Reference Watanabe, Nanri and Sagayama17), hindering accurate evaluation of dietary food and beverage consumption. Although a previous study demonstrated that coffee and tea consumption account for about 96 % of the caffeine intake of Japanese older adults(Reference Yamada, Sasaki and Murakami28), caffeine consumption levels may have been underestimated in the present study if the older adults actually consumed caffeine from other types of foods and beverages apart from green tea and coffee. In addition, the caffeine content of beverages such as coffee and tea can differ according to the fermentation methods of tea leaves and preparation (brewing) methods, such as the length of infusion, cup size and temperature(Reference Fuller and Rao38). Decaffeinated coffee is not commonly consumed in Japan(Reference Yamada, Sasaki and Murakami28), but we cannot exclude the possibility that some participants consumed decaffeinated coffee. Therefore, the absolute value of caffeine consumption reported in this study should be interpreted with caution. Second, the participants included in this study may have been more health-conscious than the additional survey participants or the general population because only the residents who were alive at the time of the additional surveys could provide responses to the questionnaires. Third, the follow-up period was relatively short. This may partially explain why we did not observe an association between caffeine intake and mortality risk; future studies with longer follow-up periods are needed to re-evaluate these relationships. In addition, we were unable to examine the association between the exposure variables and cause-specific death because we could not obtain data on causes of death. Finally, although various confounders were adjusted in this study, residual confounders may have impacted the association between the exposure variables and outcomes. In addition, age-related changes in covariates, such as alcohol consumption, may have introduced systematic bias in studies examining associations with health outcomes(Reference Fillmore, Stockwell and Chikritzhs39). Therefore, future research should employ longitudinal data that capture time-varying exposures and covariates to more accurately assess their relationships with outcomes.
Conclusions
This study revealed a log-linear inverse relationship between caffeine consumption and disability but not mortality. We observed that coffee consumption, but not green tea consumption, was inversely associated with mortality and disability. Therefore, a slight increase in caffeine consumption in a dose-dependent manner over a range of doses, from about 0 to 320 mg/d, is inversely associated with the risk of disability. However, further research is needed to determine whether a higher caffeine consumption than that evaluated in this study will be effective in reducing the incidence of disability in older adults without adverse events. The findings of this study may provide insights into the optimal caffeine and coffee consumption levels necessary for improving and maintaining the health of older adults.
Supplementary material
For supplementary material/s referred to in this article, please visit https://doi.org/10.1017/S0007114525105278
Acknowledgements
The authors thank all the members of the Kyoto–Kameoka study group for their valuable contributions. The authors thank the administrative staff of Kameoka City and Kyoto Prefecture. The authors wish to express our gratitude to all participants for their cooperation in this study. The authors thank Editage (www.editage.jp) for English-language editing.
The Kyoto–Kameoka study was conducted with JSPS KAKENHI and was supported by research grants provided to Misaka Kimura (grant number 24240091), Yosuke Yamada (grant number 15H05363), Daiki Watanabe (grant number 21K17699) and Tsukasa Yoshida (grant number 22H03525 and 23K24782); grant and administrative support provided by the Kyoto Prefecture Community-Based Integrated Elderly Care Systems Promotion Organization since 2011; and Kameoka City under the programme of the Long-term Care Insurance and Planning Division of the Health and Welfare Bureau for the Elderly, the Ministry of Health, Labour and Welfare, and the WHO Collaborating Centre on Community Safety Promotion. The funders had no role in the study design; collection, analysis and interpretation of data; writing of the report; and decision to submit the article for publication.
DW conceptualized the study and performed the literature review, data analyses, and creation of graphics. TY, HN, YY, and MK managed the project. TY, YW, YY, and MK were responsible for data acquisition and entry. All authors contributed to the development of the methodology. DW wrote the first draft of the manuscript. All authors contributed to the writing, reviewed, and approved the final version of the manuscript.
There are no conflicts of interest.
All data sharing and collaboration requests should be directed to the corresponding author (d-watanabe@nibn.go.jp), T. Y. (t-yoshida@nibn.go.jp) and Y. Y. (yamaday@nibn.go.jp).