Introduction
As adults, we can judge how different an accent is from our own – its ‘strength’ or degree of accentedness (e.g., Carmichael, Reference Carmichael2000; Flege, Reference Flege1984; Flege, Munro, & MacKay, Reference Flege, Munro and MacKay1995). For example, when we hear a person speaking with an unfamiliar accent, we can judge how distant that accent is from our own, even if we cannot identify what kind of accent it is. Accents differ in a number of ways that might affect listeners’ judgments of strength – for example, in their phonetic properties (the degree of overlap in the sound inventory) and in their prosodic properties (their rhythms and intonation). In the case of foreign accents, these differences are affected by the nature of the first language and by speaker characteristics, like proficiency. Adult listeners use both phonetic and prosodic features in their judgments of accent strength (e.g., Anderson-Hsieh, Johnson, & Koehler, Reference Anderson-Hsieh, Johnson and Koehler1992). Sensitivity to degree of accentedness affects our social judgments about speakers, including our preferences for speakers, trust in speakers, and assessments of their status and competence (e.g., Brennan & Brennan, Reference Brennan and Brennan1981; Hendriks, van Meurs, & Groot, Reference Hendriks, van Meurs and de Groot2017; Nejjari, Gerritsen, Van der Haagen, & Korzilius, Reference Nejjari, Gerritsen, Van der Haagen and Korzilius2012; Ryan, Carranza, & Moffie, Reference Ryan, Carranza and Moffie1977). In general, speakers rated as being more strongly accented are evaluated more negatively than those rated as less accented.
Little is known about whether children are sensitive to degree of accentedness. Young children show some sensitivity to whether a speaker's accent differs from their own. They make a variety of social judgments on the basis of accent, including judgments about social preferences, social relations, and selective trust (e.g., Creel, Reference Creel2018; DeJesus, Hwang, Dautel, & Kinzler, Reference DeJesus, Hwang, Dautel and Kinzler2017; Kinzler, Corriveau, & Harris, Reference Kinzler, Corriveau and Harris2011; Kinzler & Dautel, Reference Kinzler and Dautel2012; Kinzler & DeJesus, Reference Kinzler and DeJesus2013a, Reference Kinzler and DeJesus2013b; Kinzler, Dupoux, & Spelke, Reference Kinzler, Dupoux and Spelke2007). Children also relate a speaker's accent to their geographic background (Kinzler & DeJesus, Reference Kinzler and DeJesus2013b; Weatherhead, Friedman, & White, Reference Weatherhead, Friedman and White2018; Weatherhead, White, & Friedman, Reference Weatherhead, White and Friedman2016). For example, four- to six-year-olds indicate that speakers with their native accent were born in the same country as them, whereas speakers with a foreign accent were born ‘far away’ (Weatherhead et al., Reference Weatherhead, Friedman and White2018). However, the ability to perceive that other accents differ from their own does not establish whether children are sensitive to the extent to which these accents are different.
There is a growing body of work exploring when children begin to discriminate and categorize accents and whether the type of accent matters for these judgments. These studies show that five- to six-year-olds can successfully classify speakers of their native accent vs. a foreignFootnote 1 accent, but have more difficulty classifying speakers of regional vs. native accents (e.g., Floccia, Butler, Girard, & Goslin, Reference Floccia, Butler, Girard and Goslin2009; Girard, Floccia, & Goslin, Reference Girard, Floccia and Goslin2008; Jones, Yan, Wagner, & Clopper, Reference Jones, Yan, Wagner and Clopper2017; Wagner, Clopper, & Pate, Reference Wagner, Clopper and Pate2014). For example, Floccia et al. (Reference Floccia, Butler, Girard and Goslin2009) used a classification task in which five- to seven-year-old British children were asked to press one key if a speaker talked like people around them (e.g., their teacher) and a different key if they talked like an alien. Five-year-olds performed poorly when both a regional (Irish) and foreign (French) accent were compared to their own, whereas seven-year-olds were more successful with the foreign accent than the regional accent. However, children's performance is not the same on all tasks. Girard et al. (Reference Girard, Floccia and Goslin2008) found that, although five- to six-year-old French children were unable to classify their own regional French accent (from the southeast of the country) vs. an unfamiliar regional accent (from the southwest), they succeeded in distinguishing the accents in a simple discrimination task. Wagner et al. (Reference Wagner, Clopper and Pate2014) trained five- to six-year-old American children on links between accents and puppets of particular colors. They found that children were subsequently able to categorize sentences spoken in their own accent vs. a foreign accent (Indian English), but not their own accent vs. a regional accent (British English). However, they treated both types of accents differently from their own in a more implicit task involving matching cultural items with the sentences.
Children's greater ability to distinguish their own accent from foreign accents than from regional accents provides indirect evidence that they are sensitive to degree of accentedness, as it is widely believed that foreign accents are more perceptually distinct than regional accents (e.g., Atagi & Bent, Reference Atagi and Bent2016; Clarke & Garrett, Reference Clarke and Garrett2004; Floccia, Goslin, Girard, & Konopczynski, Reference Floccia, Goslin, Girard and Konopczynski2006; Goslin, Duffy, & Floccia, Reference Goslin, Duffy and Floccia2012). However, children's response patterns are open to other interpretations. For example, children's ability to discriminate between accents could depend on familiarity or whether they find it easy or difficult to understand the speech, and not on perceptual differences. To our knowledge, only one study provides direct evidence that children are sensitive to accent strength (Nesdale & Rooney, Reference Nesdale and Rooney1996). In this study, Australian children's evaluations of speakers (e.g., status) were influenced by accent strength (speakers with stronger accents were rated more negatively than those with mild accents). However, this experiment involved ten- to twelve-year-olds.
The main goal of the present paper is to directly examine whether preschoolers are sensitive to degree of accentedness. If they are, it would mean that, beyond being able to make binary judgments about whether accents are similar or dissimilar to their own accent, young children also perceive the degree to which accents differ from their own. Probing children's fine-grained sensitivities to accents will not only help elucidate how accented speech is processed, but may also have implications for understanding children's social judgments. As with adults and older children (e.g., Brennan & Brennan, Reference Brennan and Brennan1981; Hendriks et al., Reference Hendriks, van Meurs and de Groot2017; Nesdale & Rooney, Reference Nesdale and Rooney1996; Ryan et al., Reference Ryan, Carranza and Moffie1977), preschoolers might draw inferences about speakers based on their perceived degree of accentedness.
A further goal of this paper is to examine whether the distinction between foreign and regional accents is reflected in preschoolers’ judgments of degree of accentedness. As noted above, some studies suggest that five- and six-year-olds can categorize their own accent vs. foreign accents, but struggle in the same tasks to categorize these vs. regional accents (e.g., Floccia et al., Reference Floccia, Butler, Girard and Goslin2009; Girard et al., Reference Girard, Floccia and Goslin2008; Wagner et al., Reference Wagner, Clopper and Pate2014). Again, this suggests that they perceive regional accents as perceptually closer than foreign accents. However, almost all of these studies asked children about a single foreign and regional accent. We use multiple accents of each type to test the generalizability of this conclusion.
The final goal of the present paper is to begin to explore, for the first time, what features of speech allow preschoolers to differentiate among accents. As noted above, although many features of speech could influence children's ability to differentiate accents, one important factor in adults’ perceptions of how accented a speaker is appears to be speech prosody – the aspect of speech including rhythm and intonation (Anderson-Hsieh et al., Reference Anderson-Hsieh, Johnson and Koehler1992; Kang, Reference Kang2010; Kang, Rubin, & Pickering, Reference Kang, Rubin and Pickering2010; Munro & Derwing, Reference Munro and Derwing2001; Trofimovich & Baker, Reference Trofimovich and Baker2006). Speech prosody allows adults to differentiate accents even in speech they cannot comprehend. For example, in Munro (Reference Munro1995), adults heard low-pass filtered English utterances from native- and Mandarin-accented speakers. These utterances retained prosodic information, but not phonetic information. Nonetheless, participants could determine which speakers had non-native accents, suggesting that they could detect non-native rhythmic or intonation patterns (consistent with Grover, Jamieson, & Dobrovolsky Reference Grover, Jamieson and Dobrovolsky1987; Shah Reference Shah2003; Tajima, Port, & Dalby Reference Tajima, Port and Dalby1997). Non-native prosody also affects adults’ comprehension and ease of processing (Hahn, Reference Hahn2004). Prosodic features related to fluency (e.g., speaking rate) seem to be particularly important in these judgments (Kang, Reference Kang2010; Munro & Derwing, Reference Munro and Derwing2001; Trofimovich & Baker, Reference Trofimovich and Baker2006).
To address these three goals, we had preschoolers listen to speakers with a variety of regional and foreign accents (six in total). In Experiment 1, we used children's inferences about geographic background to measure the perceptual distance between the accents. In Experiment 2, we used children's inferences about speakers’ physical appearance to measure the perceptual distance between the accents when only prosodic information was available.
Experiment 1
Method
Participants
We tested 84 children: 41 four-year-olds (mean = 4;6; range = 4;2–4;11; 22 female), and 43 five-year-olds (mean = 5;5; range = 5;0–6;0; 18 female). Children in both experiments were tested in English-speaking daycares and schools in the Waterloo, Canada Region. In this region, 85% of residents are Caucasian; Chinese and South Asian are the largest visible minority groups. Additionally, 75% of residents identify English as their mother tongue, 1% report French, and 24% report a different language. Children in all experiments were Caucasian and had English designated as the primary language spoken at home.
Materials
Auditory stimuli
Auditory stimuli consisted of seven English recordings produced by seven female and male speakers. Of the seven speakers, one had the children's native Canadian accent, three had regional accents (Australian, Scottish, Jamaican), and three had foreign accents (Indonesian, Spanish, Mandarin). Each speaker said the same neutral sentence: “She can scoop these things into three red bags.” This sentence highlights a number of features that differ across the accents, including vowel variation, which was present across all of the accents, the different varieties of the ‘r’ sound (e.g., the rolled ‘r’ in Scottish and Indonesian), and other features like stopping (e.g., the production of the fricative ‘th’ as ‘t’ in Jamaican) and consonant place changes (e.g., the pronunciation of ‘th’ as ‘s’ in Indonesian). In addition to these types of phonetic differences across accents, there are also prosodic differences. Although there were no pauses that met the criteria for disfluency in any of the sentences (> 100ms), three of the speakers (the Indonesian, Scottish, and Spanish) did have smaller pauses after the word things, the largest of which was produced by the Indonesian speaker. More significantly, the sentences differ in speech rate (the Indonesian speaker is markedly slower than the other samples) (see the ‘Appendix’ for information about the speakers and speech rate of the stimuli). Finally, there are rhythmic differences. For example, the three foreign-accented speakers had less function word reduction (relative to content words) than the native and regional speakers. All stimuli were retrieved from the Speech Accent Archive (Weinberger, Reference Weinberger2014). No visual information about the speakers was provided. Stimuli were played off of a 13-inch laptop computer.
Visual stimuli
Children were introduced to a map of the United States, with a large ‘X’ in the top left. The map was printed in grayscale on 20.32 × 27.94 cm paper (Figure 1). Children participating were tested in Canada and were unlikely to be familiar with American geography. They were simply told that it was a map. A map of the US rather than Canada, was chosen because it is a large landmass that filled out the rectangular page, and to reduce the concern that older children would be more familiar with the map than younger ones.
The map used in Experiment 1.

Procedure
Children were told that the experimenter needed their help with something. The experimenter produced the map and explained that “a map shows you where people live”. She then directed children's attention to the X on the map, and told them that X is “where we live”. After confirming that children knew where we live, the experimenter told the children that people could live anywhere on the map. Finally, children were told that they were going to hear different speakers, and they had to point to where on the map each speaker lived. They then heard seven different speakers, sequentially, and the experimenter marked the location of their points. A fresh map was used for each speaker. Stimuli were counterbalanced such that each speaker appeared in the first trial and last trial equally across children.
Results and discussion
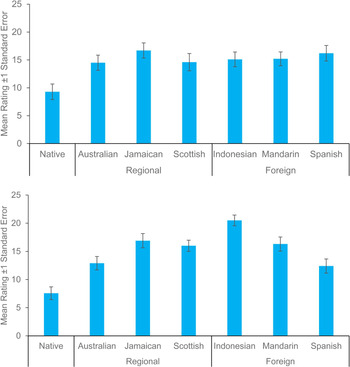
Data from both experiments are available at <https://osf.io/3ztgv/>. Our dependent measure was the distance (in centimeters) from the X to where the child pointed for each accent (see Figure 2); this distance could range between 0cm to 31cm. To examine whether preschoolers are sensitive to accent differences, we entered children's distance scores into an analysis of variance (ANOVA) with the within-subjects factor accent (native, Australian, Jamaican, Scottish, Indonesian, Mandarin, Spanish) and the between-subjects factor age (four years, five years).Footnote 2 There was a main effect of accent (F(6,492) = 18.27, p < .001, np2 = .18), no main effect of age (F(1,82) = 0.01, p = .913), and an interaction between accent and age (F(6,492) = 4.23, p < .001, np2 = .05).
Mean distance scores and standard errors for four-year-olds (top graph) and five-year-olds (bottom graph) in Experiment 1.

To follow up on this interaction, we separately examined children's responses at each age, and found significant main effects in both four-year-olds (F(6,240) = 6.45, p < .001, np2 = .14) and five-year-olds (F(6,252) = 15.37, p < .001, np2 = .27). However, differences between these age groups emerged when we examined their responses to the different accents.
At age four, the order of accents from smallest to largest distance score was: native (M = 9.29), Australian (M = 14.50), Scottish (M = 14.60), Indonesian (M = 15.11), Mandarin (M = 15.19), Spanish (M = 16.16), Jamaican (M = 16.71). Children differentiated the native accent from the Australian accent (i.e., the non-Canadian accent with the smallest distance score), (t(40) = 3.62, p = .001). However, when we compared scores for the six non-Canadian accents to one another, none of the pairwise comparisons were significant (all ps > .99 with Bonferroni corrections for multiple corrections). Therefore, in this age group, the native accent was rated significantly different from all of the others, but children did not show graded sensitivity to the other accents.
At age five, the order of the accents (from smallest to largest distance score) was: native (M = 7.57), Spanish (M = 12.36), Australian (M = 12.89), Scottish (M = 16.00), Mandarin (M = 16.29), Jamaican (M = 16.93), Indonesian (M = 20.47). Children differentiated the native accent from the Spanish accent (i.e., the non-Canadian accent with the smallest distance score) (t(42) = 2.94, p = .005). When the non-Canadian accents were compared directly, 3 of 15 possible pairwise comparisons were significant with Bonferroni corrections: Spanish–Indonesian (p < .001), Australian–Indonesian (p = .001), and Scottish–Indonesian (p = .027). Therefore, the five-year-olds showed more sensitivity to accent distance than the four-year-olds. They not only differentiated their own accent from the other accents, but also showed sensitivity to differences among the other accents.
Next, we asked whether preschoolers’ judgments of accentedness reflected the distinction between foreign and regional accents. To address this, we compared children's average scores for these two types of accents. For each child, we created an average regional score (across the three regional accents) and an average foreign score (across the three foreign accents). Paired sample t-tests found no difference between the two types of accents in either age group: four-year-olds (p = .786), five-year-olds (p = .232). Thus, children treated regional and foreign accents similarly.
Together, these findings suggest that children differentiated their native accent from other accents, including regional accents. They also suggest that, whereas five-year-olds perceived some accents that differ from their own as more distant than others, four-year-olds did not. Finally, at neither age did children show sensitivity to the distinction between regional accents and foreign ones.
Before turning to Experiment 2, we address the possible concern that our participants did not understand the map task because we did not train them explicitly on a link between accent and geographic distance. First, despite the absence of explicit training, children clearly understood the basic assumption of our measure – namely that marking accents farther from the X indicated greater distance from their native accent. If children had not understood this, distance scores for their native accent would not have differed from those for other accents. In addition, the older children showed systematic differences between some of these other accents. A failure to understand the task would have led to random patterns of responding.
Second, we compared children's responses to judgments of the same sentences by English-speaking adults recruited through Amazon Mechanical Turk (more details about this are provided in the ‘Appendix’). When asked, “How strong is this accent?” on a scale of 1–7, adults rated the accents in the following order: native Canadian, Australian, Spanish, Scottish, Mandarin, Jamaican, and Indonesian.Footnote 3 This is strikingly similar to the order produced by the five-year-olds. Consistent with this claim, we found a significant linear trend in five-year-olds’ responses for the non-Canadian accents when they were compared directly to the adults’ ordering of accent strength (F(1,42) = 23.63, p < .001, np2 = .36); a corresponding analysis with four-year-olds did not reveal a significant linear trend (F(1,40) = 0.47, p = .497). This similarity between the five-year-olds and adults suggests that these children understood the task and were responding to perceptual properties of the accents.
Having demonstrated that all children distinguished their own accent from others, and that five-year-olds distinguished between certain unfamiliar accents, in Experiment 2 we ask about one possible feature of the speech that children could be using in these perceptual judgments – prosody.
Experiment 2
As previously discussed, speech prosody plays a large role in adult listeners’ accent detection and perception of accentedness (Munro, Reference Munro1995; Munro & Derwing, Reference Munro and Derwing2001; Trofimovich & Baker, Reference Trofimovich and Baker2006). To investigate whether prosody influences children's perception of accents, we low-pass filtered the speech such that only prosodic information remained. Due to the strangeness of these auditory stimuli, it was not plausible to claim they were verbatim recordings of actual human speakers. Piloting revealed that children were preoccupied with why the recordings were so unfamiliar. For this reason, the map method used in Experiment 1 had to be abandoned. Instead, we used an adapted scale measure in which children were told that the recordings were of alien speech.
Method
Participants
We tested 56 children: 28 four-year-olds (mean = 4;6; range = 4;0–4;11; 10 female), and 28 five-year-olds (mean = 5;5; range = 5;0–5;11; 14 female).
Materials
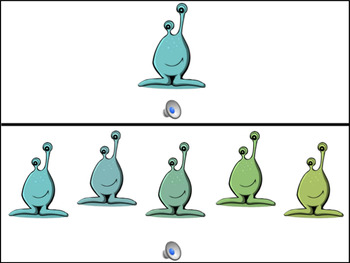
Auditory stimuli consisted of the same seven recordings from Experiment 1. However, all stimuli were low-pass filtered using Praat (Boersma & Weenink, Reference Boersma and Weenink2017) such that only prosodic information remained. This includes intonational and rhythmic information, as well as pausing and rate information. Visual stimuli included five cartoon aliens, varying in shade from blue to green (Figure 3). Stimuli were combined in Microsoft PowerPoint and displayed on a 13-inch laptop computer.
The aliens used in Experiment 2.

Procedure
Children were first shown a picture of a light blue alien and were asked if they would like to know how the alien talks. Children then heard the low-pass filtered version of the native-accented speaker. They were played the stimulus twice, and told that they would hear some other aliens and should point to which alien was talking. Children then heard each of the seven filtered recordings accompanied by a visual display of five cartoon aliens, one the same shade of blue as the original alien, and the others arranged on a continuum from blue to green. In each trial, children were asked “Which alien said that?”; children's choices were scored from 1 (alien colored same shade of blue as original) to 5 (alien at the green end of the continuum). Stimuli were counterbalanced such that each speaker appeared in the first trial and last trial equally across children.
Results and discussion
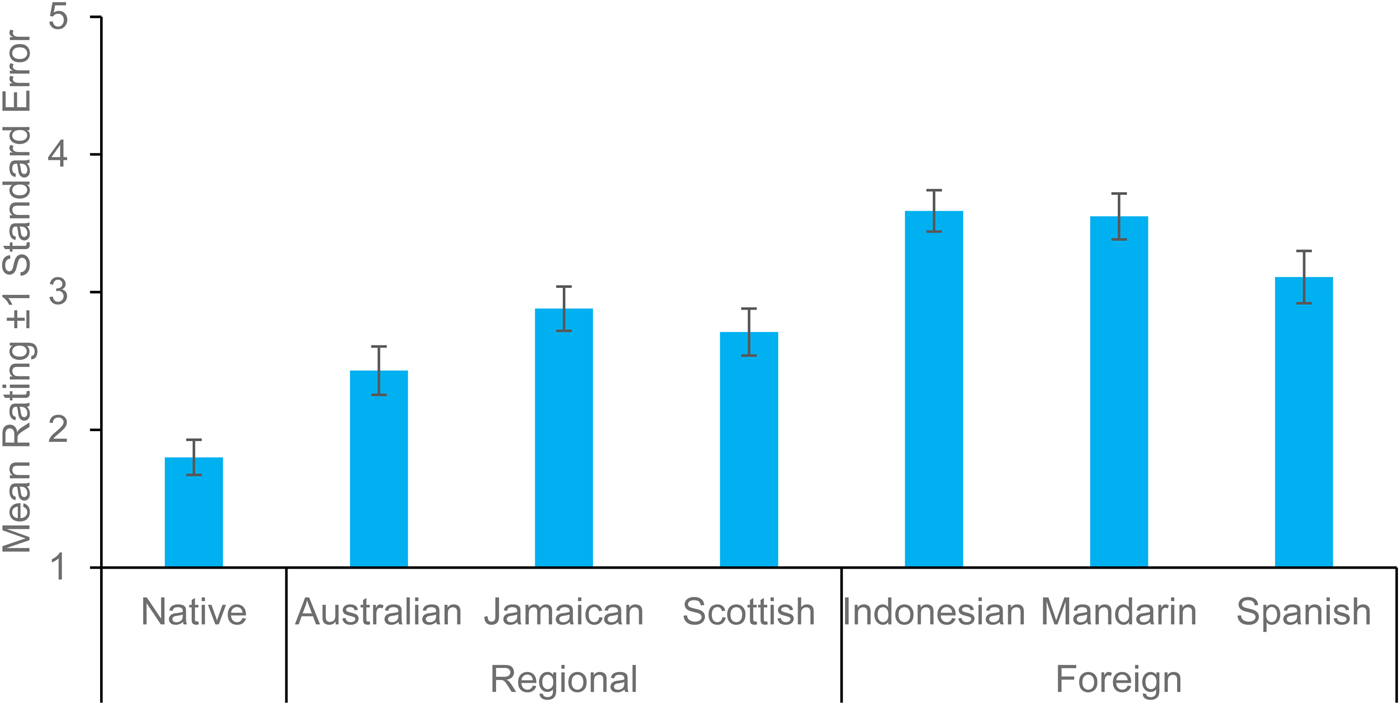
To examine whether preschoolers are sensitive to differences among accents when only prosodic information is available, we entered their scores (see Figure 4) into an analysis of variance (ANOVA) with the within-subjects factor accent (native, Australian, Jamaican, Scottish, Indonesian, Mandarin, Spanish) and the between-subjects factor age (four years, five years). There was a main effect of accent (F(6,324) = 14.70, p < .001, np2 = .21), no main effect of age (F(1,54) = 1.37, p = .247), and no interaction between accent and age (F(6,324) = 0.99, p = .435). Because there was no interaction, we collapsed across age in the remaining analyses.
Mean scores and standard errors in Experiment 2.

The order of the accents from smallest to largest distance score was: native (M = 1.80), Australian (M = 2.43), Scottish (M = 2.71), Jamaican (M = 2.88), Spanish (M = 3.11), Mandarin (M = 3.55), Indonesian (M = 3.59). Children differentiated the native accent from the Australian accent (i.e., the non-Canadian accent with the smallest distance score) (t(55) = 3.01, p = .004). When the non-Canadian accents were compared directly, 5 of 15 possible pairwise comparisons were significant with Bonferroni corrections: Australian–Mandarin (p < .001), Australian–Indonesian (p < .001), Scottish–Mandarin (p = .027), Scottish–Indonesian (p = .009), Jamaican–Indonesian (p = .013), and the Jamaican–Mandarin comparison was marginal (p = .069). Therefore, children in this experiment differentiated their native accent from the other accents, and also showed graded sensitivity to differences among the other accents. One potential concern with this interpretation is that, rather than attending to accent, children could have focused only on similarities between the voice properties of the native speaker and other speakers. On this account, all of the female speakers should have been rated as closer to the native speaker than male speakers were. But this did not occur.
To address our second goal, we again compared children's average scores across the three regional accents with their average scores across the three foreign accents. This time, there was a significant difference between the two types of accents (t(55) = 5.01, p < .001, d = .67). This was also true when separately examining four-year-olds (t(27) = 3.93, p = .001, d = .74) and five-year-olds (t(27) = 3.10, p = .004, d = .59). Thus, children in this experiment treated foreign accents as more perceptually distant than regional accents.
General discussion
We examined four- and five-year-olds’ sensitivity to degree of accentedness. In our first experiment, children at both ages distinguished their native Canadian accent from a variety of regional and foreign accents, and five-year-olds also judged that some of these non-Canadian accents were dissimilar from one another. In contrast, four-year-olds treated all of the non-Canadian accents similarly. In our second experiment, children heard low-pass filtered versions of the accents, which retained prosodic, but not phonetic, information. In this experiment, children at both ages again distinguished their native accent from the other accents. This time, however, children at both ages also distinguished among the non-Canadian accents, and also perceived foreign accents as more distant than regional accents.
Together, these experiments show that preschoolers are sensitive to degree of accentedness. The second experiment also suggests that children's sensitivity to accentedness reflects the distinction between foreign and regional accents, and provides the first evidence about one feature (prosody) used by preschoolers to differentiate among accents. We discuss these conclusions in greater detail below.
Sensitivity to degree of accentedness
Our findings provide the first direct evidence that preschoolers are sensitive to degree of accentedness. As reviewed in the ‘Introduction’, some previous studies provided indirect evidence for this sensitivity, by showing that five- to six-year-olds typically find it easier to classify their native accent vs. a foreign accent than to classify either type of accent against a regional accent (e.g., Floccia et al., Reference Floccia, Butler, Girard and Goslin2009; Girard et al., Reference Girard, Floccia and Goslin2008; Jones et al., Reference Jones, Yan, Wagner and Clopper2017; Wagner et al., Reference Wagner, Clopper and Pate2014). Although this suggests that children perceive distance, with regional accents being perceptually intermediate, this pattern could also stem from children being sensitive to aspects of speech other than degree of perceptual accentedness. This includes, for example, differences in familiarity between specific regional and foreign accents, or a heuristic based on comprehensibility or intelligibility. In the present experiment, children made judgments about speakers with a variety of accents. We have no evidence to suggest, based on demographic information about the region, that the accents rated as less distant were more familiar to our participants. Moreover, children distinguished accents even when the sentences were filtered so that they were all uninterpretable (more on this below).
Although our experiments show that children perceive some accents as more distant than others, it is important to acknowledge that they do not permit conclusions about whether particular accents are more or less distant than one another. For example, they do not permit the conclusion that children will always perceive Indonesian accents as more distant than Spanish ones, as there was only one speaker of each accent, and they were not matched for proficiency. Our experiments were not intended or designed to yield such conclusions about the ordering of specific accents. Instead, our experiments were designed to probe whether children are capable of ordering accents systematically at all. To draw more generalizable conclusions about children's ordering of specific accents, future studies could include several sentences and speakers for each accent, with more rigorous matching of proficiency across foreign accents. For now, though, our experiments advance knowledge by showing that children perceive degree of accentedness.
The distinction between foreign and regional accents
One goal of the present study was to determine if preschoolers’ judgments of accentedness reflect the distinction between foreign and regional accents. Although children did not show sensitivity to this distinction in the first experiment, where they heard regular speech, they were sensitive to it in the second experiment, where they heard low-pass filtered speech. In this experiment, children rated foreign accents as more perceptually distant than regional accents. These findings support other studies (e.g., Floccia et al., Reference Floccia, Butler, Girard and Goslin2009; Girard et al., Reference Girard, Floccia and Goslin2008; Wagner et al., Reference Wagner, Clopper and Pate2014) in suggesting that preschoolers perceive foreign and regional accents differently, and further suggest that they perceive accented speech on a scale in which foreign accents are more perceptually distinct than regional accents, similar to adults (e.g., Atagi & Bent, Reference Atagi and Bent2016; Clarke & Garrett, Reference Clarke and Garrett2004; Floccia et al., Reference Floccia, Goslin, Girard and Konopczynski2006; Goslin et al., Reference Goslin, Duffy and Floccia2012). This said, it would be helpful for future studies to test whether this generalizes beyond the particular accents and speakers that we examined.
Our findings also extend previous results about regional vs. foreign accents in two ways. First, children showed very robust discrimination of the regional accents and their own native accent, a sensitivity that has been hard to demonstrate in previous work. This could be due in part to the accents used (Australian, Jamaican, Scottish, vs. Canadian). Some studies used regional accents from the same country as the children (Girard et al., Reference Girard, Floccia and Goslin2008; Jones et al., Reference Jones, Yan, Wagner and Clopper2017), which are often (though not always) more similar to each other than regional accents from different countries. However, it could also reflect the sensitivity of the current measures. Second, our results suggest that the distinction between regional and foreign accents is more obvious to children in certain contexts (the difference only emerged in Experiment 2, where they heard filtered speech).
Features used to differentiate among accents
Our experiments are the first to begin to investigate which features of speech allow preschoolers to differentiate among accents. We show that children are influenced by prosody, as four- and five-year-olds in the second experiment were sensitive to degree of accentedness when responding to low-pass filtered recordings, which retained prosodic information but not phonetic information. These findings again reveal similarities between preschoolers and adults, as prosody is a major contributor to adults’ perception of accents (e.g., Munro, Reference Munro1995).
As noted above, the second experiment also rules out the possibility that children only make accent judgments using a heuristic in which accents are judged to be more distant based on how difficult they are to understand. Our results demonstrate that children do not need to understand speech to perceive accentedness (as low-pass filtered utterances cannot be understood). Nonetheless, intelligibility and comprehensibility could inform judgments of accent strength in other situations. Indeed, they are contributors to adults’ judgments of accent strength (Kang, Thomson, & Moran, Reference Kang, Thomson and Moran2018; Munro & Derwing, Reference Munro and Derwing1995).
The finding that prosody influences children's perceptions of degree of accentedness also raises questions for future research. One question concerns which aspects of prosody children are sensitive to when perceiving accentedness. Adults are especially attuned to aspects of prosody that reflect fluency (e.g., native vs. non-native fluency; e.g., Grover et al., Reference Grover, Jamieson and Dobrovolsky1987; Shah Reference Shah2003; Tajima et al., Reference Tajima, Port and Dalby1997). These features include, for example, speech rate and pausing (slower speech with more pausing reflects less fluency). It is plausible that children were sensitive to fluency, because speakers with regional accents (who are native speakers) tend to be more fluent than speakers with foreign accents (who are not native speakers). Although there were no overt disfluencies in our sentence stimuli, there were clear differences in speech rate. Children's judgments were well aligned with these speech rate differences and with adults’ judgments of fluency. The speaker who spoke most slowly (the Indonesian speaker) was rated as the most distant in both experiments. Therefore, children's differentiation of regional and foreign accents in the second experiment may in part reflect sensitivity to differences in fluency. However, other prosodic differences across stimuli could have influenced their judgments as well. For example, the three foreign-accented speakers produced longer function words relative to the length of their content words, suggesting less of the reduction that is characteristic of native English speech (which would lead to a different rhythm). Future research could examine the contributions of specific aspects of prosody, as well as whether children's perception of accentedness depends on other aspects of speech.
Acknowledgments
The authors thank the Waterloo Region schools and day-care centers for allowing us to conduct our research, and thank the numerous families who participated. This research was supported by grants from the Natural Sciences and Engineering Research Council of Canada awarded to O.F. and K.S.W.
Appendix
A. Speaker information from the Speech Accent Archive

B. Acoustic analysis of stimuli (Experiment 1 stimuli)

C. Adults’ subjective ratings of the stimuli (Experiment 1 stimuli)
Procedure
American Adults were recruited and tested using Amazon's Mechanical Turk (N = 207 plus 3 participants excluded for not responding to any test questions). Participants were randomly assigned to answer one of seven questions (e.g., “How strong is the speaker's accent?”). Each participant answered that question using a 7-point Likert scale (e.g., 1 = ‘very weak’, 7 = ‘very strong’) for all seven speakers. The order in which participants heard the speakers was randomized.
Mean adult ratings (7-point scale)