




1. Introduction
Mesoscale eddies play a key role in the redistribution of tracers about the global ocean and are also responsible for the formation of ubiquitous submesoscale features such as fronts and filaments (Abraham & Bowen Reference Abraham and Bowen2002; Smith & Ferrari Reference Smith and Ferrari2009). With spatial scales of the order of 10–100 km, mesoscale eddies are often too small to be dynamically resolved in ocean general circulation models (GCMs). The tracer release experiment by Ledwell, Watson & Law (Reference Ledwell, Watson and Law1998) found that filaments have lengths of the order of 10 km and widths of the order of 1 km, also too small to be resolved by standard grid resolutions in GCMs. Fronts and filaments feature strong tracer gradients which, like mesoscale eddies, can affect the evolution of the large-scale tracer distribution (Nencioli et al. Reference Nencioli, d'Ovidio, Doglioli and Petrenko2013). Therefore, accounting for these subgrid effects in a GCM is necessary in order to reliably predict tracer distributions on the larger scales. Although eddy-permitting models are becoming more viable, to completely resolve mesoscale eddies, mesoscale eddy effects and submesoscale filaments is out of reach for the foreseeable future. The prevailing solution to this issue is to parameterise the missing mesoscale eddy/subgrid effects.
Currently, the most commonly implemented closures in GCMs for eddy tracer transport are isopycnal diffusion (Redi Reference Redi1982) and advection by the Gent and McWilliams eddy-induced velocity (Gent & McWilliams Reference Gent and McWilliams1990; Gent et al. Reference Gent, Willebrand, McDougall and McWilliams1995). In this study we focus on the diffusive part of eddy transport. Mesoscale eddies are known to drive inhomogeneous and anisotropic eddy diffusion (Berloff, McWilliams & Bracco Reference Berloff, McWilliams and Bracco2002; Rypina et al. Reference Rypina, Kamenkovich, Berloff and Pratt2012; Kamenkovich, Rypina & Berloff Reference Kamenkovich, Rypina and Berloff2015; Haigh et al. Reference Haigh, Sun, Shevchenko and Berloff2020) and there have been some efforts to implement anisotropic schemes in GCMs (Smith & Gent Reference Smith and Gent2004). The ubiquity of anisotropic eddy diffusion in the ocean – of which tracer filamentation is a subcategory – means it is necessary to develop and improve parameterisations that account for it.
Scalar diffusivities are unable to account for anisotropic eddy diffusion and diagonal diffusion tensors can only have directions of preferential diffusion aligned with the model grid. On the other hand, general tensors such as a symmetric  $2 \times 2$ tensor for 2-D flow are ideal for parameterising anisotropic eddy diffusion. With a
 $2 \times 2$ symmetric diffusion tensor
 $\boldsymbol{\mathsf{S}}$, the direction of preferential eddy diffusion is equivalent to the principal axis of
 $\boldsymbol{\mathsf{S}}$; we refer to this as the diffusion axis. A diagnosed diffusion tensor depends on the model/fluid flow and method employed, but some properties, such as the magnitude of the eigenvalues, have been observed to be similar for both Eulerian (Abernathey, Ferreira & Klocker. Reference Abernathey, Ferreira and Klocker.2013; Bachman, Fox-Kemper & Bryan Reference Bachman, Fox-Kemper and Bryan2020) and Lagrangian approaches (Rypina et al. Reference Rypina, Kamenkovich, Berloff and Pratt2012; Kamenkovich et al. Reference Kamenkovich, Rypina and Berloff2015). In addition, the diffusion axis is found to often align with the mean velocity vector, which is a consequence of shear dispersion (Young, Rhines & Garrett Reference Young, Rhines and Garrett1982), enhancing mixing in the direction of the flow.
Using a quasigeostrophic model, Haigh et al. (Reference Haigh, Sun, McWilliams and Berloff2021a) defined eddies and large scales using a spatial filter and found that the diffusion axis has complicated spatial and temporal dependence, but that it tends to align with the large-scale flow, agreeing with earlier studies. Another key finding was that the eigenvalues of the diffusion tensor  $\boldsymbol{\mathsf{S}}$ are arranged in opposite-signed pairs, as was also found with comprehensive GCMs (Stanley, Bachman & Grooms Reference Stanley, Bachman and Grooms2020; Kamenkovich et al. Reference Kamenkovich, Berloff, Haigh, Sun and Lu2021). Haigh et al. (Reference Haigh, Sun, Shevchenko and Berloff2020) confirmed that opposite-signed eigenvalues were a robust feature for a selection of spatial filter sizes and for eddy fluxes in a Reynolds eddy decomposition. With opposite-signed eigenvalues, the associated eddy tracer flux is the sum of a down-gradient flux in the direction of the diffusion axis and an up-gradient flux in the perpendicular direction, quantifying the role of mesoscale eddies in producing tracer filaments. Haigh & Berloff (Reference Haigh and Berloff2021) confirmed that net up-gradient passive tracer fluxes are common – this guarantees the diagnosis of negative eigenvalues. Since these are studies of passive tracers, it is not true that diagnoses of up-gradient fluxes and negative diffusivities are a consequence of selecting the ‘wrong’ value to diffuse, but this is a possible scenario with up-gradient momentum fluxes (Starr Reference Starr1968) which are linked to down-gradient potential vorticity diffusion.
The above studies consider geostrophic turbulence but consideration of opposite-signed diffusion eigenvalues is not limited to this branch of fluid dynamics. Many large-eddy simulation studies (e.g. Meneveau & Katz Reference Meneveau and Katz2000; Eyink Reference Eyink2001; Balarac et al. Reference Balarac, Le Sommer, Meunier and Vollant.2013) consider the ‘gradient model’ for which the corresponding diffusion tensor has opposite-signed eigenvalues provided the flow is weakly divergent or non-divergent.
Implementing any negative diffusivities in a numerical model is likely to cause instability issues, as is also true for the gradient model (Dubos & Babiano Reference Dubos and Babiano2002). In this study we incorporate opposite-signed diffusion eigenvalues into idealised tracer simulations and consider the resulting instability. We first consider the time scale for instability for a fixed diffusion axis, after which we determine to what extent a variable diffusion axis affects this instability. Although motivated by oceanographic fluid dynamics, this study has broad applications since we consider the diffusion equation which is relevant to a wide range of fluid dynamics problems.
This study is organised as follows. In § 2 we introduce the parameterised tracer equation and discuss properties of the diffusion tensor. In § 3 we simplify the tracer equation to include only eddy diffusion. Then in § 3.1 we simulate the idealised system with opposite-signed diffusion eigenvalues and a fixed diffusion axis with an aim to determine typical time scales for the onset of instability. We then explore simulations with a variable diffusion axis in § 3.2 to examine how this affects the stability of the model. We conclude and discuss our results in § 4.
2. The parameterised tracer equation and the diffusion tensor
We are interested in the stability of the equation
 \begin{equation} \frac{\partial C}{\partial t} + (\boldsymbol{u} + \boldsymbol{u}_{*}) \boldsymbol{\cdot} \boldsymbol{\nabla} C = \boldsymbol{\nabla} \boldsymbol{\cdot} \left(\boldsymbol{\mathsf{S}} \boldsymbol{\nabla} C\right) + \nu \nabla^{2}C + F \end{equation}
for a passive tracer  $C$ with
 $F$ representing any processes other than those discussed below. The tracer equation (2.1) represents the budget in a non-eddy-resolving or eddy-permitting configuration. In the 2-D setting that we consider,
 $C(x,y,t)$ is advected by the resolved lateral velocity field
 $\boldsymbol {u}$ and the lateral eddy-induced velocity (EIV)
 $\boldsymbol {u}_{*}$. The transport effects associated with the EIV can also be represented by an antisymmetric tensor (Haigh et al. Reference Haigh, Sun, McWilliams and Berloff2021b), which can have numerical advantages (Griffies Reference Griffies1998) over using an EIV. Other subgrid effects are parameterised by the
 $2\times 2$ symmetric diffusion tensor
 $\boldsymbol{\mathsf{S}}$ and the homogeneous explicit diffusion with amplitude governed by the diffusivity
 $\nu$. The diffusion tensor
 $\boldsymbol{\mathsf{S}}$ and the EIV
 $\boldsymbol {u}_{*}$ are intended to account for the effects of mesoscale eddies, flows with scales of the order of 10–100 km. The explicit diffusion governed by
 $\nu$ is intended to parameterise submesoscale effects, but such a closure is commonly implemented to account for mesoscale eddy effects.
The diffusion tensor and EIV can be incorporated into a single tensor, the transport tensor, but keeping them separate is useful since they represent distinct effects. A wide range of approaches can be used to define and compute the transport and diffusion tensors. Part of the motivation for this study are the results of Haigh et al. (Reference Haigh, Sun, Shevchenko and Berloff2020) and Haigh et al. (Reference Haigh, Sun, McWilliams and Berloff2021a) in which the  $2 \times 2$ transport tensor
 $\boldsymbol{\mathsf{K}}$ is defined via the flux-gradient relation
 \begin{equation} \boldsymbol{f} ={-} \boldsymbol{\mathsf{K}} \boldsymbol{\nabla} C, \end{equation}
where  $\boldsymbol {f}$ is the eddy tracer flux and
 $C$ is the resolved/large-scale tracer field. The diffusion tensor is the symmetric part of
 $\boldsymbol{\mathsf{K}}$:
 \begin{equation} \boldsymbol{\mathsf{S}} = \tfrac{1}{2} \left(\boldsymbol{\mathsf{K}} + \boldsymbol{\mathsf{K}}^{T} \right) = \begin{pmatrix} S_{11} & S_{12} \\ S_{12} & S_{22} \end{pmatrix}. \end{equation}
For a given diffusion tensor  $\boldsymbol{\mathsf{S}}$, whether prescribed or diagnosed, it is useful to characterise it in terms of its eigenvalues,
 $\lambda _{1}$ and
 $\lambda _{2}$, and the orientation of its principal axis,
 $\alpha$. We refer to these as the diffusion eigenvalues and the diffusion angle. The diffusion eigenvalues are
 \begin{gather} \lambda_{1} = S_{11} \cos^{2}{\alpha} + S_{22} \sin^{2}{\alpha} + 2S_{12} \cos{\alpha}\sin{\alpha} , \end{gather}
 \begin{gather}\lambda_{2} = S_{11} \sin^{2}{\alpha} + S_{22} \cos^{2}{\alpha} - 2S_{12} \cos{\alpha}\sin{\alpha}, \end{gather}
and the diffusion angle is
 \begin{equation} \alpha = \frac{1}{2}\tan^{{-}1} \left(\frac{2 S_{12}}{S_{11} - S_{22}}\right). \end{equation}
Selecting the correct quadrant when calculating the inverse tan for  $2\alpha$ guarantees that
 $\lambda _{1} \ge \lambda _{2}$. The principal axis of
 $\boldsymbol{\mathsf{S}}$, which we refer to as the diffusion axis, is
 $\boldsymbol {v} = (\cos {\alpha }, \sin {\alpha })$.
The transport tensor  $\boldsymbol{\mathsf{K}}$ can be obtained using a number of methods such as by over-determining the flux-gradient relation and using a least-squares algorithm (Bachman et al. Reference Bachman, Fox-Kemper and Bryan2020) or by a direct inversion using the minimum number of tracers required (two since
 $\boldsymbol{\mathsf{K}}$ has four entries) (Haigh et al. Reference Haigh, Sun, Shevchenko and Berloff2020). Haigh et al. (Reference Haigh, Sun, McWilliams and Berloff2021a) diagnosed the diffusion tensor
 $\boldsymbol{\mathsf{S}}$ for an eddy-resolving quasigeostrophic simulation, using a spatial filter to separate eddy and large scales, and showed that
 $\boldsymbol{\mathsf{S}}$ is characterised by pairs of opposite-signed diffusion eigenvalues. Haigh et al. (Reference Haigh, Sun, Shevchenko and Berloff2020) demonstrated that opposite-signed eigenvalues are a robust feature of
 $\boldsymbol{\mathsf{S}}$ as they are obtained for a range of spatial filter sizes as well as for eddies defined as the deviation from the time mean. Other studies (Stanley et al. Reference Stanley, Bachman and Grooms2020; Kamenkovich et al. Reference Kamenkovich, Berloff, Haigh, Sun and Lu2021) have shown that opposite-signed eigenvalues are also a prevalent feature of the diffusion tensor for passive tracer transport in GCM simulations. Although we are motivated by these past oceanographic studies, the results of this study are applicable to any fluid system which features diffusive processes, in particular those with any anti-diffusive or filamentation effects. Parameterising any processes with negative diffusion is likely to cause model instability issues; the remainder of this study is devoted to quantifying this instability in idealised tracer simulations.
3. Experiments with a simplified model
We consider the stability of numerical simulations of the tracer equation forced only by mesoscale eddy diffusion. To simplify further, we impose that  $\boldsymbol{\mathsf{S}}$ is homogeneous in space, for which the tracer equation (2.1) becomes
 \begin{equation} \frac{\partial C}{\partial t} = S_{11} \frac{\partial^{2} C}{\partial x^{2}} + 2 S_{12} \frac{\partial^{2} C}{\partial x \partial y} + S_{22} \frac{\partial^{2} C}{\partial y^{2}}. \end{equation}
Customarily, the diffusion eigenvalues  $\lambda _{1}$,
 $\lambda _{2}$ and angle
 $\alpha$ are defined in terms of the entries of
 $\boldsymbol{\mathsf{S}}$, but in this study we will prescribe rather than diagnose these quantities. In this case it is useful to express the entries of
 $\boldsymbol{\mathsf{S}}$ in terms of
 $\lambda _{1}$,
 $\lambda _{2}$ and
 $\alpha$:
 \begin{gather} S_{11} = \lambda_{1}\cos^{2}\alpha + \lambda_{2}\sin^{2}\alpha, \quad S_{12} = (\lambda_{1}-\lambda_{2})\cos\alpha\sin\alpha, \quad S_{22} = \lambda_{1}\sin^{2}\alpha + \lambda_{2}\cos^{2}\alpha. \end{gather}
Throughout this study the first diffusion eigenvalue will be kept fixed at  $\lambda _{1} = 1000\ {\rm m}^{2}\ {\rm s}^{-1}$, a typical value observed and implemented for upper-ocean eddy diffusion (Marshall et al. Reference Marshall, Shuckburgh, Jones and Hill2006; Klocker et al. Reference Klocker, Ferrari, LaCasce and Merrifield2012; Haigh et al. Reference Haigh, Sun, Shevchenko and Berloff2020).
To simulate (3.1) we use the fourth-order Runge–Kutta (RK4) explicit time-stepping scheme with a centred-in-space spatial discretisation and a conservative flux-form implementation. Since  $\lambda _{2}<0$ this scheme is in general unstable. We could consider an implicit scheme such as backward-in-time, centred-in-space which is unconditionally stable for positive eigenvalues, but this is also unstable for
 $\lambda _{2}<0$. We use periodic boundary conditions, but the results of this study are the same for Neumann and Dirichlet conditions. We have a square domain with
 $x, y \in [0,L]$ where
 $L = 3840$ km is the basin side length. The domain is uniformly discretised onto an
 $N \times N$ grid and we consider three grid resolutions:
 $N = 129$,
 $257$,
 $513$ which have corresponding grid spacings of
 ${{\rm d} x} = {{\rm d} y} = 30$,
 $15$,
 $7.5$ km. For the RK4 scheme, we use a time step of
 ${\rm d}t = {{\rm d} x}^{2} / (4 \lambda _{1})$, such that the scheme would be well within the stable range if we were to omit the negative diffusion.
In all our numerical experiments, we initialise  $C$ as a Gaussian-shaped patch in the centre of the domain:
 \begin{equation} C_{0}(x,y) = B\exp{\left[ -\frac{\left(x - L / 2\right)^{2}}{2 \sigma_{x}^{2}} -\frac{\left(y - L / 2\right)^{2}}{2 \sigma_{y}^{2}} \right]}. \end{equation}
Here  $\sigma _{x}$ and
 $\sigma _{y}$ are the zonal and meridional standard deviations, respectively. We take default values of these to be
 $\sigma = \sigma _{x} = \sigma _{y} = 150$ km. The constant
 $B$ is arbitrary.
3.1. Fixed diffusion axis
We begin with the case of a fixed diffusion axis. Setting  $\alpha = 0$ leads to the diffusion equation
 \begin{equation} \frac{\partial C}{\partial t} = \lambda_{1} \frac{\partial^{2} C}{\partial x^{2}} + \lambda_{2} \frac{\partial^{2} C}{\partial y^{2}}. \end{equation}
With  $\lambda _{2} < 0$, numerical integrations of (3.4) are unstable, with the instability time scale proportional to
 $-\lambda _{2}$. In addition, with finer grid resolutions, we expect earlier onset of instability since higher frequency (in space) modes are most unstable.
In figure 1(a) we show the same contour of the tracer field  $C$ at four different times,
 $t = 0$,
 $t = 45$ days,
 $t = 90$ days and
 $t = 100$ days, for the case of
 $\lambda _{2} = -1000 {\rm m}^{2}\ {\rm s}^{-1} = - \lambda _{1}$ and
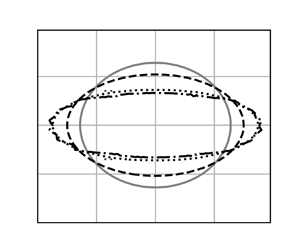
 $N=257$. The tracer patch evolves as expected: it stretches in the zonal direction as a result of the down-gradient zonal diffusion, and it contracts in the meridional direction as a result of the up-gradient meridional diffusion. After roughly
 $100$ days, grid-scale oscillations appear in the tracer field as a result of the persistent up-gradient fluxes and these oscillations rapidly diverge to infinity in magnitude.
(a) The same contour of the tracer field at times  $t=0$ (solid grey),
 $t=45$ days (dashed black),
 $t=90$ days (dotted black) and
 $t=100$ days (dashed-dotted black) in the simulation of (3.4) with Gaussian initial condition and
 $N=257$. For better visualisation we have zoomed in on the tracer patch. (b) The instability time scale (
 $y$-axis, log scale) for the diffusion equation with
 $\alpha = 0$,
 $\lambda _{1} = 1000\ {\rm m}^{2}\ {\rm s}^{-1}$ and
 $- \lambda _{2} \in [10, 1000]\ {\rm m}^{2}\ {\rm s}^{-1}$ on the
 $x$-axis. Results are for grid resolutions
 $N=513$ (black),
 $N=257$ (grey) and
 $N=129$ (light grey).

No matter how large or small the negative diffusion eigenvalue  $\lambda _{2}$ is, the system (3.4) is always unstable. However, the time scale for the onset of instability is dependent on the parameters
 $N$ and
 $\lambda _{2}$. Knowing this time scale is useful since it is a measure of the severity of the instability; for longer time scales there is a greater chance that other processes such as advection, sources/sinks or explicit diffusion can prevent the onset of instability. We define the instability time scale to be the first instance in the numerical simulations at which the domain-integrated tracer variance exceeds twice its initial value. Although this choice is somewhat arbitrary, the instabilities grow so fast that varying the condition has negligible effects on the diagnosed time scale. For example, for the simulation shown in figure 1(a), it takes
 $103$ days for the total tracer variance to exceed twice its initial value and it takes
 $107$ days to reach
 $10$ times its initial value. This variance growth is caused by grid-scale oscillations associated with the instability.
In figure 1(b) we show the instability time scale for  $-\lambda _{2} \in [10, 1000]\ {\rm m}^{2}\ {\rm s}^{-1}$ for three different grid resolutions with
 $\lambda _{1} = 1000\ {\rm m}^{2}\ {\rm s}^{-1}$ fixed. This confirms that the instability time scale is inversely proportional to
 $- \lambda _{2}$ and that the time scale is shorter for finer grid resolutions. However, we do not observe a consistent power scaling as the grid resolution varies: with
 $N=513$ and
 $N=257$, the instability time scale for the latter is four times longer than for the former, but we do not diagnose the same scaling between the time scales for the
 $N=257$ and
 $N=129$ cases. For the largest value of
 $\lambda _{2} = -1000\ {\rm m}^{2}\ {\rm s}^{-1}$, in the low-resolution case the instability time scale is
 $130$ days, in the mid-resolution case it is
 $103$ days whereas for the higher resolution case the time scale is
 $25$ days. For the weakest value of
 $\lambda _{2} = -10\ {\rm m}^{2}\ {\rm s}^{-1}$, these time scales are expectedly
 $100$ times longer.
Since the first eigenvalue  $\lambda _{1}$ has no influence on the meridional tracer flux we find that varying it does not affect the instability time scale. Varying the standard deviation of the Gaussian initial condition
 $\sigma _{y}$ does affect the time scale, but we have not observed behaviour consistent across each grid resolution. For example, doubling
 $\sigma _{y}$ leads to time scales roughly twice as long for
 $N = 129$ whereas for
 $N = 257$ it leads to time scales approximately
 $60\,\%$ as long.
3.2. Variable diffusion axis
We now consider a time-dependent diffusion axis which, like the eigenvalues, is imposed to be homogeneous in space. There are many options for prescribing  $\alpha$, but we opt for the simple case of
 $\alpha$ varying linearly in time, i.e.
 $\alpha = \dot {\alpha } t$ where
 $\dot {\alpha }$ is a constant. This corresponds to a diffusion axis that rotates at a constant rate. Aside from its simplicity, this choice is motivated by the behaviour of the diffusion axis in the diagnostic studies of Haigh et al. (Reference Haigh, Sun, Shevchenko and Berloff2020, Reference Haigh, Sun, McWilliams and Berloff2021a). In their diagnoses the diffusion axis spins at a wide range of average rates, commonly completing between 0.5 and 3 periods of
 ${\rm \pi}$ per year but as many as
 $10$ periods are also observed. This rotation rate is rarely constant and at many grid points the diffusion axis oscillates about some time-mean value, but we maintain that
 $\alpha = \dot {\alpha } t$ for constant
 $\dot {\alpha }$ represents the ideal starting point.
As an example we consider the numerical simulation of (3.1) with  $\dot {\alpha } = 0.02$ per day, corresponding to a
 ${\rm \pi}$-periodicity, which we denote
 $T_{\alpha }$, of
 $157$ days. Figure 2(a) shows the same tracer contour at times
 $t=0$,
 $t = 45$ days,
 $t = 90$ days and
 $t = 600$ days. This illustrates that after
 $600$ days the tracer variance has not diverged to infinity, but throughout this simulation the tracer variance periodically exceeds twice its initial value. These instances occur every
 $T_{\alpha }/2$ days between which the variance returns to near its initial value. This behaviour is caused by the rotation of the diffusion axis: down-gradient diffusion eventually acts in the direction which was previously subject to up-gradient diffusion, reversing the onset of instability. As a result, realistic tracer snapshots are observed thousands of days into the simulation, but for this particular choice of
 $\dot {\alpha }$ the tracer mass does eventually and irreversibly diverge to infinity.
(a) The same contour of the tracer field at times  $t=0$ (solid grey),
 $t=45$ days (dashed black),
 $t=90$ days (dotted black) and
 $t=600$ days (dashed-dotted black) in the simulation of (3.1) with Gaussian initial condition and
 $N=257$. A variable diffusion axis with rotation rate
 $\dot {\alpha } = 0.02$ per day is imposed. For better visualisation we have zoomed in on the tracer patch. (b) The instability time scale vs the diffusion axis rotation rate
 $\dot {\alpha }$. Results are for
 $\lambda _{2}=-800\ {\rm m}^{2}\ {\rm s}^{-1}$ (black),
 $\lambda _{2}=-900 \ {\rm m}^{2}\ {\rm s}^{-1}$ (grey) and
 $\lambda _{2}=-1000\ {\rm m}^{2}\ {\rm s}^{-1}$ (light grey). In all runs,
 $\lambda _{1} = 1000\ {\rm m}^{2}\ {\rm s}^{-1}$ and
 $N = 257$ are fixed. The vertical dashed lines denote
 $\dot {\alpha }$ values corresponding to diffusion axis
 ${\rm \pi}$-periodicities of
 $300$,
 $200$ and
 $150$ days.

In figure 2(b) we show the instability time scale for a range of diffusion axis rotation rates and for  $\lambda _{2} \in \{-800, -900, -1000\}\ {\rm m}^{2}\ {\rm s}^{-1}$ with
 $N = 257$ and
 $\lambda _{1} = 1000\ {\rm m}^{2}\ {\rm s}^{-1}$ fixed. To produce each line we start with
 $\dot {\alpha } = 0$, obtain the instability time scale, increment
 $\dot {\alpha }$ by
 $3 \times 10^{-4}$ day
 $^{-1}$ and then repeat. Each simulation is run for a maximum of 100 000 days. For each value of
 $\lambda _{2}$ there is a value of
 $\dot {\alpha }$ for which for all greater
 $\dot {\alpha }$ that we considered (we test
 $\dot {\alpha }$ up to
 $0.03$ day
 $^{-1}$) an instability never manifests within 100 000 days. In figure 2(b) each line terminates at this value of
 $\dot {\alpha }$. For reference, rotation rates of
 $0.01$ and
 $0.02$ day
 $^{-1}$ correspond to
 $T_{\alpha }$ periodicities of
 $314$ and
 $157$ days. Other useful time scales are plotted as vertical dashed lines in figure 2(b).
For each choice of  $\lambda _{2}$, there is a diffusion axis rotation rate
 $\dot {\alpha }$ after which the instability time scale rapidly increases upon further increases to
 $\dot {\alpha }$. Shortly after this each line terminates, indicating that, provided the diffusion axis rotates quickly enough, the simulation remains stable (variance never exceeds twice its initial value). That is, implementing a time-dependent diffusion axis can cause long-time simulations with opposite-signed eigenvalues to never manifest an instability, while for a fixed diffusion axis this instability would have manifested after approximately
 $100$ days. With weaker
 $\lambda _{2}$, the diffusion axis need not spin as quickly before a stable simulation is reached. For example, for
 $\lambda _{2} = -800\ {\rm m}^{2} \ {\rm s}^{-1}$, the simulation remains stable for (approximately)
 $\dot {\alpha } > 0.016$, corresponding to
 ${\rm \pi}$-periodicities
 $T_{\alpha }$ shorter than approximately
 $200$ days. For
 $\lambda _{2} = -1000\ {\rm m}^{2}\ {\rm s}^{-1}$,
 $T_{\alpha }$ shorter than roughly
 $125$ days is required for stability throughout the 100 000-day simulation.
It is informative to compare the  $T_{\alpha }$ at which the simulations become stable with the e-folding time scale
 $T_{e} = \sigma ^{2} / |\lambda _{2}|$. For slow diffusion axis rotation (
 $T_{\alpha } \gg T_{e}$), averaging (3.2a–c) over the time scale
 $T_{e}$ gives
 \begin{equation} S_{11} \approx \lambda_{1} > 0, \quad S_{12} \approx 0 \quad \text{and} \quad S_{22} \approx \lambda_{2} < 0. \end{equation}
With  $S_{22}$ negative this implies the tracer undergoes persistent up-gradient diffusion over the e-folding time scale, and the numerical simulations are therefore unstable. For fast rotation (
 $T_{\alpha } \ll T_{e}$), averaging (3.2a–c) over the time scale
 $T_{e}$ gives
 \begin{equation} S_{11} \approx S_{22} \approx \tfrac{1}{2} \left(\lambda_{1} + \lambda_{2}\right) \quad \text{and} \quad S_{12} \approx 0. \end{equation}
In this case, the tracer undergoes down-gradient diffusion on average provided  $\lambda _{1} \!+\! \lambda _{2} \!>\! 0$, rendering the simulations stable (we also find that simulations with
 $\lambda _{1} + \lambda _{2} = 0$ can be stable). For
 $\lambda _{2} \in \{-800, -900, -1000\}\ {\rm m}^{2}\ {\rm s}^{-1}$ as in figure 2(b), the corresponding e-folding time scales are
 $T_{e} \in \{326, 289, 260\}$ days. Figure 2(b) implies that
 $T_{\alpha }$ has to be approximately
 $100$ days shorter than
 $T_{e}$ before the rapid improvements in stability occur. Lastly, we note that (3.6a,b) conversely implies that if
 $\lambda _{1} + \lambda _{2} < 0$, then (3.1) cannot be stable no matter how fast the diffusion axis spins. Experiments with
 $\lambda _{1} + \lambda _{2} < 0$ confirms this (not shown), although a quickly rotating diffusion axis can still delay the onset of instability in this case.
4. Conclusion
This study has been motivated by (1) the prevalence of mesoscale-eddy-produced tracer filaments in the ocean and (2) the prevalence of opposite-signed eigenvalue diffusivities in diagnosed diffusion tensors for eddy tracer transport. The tracer release experiment of Ledwell et al. (Reference Ledwell, Watson and Law1998) uncovered the ubiquity of tracer filaments in the ocean and observed these to have typical lengths of the order of  $10$ km and widths of the order of
 $1$ km. Due to computational limitations most GCMs may only be run on a coarse grid and are unable to resolve mesoscale eddies (scales of the order of 10–100 km) and the role that they play in producing and deforming tracer filaments. Furthermore, because mesoscale eddies affect large-scale tracer distributions and because tracer filaments and fronts can also affect future tracer distributions (Nencioli et al. Reference Nencioli, d'Ovidio, Doglioli and Petrenko2013), being able to parameterise these missing effects in GCMs is an important challenge for oceanographers.
Current parameterisations mostly assume that mesoscale eddy diffusion is both homogeneous and isotropic, but there is much evidence to suggest that it is inhomogeneous and anisotropic (Berloff et al. Reference Berloff, McWilliams and Bracco2002; Rypina et al. Reference Rypina, Kamenkovich, Berloff and Pratt2012; Kamenkovich et al. Reference Kamenkovich, Rypina and Berloff2015; Bachman et al. Reference Bachman, Fox-Kemper and Bryan2020). A diffusion tensor can be employed to account for the anisotropy, while simplified diagonal tensors can only have directions of preferential eddy diffusion aligned with the model grid and scalar diffusivities cannot account for anisotropy at all. Recent studies (Haigh et al. Reference Haigh, Sun, Shevchenko and Berloff2020, Reference Haigh, Sun, McWilliams and Berloff2021a; Stanley et al. Reference Stanley, Bachman and Grooms2020; Kamenkovich et al. Reference Kamenkovich, Berloff, Haigh, Sun and Lu2021) have diagnosed the diffusion tensor in both idealised models and realistic GCMs and found it to be characterised by opposite-signed eigenvalues. These diagnoses of opposite-signed eigenvalues suggest that the anisotropy is more pronounced than previously thought. With opposite-signed eigenvalues, eddy diffusion acts to stretch a tracer patch in one direction and compress it in the perpendicular direction, i.e. it drives tracer filamentation, which non-negative eigenvalue pairs are unable to account for.
Numerical instability issues associated with negative diffusivities can demotivate consideration of them (Fox-Kemper, Lumpkin & Bryan Reference Fox-Kemper, Lumpkin and Bryan2013; Bachman et al. Reference Bachman, Fox-Kemper and Bryan2020). However, given the prevalence of opposite-signed eigenvalues in recently diagnosed diffusion tensors and the ubiquity of mesoscale-eddy-generated tracer filaments in the ocean, it is argued that opposite-signed diffusion eigenvalues need more consideration. In this study we consider the instability of simple tracer simulations with prescribed opposite-signed diffusion eigenvalues. We also consider the effects of varying the diffusion axis, which quantifies the direction of preferential down-gradient diffusion.
We consider the numerical evolution of an initially Gaussian tracer patch diffused using diffusion eigenvalues  $\lambda _{1}$ and
 $\lambda _{2}$ where
 $\lambda _{1} > 0 > \lambda _{2}$. Motivated by past oceanographic studies, we use typical oceanic length scales, time scales and diffusivity magnitudes, but these values can be scaled such that the results apply to motions on any scales. For time-stepping we use the RK4 scheme and use a centred-in-space spatial discretisation. To quantify the severity of model instability associated with the negative
 $\lambda _{2}$, we define the time scale for the onset of instability to be the first instance in the simulation at which the domain-mean tracer variance exceeds twice its initial value. For a fixed diffusion axis, the system is always unstable, no matter how small the negative
 $\lambda _{2}$ is. The time scale for the onset of instability is inversely proportional to
 $-\lambda _{2}$, such that we observe instability time scales of the order of
 $100$ days for
 $\lambda _{2} = - 1000\ {\rm m}^{2} \ {\rm s}^{-1}$ and time scales of the order of 10 000 days for
 $\lambda _{2} = -10\ {\rm m}^{2}\ {\rm s}^{-1}$. Shorter/longer time scales are obtained for finer/coarser grid resolutions, an effect of higher-order modes being more unstable. We also found that these time scales for the fixed diffusion axis are insensitive to first eigenvalue
 $\lambda _{1}$.
In the diagnoses of Haigh et al. (Reference Haigh, Sun, Shevchenko and Berloff2020, Reference Haigh, Sun, McWilliams and Berloff2021a), the diffusion axis is variable in time and in many locations rotates, typically completing between  $0.5$ and
 $3$ periods of
 ${\rm \pi}$ per year. Motivated by this we imposed a diffusion axis that rotates at a constant rate, which represents the simplest extension of the fixed diffusion axis case. For
 $\lambda _{2} = -1000\ {\rm m}^{2}\ {\rm s}^{-1}$ and a slowly rotating diffusion axis (
 ${\rm \pi}$-periodicities longer than
 $150$ days), the simulations continue to be unstable. However, for all parameter configurations that we have tested there is a rotation rate for which, for all faster rotation rates, there is no manifestation of instability in the entire 100 000-day simulation. That is, simulations of the diffusion equation with one negative and one positive eigenvalue do not suffer from instability issues provided the diffusion axis rotates quickly enough. In these scenarios, the onset of instability is avoided because the rotating diffusion axis prevents the development of too-large tracer gradients in any location.
The main result of this study is that negative diffusivities can be part of stable simulations of the diffusion equation with the RK4 scheme. However, we do not propose parameterising eddy effects and filamentation using the very simple rotating diffusion scheme the we consider. We instead deem it necessary that the diffusion magnitude and diffusion axis rotation rate be linked to the resolved flow and the model grid. Making these links can be aided by considering the gradient model derived in large-eddy simulation studies (e.g. Meneveau & Katz Reference Meneveau and Katz2000; Eyink Reference Eyink2001; Nadiga Reference Nadiga2008). In the gradient model, the transport tensor is set to be proportional to (minus) the velocity gradient matrix, meaning the corresponding diffusion tensor is proportional to the strain-rate tensor. Therefore, for non-divergent or weakly divergent flow, this diffusion tensor has opposite-signed eigenvalues and therefore causes instability issues that the present study addresses. When implementing the gradient model, Dubos & Babiano (Reference Dubos and Babiano2002) imposed an additional biharmonic diffusion to counter these instability issues and in a decaying turbulence simulation they found that the strain-rate diffusivity plus the biharmonic diffusion led to improved tracer fields compared with a simulation with isotropic eddy diffusion. Not only does including the biharmonic diffusion inhibit instability, it also aids the development of sharper filaments by permitting stronger up-gradient diffusion. Similar results could be attained by including a flux-limiter scheme. Future research could expand on our general result by incorporating such methods that permit sharper tracer filamentation and improve model stability.
Acknowledgements
The authors are very grateful to S. Griffies and two anonymous reviewers whose comments were greatly helpful in improving this manuscript.
Funding
M.H. is supported by the NERC grant NE/T002220/1 and gratefully acknowledges support from the Imperial CoA NERC COVID-extension grant. P.B. gratefully acknowledges support by the NERC grants NE/R011567/1 and NE/T002220/1, the Leverhulme Trust grant RPG-2019-024 and the Moscow Center of Fundamental and Applied Mathematics (supported by the Agreement of 075-15-2019-1624 with the Ministry of Education and Science of the Russian Federation).
Declaration of interests
The authors report no conflict of interest.



