I. INTRODUCTION
In the past several decades, research in the field of amorphous materials has become very important because of their various physical properties. Special attention has been paid to chalcogenide semiconducting glasses because, compared with oxide glasses, they can be synthesized easily, and even a small change in their composition or technological process can have a great influence on their basic characteristics.Reference Mott and Davis1, Reference Popescu2 They have strong covalent network structure and they exhibit semiconducting character and other interesting features such as optical transparency in the IR region, very high refractive index, low acoustic losses of ultrasonic waves, etc.Reference Krause, Kurkjian, Pinnow and Sigety3–Reference Lukić, Petrović, Turyantisa and Khiminets7 These features make them especially interesting for applications as passive devices (lenses, fibers, windows) as well as for active devices—laser fiber amplifiers and nonlinear components. Also, chalcogenide glasses possess nonlinearities that are 2–3 orders of magnitude higher than that of silica glass.Reference Sanghera, Florea, Shaw, Purées, Nguyen, Bashkansky, Dutton and Aggarwal8
However, these glasses suffer from high brittleness and they crack easily under applied load. Furthermore, fabrication and manipulation of the structural parts are very delicate, which decreases life duration of the material in service. Therefore, studying resistance to surface damages due to sharp mechanical contact is of the utmost importance when it comes to application of chalcogenide glasses.
Our previous examinations using Vickers method have shown that microhardness usually varies linearly with glass composition.Reference Lukić, Skuban, Petrović and Šiđanin9, Reference Lukić, Petrović, Skuban, Šiđanin and Gúth10 Furthermore, the research on thin films has shown results of mechanical parameters very similar to the ones of bulk chalcogenide glasses of the same composition. Also, during measurements using Vickers direct method, different types of cracks have occurred in thin film samples, depending on the copper content in them. Some were radial-median cracks, whereas in others radial-Palmqvist cracks occurred.Reference Štrbac11
In this article, we present the results of trials using instrumented indentation method for characterizing mechanical properties of Cux[(As2Se3)0.9(AsI3)0.1]100−x glasses. Instrumented indentation method (IIT) is a modern, simple and fast technique that takes into account the specific response of the material in a much better way than Vickers’ direct method. Glass samples are of the pseudobinary system arsenic triselenide (As2Se3)–arsenic triiodide (AsI3), where we introduced copper in different atomic percentages (5, 10, 20, and 25) with the aim of establishing the effect of transition metal addition on different physical properties that are important for the application of these glasses.
This particular glass composition has been chosen as it presents a mixture of halochalcogenide elements with both covalent and ionic contributions to bonding in the network. The replacement of chalcogenide with halogen atoms leads to the decrease of average degree of branching in the glass network, causing significant decrease of glass transition temperature.Reference Feltz12 Also, the tendency of glass formation increases with the halogen radius. Thus, iodine forms stable glasses with all chalcogens. The investigations have shown that halogen doping improves the electrophotographic properties of the amorphous selenium.Reference Popescu2 Furthermore, it is known that presence of metal halogens, such as cuprous iodide (CuI), results in functional glasses with enhanced ionic conductivities,Reference Frumar, Frumarova, Wagner, Bhattacharya, Fornari and Kamimura13 ability for chemical sensing,Reference Vassilev and Boycheva14 and interesting optical upconversion properties.Reference Adam15
II. THEORETICAL BACKGROUND
Instrumented indentation method has been widely used for characterization of mechanical behavior of materials at small scales.Reference Oliver and Pharr16–Reference Cabibbo, Ricci, Cecchini, Rymuza, Sullivan, Dub and Cohen19 It is based on continuous measuring of applied indentation force, F, in dependence on displacement (indentation depth), h, so that the indentation curve F-h can be determined. Because of very small indents, which are not measurable optically with appropriate accuracy, the hardness is calculated from h on the basis of known indenter geometry. This technique allows the evaluation of the elastic response in the microrange after indenting using the initial slope of the unloading curve, making it more appropriate than traditional methods to study the specific indentation response of materials.Reference Ullner, Beckmann and Morrell20 Several parameters, such as Martens hardness, indentation hardness, hardness according to Vickers and indentation modulus (approximation to the Young’s modulus) can be determined from the indentation curve. Martens hardness21 HM (N/mm2) is defined for every point of the indentation curve as:
 $$<![CDATA[$$ {\rm{HM}} = {F \over {kh^2 }}\quad,$$
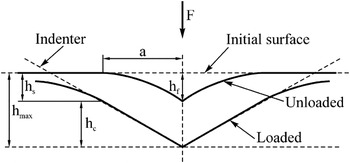
where F (N)—actual loading force, k = 26.43 for Vickers indenter, h (mm)—corresponding indentation depth during loading. Figure 1 shows schematic illustration of the loading and unloading process, with the parameters characterizing the contact geometry.
Schematic illustration of the loading and unloading process, F—test force, h max—maximum indentation depth at F max, h c—depth of the contact of the indenter with the test piece at F max, h s—permanent indentation depth after removal of the test force, h f—depth of the contact.Reference Oliver and Pharr16

Indentation hardness at maximum loading force H IT (N/mm2) isReference Oliver and Pharr16, Reference Oliver and Pharr17:
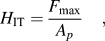 $$<![CDATA[$$H_{{\rm{IT}}} = {{F_{\max } } \over {A_p }}\quad,$$
where Ap = 24.5hc is contact area at maximum load for Vickers indenter. Indentation modulus E IT/(1 − νs 2) (GPa) can be estimated on the relationship basisReference Oliver and Pharr16, Reference Oliver and Pharr17:
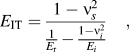 $$<![CDATA[$$ E_{{\rm{IT}}} = {{1 - \nu _s^2 } \over {{1 \over {E_{\rm{r}} }} - {{1 - \nu _i^2 } \over {E_i }}}}\quad,$$
where E r is reduced plane strain modulus, 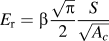 $E_{\rm{r}} = {\rm{\beta }}{{\sqrt {\rm{\pi }} } \over 2}{S \over {\sqrt {A_c } }}$, νs—Poisson’s ratio, S is elastic unloading stiffness,
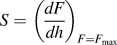 $S = \left( {{{dF} \over {dh}}} \right)_{F = F_{\max } } $, indexes s and i correspond to sample and indenter elastic parameters, respectively (for the diamond indenter: νi = 0.07, Ei = 1140 GPa), β—correction factor related to the lack of symmetry of the indenter (equal to 1.0124 for Vickers indenter), while Ac = 2a 2 is the projected contact area for the Vickers pyramid indenter.
It has to be pointed out that hardness of a material depends on the testing force applied. This phenomenon, known as the indentation size effect (ISE) usually involves a decrease of the measured hardness with increasing applied test force, and it has been reported many times in the past.Reference Lukić, Petrović, Skuban, Šiđanin and Gúth10, Reference Gong and Li22–Reference Quinn, Nguyen, Sanghera, Lloyd, Pureza, Miklos and Aggarwal26 Therefore, within this research we also measured hardness of chalcogenide glass samples in the function of applied test force until the constant value of hardness was reached.
III. EXPERIMENTAL
Glassy samples of Cux[(As2Se3)0.9(AsI3)0.1]100−x type, without copper and with various copper contents were synthesized from high-purity elemental components by fast cooling from the melt, following the procedure described in detail earlier.Reference Lukić, Petrović, Gut and Avramov27 Mechanical properties of chosen representative bulk samples (5, 10, 20, and 25 at.% of Cu) were examined using Fischerscope HM2000 S (Helmut Fischer GmbH, Sindelfingen, Germany) device with Vickers diamond indenter. The instrument was calibrated according to DIN EN ISO 14577-3 standard, using a BK7 type reference block. Indentation load–displacement data was obtained during cycles of loading and unloading. Testing force rate was 0.5 mN/s, whereas maximum loading forces used were in the range of (10–500) mN, for every sample. For these measurements, samples were mounted with epoxy resin, ground and then polished with abrasive powders of different finenesses. Indentation hardness and indentation modulus were automatically calculated and hardness value according to Vickers was obtained directly. We were monitoring the change of these parameters with the copper content, as well as hardness-force dependence.
IV. RESULTS AND DISCUSSION
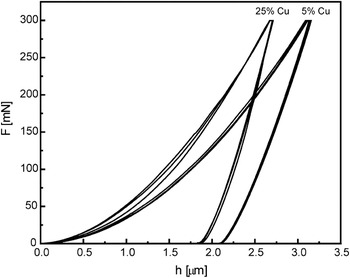
Load–displacement curves of the samples were recorded using maximum loading forces of 10, 20, 40, 60, 80, 100, 200, 300, 400, and 500 mN for every sample. Here we are presenting results obtained with the force of 300 mN, as the mechanical parameters start approaching constant values after the applied force of 100 mN. Typical load–displacement curves, obtained for the samples with minimum and maximum copper content during three cycles of loading and unloading, with maximum loading force of 300 mN, are given in Fig. 2. The load–displacement curves from all the three measurements overlap with each other, indicating a high level of reproducibility. From these experimental curves indentation hardness and indentation modulus were calculated on the basis of Eqs. (2) and (3), respectively, whereas hardness according to Vickers was obtained directly from conversion of H IT. All the parameters were calculated as average values of three measurements.
Typical load–displacement curves, obtained for the samples with 5 and 25 at.% Cu, with maximum loading force of 300 mN.

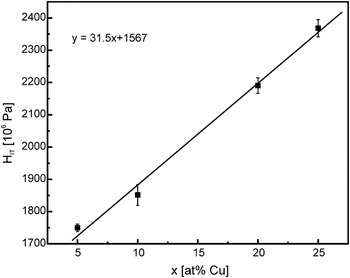
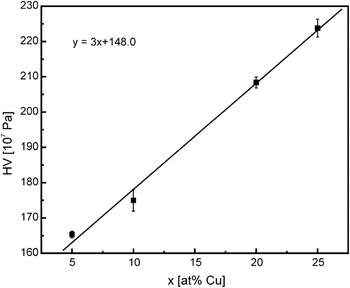
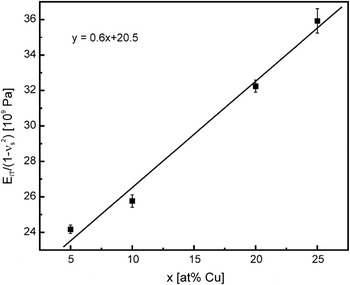
Experimental data enabled us to determine the correlation between investigated mechanical parameters and composition of this chalcogenide material, as well as the force applied. Figures 3, 4, and 5 show the correlation between calculated values of indentation hardness, hardness according to Vickers and indentation modulus, respectively; and copper content, in investigated samples with maximum test force of 300 mN. As shown in these figures, all these mechanical parameters increase linearly with increase of the copper content. Linear fits of these functions are also given, providing the possibility to predict values of mechanical parameters at other concentrations of copper (value x in Figs. 3, 4, and 5), for which the noncrystalline character of the samples is preserved.Reference Lukić and Petrović28, Reference Lukić, Petrović, Petrović and Popović29 It was observed that HV changes within the range of (165.35–223.79) (107 Pa), H IT within (1749.78–2368.1) (N/mm2), whereas E IT/(1 − νs 2) changes within the range of (24.17–35.92) (GPa).
Correlation between indentation hardness and Cu content for maximum loading force of 300 mN.

Correlation between hardness according to Vickers and Cu content for maximum loading force of 300 mN.

Correlation between indentation modulus and Cu content for maximum loading force of 300 mN.

Linear dependence between mechanical parameters and the copper content was observed for each maximum force applied.
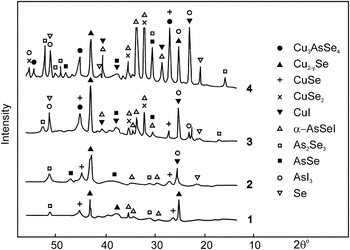
Mechanical properties improvement with the increase of copper content can be explained by the formation of new structural units in As–Se–I glass matrix. This is noticeable in Fig. 6, where x-ray diffraction (XRD) patterns of the samples, recorded at 420 °C, are given.Reference Lukić, Petrović, Petrović and Popović29 This temperature is chosen to demonstrate practically all structural units that exist in these glasses. These units containing copper, such as copper (I) selenoarsenate (Cu3AsSe4), Cu2-ySe (y∼0.15), CuSe, copper selenide (CuSe2), and cuprous iodide (CuI),Reference Lukić, Petrović, Petrović and Popović29 have stronger intermolecular bonds than units without copper.Reference Weast30 XRD spectra in Fig. 6 show that increasing copper content yields a constant increase in the number of different Cu-containing units, therefore increasing the strength of intermolecular bonds within glass matrix. To conclude, it is evident that copper reinforces the glass lattice by binding with arsenic and selenium atoms.
XRD patterns recorded at 420 °C, for Cux[(As2Se3)0.9(AsI3)0.1]100−x samples: (1) x = 5, (2) x = 10, (3) x = 20, (4) x = 25.

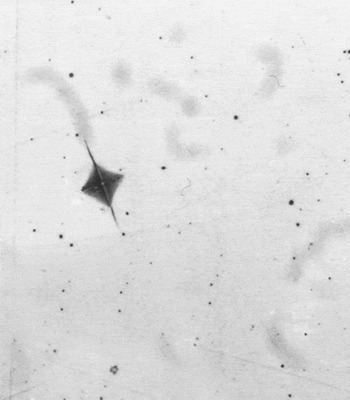
Similar results were obtained in our previous investigations of different chalcogenide glass systems using Vickers direct method.Reference Lukić, Skuban, Petrović and Šiđanin9, Reference Lukić, Petrović, Skuban, Šiđanin and Gúth10 However, when using higher testing forces in these investigations, sometimes cracks or other mechanical effects can appear. This is shown in Fig. 7 where the photograph of the imprint, taken using microscope Metallograph MeF2, Reichert, Austria, is given.Reference Lukić and Petrović31
Photograph of the imprint, Vickers direct method, the sample with 15 at.% Cu, applied load 30 g.

Figure 7 shows the existence of specific cracks that occur in the extension of the diagonals, when applying the load of ∼300 mN on the sample with 15 at.% of Cu. Usually, these effects may question reproducibility of the measurements using classic methods. This disadvantage is overcome using indentation method for mechanical properties characterization.
Calculated values of indentation modulus are about two times higher than those reported earlier for some binary (Ge-As) and ternary (Ge-As-Se) chalcogenide glasses.Reference Bourhis, Gadaud, Guin, Tournerie, Zhang, Lucas and Rouxel32–Reference Guin, Rouxel, Sangleboeuf, Melscoët and Lucas34
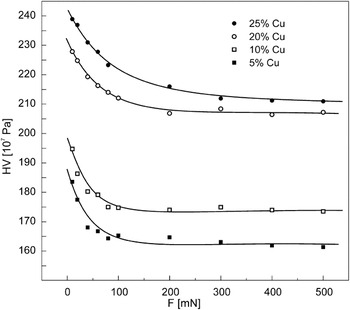
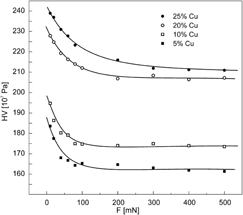
Figure 8 presents the hardness according to Vickers as the function of the test force applied. For each given sample composition hardness value decreases significantly with the increase of test force for lower loads, whereas it becomes constant or decreases slightly with the increase of test force for higher loads. According to some authors,Reference Li and Brad35, Reference Quinn and Quinn36 this transition is due to the change of mechanical behavior from deformation-dominant and load-dependent to load-independent, which is characterized by constant hardness after critical force is applied.
Hardness according to Vickers versus the applied test force for glassy samples with different copper content.

V. CONCLUSIONS
Indentation hardness, hardness value according to Vickers and indentation modulus of Cux[(As2Se3)0.9(AsI3)0.1]100−x glasses with x = 5, 10, 20, and 25 at.% were calculated from the indentation load–displacement curves. We determined linear increase of these parameters with the increase of copper content in samples, which is due to the fact that copper reinforces the glass lattice by binding with arsenic and selenium atoms and forms new structural units such as Cu3AsSe4, Cu2−ySe (y ∼ 0.15), CuSe, CuSe2, and CuI. Hardness according to Vickers measured as the function of the test force applied showed ISE and load-dependent behavior for lower loads, as well as load-independent behavior and constant hardness for high loads, after critical force is applied.
ACKNOWLEDGMENT
Authors acknowledge the financial support of the Ministry of Education and Science of the Republic of Serbia within the Project No. 171022.