1 Introduction
Since Kramer’s early work (Kramer Reference Kramer1932), it has been a well-established fact that an airfoil experiencing a sudden increase in its effective angle of attack, beyond the stall region, will induce an overshoot in its lift force coefficient. The so-called Kramer effect is then of major importance in aeronautics for both the study of wind gust effects (Donely Reference Donely1950) and rapid manoeuvrability issues (Herbst Reference Herbst1983).
Unsteady aerodynamics due to rapid pitch motion is also of great importance in insect and bird flight studies. The flying insects pitch their wings rapidly at the ends of each stroke, so-called wing reversals, to augment the lift (Dickinson Reference Dickinson1999; Shyy et al. Reference Shyy, Lian, Tang, Viieru and Liu2007). When birds perch towards a tree or in landing, they require high lift to maintain the right altitude and high drag to reduce velocity swiftly (Videler, Stamhuis & Povel Reference Videler, Stamhuis and Povel2004). To this end, the birds quickly pitch their wings up to a high angle of attack (Ol, Eldredge & Wang Reference Ol, Eldredge and Wang2009; Reich, Wojnar & Albertani Reference Reich, Wojnar and Albertani2009).
Aerodynamic issues due to quick and large pitch motion (or deformation) and high-turbulence gust-mitigation are also relevant in the bio-inspired aerodynamic community for the design of new types of fixed or flapping wing unmanned air vehicles (UAVs). Experimental studies of the perching of small fixed-wing UAVs can be found in Cory & Tedrake (Reference Cory and Tedrake2008) and Desbiens, Asbeck & Cutkosky (Reference Desbiens, Asbeck and Cutkosky2010). In both studies, a better mastering of the unsteady aerodynamics in rapid pitch-up remains an important issue for the improvement of appropriate control laws. Flapping wing micro air vehicles (FWMAVs) are also emerging to perform missions, including surveillance, communications, monitoring and detection (Shyy et al. Reference Shyy, Aono, Chimakurthi, Trizila, Kang, Cesnik and Liu2010; Terutsuki et al. Reference Terutsuki, Deng, Crossley and Kohtake2015; Ramezani, Chung & Hutchinson Reference Ramezani, Chung and Hutchinson2017). They mimic the biological fliers to enhance manoeuvrability and improve aerodynamic efficiency (Guerrero et al. Reference Guerrero, Pacioselli, Pralits, Negrello, Silvestri, Lucifredi and Bottaro2016). In that context, the canonical problem of pitch ramp motion is worth investigation.
The early experimental work of Kramer (Reference Kramer1932) concerned wings of aspect ratio 5 undergoing a ‘quick’ change of the wind angle of attack (up to
 $30^{\circ }$
) with almost constant angular speed. He showed that the maximum lift coefficient increases in proportion to a non-dimensional rate of change of the wind angle of attack, the so-called reduced pitch rate, defined as
 $K_{p}=\dot{\unicode[STIX]{x1D6FC}}c/2U$
(where
 $\dot{\unicode[STIX]{x1D6FC}}$
is the pitch rate,
 $c$
is the chord and
 $U$
is the mean flow velocity), up to a value close to 0.016. Those results were further confirmed by Farren (Reference Farren1935) on two-dimensional (2D) airfoils whose angle of attack was increasing and decreasing rapidly. A summary of those results can be found in Fung (Reference Fung2002), highlighting a simple law
 $\unicode[STIX]{x0394}C_{L\,max}=43.4\times K_{p}$
for
 $0.001<K_{p}<0.016$
, where
 $\unicode[STIX]{x0394}C_{L\,max}$
is the increase of the maximum lift coefficient over the stationary value. The effect of the pitch rate on the lift of a small aeroplane model was also studied in a wind tunnel by Harper & Flanigan (Reference Harper and Flanigan1950). At low Mach number, close to 0.1, the rate of increase of the maximum lift coefficient with the reduced pitch rate was found to be close to 62 up to
 $K_{p}\approx 0.016$
. Beyond this value, the maximum lift coefficient did not increase further with
 $K_{p}$
. The Kramer effect was also found to be significantly reduced when increasing the Mach number.
Because the problem of dynamic stall can affect the performance of helicopter blades, numerous studies have been carried out on 2D airfoils forced in harmonic or constant-pitch-rate motion through the stall region; see, for example, McCroskey (Reference McCroskey1981) and Lorber & Carta (Reference Lorber and Carta1988). Those studies have revealed that two mechanisms can be responsible for the lift overshoot – namely, the delay of the onset of flow separation, and the generation of a leading edge vortex that grows and travels along the airfoil.
The leading edge vortex (LEV) mechanism during high-amplitude pitch ramp motion was further highlighted by Helin & Walker (Reference Helin and Walker1985) and Walker, Helin & Strickland (Reference Walker, Helin and Strickland1985). They performed flow visualization on a NACA 0015 airfoil, pitching from
 $0^{\circ }$
to
 $60^{\circ }$
for various reduced pitch rates
 $K_{p}=0.1$
, 0.2, 0.3 and pivot axis locations
 $x_{p}=0.25,0.5,0.75$
at Reynolds number
 $Re=45\,000$
. The LEV was observed to evolve from a separation bubble at
 $\unicode[STIX]{x1D6FC}=20^{\circ }$
for
 $K_{p}=0.1$
and to broaden until its diameter was on the order of the semichord. Finally, the LEV moved away from the suction surface at approximately
 $40^{\circ }$
. The initiation of the LEV was delayed with increasing pitch rate, meanwhile, both the time during which the vortex remained close to the airfoil and the strength of the vortex increased. The initiation of the LEV was also delayed when the pivot axis moved rearwards, although the flow signature was remarkably similar. They suggested that the maximum lift occurred when the LEV was well developed and still relatively close to the surface.
Strickland & Graham (Reference Strickland and Graham1987) performed similar studies on a NACA 0015 airfoil, extending the maximum pitch angle to
 $90^{\circ }$
, the reduced pitch rate up to 0.99, and including measurements of the unsteady lift and drag coefficients. They also proposed a phenomenological algebraic relation to account for the evolution of both the lift and drag coefficients with the angle of attack.
Recently the canonical problem of a flat plate undergoing pitch ramp motion has received a great deal of attention. A review of several experimental and numerical results regarding the flow field and lift coefficient for 2D flat plates with 2 %–3 % thickness-to-chord ratio, round trailing and leading edges, experiencing a linear pitch ramp, hold and return, of
 $40^{\circ }$
and
 $45^{\circ }$
amplitude respectively, has been published by Ol et al. (Reference Ol, Altman, Eldredge, Garmann and Lian2010). Again, the LEV was found to impact the lift coefficient and to depend on both the reduced frequency and pivot point location. Based on the good agreement between several experimental and numerical results, Ol et al. (Reference Ol, Altman, Eldredge, Garmann and Lian2010) also assessed that the effect of the Reynolds number on the flow-field evolution and lift coefficient should be weak in the range of several hundreds up to 40 000.
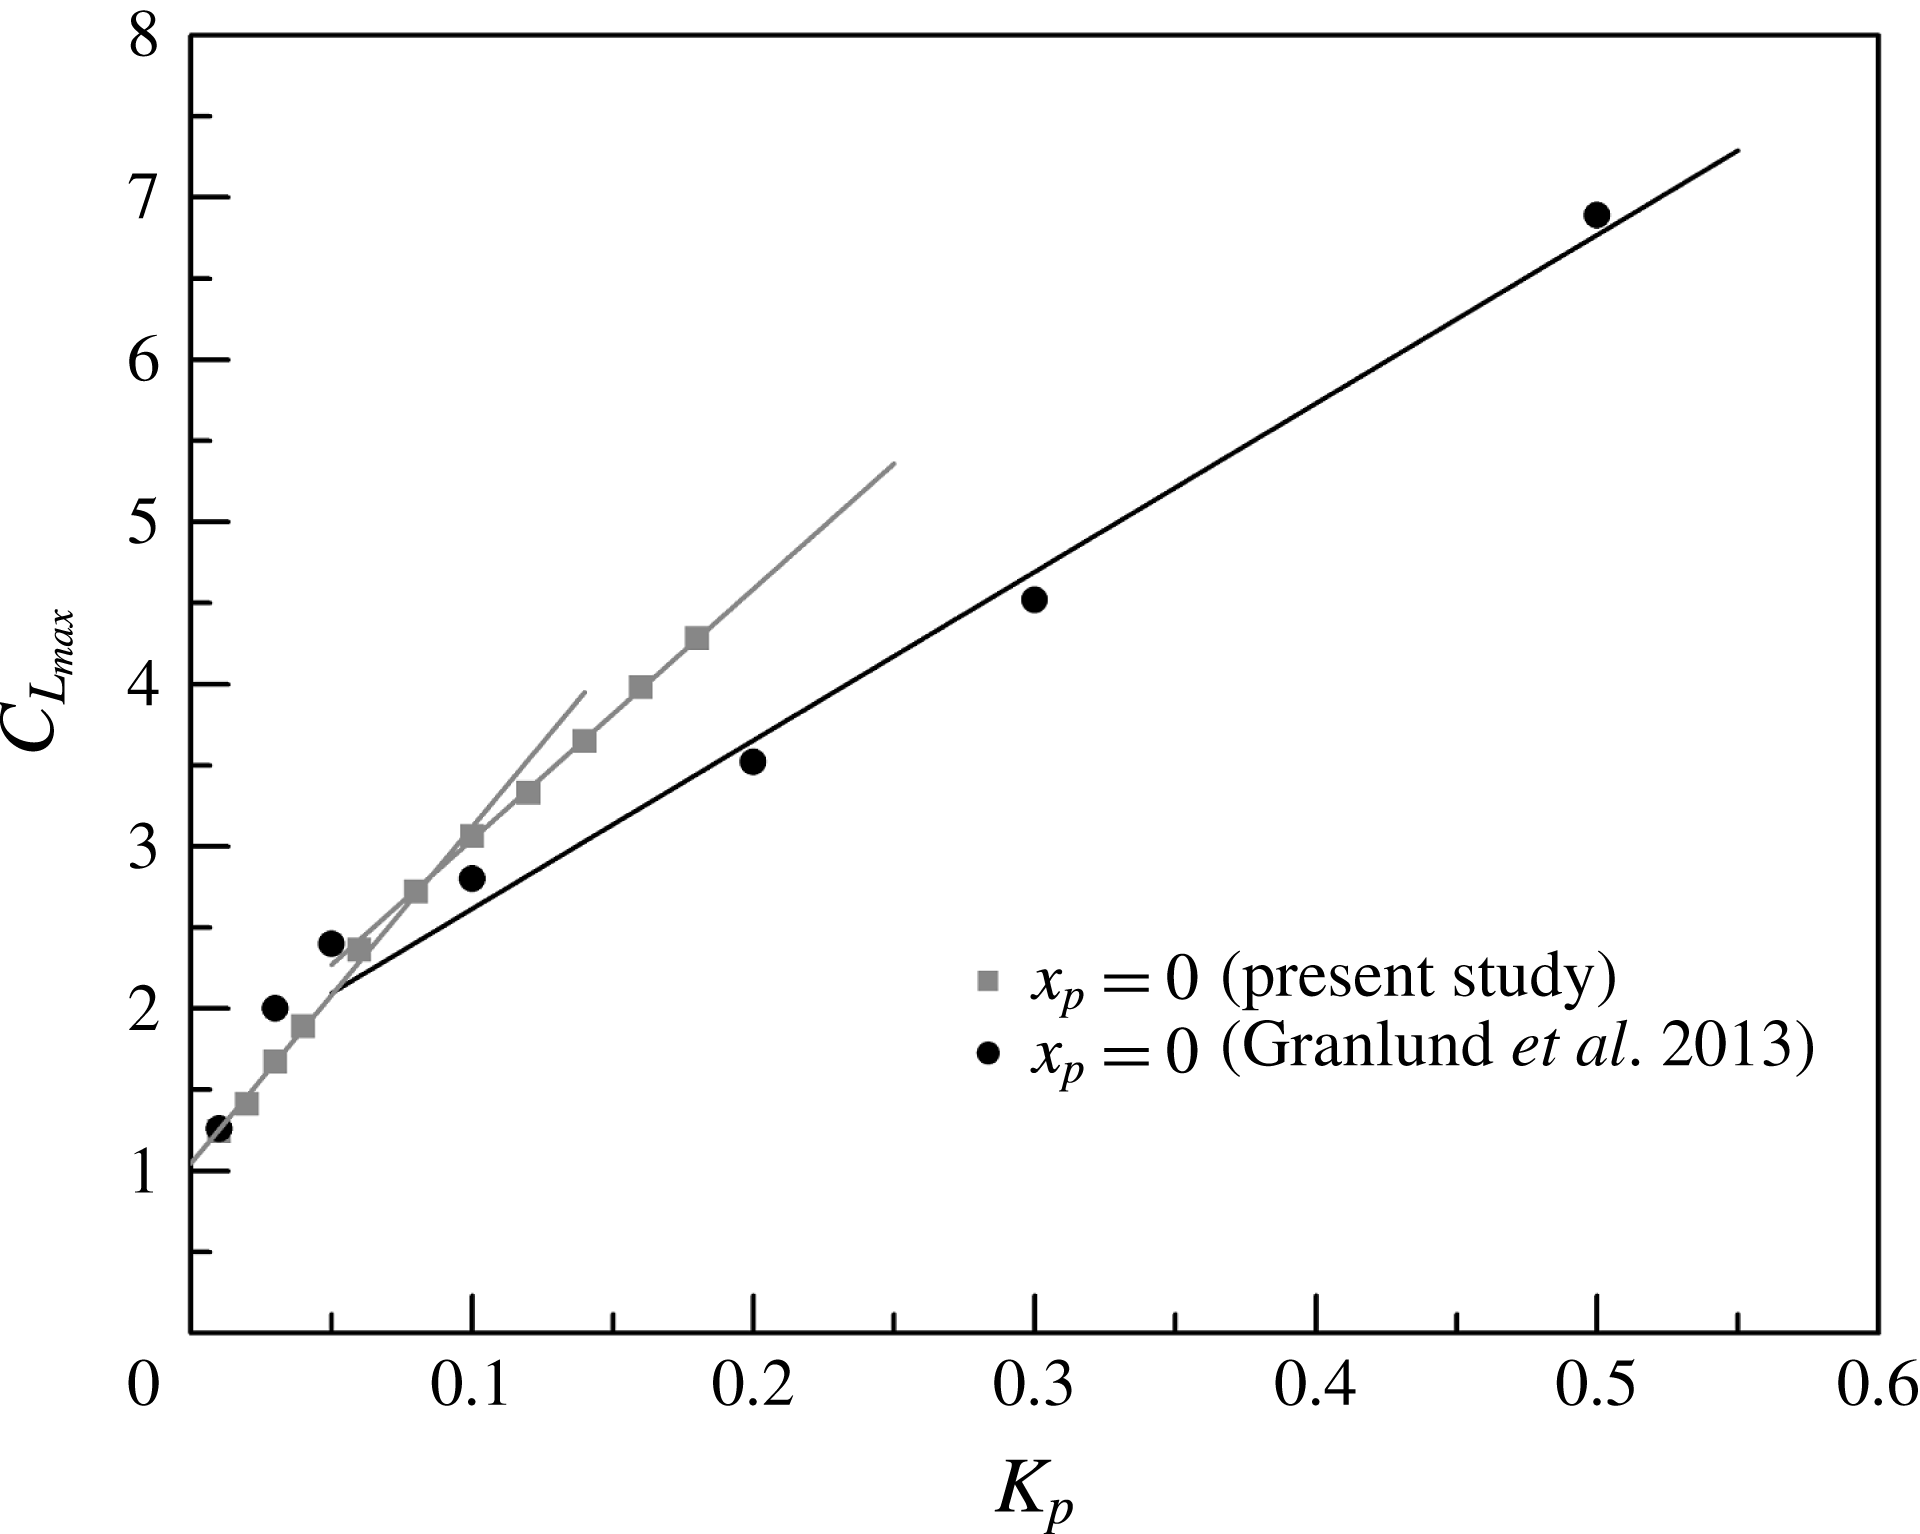
Quantitative measurements of the aerodynamic lift and drag, along with qualitative flow visualization, were also carried out in a water tunnel by Granlund and co-authors. Granlund et al. (Reference Granlund, Ol, Garmann, Visbal and Bernal2010) investigated the effect of linear pitch ramp motions with and without a deceleration in the free-stream direction. They showed that the free-stream deceleration had little effect on the aerodynamic coefficient history except towards the end of pitch. They concluded that the tests of perching can be adequately conducted in a steady free stream. Granlund, Ol & Bernal (Reference Granlund, Ol and Bernal2011a ) extended the results obtained on 2D flat plates to rectangular and elliptical plates of aspect ratio 2, at reduced frequency up to 2.0. They showed that the low-aspect-ratio plates behaved qualitatively the same as the 2D plate. Thus, they speculated that the pitch rate effect dominates and attenuates the dependency on airfoil geometry. They also validated that the non-circulatory forces and circulatory forces are linearly additive. Based on these experiments, Granlund, Ol & Bernal (Reference Granlund, Ol and Bernal2013) generalized the semiempirical model proposed by Strickland & Graham (Reference Strickland and Graham1987) to include the effects of pivot axis location.
Aerodynamic forces and particle image velocimetry (PIV) measurements were also reported by Yu & Bernal (Reference Yu and Bernal2013) for a flat plate with an effective aspect ratio of 4, performing a
 $0^{\circ }$
–
 $45^{\circ }$
pitch ramp and hold motion at reduced frequencies up to 0.39 and different pivot point locations. PIV measurements showed that the formation of a starting vortex at the leading edge can be responsible for the delay in development of the LEV and inhibiting the impact of the LEV on aerodynamic forces when the pivot point moves from the leading to the trailing edge. Yu & Bernal (Reference Yu and Bernal2013) also highlighted 3D effects. They reported that the LEV was significantly smaller at the outboard span location for low reduced frequency 0.065, while the spanwise variations were small at higher reduced frequency.
The effects of aspect ratio, leading edge geometry and wing shape were recently highlighted in Son et al. (Reference Son, Cetiner, Stevens, Babinsky, Manar, Mancini, Jones, Ol and Gozukara2016). This paper summarizes several experimental and numerical works on flat-plate wings experiencing pitch-up motion from
 $0^{\circ }$
to
 $45^{\circ }$
around their leading edge pivot points, at Reynolds numbers of 10 000 and 20 000. The force coefficients were found to increase with increasing aspect ratio, while the effect of edge geometry was minor. Regarding the wing shape, similar behaviour in both aerodynamics and flow field were observed for rectangular, Zimmerman and elliptic planforms, while the flat plate with triangular shape differed from the others.
Several unsteady aerodynamics models can be found in the literature, regarding the problem of airfoil pitching at low or high amplitude, in harmonic or transient ramp motion. In aeronautics they can be classified into two categories, depending on whether the flow is separated or not. For problems that do not rely on flow separation, a linear formulation of the motion-induced lift and moment have been formulated by Theodorsen (Reference Theodorsen1935). An equivalent time-dependent formulation can also be written using the Wagner indicial function (Fung Reference Fung2002).
Unsteady aerodynamic models have also been developed and validated for airfoils operating around the stall region when a dynamic stall process occurs. Among them, the dynamic stall models proposed by Tran & Petot (Reference Tran and Petot1980) and Leishman & Beddoes (Reference Leishman and Beddoes1989) are probably the most efficient in capturing the complex unsteady nonlinear behaviour involving both the dynamic stall delay and the impact of the leading edge vortex.
A large variety of unsteady aerodynamic models can also be found in the aerodynamic community involving insect, bird or UAV flight. For the specific case of flapping flight, reviews can be found in Mueller (Reference Mueller2001), Ansari, Żbikowski & Knowles (Reference Ansari, Żbikowski and Knowles2006), Shyy et al. (Reference Shyy, Aono, Chimakurthi, Trizila, Kang, Cesnik and Liu2010) and Taha, Hajj & Nayfeh (Reference Taha, Hajj and Nayfeh2012). Focusing on the low-order model formulations, there have been some attempts to better capture the wing rotation effect. Sane & Dickinson (Reference Sane and Dickinson2002) proposed a revised quasi-static formulation introducing a rotational force coefficient which was identified for reduced frequencies up to 0.19 and different pivot point locations.
In order to better capture the impact of the leading edge vortex along with the lag associated with unsteadiness, Taha et al. (Reference Taha, Hajj and Nayfeh2012) proposed an interesting formulation of the lift coefficient in response to high-amplitude pitch motion. Assuming that the lift response to an increment in effective angle of attack (or any equivalent circulation term) can still be predicted beyond the stall region using the Wagner function, they used an extension of the classical Duhamel formulation including a time-dependent forcing term weighted by the steady lift coefficient curve. A low-order model has also been proposed by Babinsky et al. (Reference Babinsky, Stevens, Jones, Bernal and Ol2016). Following the work of Ford & Babinsky (Reference Ford and Babinsky2013), this model is based on the formulation of the circulatory lift as the summation of a vortex advection term (proportional to the LEV circulation and relative velocity) and a vortex growth term (proportional to the growth of the circulation of the LEV and the relative distance between the leading and trailing edge vortex). Experimental validations can be found in Stevens & Babinsky (Reference Stevens and Babinsky2017). Using a modified Wagner formulation of the circulation (taking into account the effective angle of attack), simple LEV relative advection velocity and position deduced from experiment, they obtained a relative good agreement with the measured lift force on a flat plate which pitched from
 $0^{\circ }$
to
 $45^{\circ }$
at a high reduced pitch rate 0.392, for a pivot point location at the leading edge. But an overestimation of the lift force was observed for the case with the pivot point at the mid-chord.
In that context, the aim of this paper is to provide new experimental results regarding the unsteady aerodynamic coefficients of a flat plate undergoing high-amplitude pitch ramp motion, in air, at moderate Reynolds number. Our objective is also to validate a simple time-dependent model that can be used to predict the normal force and moment coefficients for flapping flight exhibiting rapid pitch motion.
The paper is organized as follows. The experimental set-up and measurement methods are presented in § 2. Experimental results are reported in § 3, highlighting the effect of reduced pitch rate, tip vortex (2D versus 3D configuration), pivot axis location and maximum angle of attack on the unsteady lift, drag and moment coefficients in response to smoothed pitch ramp motion. In § 4, three time-dependent models are presented for both the normal force and moment coefficients. They are compared with the experimental results in § 5. The first model is a simple extension of the classical unsteady linear aerodynamic formulation for transient motion in a constant or time-varying flow velocity. The second model is close to the one proposed by Taha, Hajj & Beran (Reference Taha, Hajj and Beran2014) for which the steady lift curve is used, in addition to a linear induced-camber term, to build a forcing circulation term. The last model includes an additional circulation term which depends on the pitch rate.
2 Experimental apparatus
The experiments were performed in a subsonic, closed-circuit wind tunnel at LadHyX. The test section was 0.26 m in width and 0.24 m in height. Tests have been done at a mean flow velocity
 $U\approx 6.5~\text{m}~\text{s}^{-1}$
, i.e. Reynolds number
 $Re=Uc/\unicode[STIX]{x1D708}\approx 1.45\times 10^{4}$
, where
 $\unicode[STIX]{x1D708}$
is the kinematic viscosity of the air, for which the non-uniformity in the test section is less than 1 % and the turbulence level is close to 1.2 %. This flow velocity value was chosen to produce a sufficient dynamic pressure level to ensure reliable unsteady aerodynamic force measurements, while allowing the set-up to reach a reduced pitch rate up to 0.18. The flat-plate model was a carbon-fibre plate of chord
 $c=0.035~\text{m}$
, which was less than 15 % of the height of the test section in order to limit blockage effects at high angles of attack. Its thickness-to-chord ratio was 4.86 % and its physical aspect ratio was
 $AR_{phys}=3.94$
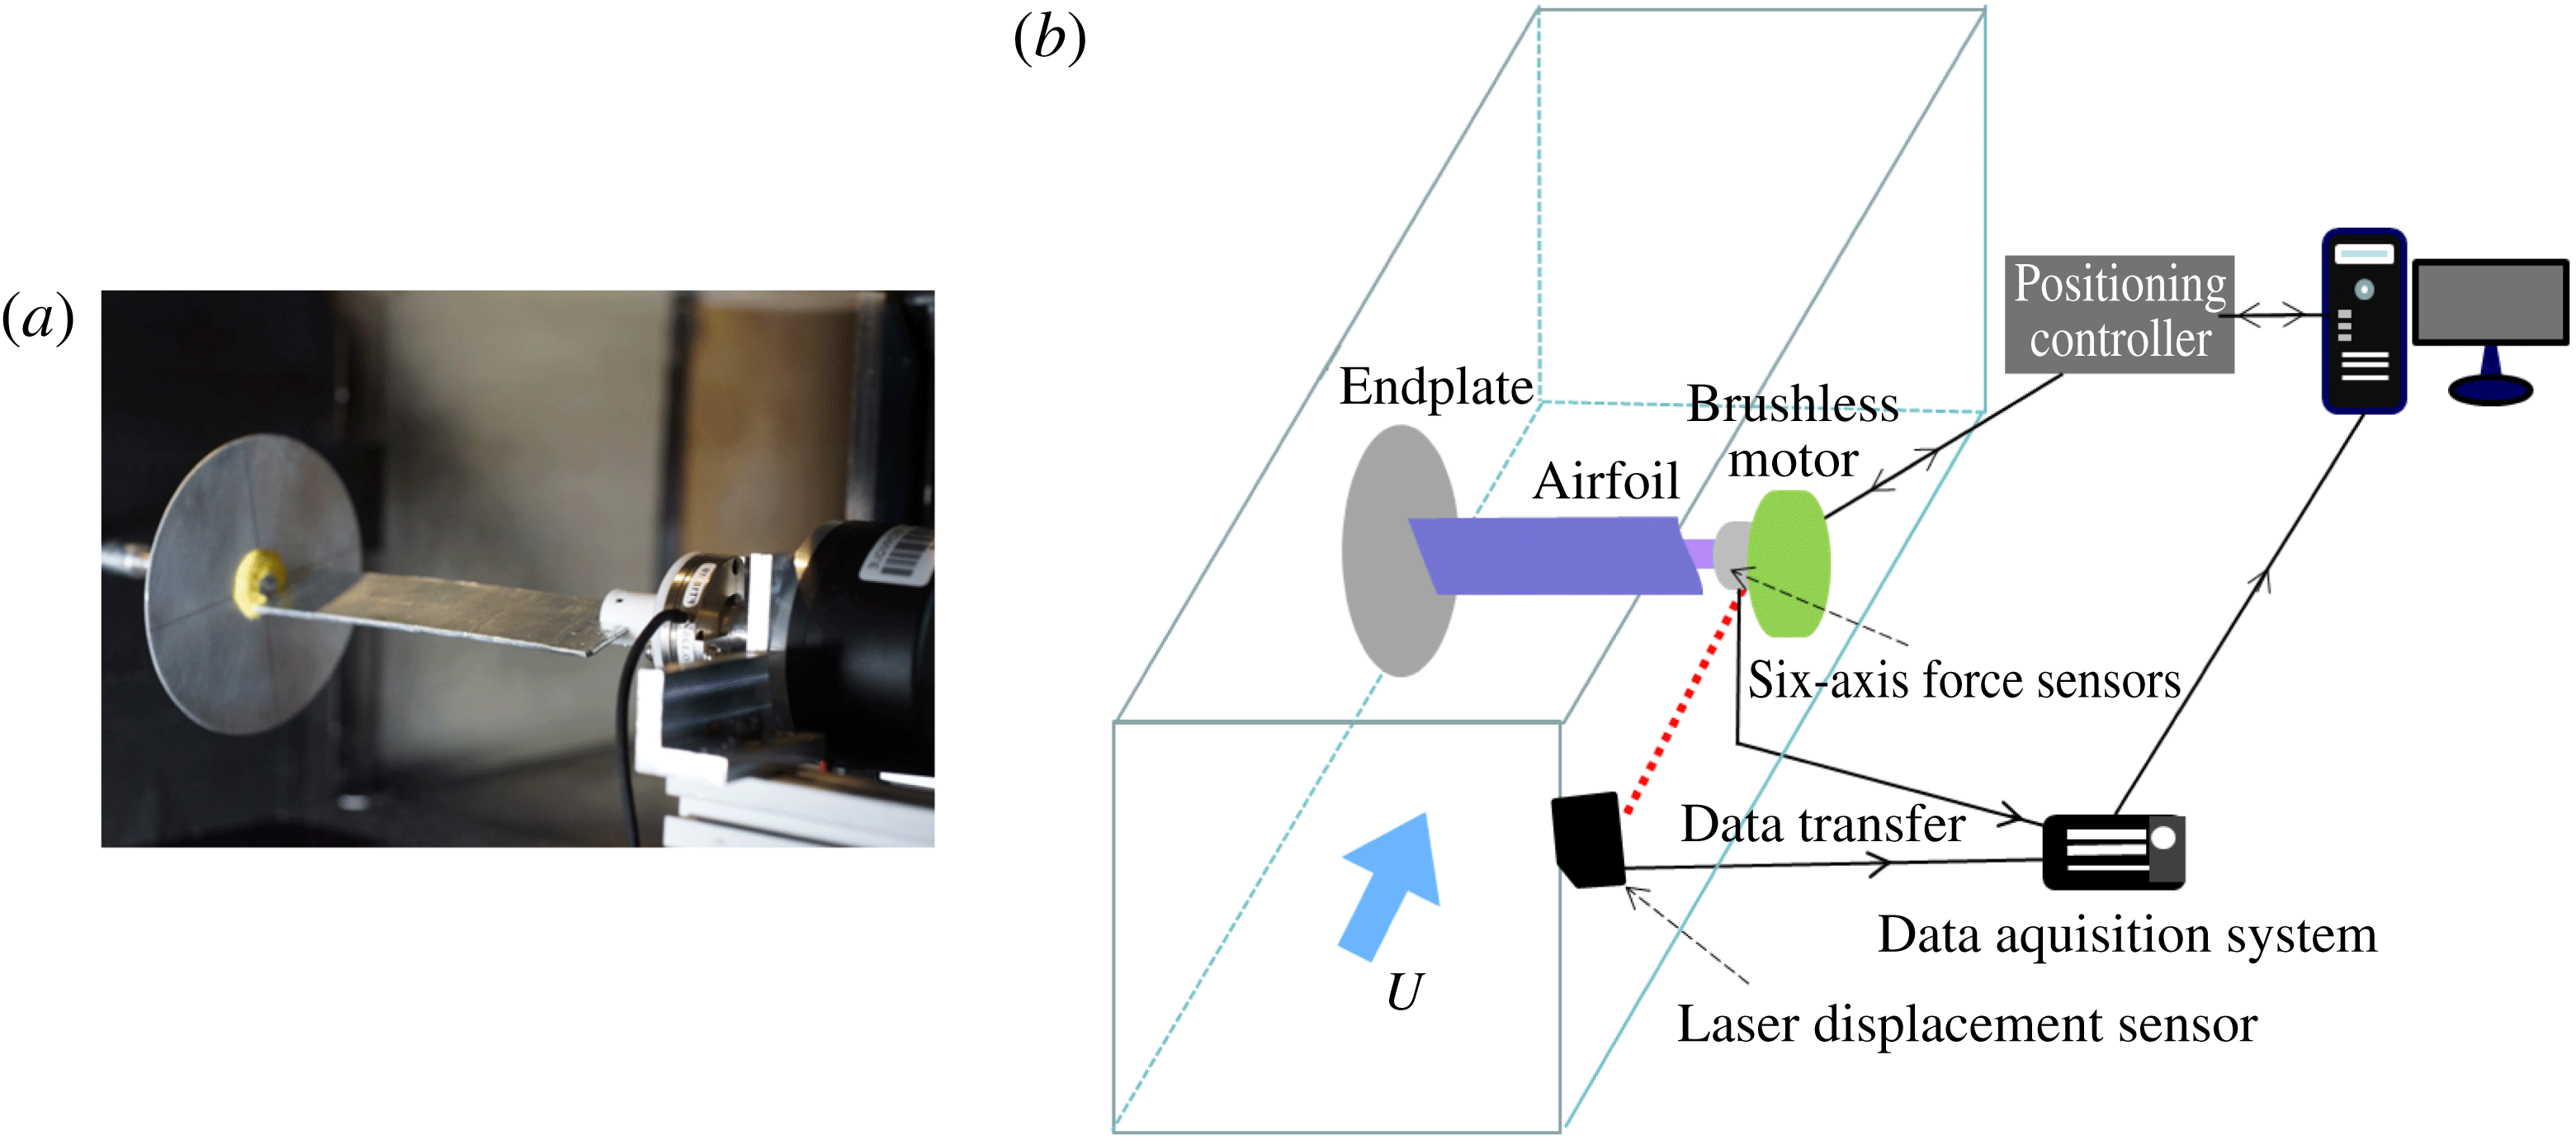
. The leading and trailing edges were kept sharp to limit any Reynolds number effects. The model, directly driven by the motor, was mounted horizontally in the test section with a small gap from the wall at one end (see figure 1). Since the span of the model was lower than the span of the wind tunnel, an end plate was located at the other extremity of the flat plate for the so-called 2D configuration. The end plate was removed in the 3D configuration, leaving a gap between the tip of the model and the wall close to 3.5 times the chord of the model. The wall at the root of the model provides a plane of symmetry for the flow, and the 3D configuration is a flat plate of effective aspect ratio
 $AR=2AR_{\text{phys}}=7.88$
.
(a) View of the experimental set-up. (b) Schematic diagram of the set-up.

The model was driven by a brushless motor (Maxon flat motor EC 60, 100 W). The motor was controlled by a digital positioning controller (EPOS2
 $24/5$
) with proportional/integral/derivative (PID) feedback position control and feed-forward compensation to generate additional current for high accelerations. The integrated digital encoder provided accurate evaluation of angle position with a
 $0.088^{\circ }$
resolution.
According to previous studies, the major parameter governing the unsteady aerodynamic response of an airfoil undergoing pitch ramp motion is the reduced pitch rate. Ideally, such studies should then be carried out using an airfoil model moving from low (most of time zero) to high angle of attack at a constant pitch rate. Experimentally, such a sharp ramp motion is impossible because of the finite acceleration and deceleration imposed by the driving system. The impact of the smoothing of the pitch ramp motion has been studied by Koochesfahani & Smiljanovski (Reference Koochesfahani and Smiljanovski1993) and Granlund et al. (Reference Granlund, Ol and Bernal2013). Based on the analysis of the flow evolution, Koochesfahani & Smiljanovski (Reference Koochesfahani and Smiljanovski1993) conclude that the dynamics of the unsteady stall process is not affected by the acceleration and deceleration profile, at least up to a ratio
 $T_{a}/T_{c}=0.6$
(which was the maximum ratio tested), where
 $T_{a}$
is the period of constant acceleration and
 $T_{c}$
is the ideal constant-pitch-rate period. Granlund et al. (Reference Granlund, Ol and Bernal2013) employed a revised hyperbolic-cosine function to realize a smoothed constant-pitch-rate kinematic in a water tunnel:
 $$\begin{eqnarray}\displaystyle & \displaystyle \unicode[STIX]{x1D6FC}(t)=\frac{2\unicode[STIX]{x1D6FC}_{max}(1-\unicode[STIX]{x1D70E})}{\unicode[STIX]{x03C0}^{2}}\ln \left[{\displaystyle \frac{\cosh \left({\displaystyle \frac{\unicode[STIX]{x03C0}^{2}K_{p}}{4\unicode[STIX]{x1D6FC}_{max}(1-\unicode[STIX]{x1D70E})}}(t^{\ast }-t_{1}^{\ast })\right)}{\cosh \left({\displaystyle \frac{\unicode[STIX]{x03C0}^{2}K_{p}}{4\unicode[STIX]{x1D6FC}_{max}(1-\unicode[STIX]{x1D70E})}}\left(t^{\ast }-t_{1}^{\ast }-{\displaystyle \frac{\unicode[STIX]{x1D6FC}_{max}}{K_{p}}}\right)\right)}}\right]+{\displaystyle \frac{\unicode[STIX]{x1D6FC}_{max}}{2}}, & \displaystyle\end{eqnarray}$$
where
 $\unicode[STIX]{x1D6FC}_{max}$
is the maximum angle,
 $t^{\ast }$
is the reduced time given by
 $t^{\ast }=2Ut/c$
,
 $t_{1}^{\ast }$
is the sharp ramp corner start point,
 $\unicode[STIX]{x1D6FC}_{max}/K_{p}$
is the ideal constant-pitch-rate period, i.e. the reduced time between the sharp ramp corner start and end, and
 $\unicode[STIX]{x1D70E}$
is the smoothing parameter. Varying the smoothing parameter from 0.9 down to 0.5, they showed that smoothing the ramp motion only affects the non-circulatory response, i.e. the initial lift and final drag increment due to the acceleration effects.
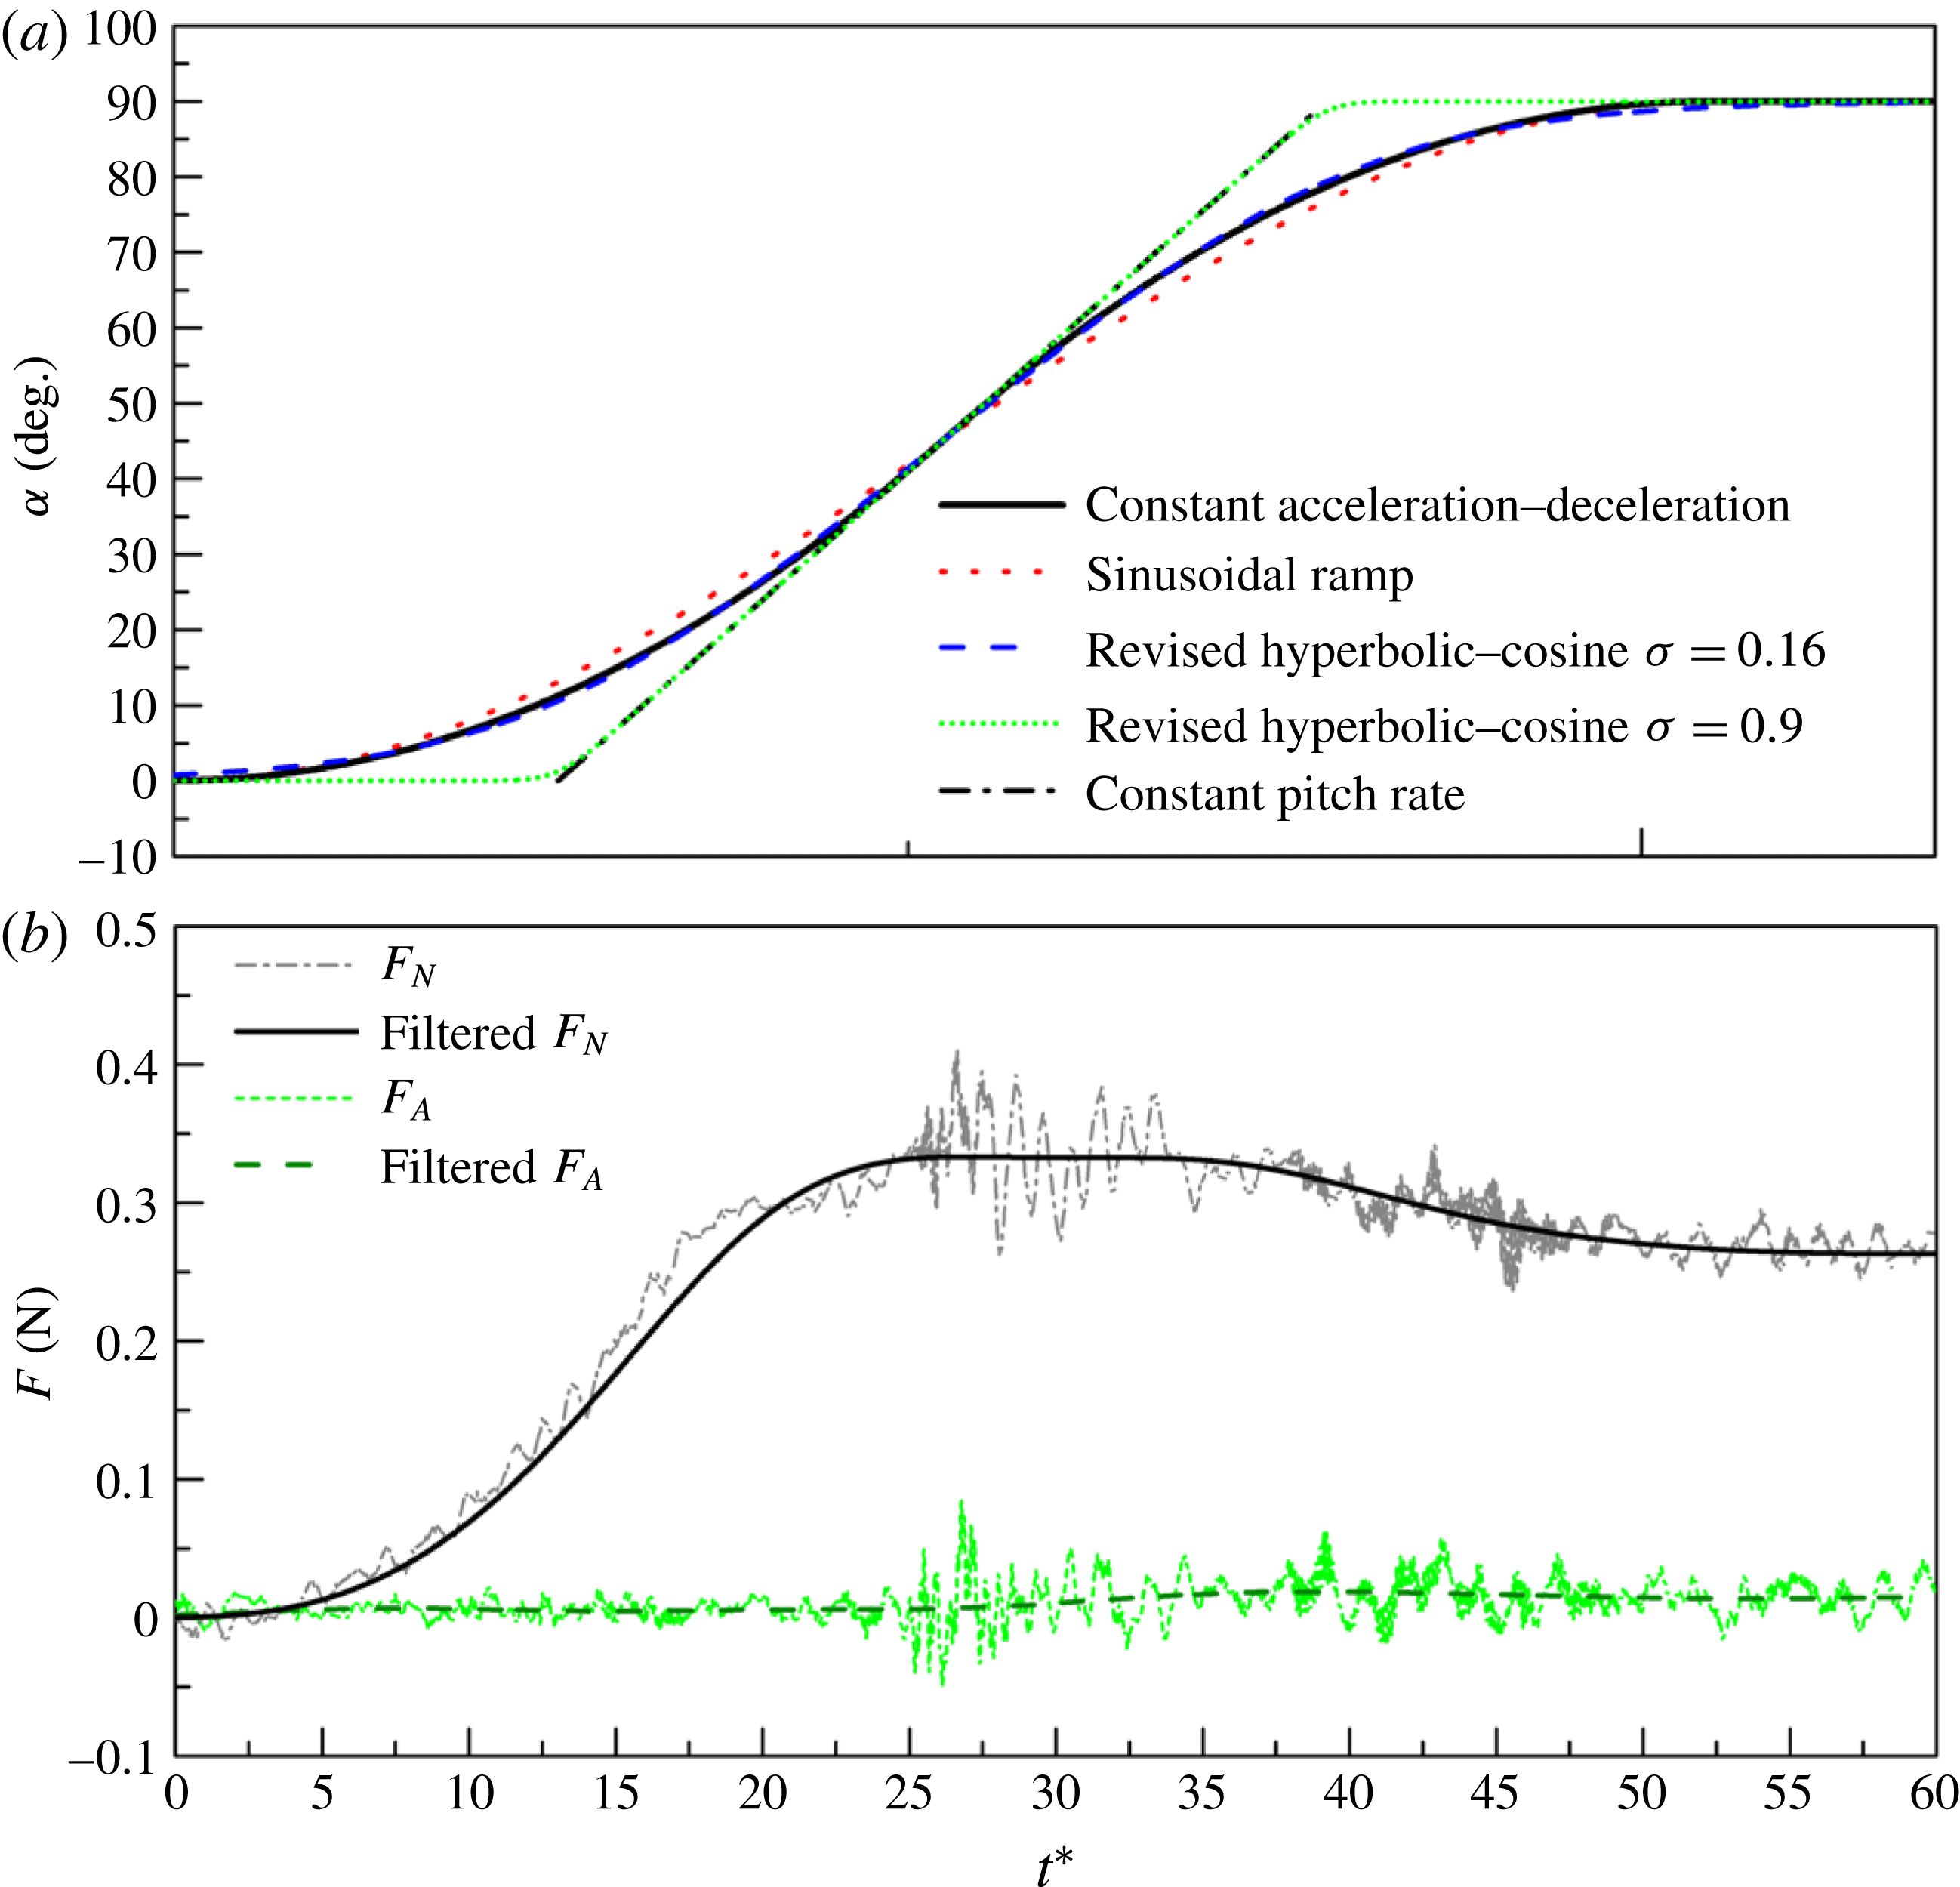
(a) Comparison of the measured constant acceleration–deceleration pitch ramp motion with the revised hyperbolic-cosine function, sinusoidal ramp and constant-pitch-rate ramp for reduced frequency
 $K=0.06$
,
 $\unicode[STIX]{x1D6FC}_{max}=90^{\circ }$
and
 $x_{p}=0.5$
. (b) Corresponding normal and axial forces before and after the filtering process.

In the present study, a two-stage acceleration–deceleration profile has been chosen to drive the flat-plate model from zero to the final angle of attack
 $\unicode[STIX]{x1D6FC}_{max}$
. It consists of a constant acceleration
 $\ddot{\unicode[STIX]{x1D6FC}}$
to reach half of the maximum pitch angle, followed by its symmetrical deceleration
 $-\ddot{\unicode[STIX]{x1D6FC}}$
during the same period. The kinematic is depicted by
 $$\begin{eqnarray}\displaystyle & \displaystyle \unicode[STIX]{x1D6FC}(t)=\left\{\begin{array}{@{}l@{}}{\displaystyle \frac{1}{2}}\ddot{\unicode[STIX]{x1D6FC}}t^{2}\quad \left(t<{\displaystyle \frac{\unicode[STIX]{x0394}t}{2}}\right)\\ 2\sqrt{\ddot{\unicode[STIX]{x1D6FC}}\times \unicode[STIX]{x1D6FC}_{max}}\times t-\unicode[STIX]{x1D6FC}_{max}-{\displaystyle \frac{1}{2}}\ddot{\unicode[STIX]{x1D6FC}}t^{2}\quad \left({\displaystyle \frac{\unicode[STIX]{x0394}t}{2}}<t<\unicode[STIX]{x0394}t\right)\\ \unicode[STIX]{x1D6FC}_{max}\quad (t>\unicode[STIX]{x0394}t),\end{array}\right. & \displaystyle\end{eqnarray}$$
where the characteristic duration of the pitch motion is defined by
 $$\begin{eqnarray}\displaystyle & \displaystyle \unicode[STIX]{x0394}t=2\sqrt{{\displaystyle \frac{\unicode[STIX]{x1D6FC}_{max}}{\ddot{\unicode[STIX]{x1D6FC}}}}}. & \displaystyle\end{eqnarray}$$
This kinematic can be approximated by a sinusoidal wavefunction,
 $$\begin{eqnarray}\displaystyle & \displaystyle \unicode[STIX]{x1D6FC}_{c}={\displaystyle \frac{\unicode[STIX]{x1D6FC}_{max}}{2}}[1-\cos (2\unicode[STIX]{x03C0}ft)], & \displaystyle\end{eqnarray}$$
where
 $f$
is a characteristic frequency defined as
 $$\begin{eqnarray}\displaystyle & \displaystyle f={\displaystyle \frac{1}{2\unicode[STIX]{x0394}t}}. & \displaystyle\end{eqnarray}$$
Therefore, an associated reduced frequency
 $K$
can be defined as
 $$\begin{eqnarray}\displaystyle & \displaystyle K={\displaystyle \frac{\unicode[STIX]{x1D714}c}{2U}}={\displaystyle \frac{\unicode[STIX]{x03C0}c\dot{\unicode[STIX]{x1D6FC}}_{max}}{4U\unicode[STIX]{x1D6FC}_{max}}}, & \displaystyle\end{eqnarray}$$
where
 $\unicode[STIX]{x1D714}=2\unicode[STIX]{x03C0}f$
is the angular frequency, and the maximum pitch rate is given by
 $$\begin{eqnarray}\displaystyle & \displaystyle \dot{\unicode[STIX]{x1D6FC}}_{max}=\sqrt{\ddot{\unicode[STIX]{x1D6FC}}\times \unicode[STIX]{x1D6FC}_{max}}. & \displaystyle\end{eqnarray}$$
The measured constant acceleration–deceleration pitch profile for
 $K=0.06$
and
 $\unicode[STIX]{x1D6FC}_{max}=90^{\circ }$
is reported in figure 2(a) along with: its corresponding characteristic sinusoidal ramp; the ideal constant-pitch-rate profile and the hyperbolic-cosine function profile for two values of smoothing parameter
 $\unicode[STIX]{x1D70E}=0.9$
and 0.16. The measured profile is continuous and the maximum pitch rate is reached in the middle of the pitch. Figure 2(a) also shows that the revised hyperbolic-cosine function fits well with the constant acceleration–deceleration kinematic for a smoothing parameter
 $\unicode[STIX]{x1D70E}=0.16$
and a reduced pitch rate
 $K_{p}=0.06$
defined as
 $$\begin{eqnarray}\displaystyle & \displaystyle K_{p}=\dot{\unicode[STIX]{x1D6FC}}_{max}c/2U, & \displaystyle\end{eqnarray}$$
where
 $\dot{\unicode[STIX]{x1D6FC}}_{max}$
is the maximum pitch rate in (2.7), which is reached at the crossing with the ideal constant-pitch-rate profile. This was confirmed for all the reduced pitch rates that have been tested in the present study.
Combining (2.6) and (2.8), the relationship between the reduced frequency and reduced pitch rate is derived:
 $$\begin{eqnarray}\displaystyle & \displaystyle K_{p}={\displaystyle \frac{K\,\unicode[STIX]{x1D6FC}_{max}}{\unicode[STIX]{x03C0}/2}}. & \displaystyle\end{eqnarray}$$
In particular, for
 $\unicode[STIX]{x1D6FC}_{max}=\unicode[STIX]{x03C0}/2$
, the reduced frequency is equal to the reduced pitch rate.
Unsteady forces were measured by a six-axis force/torque sensor (ATI Nano43) mounted between the motor and the model (see figure 1). A 24-bit data acquisition system furnished by Muller-BBM was used to receive the analog transducer signals and convert them to force and moment using the calibration matrix provided by ATI. A laser displacement sensor (Keyence LB-11W) was also used to detect the trigger of the pitch, and the signal was recorded synchronously by the data acquisition system. Accordingly, the force was mapped to the pitch angle measured by the integrated encoder of the motor. The unsteady forces were recorded at a sampling rate of 51.2 kHz and the motor pitch angle was recorded at a sampling rate larger than 80 times that of the characteristic frequency of the pitching motion given by (2.5).
Dynamic tare subtraction and low-pass filtering process were performed in data processing. Dynamic tare subtraction was done to remove the unfortunate static and dynamic inertia contributions associated with the experimental set-up. The force and torque measured at
 $U=0$
were systematically subtracted from the total force and torque which were measured at the same pitch kinematic as the free stream. This dynamic tare subtraction procedure is also supposed to remove the non-circulatory parts of the unsteady aerodynamic loadings, i.e. the added mass and inertia due to air acceleration around the model. However, as pointed out by Granlund et al. (Reference Granlund, Ol and Bernal2013), non-circulatory effects are rather low for a reduced pitch rate
 $K_{p}<0.2$
.
A low-pass filtering process was also applied to remove the effect of the structural vibration of the set-up on the unsteady aerodynamic loads. Type I Chebyshev low-pass filtering with a
 $-20~\text{dB}$
attenuation was performed using a pass band frequency of 7
 $f$
and a stop band frequency of
 $7f+1.5f$
, where
 $f$
is the characteristic frequency of pitch motion defined in (2.5). The same low-pass filter was applied to the measured pitch angle to maintain the same time shift. The responses of the normal and axial force to a constant acceleration–deceleration pitch ramp motion from
 $0^{\circ }$
to
 $90^{\circ }$
around the mid-chord pivot point for a reduced frequency
 $K=0.06$
are reported in figure 2(b), including the signals both before and after the filtering process. It clearly shows that the structural frequency noise is filtered successfully while the pitch ramp motion-induced responses are preserved. One can also notice that the axial force is marginal compared to the normal force.
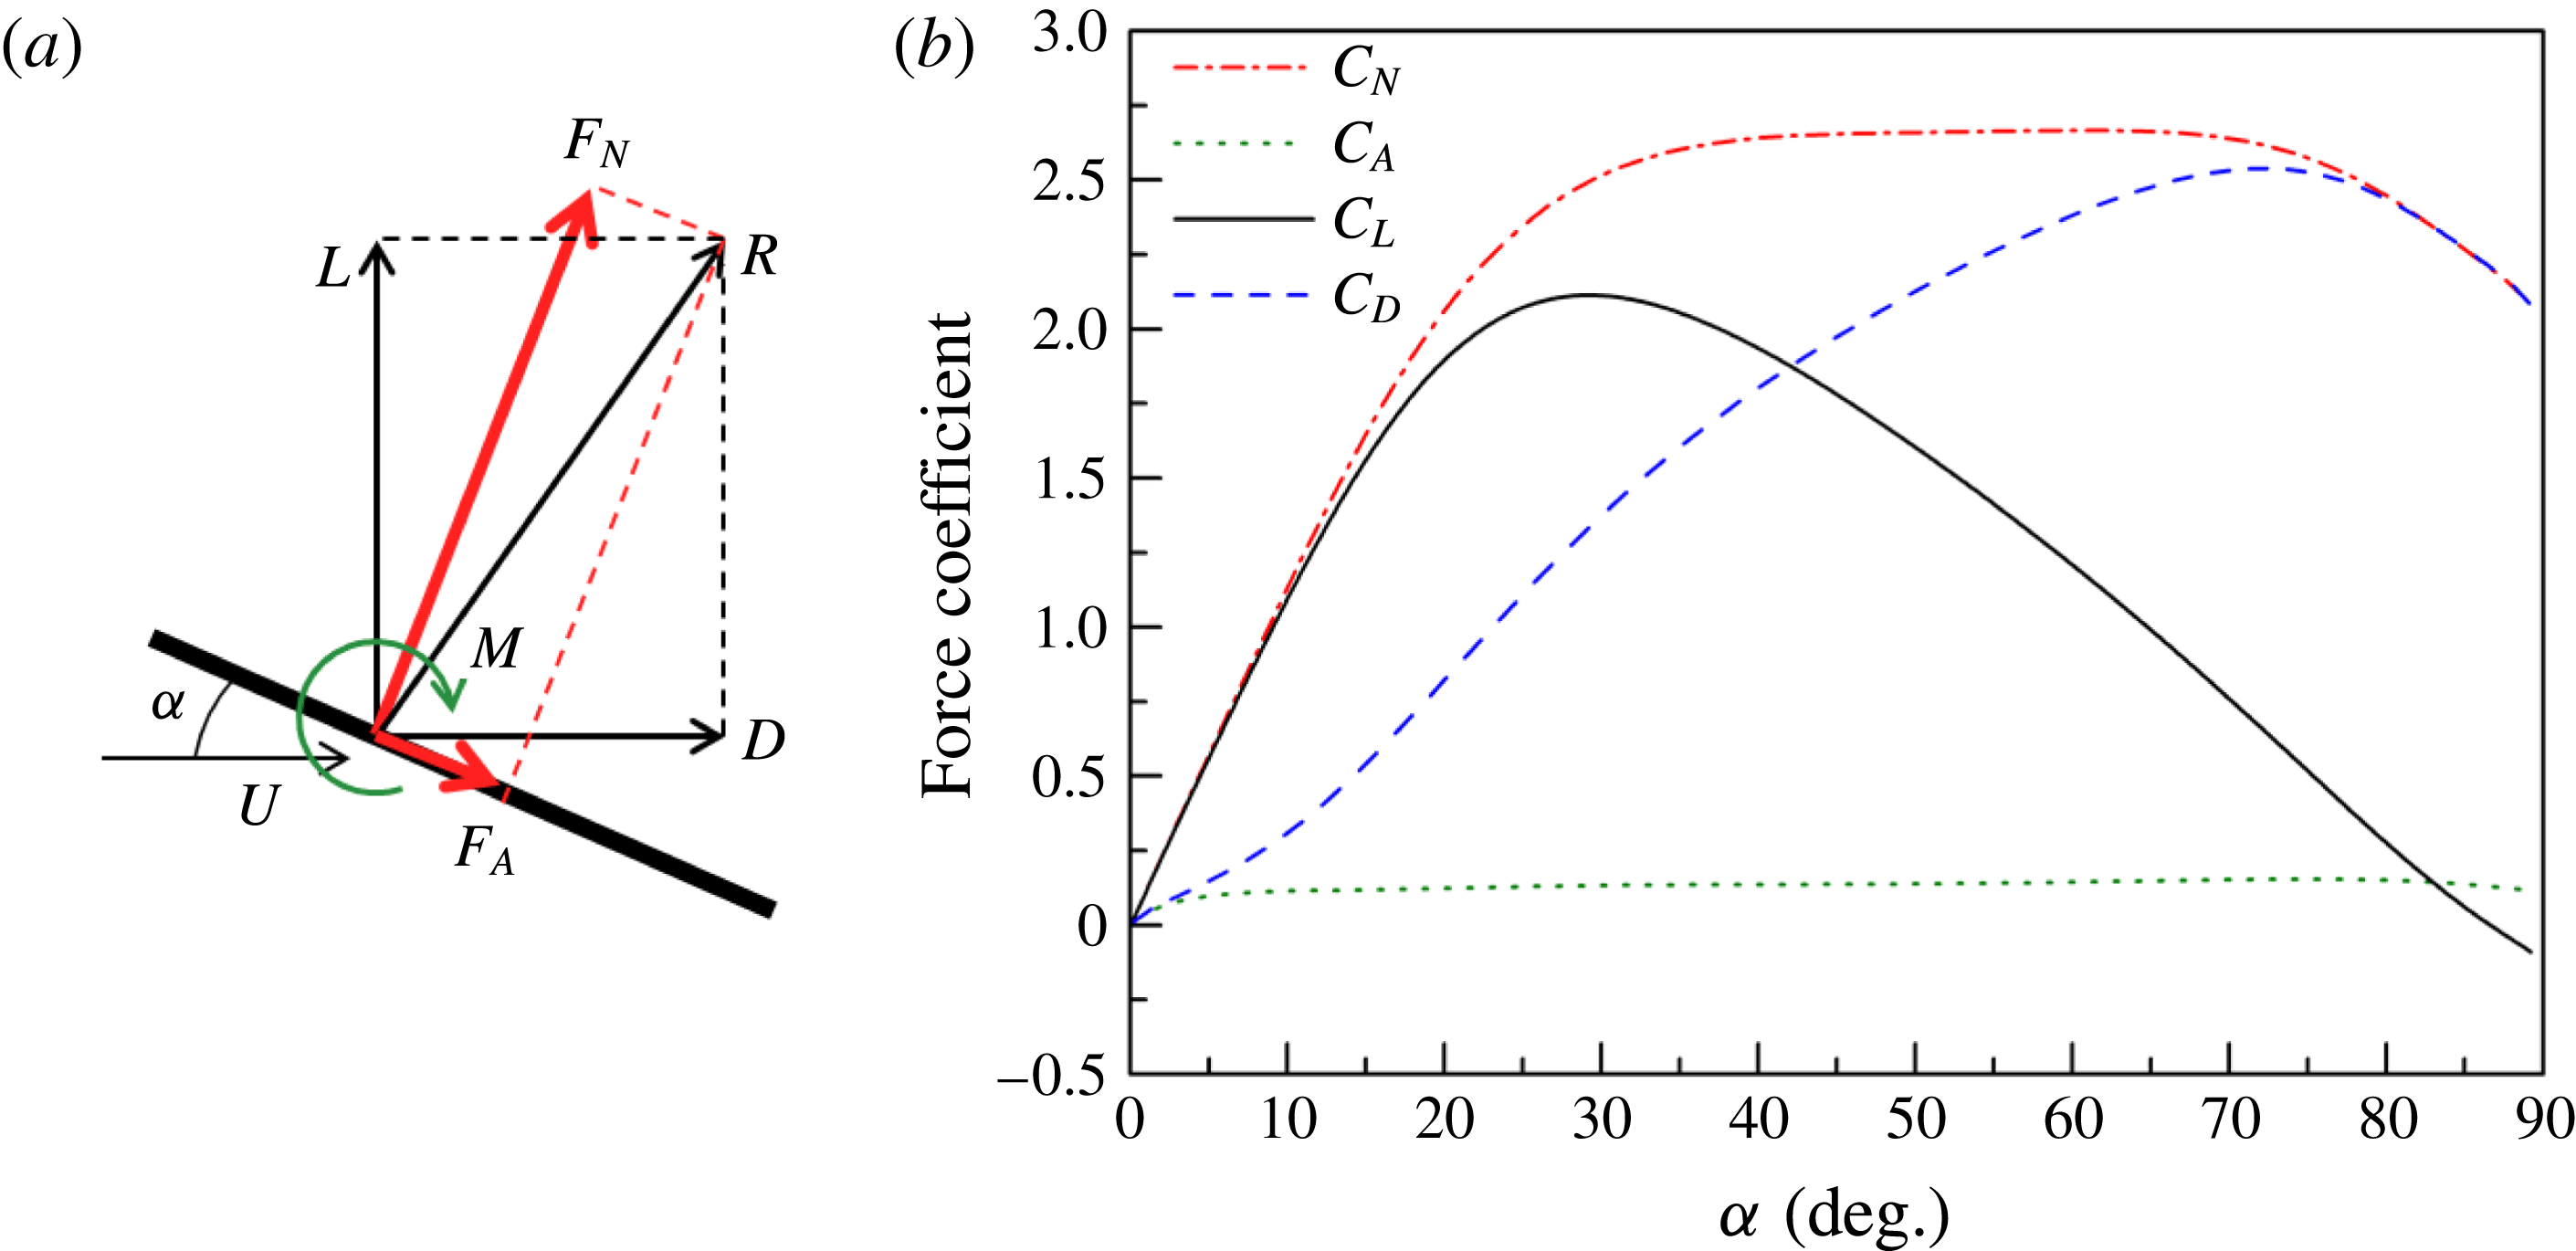
(a) Definition of the aerodynamic forces and pitching moment. (b) Measured normal and axial force coefficients and their associated lift and drag coefficient versus angle of attack for
 $K_{p}=0.06$
,
 $\unicode[STIX]{x1D6FC}_{max}=90^{\circ }$
and
 $x_{p}=0.5$
.

Figure 3(a) recalls the definition of the aerodynamic forces and pitching moment that will be used in the paper. The resultant aerodynamic force
 $R$
is a combination of a normal force
 $F_{N}$
and an axial force
 $F_{A}$
which are directly measured by the sensor. The lift
 $L$
and drag
 $D$
forces can then be calculated by
 $$\begin{eqnarray}\displaystyle & \displaystyle L=F_{N}\text{cos}\unicode[STIX]{x1D6FC}-F_{A}\text{sin}\unicode[STIX]{x1D6FC}, & \displaystyle\end{eqnarray}$$
 $$\begin{eqnarray}\displaystyle & \displaystyle D=F_{N}\text{sin}\unicode[STIX]{x1D6FC}+F_{A}\text{cos}\unicode[STIX]{x1D6FC}. & \displaystyle\end{eqnarray}$$
The pitching moment
 $M$
is also directly measured by the sensor about the pivot point position.
The associated aerodynamic forces and moment are defined by
 $$\begin{eqnarray}\displaystyle & \displaystyle C_{N}={\displaystyle \frac{F_{N}}{1/2\unicode[STIX]{x1D70C}U^{2}AR_{phys}c^{2}}},\quad C_{A}={\displaystyle \frac{F_{A}}{1/2\unicode[STIX]{x1D70C}U^{2}AR_{phys}c^{2}}}, & \displaystyle\end{eqnarray}$$
 $$\begin{eqnarray}\displaystyle & \displaystyle C_{L}={\displaystyle \frac{L}{1/2\unicode[STIX]{x1D70C}U^{2}AR_{phys}c^{2}}},\quad C_{D}={\displaystyle \frac{D}{1/2\unicode[STIX]{x1D70C}U^{2}AR_{phys}c^{2}}}, & \displaystyle\end{eqnarray}$$
 $$\begin{eqnarray}\displaystyle & \displaystyle C_{M}={\displaystyle \frac{M}{1/2\unicode[STIX]{x1D70C}U^{2}AR_{phys}c^{3}}}. & \displaystyle\end{eqnarray}$$
The force coefficients versus angle of attack are plotted in figure 3(b) for
 $K_{p}=0.06$
,
 $x_{p}=0.5$
and
 $\unicode[STIX]{x1D6FC}_{max}=90^{\circ }$
, i.e. for the pitch ramp motion depicted in figure 2. One can notice that the unsteady aerodynamic response is mainly due to pressure effects. The normal force coefficient first increases, reaches a ‘plateau’ for
 $30^{\circ }<\unicode[STIX]{x1D6FC}<70^{\circ }$
, and then slightly decreases to recover a value of
 $C_{N}\approx 2$
, which is a standard value for a flat plate normal to the flow direction. Due to the normal force projection, the associated lift and drag coefficients clearly exhibit a maximum at an angle of attack close to
 $28^{\circ }$
for the lift and
 $73^{\circ }$
for the drag.
Experimental results reported in § 3 focus on the lift and drag forces, along with the pitching moment, in order to highlight the effects of the pitch rate on maximum lift, drag and moment and their associated angles of attack.
3 Experimental results and discussion
3.1 Steady aerodynamic results
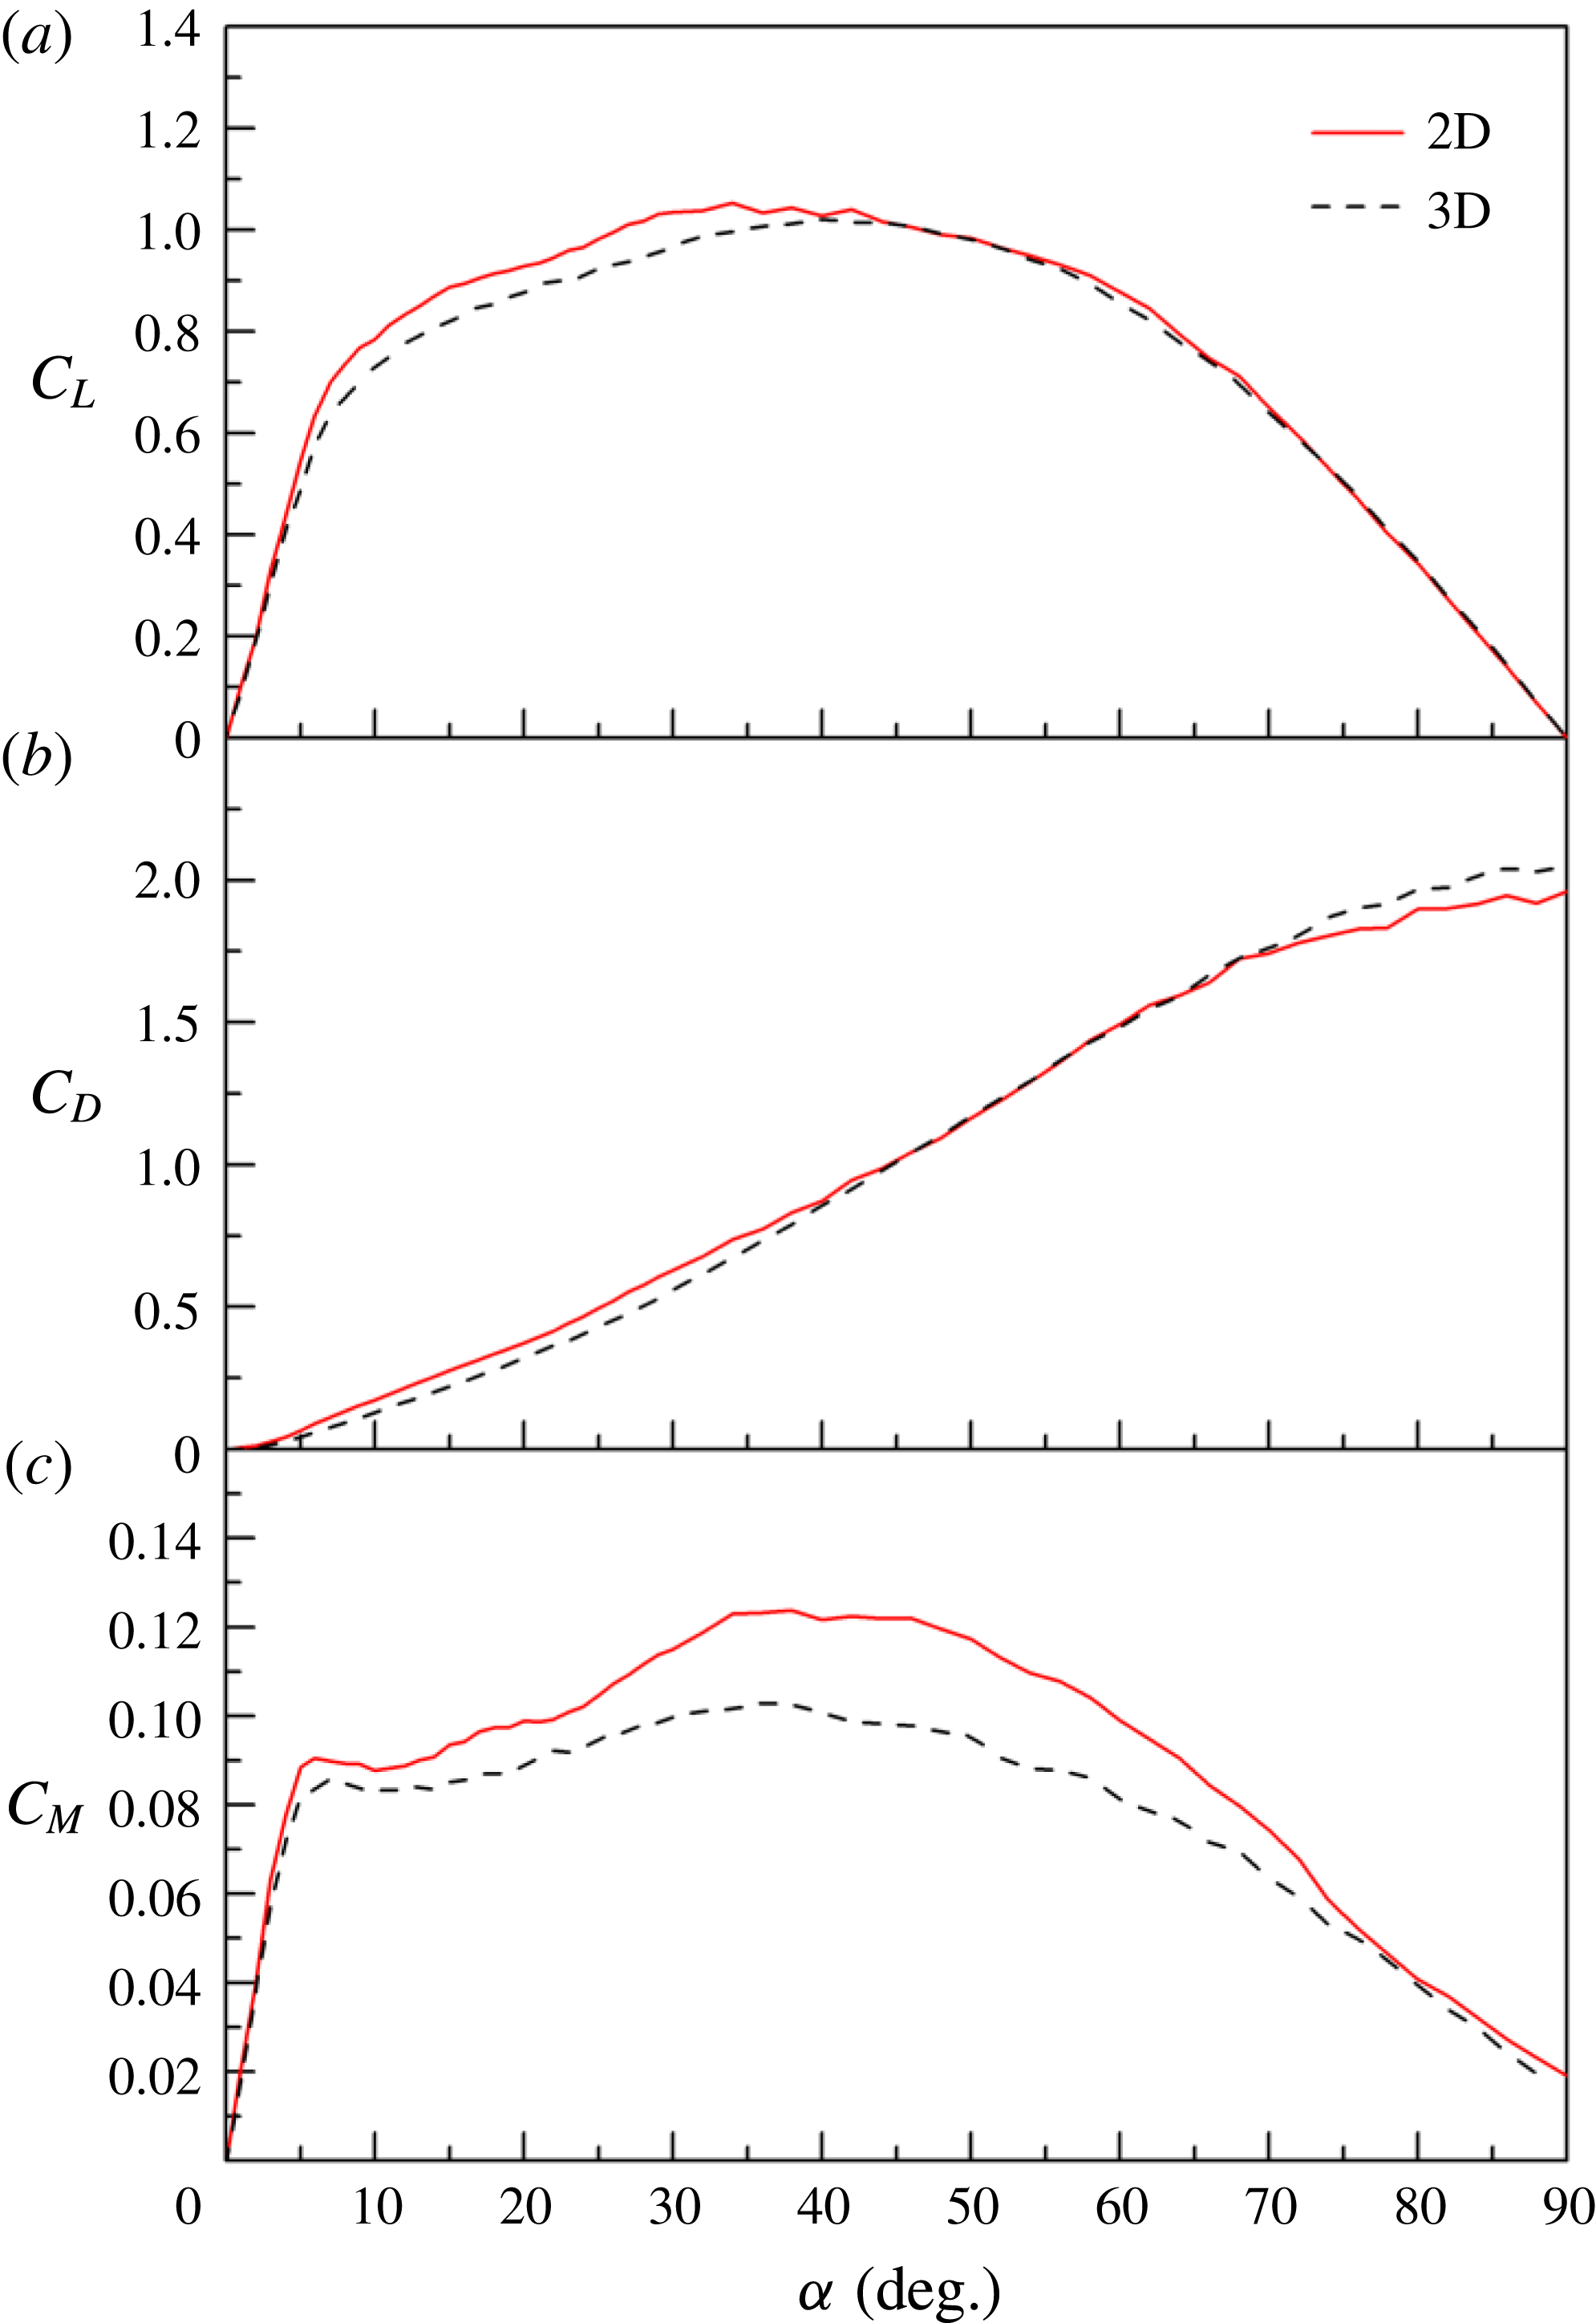
In situ measurements of the steady lift, drag and moment coefficients of the flat-plate model were performed using the ATI Nano43 sensor, prior to the dynamic tests. Results are reported in figure 4 for angles of attack ranging from
 $0^{\circ }$
up to
 $90^{\circ }$
, Reynolds number
 $Re=1.45\times 10^{4}$
and for both the 2D and 3D (effective aspect ratio 7.88) configurations. Each point results from the average of 10 s of the force sensor signals, acquired at a sampling frequency of 1024 Hz, for a fixed angle of attack position. The pitching moment coefficients reported in figure 4(c) are defined about the mid-chord.
Evolution of steady lift (a), drag (b) and moment coefficients (c) with the angle of attack in 2D and 3D (effective aspect ratio 7.88) configurations; flat-plate model of thickness-to-chord ratio 4.86 % at
 $Re=1.45\times 10^{4}$
; the moment is measured about the mid-chord.

Figure 4(a) shows that the 2D model exhibits a short linear region for
 $\unicode[STIX]{x1D6FC}\leqslant 5^{\circ }$
, characterized by a slope
 $\text{d}C_{L}/\text{d}\unicode[STIX]{x1D6FC}\approx 6.2$
, which is consistent with the thin-airfoil theory (Anderson Jr Reference Anderson2010). This linear region is followed by a smooth stall behaviour for which the lift smoothly moves away from the linear evolution with neither a local maximum nor a decreasing region before
 $\unicode[STIX]{x1D6FC}\approx 35^{\circ }$
. The stall is more noticeable regarding the pitching moment about the mid-chord, for which a local maximum can be found for
 $\unicode[STIX]{x1D6FC}\approx 7^{\circ }$
.
Smooth stall behaviour at low angle of attack is well known for thin airfoils and is due to the underlying mechanism of flow separation. At low angle of attack the flow is characterized by a leading edge laminar separation bubble whose length increases gradually with the angle of attack until it completely separates from the upper surface (Wick Reference Wick1954; Gault Reference Gault1957).
The 3D model exhibits a linear lift coefficient slope
 $\text{d}C_{L}/\text{d}\unicode[STIX]{x1D6FC}\approx 5.5$
slightly lower than that in 2D, but higher than the one calculated using the theoretical solution for the finite wing of a general planform (Anderson Jr Reference Anderson2010).
 $$\begin{eqnarray}\displaystyle & \displaystyle {\displaystyle \frac{\text{d}C_{L}}{\text{d}\unicode[STIX]{x1D6FC}}}={\displaystyle \frac{a_{0}}{1+\left({\displaystyle \frac{a_{0}}{\unicode[STIX]{x03C0}\,AR}}\right)(1+\unicode[STIX]{x1D70F})}}. & \displaystyle\end{eqnarray}$$
Taking the effective aspect ratio
 $AR=7.88$
,
 $\unicode[STIX]{x1D70F}=0.05$
and
 $a_{0}=2\unicode[STIX]{x03C0}$
, equation (3.1) gives
 $\text{d}C_{L}/\text{d}\unicode[STIX]{x1D6FC}\approx 4.96$
. The tip vortex in our finite-aspect-ratio configuration then seems to be smaller than expected. This is confirmed regarding the drag coefficients in figure 4(b). Indeed, 3D results are lower than that in 2D for angle of attack
 $\unicode[STIX]{x1D6FC}<45^{\circ }$
. The end effect is more pronounced on the lift coefficient, where 3D values remain lower that in 2D between the stall angle of attack and
 $\unicode[STIX]{x1D6FC}\approx 40^{\circ }$
, suggesting that the tip vortex impacts the separated flow behaviour. The 3D effect is also more pronounced on the moment coefficient results reported in figure 4(c) since the overall values are significantly lower in 3D for
 $5^{\circ }<\unicode[STIX]{x1D6FC}<75^{\circ }$
.
3.2 Unsteady aerodynamic results
Unsteady tests have been done for pitch ramp motion from
 $0^{\circ }$
to
 $90^{\circ }$
, various reduced frequencies, different pivot axis locations and both 2D and 3D configurations at
 $Re=1.45\times 10^{4}$
. As indicated in § 2,
 $\unicode[STIX]{x1D6FC}_{max}=\unicode[STIX]{x03C0}/2$
radians gives the same value for the reduced frequency and the reduced pitch rate defined in (2.8). In the following part the reduced pitch rate will then be used instead of the reduced frequency.
Effect of the reduced pitch rate
 $K_{p}$
on the lift (a,b), drag (c,d) and pitching moment (e,f) coefficients versus angle of attack for the 2D flat plate;
 $\unicode[STIX]{x1D6FC}_{max}=90^{\circ }$
and
 $x_{p}=0.5$
.

3.2.1 Effect of the reduced pitch rate
The effects of the reduced pitch rate on the lift, drag and pitching moment coefficients in response to pitch ramp motion from
 $0^{\circ }$
to
 $90^{\circ }$
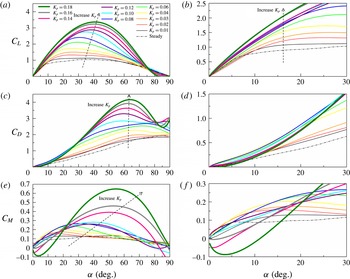
are illustrated in figure 5 for the 2D flat plate with a pivot axis location at mid-chord
 $x_{p}=0.5$
. Two major effects of
 $K_{p}$
on the lift coefficient are noticed. The lift coefficient slope at low angle of attack increases with
 $K_{p}$
as shown in the zoomed-view in figure 5(b). The maximum of the lift coefficient as well as the angle of attack at which this maximum occurs (figure 5
a) also gradually increase with
 $K_{p}$
. As reported by Granlund et al. (Reference Granlund, Ol and Bernal2013), the unsteady aerodynamic response for
 $K_{p}\leqslant 0.03$
is mainly due to stall delay. This is confirmed here for
 $K_{p}=0.01,0.02$
and 0.03. The lift coefficient shows no significant departure from the steady evolution at low angle of attack, and the linear region extends up to a stall angle of attack that is delayed as
 $K_{p}$
increases. For
 $K_{p}\geqslant 0.04$
the unsteady effect is more pronounced, with growing bumps in lift, drag and moment. According to previous studies (Walker et al.
Reference Walker, Helin and Strickland1985; Strickland & Graham Reference Strickland and Graham1987; Granlund et al.
Reference Granlund, Ol and Bernal2013), this is due to a growth of circulation associated with the development of a LEV vortex on the suction side of the ‘airfoil’. Nevertheless the impacts of the LEV on the evolutions of lift, drag and moment coefficients versus the angle of attack show distinct behaviours as
 $K_{p}$
increases. The maximum lift coefficient and corresponding angle of attack gradually increase but seem to saturate for
 $K_{p}=0.18$
, for which
 $C_{Lmax}\approx 3.37$
(at
 $\unicode[STIX]{x1D6FC}\approx 40.8^{\circ }$
) is 3.2 times the maximum steady lift coefficient. The drag coefficient also exhibits an overall increase with the reduced pitch rate as shown in figure 5(c), while figure 5(d) highlights a distinct behaviour between low and moderate reduced frequencies. As for the lift, the drag coefficient remains close to the steady curve for
 $K_{p}\leqslant 0.03$
. For higher reduced pitch rate
 $K_{p}\geqslant 0.04$
, the drag coefficient departs early from the steady curve (figure 5
d), but the bump due to the LEV is only clearly noticeable for
 $K_{p}\geqslant 0.12$
(figure 5
c). For
 $K_{p}=0.18$
,
 $C_{Dmax}\approx 4.16$
(at
 $\unicode[STIX]{x1D6FC}\approx 62^{\circ }$
) is more than two times the maximum steady drag coefficient for
 $\unicode[STIX]{x1D6FC}\approx 90^{\circ }$
.
The impact of the reduced pitch rate on the moment coefficient is reported in figure 5(e,f). As before, the results for
 $K_{p}\leqslant 0.03$
are close to the steady curves at low (
 $\unicode[STIX]{x1D6FC}<7^{\circ }$
) and high (
 $\unicode[STIX]{x1D6FC}>40^{\circ }$
) angle of attack and exhibit an overall increase at moderate angle of attack due to a delay in stall. The maximum moment coefficient and its associated angle of attack also increase with
 $K_{p}$
. The same kind of behaviour is observed up to
 $K_{p}=0.12$
. For
 $K_{p}>0.12$
, the unsteady effects are more pronounced.
 $C_{M}$
starts to decrease at low angle of attack, but a big overshoot is observed at high angle of attack. For
 $K_{p}=0.18$
,
 $C_{Mmax}\approx 0.7$
(at
 $\unicode[STIX]{x1D6FC}\approx 55^{\circ }$
) is more than five times the maximum steady moment coefficient. In summary, the reduced pitch rate
 $K_{p}$
have a strong impact on the unsteady aerodynamic loads, particularly for
 $K_{p}>0.03$
, for which the impact of LEV formation produces overshoot in
 $C_{L}$
,
 $C_{D}$
,
 $C_{M}$
that increases globally with
 $K_{p}$
.
Comparison of the 2D and 3D (effective aspect ratio 7.88) configuration on the lift (a), drag (b) and pitching moment (c) coefficients versus angle of attack for
 $\unicode[STIX]{x1D6FC}_{max}=90^{\circ }$
,
 $x_{p}=0.5$
and different reduced pitch rates.

3.2.2 2D versus 3D configuration
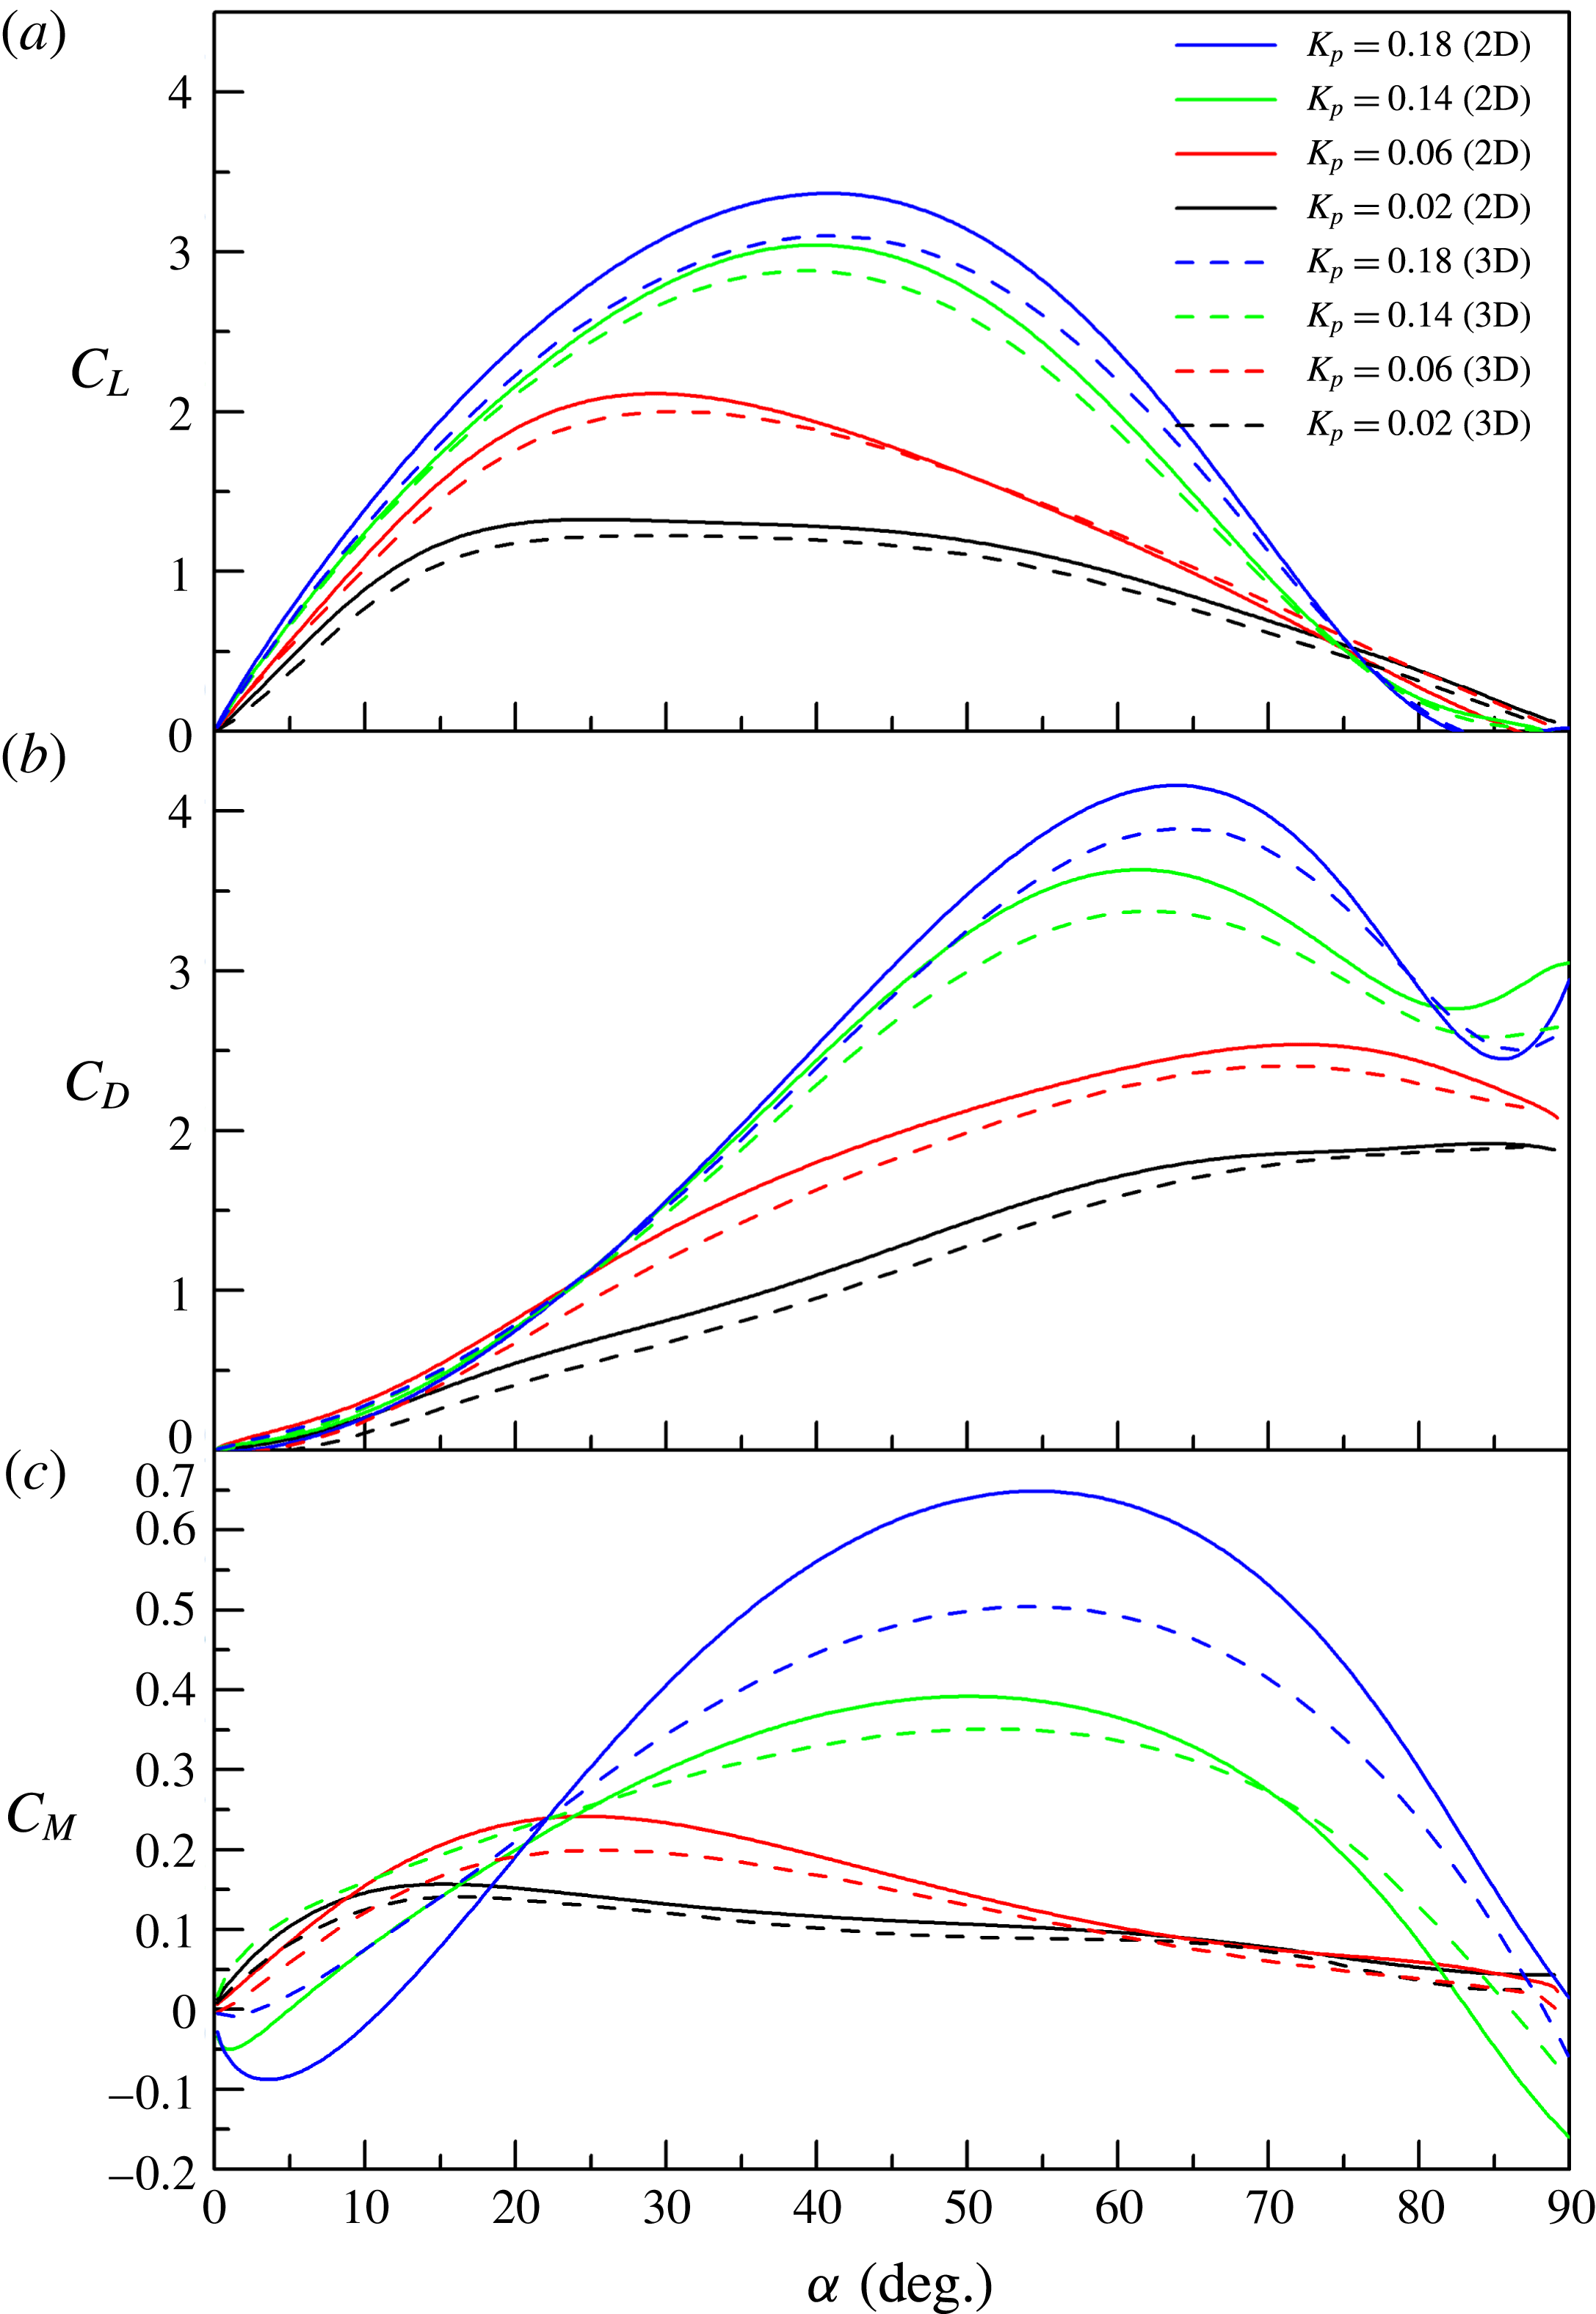
Figure 6 compares the results obtained for
 $\unicode[STIX]{x1D6FC}_{max}=90^{\circ }$
, a pivot axis located at mid-chord
 $x_{p}=0.5$
and a selection of reduced pitch rates for the 2D and 3D configurations. 3D curves are systematically lower than that in 2D, suggesting that the end effects reduce the motion-induced impact of the LEV. The maximum lift coefficient in the 2D configuration reaches 1.32, 2.11, 3.04 and 3.37 for
 $K_{p}=0.02$
, 0.06, 0.14 and 0.18, respectively. In contrast, the corresponding maximum lift coefficient in the 3D configuration reduces to 1.22, 2.00, 2.88 and 3.10, i.e. a reduction close to
 $92\,\%\sim 95\,\%$
. A decrease of the same amount is also observed in the maximum drag coefficient (figure 6
b). Regarding the moment coefficient (figure 6
c), the 3D impact is more pronounced and increases with the reduced pitch rate. For
 $K_{p}=0.18$
the small negative bump at low angle of attack is significantly reduced, and the maximum overshoot that occurs close to
 $\unicode[STIX]{x1D6FC}\approx 55^{\circ }$
is reduced by 20 %.
Three-dimensional flow is accompanied by tip vortices (Green Reference Green1995). Based on flow visualizations carried out over a flat plate with an effective aspect ratio of 2 performing a smoothed linear pitch from
 $0^{\circ }$
to
 $90^{\circ }$
at
 $K_{p}=0.5$
and
 $Re=20\,000$
, Granlund, Ol & Bernal (Reference Granlund, Ol and Bernal2011b
) showed that tip vortices evolved more slowly than leading edge vortices, and remained coherent and nearly attached to the wingtip during the leading edge vortex process. Furthermore, they found that the LEV for the 3D configuration was less coherent than that in 2D. In the present study, steady aerodynamic measurements (figure 4) suggest that the tip vortices associated with our 3D flat plate, with effective aspect ratio close to 8, are rather small. Nevertheless, the 3D effect observed on the unsteady lift, drag and moment for reduced pitch rates lower than 0.2 are significant. In particular, the reduction of the overshot induced by the LEV in 3D is consistent with the findings of Granlund et al. (Reference Granlund, Ol and Bernal2011b
) and Son et al. (Reference Son, Cetiner, Stevens, Babinsky, Manar, Mancini, Jones, Ol and Gozukara2016).
Effect of the pivot axis location on the lift, drag and pitching moment coefficients versus angle of attack for
 $K_{p}=0.06$
(a–c) and
 $K_{p}=0.16$
(d–f); 2D flat plate,
 $\unicode[STIX]{x1D6FC}_{max}=90^{\circ }$
.

3.2.3 Effect of the pivot point location
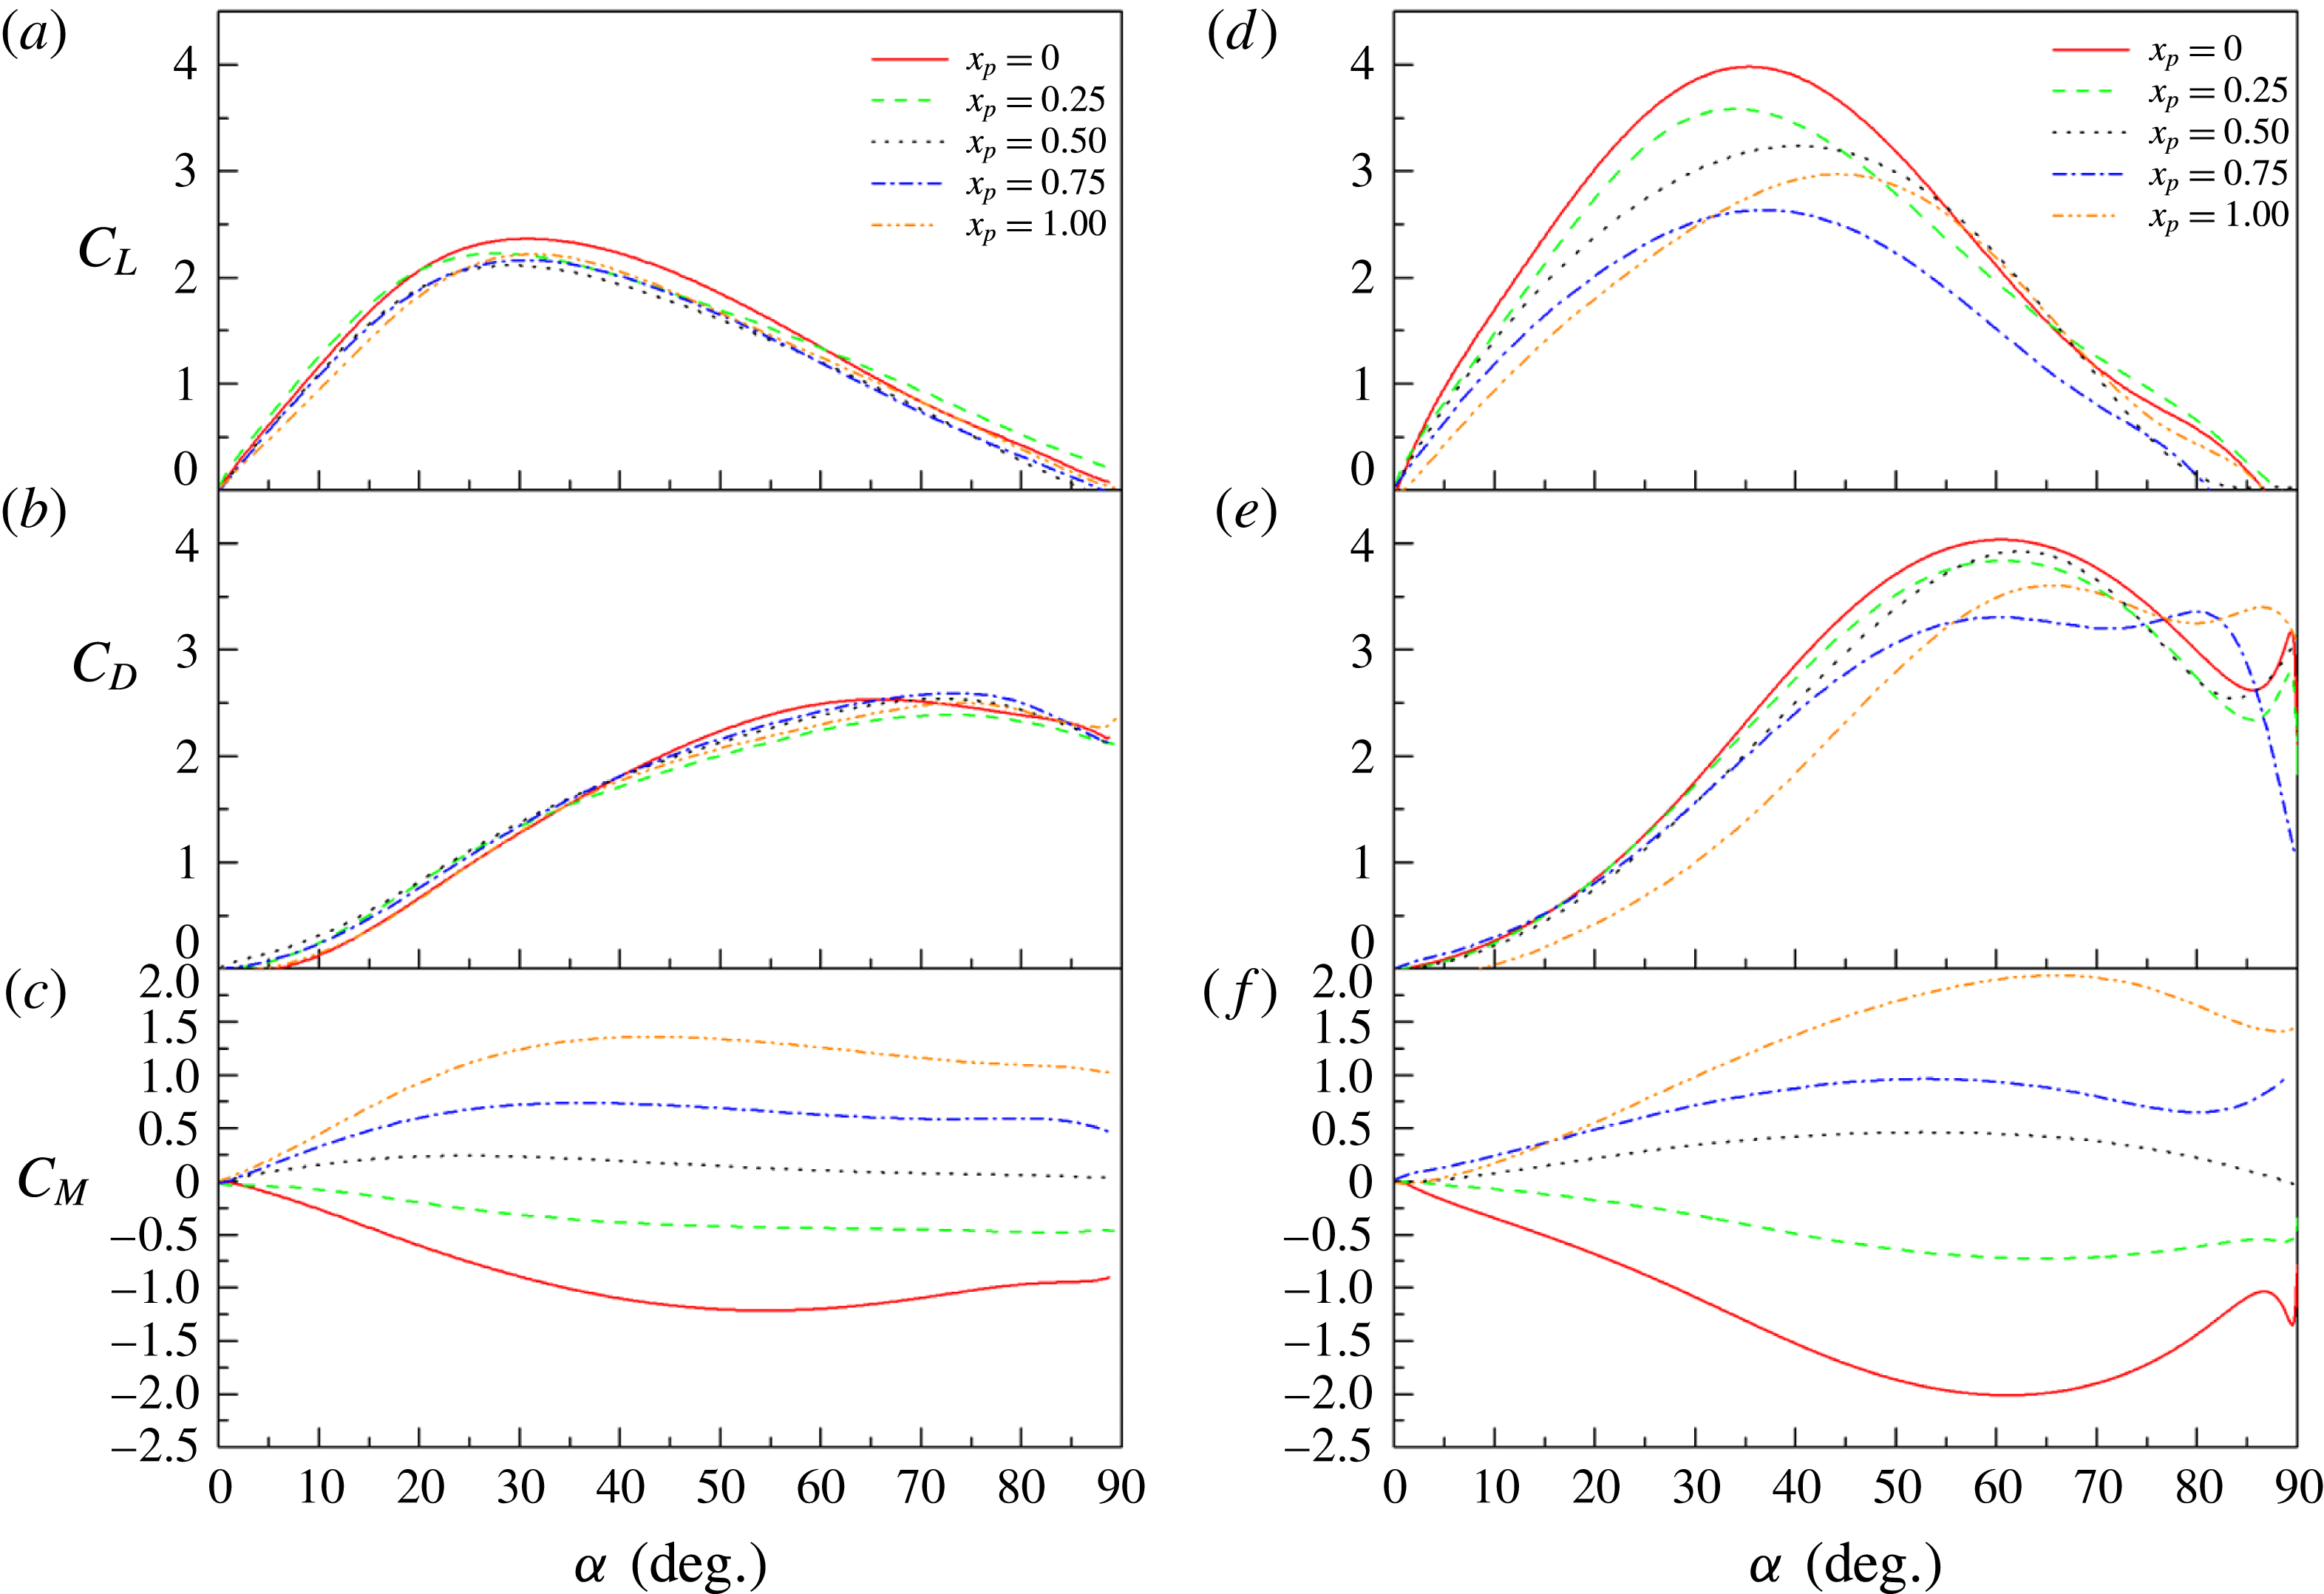
The effect of pivot axis location on the lift, drag and moment coefficients are reported in figure 7 for
 $K_{p}=0.06$
and
 $K_{p}=0.16$
. For low reduced pitch rate (
 $K_{p}=0.06$
), no considerable changes can be observed in the lift and drag coefficients in figures 7(a) and 7(b) even though the lift results suggest an overall increase with the absolute distance between the pivot point location and the
 $3/4$
-chord location. Distinct behaviours can be observed for the moment coefficient defined about the pivot axis location in figure 7(c). When the pivot location is at the leading edge (
 $x_{p}=0$
), the moment coefficient decreases from 0 at
 $\unicode[STIX]{x1D6FC}=0^{\circ }$
to
 $-1.21$
at
 $\unicode[STIX]{x1D6FC}=54.6^{\circ }$
and then increases slightly as the angle of attack further increases. When the pivot location moves rearwards to
 $x_{p}=0.25$
, the
 $C_{M}$
decreases monotonically from 0 at
 $\unicode[STIX]{x1D6FC}=0^{\circ }$
to
 $-0.48$
at
 $90^{\circ }$
. The moment coefficient turns to positive for
 $x_{p}\geqslant 0.5$
. It firstly increases with the angle of attack and then decreases slowly. As expected,
 $C_{Mmax}$
increases with
 $x_{p}$
, reaching 1.36 at
 $x_{p}=1$
. When the reduced pitch rate increases to
 $K_{p}=0.16$
, more pronounced effects of the pivot axis location can be observed on the dynamic lift and drag force. The slope of
 $C_{L}$
at small angle of attack decreases from 10.97 to 5.96 as
 $x_{p}$
moves from the leading edge to the trailing edge (figure 7
d). The maximum
 $C_{L}$
decreases from 3.98 for
 $x_{p}=0$
to 2.63 for
 $x_{p}=0.75$
, and
 $C_{L\,max}$
increases to 2.97 for
 $x_{p}=1$
. Figure 7(d) also suggests a gradual increase of the angle of attack at which the maximum lift coefficient occurs when the pivot point moves towards the trailing edge. For
 $x_{p}=0{-}0.75$
the drag coefficient evolution does not change for
 $\unicode[STIX]{x1D6FC}\leqslant 20^{\circ }$
(figure 7
e). For higher angle of attack the bump due to the LEV is slightly reduced when the pivot point moves towards the
 $3/4$
-chord position. Figure 7(e) also shows a singular behaviour for
 $x_{p}=1$
, with a drag coefficient evolution significantly lower up to
 $\unicode[STIX]{x1D6FC}\approx 50^{\circ }$
and a bump over the one observed for
 $x_{p}=0.75$
. The moment coefficient for
 $K_{p}=0.16$
(figure 7
f) remains lower than that for
 $K_{p}=0.06$
(figure 7
c) at low angle of attack
 $\unicode[STIX]{x1D6FC}\leqslant 21^{\circ }$
. In contrast, larger absolute values of maximum moment coefficients are obtained for every
 $x_{p}$
at high angle of attack, reaching
 $C_{Mmax}\approx -2$
at
 $\unicode[STIX]{x1D6FC}\approx 50^{\circ }$
for
 $x_{p}=0$
and
 $C_{Mmax}\approx +2$
at
 $\unicode[STIX]{x1D6FC}\approx 65^{\circ }$
for
 $x_{p}=1$
.
Evolution of the mean slope of lift coefficient at small angle of attack
 $\unicode[STIX]{x1D6FC}<5^{\circ }$
with the reduced pitch rate for the 2D configuration and different pivot axis locations.

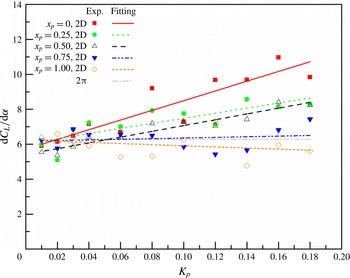
A summary of the effects of reduced pitch rate and pivot axis location on the lift coefficient is presented in figures 8 and 9. Figure 8 surveys the evolution of the lift coefficient slope
 $\text{d}C_{L}/\text{d}\unicode[STIX]{x1D6FC}$
at low angle of attack as a function of
 $K_{p}$
and different pivot axis locations for the 2D flat-plate configuration. Fitting curves using linear regression have been added to highlight the general trends. Note that the slope values can be dispersed, so the linear fitting lines can only be used for a qualitative analysis.
 $\text{d}C_{L}/\text{d}\unicode[STIX]{x1D6FC}$
slightly decreases with
 $K_{p}$
for
 $x_{p}=1$
. For
 $x_{p}=0.75$
, the slope varies little with further increase of
 $K_{p}$
and remains approximately
 $2\unicode[STIX]{x03C0}$
. For
 $x_{p}\leqslant 0.5$
,
 $\text{d}C_{L}/\text{d}\unicode[STIX]{x1D6FC}$
increases with the reduced pitch rate and grows more rapidly as the pivot axis location moves towards the leading edge. 3D effects on the lift coefficient can be appreciated in figure 6. Results show that, for each reduced pitch rate, the lift coefficient slope at low angle of attack is 10–15 % lower for the 3D flat-plate configuration.
Evolution of the maximum lift coefficients (a), and associatedangle of attack (b) with the reduced pitch rate for different pivot axis locations.

The evolutions with
 $K_{p}$
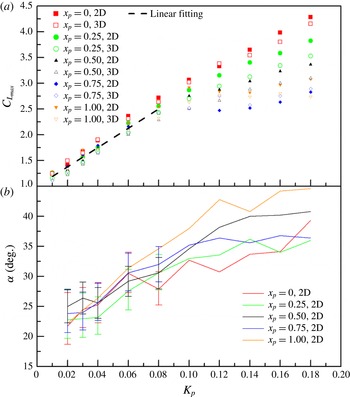
of the maximum lift coefficients and the angle of attack at which this maximum occurs are reported in figure 9. For
 $K_{p}\leqslant 0.08$
, figure 9(a) shows that
 $C_{Lmax}$
increases almost linearly with
 $K_{p}$
for all pivot point locations, with a mean rate of increase close to 19. For
 $K_{p}>0.08$
,
 $C_{Lmax}$
keeps increasing almost linearly with
 $K_{p}$
for
 $x_{p}=0$
. For
 $x_{p}=0.25$
,
 $C_{Lmax}$
slightly departs from the linear line and at
 $K_{p}=0.18$
,
 $C_{L\,max}$
is 12 % lower than that for
 $x_{p}=0$
. For
 $x_{p}=0.5$
, the rate of increase of
 $C_{Lmax}$
with
 $K_{p}>0.08$
is significantly reduced (it is close to 7.5), while
 $C_{Lmax}$
seems to saturate beyond
 $K_{p}=0.08$
for
 $x_{p}=0.75$
and
 $K_{p}=0.1$
for
 $x_{p}=1$
, respectively. As pointed out previously, at moderate reduced frequency (
 $K_{p}>0.08$
) for which the unsteady response is dominated by the LEV effect, the minimum
 $C_{L\,max}$
is observed for
 $x_{p}=0.75$
and gradually increases with the absolute distance between the pivot point location and this neutral point.
Angles of attack at which the maximum lift coefficients are attained are plotted in figure 9(b). Due to the smooth stall behaviour of the flat plate, an exact evaluation of the angle of attack associated with
 $C_{Lmax}$
is difficult at low reduced pitch rate. Errors bars have been added when necessary. Despite the small scattering of those results, an overall increase with
 $K_{p}$
can be pointed out. This progressive delay of the peak lift to higher angle of attack has been reported by previous studies; see, for example, Granlund et al. (Reference Granlund, Ol and Bernal2013). At low reduced pitch rate it is mainly due to a delay in stall, which increases with increasing pitch rate (Sheng, Galbraith & Coton Reference Sheng, Galbraith and Coton2006). For higher
 $K_{p}$
it can be related to the delay in the LEV formation, which also increases with the pitch rate (Helin & Walker Reference Helin and Walker1985). As reported in Granlund et al. (Reference Granlund, Ol and Bernal2013), a saturation of the angle of attack associated with the peak lift coefficient was also observed. It is close to
 $35^{\circ }$
for
 $x_{p}=0.25$
and 0.75, close to
 $40^{\circ }$
for
 $x_{p}=0.5$
, and close to
 $45^{\circ }$
for
 $x_{p}=1$
. No real saturation is observed for the case with the pivot axis at the leading edge. Figure 9(b) also shows that the effect of pivot point location is more dominant for
 $K_{p}>0.08$
. In this reduced pitch rate regime, the gradual reduction of
 $C_{Lmax}$
when the pivot point moves from the leading edge to the trailing edge (figure 9
a) is associated with a gradual increase of the associated angle of attack (figure 9
b). This is in accordance with Granlund et al. (Reference Granlund, Ol and Bernal2013) and Yu & Bernal (Reference Yu and Bernal2013), who pointed out a increasing delay of the formation and growth of the LEV as the pivot point location moved downstream. Only the case whose pivot point is at the
 $3/4$
-chord shows a distinct behaviour, because the angle of attack at which peak lift is attained is lower than that for
 $x_{p}=0.5$
.
3.2.4 Effect of maximum angle of attack in pitch-up and down motion
Additional unsteady 2D tests have been performed for pitch-up and pitch-down ramp motion with different maximum angles of attack, pivot point location
 $x_{p}=0.5$
and various reduced frequencies at the same Reynolds number,
 $Re=1.45\times 10^{4}$
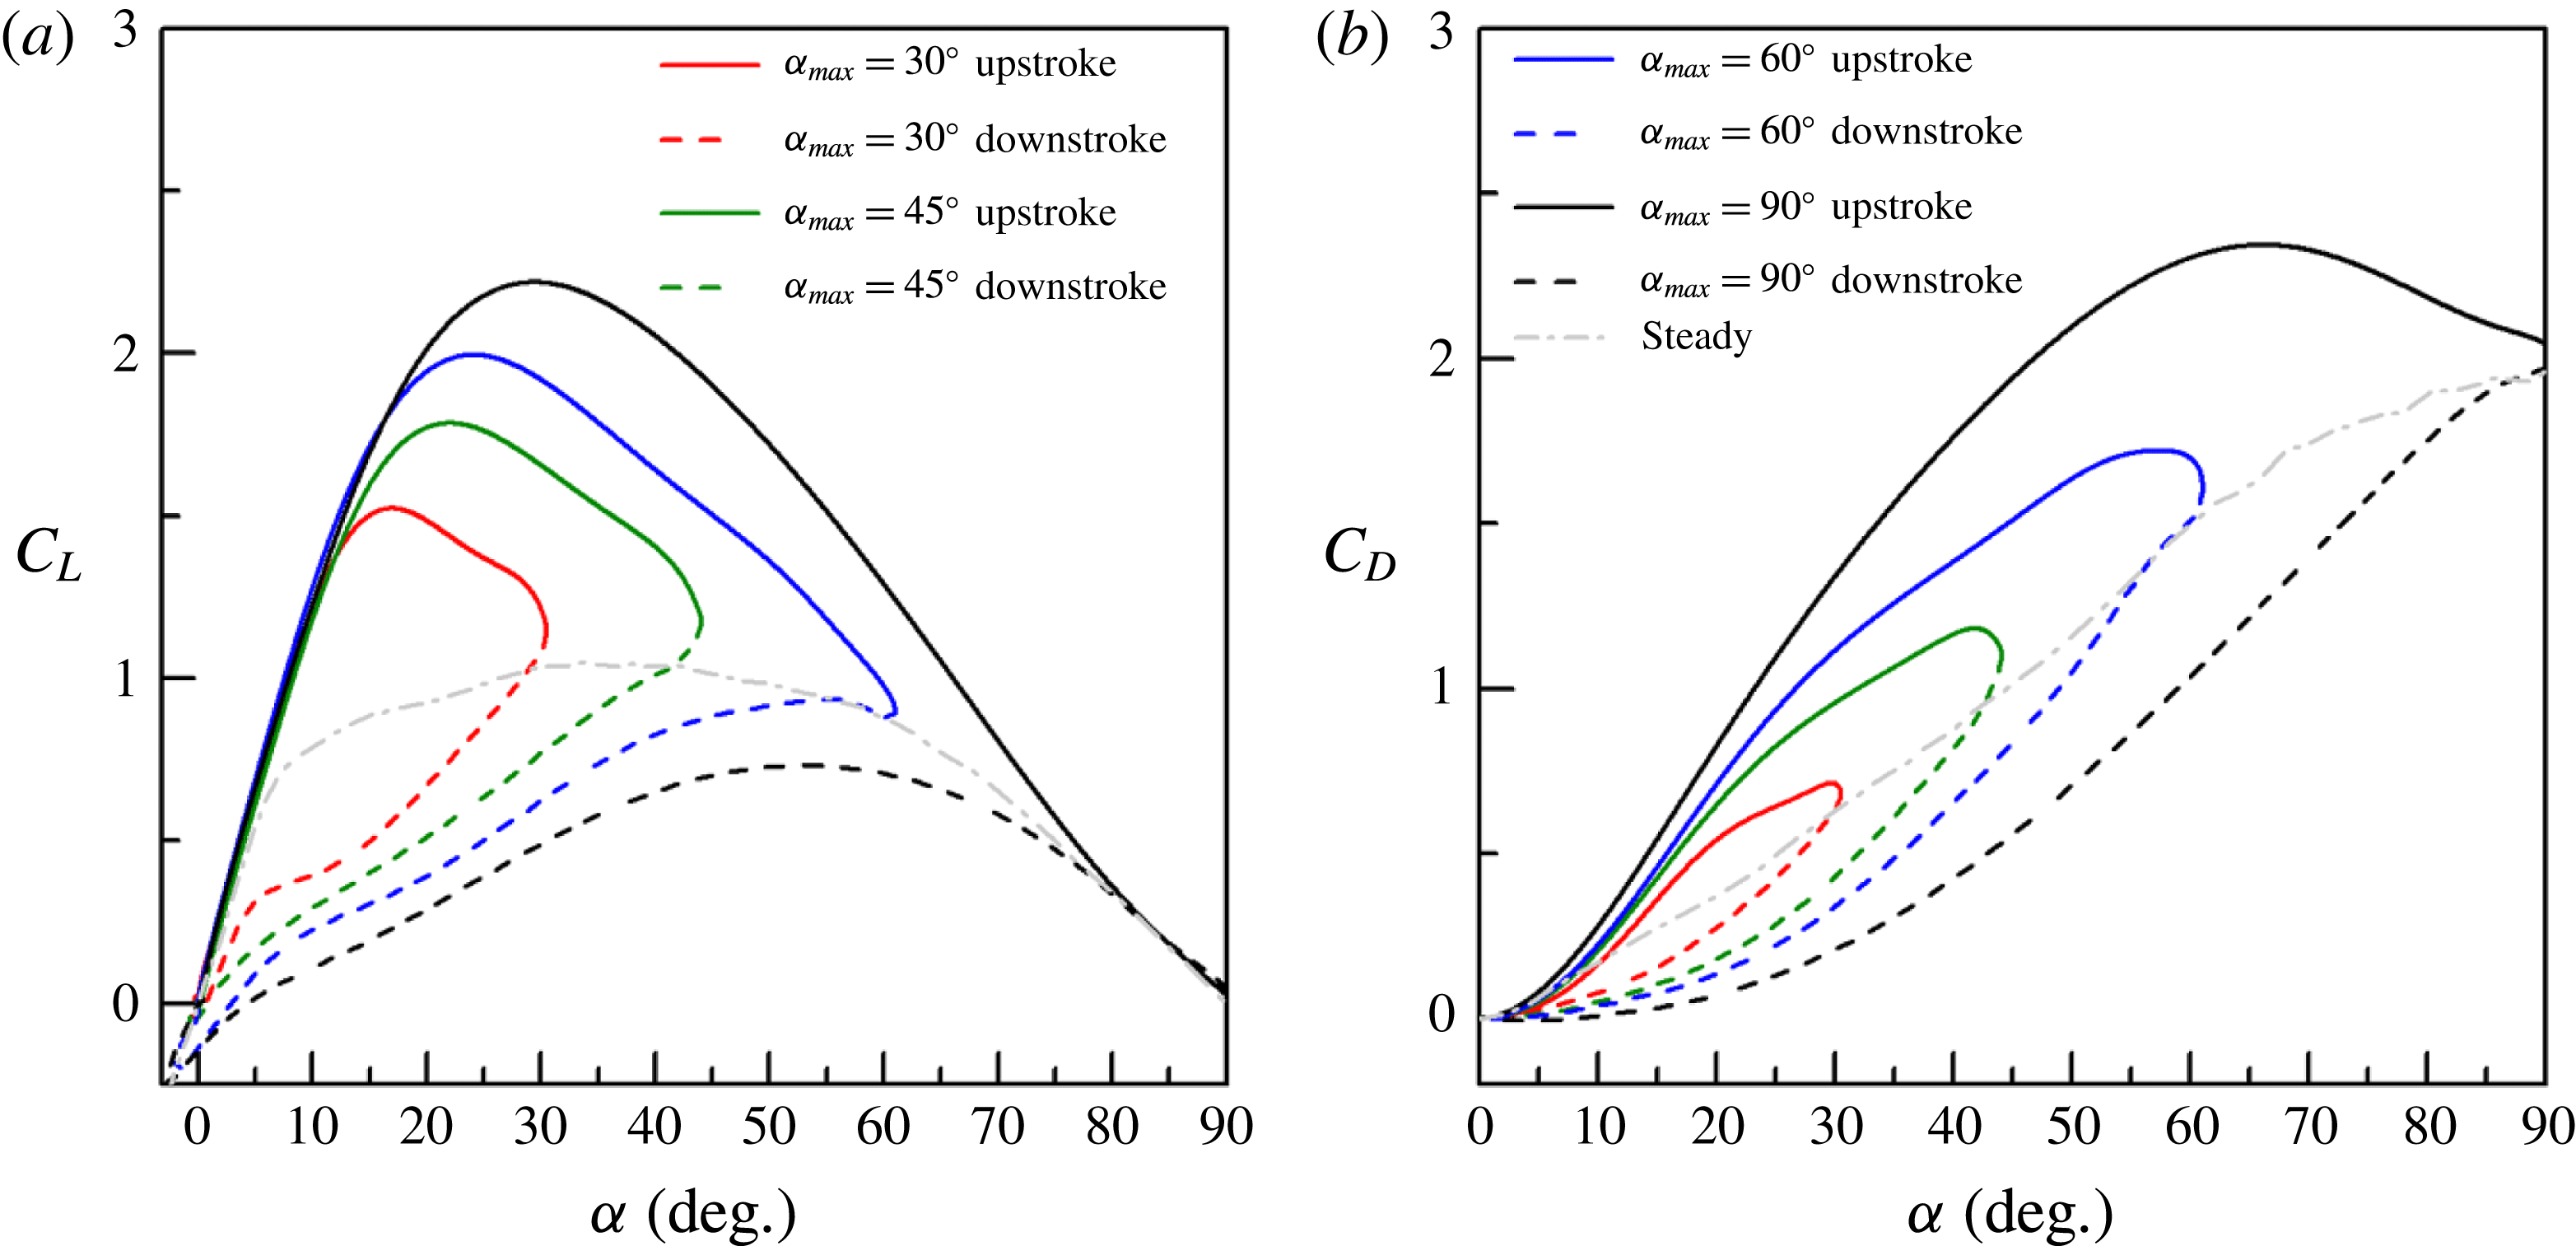
. Results are reported here to highlight the effect of the maximum angle of attack, as well as to focus on the hysteresis response in the pitch-up and pitch-down kinematic. Here the downstroke occurs immediately at the end of the upstroke using an exact symmetric pitch profile. Figure 10 illustrates the evolutions of
 $C_{L}$
and
 $C_{D}$
for different maximum pitch angles
 $\unicode[STIX]{x1D6FC}_{max}=30^{\circ },45^{\circ },60^{\circ },90^{\circ }$
at the same reduced frequency
 $K=0.06$
and pivot axis location
 $x_{p}=0.5$
. The solid lines represent the force coefficients during the pitch-up motion and the dashed lines are for the pitch-down motion. The evolutions of
 $C_{L}$
with angle of attack overlap during the first ‘linear’ part of the pitch-up motion. Both the
 $C_{Lmax}$
and the angle of attack at which the maximum is reached increase with
 $\unicode[STIX]{x1D6FC}_{max}$
. Beyond this maximum the lift coefficient decreases gradually and collapses to the steady curve at the end of the upstroke. During the pitch-down motion the lift coefficients decline below the steady lift rather than going back along the upstroke path, forming hysteresis loops that get larger when increasing
 $\unicode[STIX]{x1D6FC}_{max}$
. Similar hysteresis loops are found for
 $C_{D}$
, as shown in figure 10(b). The unsteady response of drag departs further away from the steady curve in pitch-up than that in pitch-down and the overall area of the hysteresis path increases with the maximum angle of attack.
Effects of maximum pitch angle and hysteresis in pitch-up and pitch-down kinematic for
 $K=0.06$
and
 $x_{p}=0.5$
.

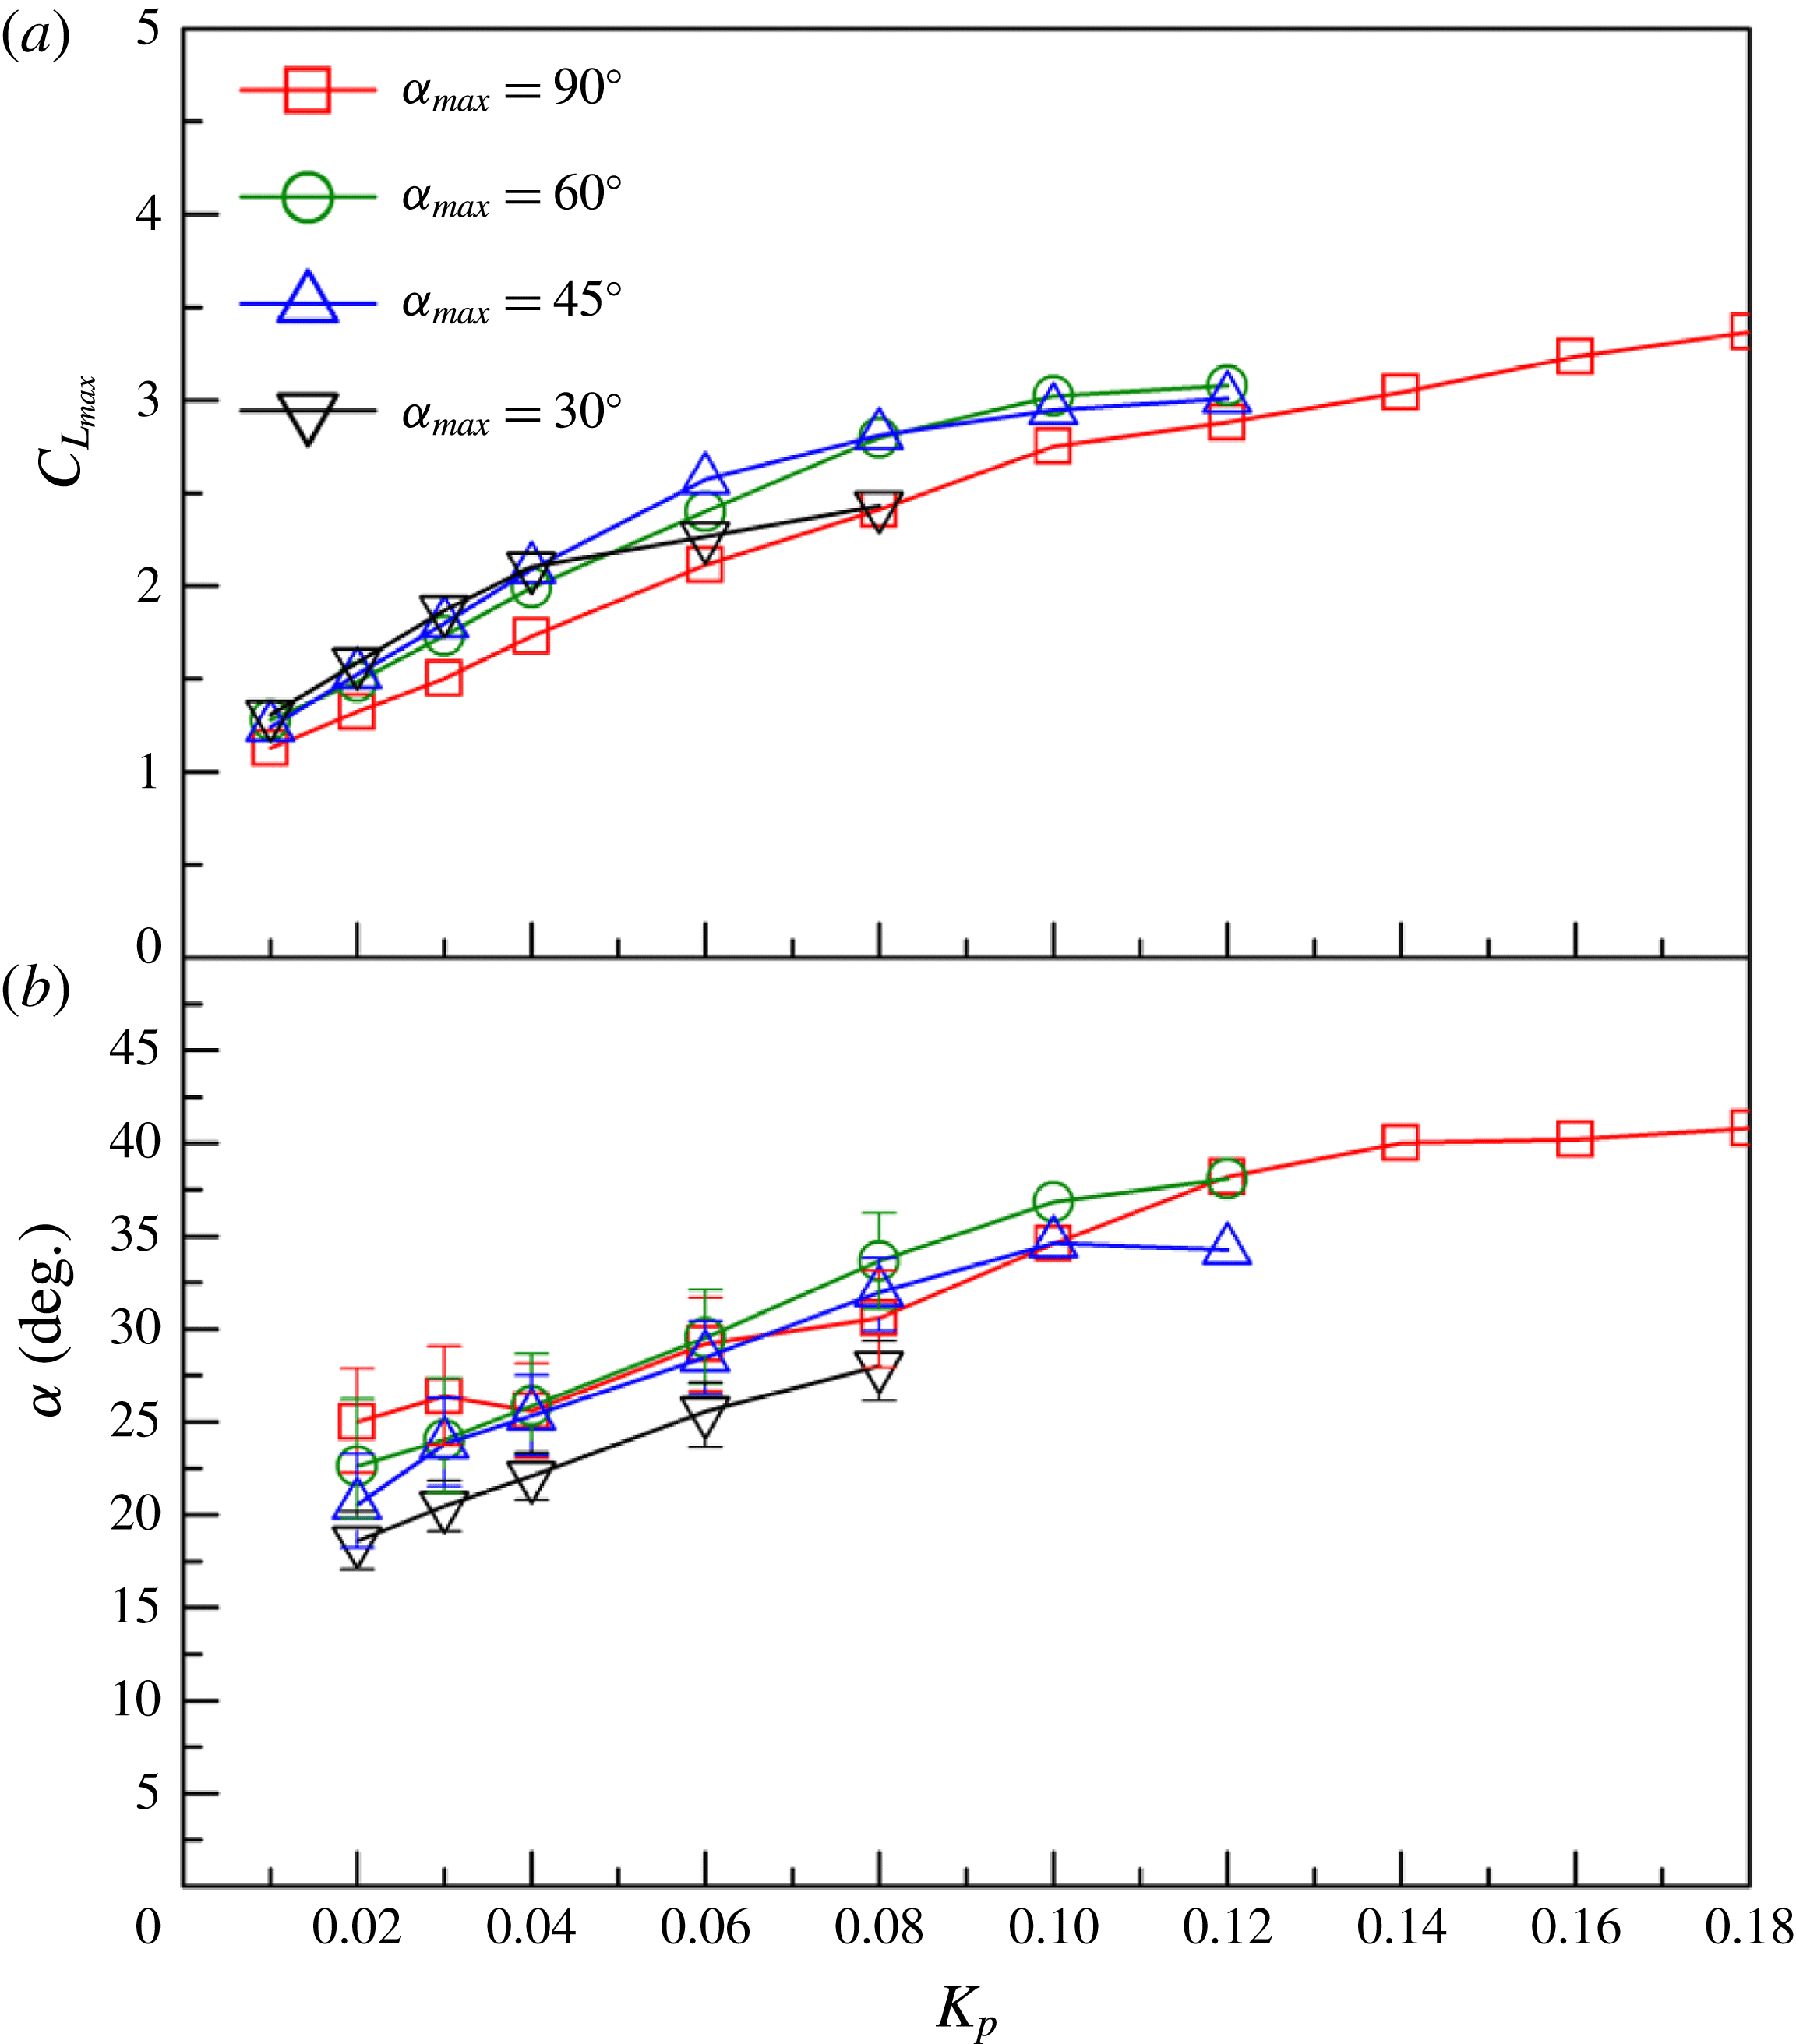
A synthesis of the effects of the reduced frequency and maximum angle of attack is proposed in figure 11. The maximum lift coefficients and the angles of attack at which those maxima are attained are reported as a function of the reduced pitch rate
 $K_{p}$
for various maximum angles of attack
 $\unicode[STIX]{x1D6FC}_{max}=30^{\circ },45^{\circ },60^{\circ },90^{\circ }$
. Note that, due to the limitation of the motor,
 $K_{P}$
is restricted to lower values for smaller maximum pitch angles.
A first look reveals that the curves for different
 $\unicode[STIX]{x1D6FC}_{max}$
nearly collapse, suggesting that the reduced pitch rate plays a dominant role. A closer look shows that the rate of increase of the maximum lift coefficient with
 $K_{p}$
is higher for
 $\unicode[STIX]{x1D6FC}_{max}=30^{\circ },45^{\circ }$
and
 $60^{\circ }$
up to
 $K_{p}=0.04$
. For higher pitch rate the maximum lift coefficients continue to increase, but seem to saturate at
 $C_{Lmax}\approx 2.5$
beyond
 $K_{p}=0.08$
for
 $\unicode[STIX]{x1D6FC}_{max}=30^{\circ }$
and at
 $C_{Lmax}\approx 3$
beyond
 $K_{p}=0.12$
for
 $\unicode[STIX]{x1D6FC}_{max}=45^{\circ }$
and
 $60^{\circ }$
. Regarding the angles of attack at which the maximum lift coefficients are attained, the curves for
 $\unicode[STIX]{x1D6FC}_{max}=45^{\circ }$
,
 $60^{\circ }$
and
 $90^{\circ }$
show similar behaviour up to
 $K_{p}=0.1$
. Results for
 $\unicode[STIX]{x1D6FC}_{max}=30^{\circ }$
follow the same rate of increase with
 $K_{p}$
, but with an overall reduction close to
 $5^{\circ }$
.
In the present study, every pitch ramp motion is done using an acceleration–deceleration profile for which the maximum pitch rate is obtained at the mid-ramp (see § 2). As a consequence, for
 $\unicode[STIX]{x1D6FC}_{max}=30^{\circ }$
,
 $45^{\circ }$
and
 $60^{\circ }$
, the maximum pitch rate occurs at angles of attack that can enhance the dynamic stall delay. This can explain the higher values of maximum lift coefficient observed for
 $\unicode[STIX]{x1D6FC}_{max}\leqslant 60^{\circ }$
. Further investigation would be necessary to clarify that point.
Evolution of the maximum lift coefficients (a) and associated angle of attack (b) with the reduced pitch rate for
 $x_{p}=0.5$
.

4 Unsteady aerodynamic models
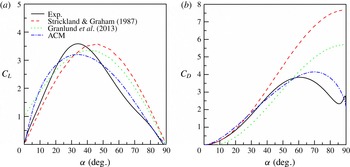
Regarding the experimental results reported in the previous section, it is very tempting to find a simple way to account for the responses of aerodynamic force and moment coefficients in high-amplitude pitch ramp motion. This was first done by Strickland & Graham (Reference Strickland and Graham1987), who proposed simple algebraic relations for the lift and drag coefficients:
 $$\begin{eqnarray}\displaystyle & \displaystyle C_{L}=2C_{L\,max}\text{sin}\,\unicode[STIX]{x1D6FC}\text{cos}\unicode[STIX]{x1D6FC}, & \displaystyle\end{eqnarray}$$
 $$\begin{eqnarray}\displaystyle & \displaystyle C_{D}=2C_{D\,max}\text{sin}^{2}\unicode[STIX]{x1D6FC}, & \displaystyle\end{eqnarray}$$
where
 $C_{L\,max}$
and
 $C_{D\,max}$
are the maximum lift and drag coefficients, measured through experiments.
Those relations were further extended by Granlund et al. (Reference Granlund, Ol and Bernal2013) to include the effects of both pitch rate and pivot axis location:
 $$\begin{eqnarray}\displaystyle & \displaystyle C_{L}=2C_{L\,max}^{x_{p}=0.75}\text{sin}\unicode[STIX]{x1D6FC}\,\text{cos}\unicode[STIX]{x1D6FC}+4\unicode[STIX]{x03C0}K(0.75-x_{p})\text{cos}\unicode[STIX]{x1D6FC}, & \displaystyle\end{eqnarray}$$
 $$\begin{eqnarray}\displaystyle & \displaystyle C_{D}=2C_{D\,max}^{x_{p}=0.75}\,\text{sin}^{2}\unicode[STIX]{x1D6FC}-4\unicode[STIX]{x03C0}K(0.75-x_{p})\text{sin}\unicode[STIX]{x1D6FC}, & \displaystyle\end{eqnarray}$$
where
 $C_{L\,max}^{x_{p}=0.75}$
and
 $C_{D\,max}^{x_{p}=0.75}$
are the maximum lift and drag coefficients determined experimentally when the pivot axis is at
 $x_{p}=0.75$
. Although those semiempirical algebraic relations are simple, they properly predict the evolutions of lift and drag with the angle of attack up to
 $45^{\circ }$
(Granlund et al.
Reference Granlund, Ol and Bernal2013).
In the present work, we focus on time-dependent models which are mainly based on the indicial response method to predict the normal force and moment coefficients. Three different formulations have been tested. The first one, namely the ‘Normal Velocity Model’, is a simple extension of the unsteady lift formulation to arbitrary pitch motion (or time variant free-stream velocity). This is achieved through the superposition of indicial aerodynamic responses, i.e. the Duhamel integral, using the Wagner function; see, for example, Fung (Reference Fung2002) and Leishman (Reference Leishman2006). The second model, namely the ‘steady curve model’ (SCM), is close to the model proposed in Taha et al. (Reference Taha, Hajj and Beran2014). It can be seen as an improvement of the ‘normal velocity model’ (NVM) as it extends the Duhamel formulation to account for the nonlinear variation of the steady aerodynamics. The last model, namely the ‘artificial circulation model’ (ACM), is an improvement of the SCM using an additional circulation term that depends on the pitch rate.
4.1 The normal velocity model (NVM)
Using the Wagner function (Wagner Reference Wagner1925), which accounts for the circulatory lift due to a step change in the angle of attack in the linear regime, the unsteady circulatory response to arbitrary changes in angle of attack can be obtained through the superposition of indicial lift responses via the Duhamel integral. A general formulation for the circulatory lift response to an arbitrary pitching motion with low amplitude can be found in Fung (Reference Fung2002):
 $$\begin{eqnarray}\displaystyle & \displaystyle C_{L}^{C}(t^{\ast })={\displaystyle \frac{2\unicode[STIX]{x03C0}}{U}}\left[w_{3/4}(t^{\ast }\rightarrow 0)\,\unicode[STIX]{x1D719}(t^{\ast })+\int _{0}^{t^{\ast }}{\displaystyle \frac{\text{d}w_{3/4}(\unicode[STIX]{x1D70E})}{\text{d}\unicode[STIX]{x1D70E}}}\unicode[STIX]{x1D719}(t^{\ast }-\unicode[STIX]{x1D70E})\text{d}\unicode[STIX]{x1D70E}\right], & \displaystyle\end{eqnarray}$$
where
 $C_{L}^{C}$
is the circulatory lift coefficient,
 $\unicode[STIX]{x1D719}$
is the Wagner’s function,
 $t^{\ast }=2Ut/c$
is the reduced time and
 $w_{3/4}$
is the downwash velocity at the
 $3/4$
-chord point:
 $$\begin{eqnarray}\displaystyle & \displaystyle w_{3/4}=U\sin \unicode[STIX]{x1D6FC}+2U(0.75-x_{p}){\displaystyle \frac{\text{d}\unicode[STIX]{x1D6FC}}{\text{d}t^{\ast }}}. & \displaystyle\end{eqnarray}$$
In the downwash velocity formulation (4.6),
 $U\sin \unicode[STIX]{x1D6FC}$
is generally replaced by
 $U\unicode[STIX]{x1D6FC}$
in low-amplitude linear formulations and the pitch rate term accounts for the induced-camber effect due to the pitch-rate-induced normal velocity distribution along the chord (Fung Reference Fung2002; Leishman Reference Leishman2006).
To account for higher angle of attack the same formulation can be used for the normal coefficient, instead of the lift. Using the exact normal velocity definition at the
 $3/4$
-chord point (4.6), the NVM is then built as follows:
 $$\begin{eqnarray}\displaystyle & \displaystyle C_{N}^{NVM}=C_{N}^{\mathit{Trans\_NVM}}+C_{N}^{Rot}+C_{N}^{Cen}+C_{N}^{In}, & \displaystyle\end{eqnarray}$$
where the
 $C_{N}^{\mathit{Trans\_NVM}}$
is the circulatory part of the response, associated with the ‘translational’
 $U\sin \unicode[STIX]{x1D6FC}$
term of the normal velocity:
 $$\begin{eqnarray}\displaystyle & \displaystyle C_{N}^{\mathit{Trans\_NVM}}=2\unicode[STIX]{x03C0}\left[\sin (\unicode[STIX]{x1D6FC}(t^{\ast }\rightarrow 0))\,\unicode[STIX]{x1D719}(t^{\ast })+\int _{0}^{t^{\ast }}{\displaystyle \frac{\text{d}\sin \unicode[STIX]{x1D6FC}(\unicode[STIX]{x1D70E})}{\text{d}\unicode[STIX]{x1D70E}}}\unicode[STIX]{x1D719}(t^{\ast }-\unicode[STIX]{x1D70E})\text{d}\unicode[STIX]{x1D70E}\right]. & \displaystyle\end{eqnarray}$$
The term
 $C_{N}^{Rot}$
accounts for the circulatory part of the response, associated with the normal velocity, which is proportional to the pitch rate and to the relative distance between the pivot point location and the
 $3/4$
-chord point.
 $$\begin{eqnarray}\displaystyle & \displaystyle C_{N}^{Rot}=2\unicode[STIX]{x03C0}\left[2(0.75-x_{p}){\displaystyle \frac{\text{d}\unicode[STIX]{x1D6FC}}{\text{d}t^{\ast }}}(t^{\ast }\rightarrow 0)\unicode[STIX]{x1D719}(t^{\ast })+\int _{0}^{t^{\ast }}{\displaystyle \frac{\text{d}\left[2(0.75-x_{p}){\displaystyle \frac{\text{d}\unicode[STIX]{x1D6FC}}{\text{d}t^{\ast }}}\right]}{\text{d}\unicode[STIX]{x1D70E}}}\unicode[STIX]{x1D719}(t^{\ast }-\unicode[STIX]{x1D70E})\text{d}\unicode[STIX]{x1D70E}\right]. & \displaystyle \nonumber\\ \displaystyle & & \displaystyle\end{eqnarray}$$
This term is zero for
 $x_{p}=0.75$
, i.e. the above-mentioned rear neutral point.
To account for general motions, non-circulatory terms must be added. It is done here with both instantaneous centrifugal and inertia terms as expressed in Fung (Reference Fung2002). The instantaneous centrifugal force is a normal force acting at the
 $3/4$
-chord. It is proportional to the apparent mass
 $\unicode[STIX]{x1D70C}\unicode[STIX]{x03C0}bc^{2}/4$
, to the pitch rate and to the velocity
 $U$
. In non-dimensional time, it is expressed as follows:
 $$\begin{eqnarray}\displaystyle & \displaystyle C_{N}^{Cen}=\unicode[STIX]{x03C0}{\displaystyle \frac{\text{d}\unicode[STIX]{x1D6FC}}{\text{d}t^{\ast }}}. & \displaystyle\end{eqnarray}$$
The instantaneous apparent mass term is a normal force acting at the mid-chord, equal to the apparent mass
 $\unicode[STIX]{x1D70C}\unicode[STIX]{x03C0}bc^{2}/4$
times the vertical acceleration at the mid-chord. In non-dimensional time it is given by
 $$\begin{eqnarray}\displaystyle & \displaystyle C_{N}^{In}=\unicode[STIX]{x03C0}(\text{1-2}x_{p}){\displaystyle \frac{\text{d}^{2}\unicode[STIX]{x1D6FC}}{{\text{d}t^{\ast }}^{2}}}. & \displaystyle\end{eqnarray}$$
We recall here the main assumption of the NVM: (1) the airfoil acts as a linear dynamical system and the principle of linear superposition can be used in the Duhamel integral; (2) the normal force response to an increment in normal velocity is proportional to
 $2\unicode[STIX]{x03C0}$
, i.e. the slope of the normal coefficient in the linear regime; (3) the Wagner indicial function can be used for high angle of attack; and (4) non-circulatory terms are linearly additive and one can use the formulation taken from the linear unsteady airfoil theory.
4.2 The steady curve model (SCM)
The second assumption of the NVM can be partially removed, modifying the Duhamel formulation to account for the nonlinear variation of the steady normal force coefficient. This was first proposed in Taha et al. (Reference Taha, Hajj and Beran2014) and taken up here to build the so-called SCM, which only differs from the NVM in its translational circulatory term.
 $$\begin{eqnarray}\displaystyle & \displaystyle C_{N}^{SCM}=C_{N}^{Trans}+C_{N}^{Rot}+C_{N}^{Cen}+C_{N}^{In}. & \displaystyle\end{eqnarray}$$
Following the idea of Taha et al. (Reference Taha, Hajj and Beran2014), the steady normal force coefficient curve
 $C_{N}^{S}(\unicode[STIX]{x1D6FC})$
is used to build a time-varying input function:
 $$\begin{eqnarray}\displaystyle & \displaystyle C_{N}^{Trans}=C_{N}^{S}(\unicode[STIX]{x1D6FC}(t^{\ast }\rightarrow 0))\unicode[STIX]{x1D719}(t^{\ast })+\int _{0}^{t^{\ast }}{\displaystyle \frac{\text{d}C_{N}^{S}(\unicode[STIX]{x1D6FC})}{\text{d}\unicode[STIX]{x1D70E}}}\unicode[STIX]{x1D719}(t^{\ast }-\unicode[STIX]{x1D70E})\text{d}\unicode[STIX]{x1D70E}. & \displaystyle\end{eqnarray}$$
4.3 The artificial circulation model (ACM)
As reported in § 3, a motion-induced leading edge vortex is responsible for an intense buildup of the circulation for
 $K_{p}>0.03$
. Both the NVM and SCM fail to predict this additional circulatory effect. To correct this, an additional circulation term is added to the SCM to build the so-called ACM:
 $$\begin{eqnarray}\displaystyle & \displaystyle C_{N}^{ACM}=C_{N}^{SCM}+C_{N}^{AC}. & \displaystyle\end{eqnarray}$$
Results for
 $0^{\circ }{-}90^{\circ }$
pitch ramp motions also showed that the growth of circulation is well correlated to the temporal evolution of the pitch rate, if a small delay is introduced. The additional circulation term is then built as follows:
 $$\begin{eqnarray}\displaystyle & \displaystyle C_{N}^{AC}=A\unicode[STIX]{x03C0}{\displaystyle \frac{\text{d}\unicode[STIX]{x1D6FC}}{\text{d}t^{\ast }}}(t^{\ast }\rightarrow 0)\unicode[STIX]{x1D719}(t^{\ast })+\int _{0}^{t^{\ast }}{\displaystyle \frac{\text{d}A\unicode[STIX]{x03C0}{\displaystyle \frac{\text{d}\unicode[STIX]{x1D6FC}}{\text{d}t^{\ast }}}}{\text{d}\unicode[STIX]{x1D70E}}}\unicode[STIX]{x1D719}(t^{\ast }-\unicode[STIX]{x1D70E})\text{d}\unicode[STIX]{x1D70E}, & \displaystyle\end{eqnarray}$$
introducing an amplitude coefficient
 $A$
, and keeping the Duhamel integral formulation along with the Wagner function used for the other circulatory terms, to account for small delay. The optimization solver ‘fminbnd’ in Matlab was used to find the optimal
 $A$
that minimizes the objective function, defined as the sum of the squared errors of theoretical
 $C_{N}^{ACM}$
(4.14) and a set of experimental data. The solver is based on golden section search and parabolic interpolation (Forsythe, Moler & Malcolm Reference Forsythe, Moler and Malcolm1977).
Evolution of the ‘optimal’ amplitude coefficient
 $A$
(a) and ‘optimal’ LEV centre of pressure
 $x_{\text{LEV}}$
(b) with the reduced pitch rate for 2D and 3D configurations with a pivot point
 $x_{p}=0.5$
. Results in (b) have been obtained using the average optimal coefficient associated with the 2D and 3D results for
 $\unicode[STIX]{x1D6FC}_{max}=90^{\circ }$
:
 $A_{2D,90^{\circ }}=5.7$
and
 $A_{3D,90^{\circ }}=4.67$
.

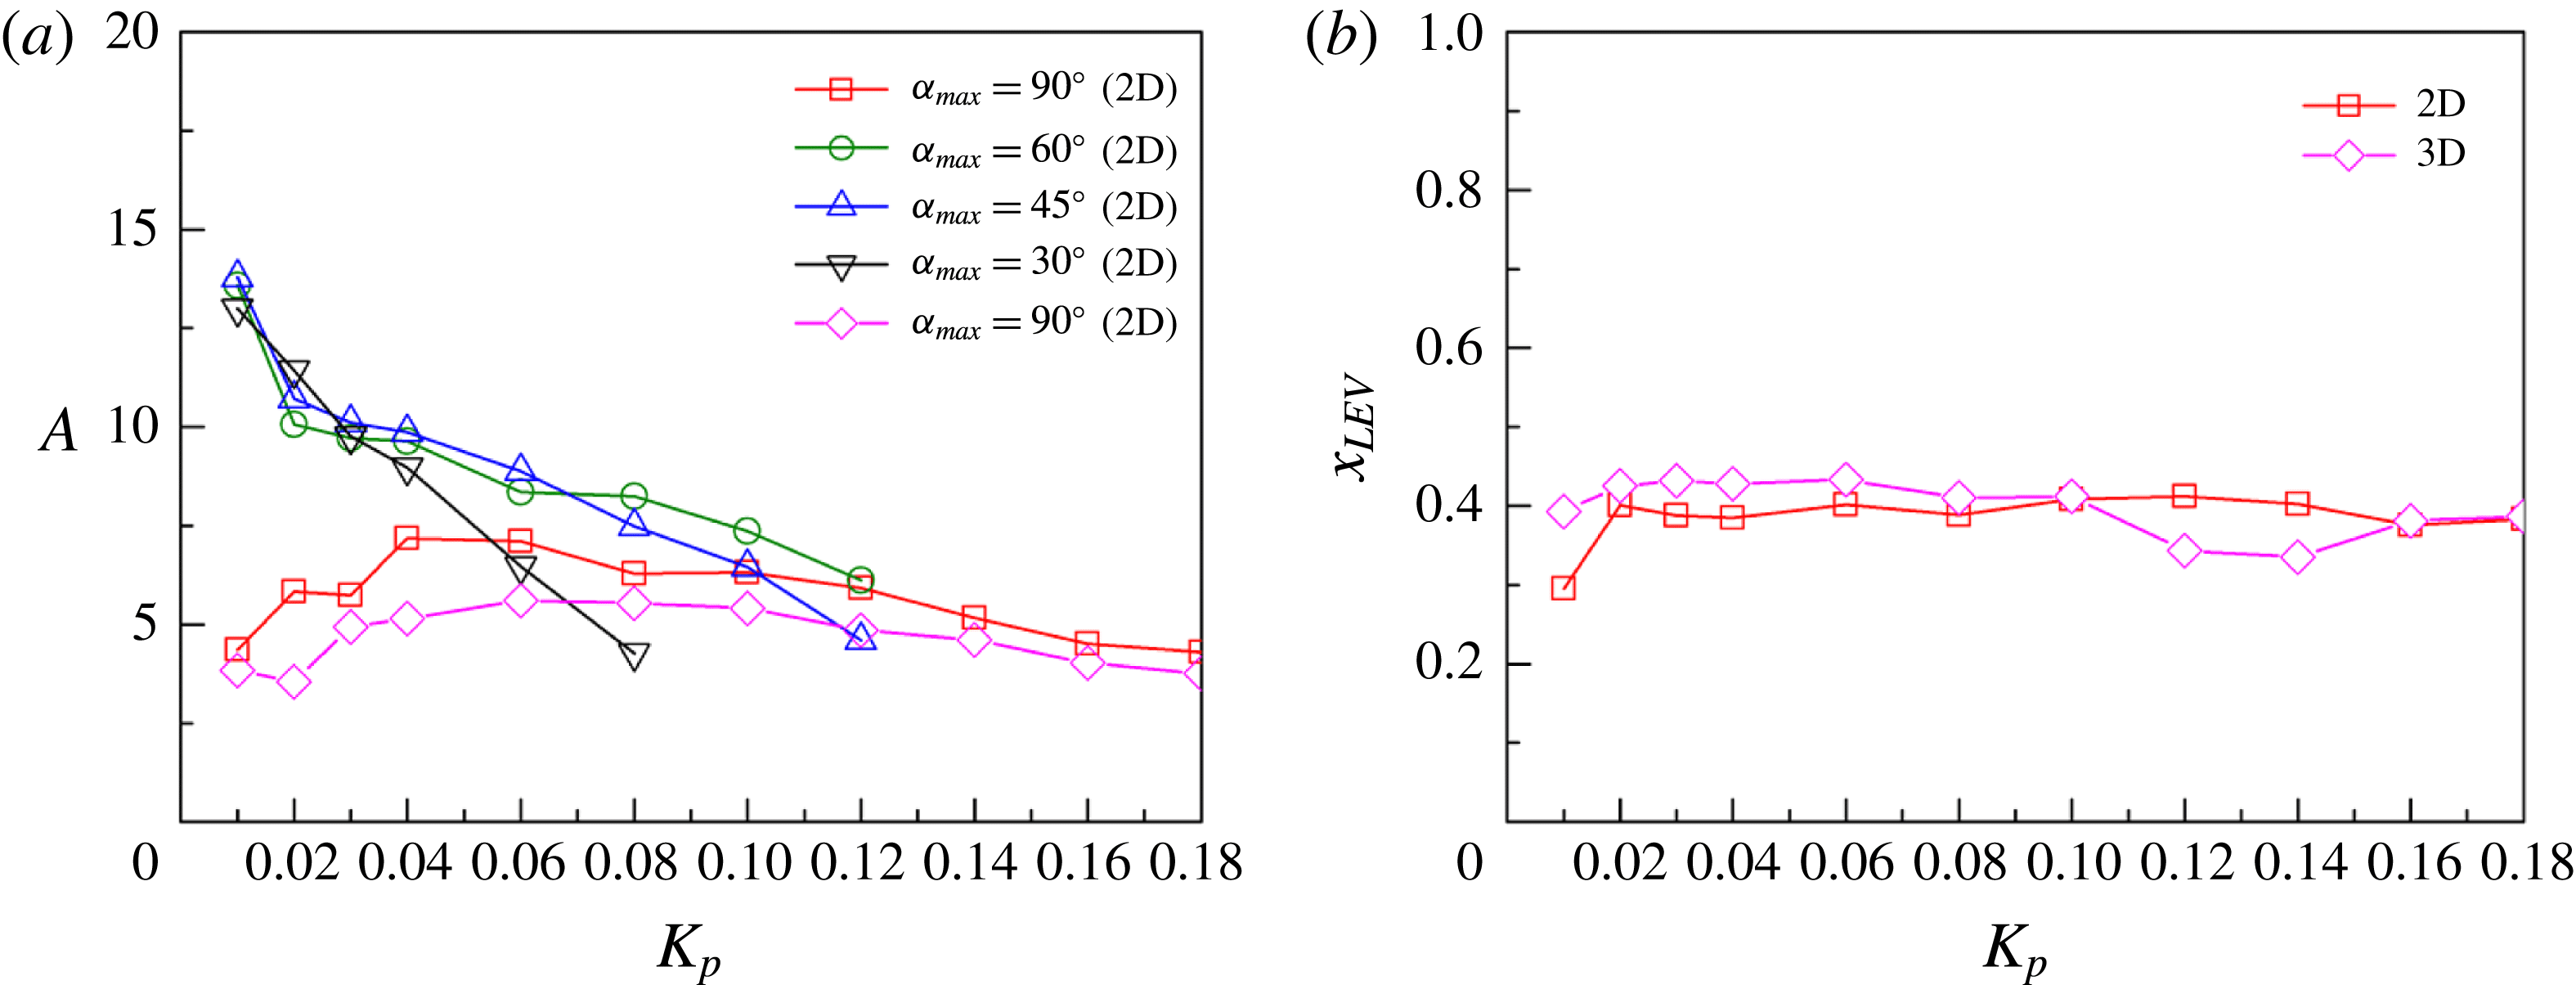
Figure 12 summarizes the optimal
 $A$
found for the various pitch ramp tests associated with figure 11, i.e. pivot point location
 $x_{p}=0.5$
; 2D flat plate for
 $\unicode[STIX]{x1D6FC}_{max}=30^{\circ },45^{\circ },60^{\circ },90^{\circ }$
and 3D flat plate for
 $\unicode[STIX]{x1D6FC}_{max}=90^{\circ }$
. For
 $\unicode[STIX]{x1D6FC}_{max}=90^{\circ }$
in 2D, the optimal value for
 $A$
is closed to 4.4 for
 $K_{p}=0.01$
; it then increases with
 $K_{p}$
up to
 $A\approx 7$
for
 $K_{p}=0.04$
, before gradually decreasing to
 $A\approx 4.4$
for
 $K_{p}=0.18$
. For
 $\unicode[STIX]{x1D6FC}_{max}=90^{\circ }$
in 3D, the optimal
 $A$
follows the same trend, but with slightly lower values, which is consistent with the 3D effect pointed out in § 3.2.2. The average optimal coefficient for the 2D results (
 $\unicode[STIX]{x1D6FC}_{max}=90^{\circ }$
) is
 $A_{2D,90^{\circ }}\approx 5.7$
. For the 3D flat plate (effective ratio 7.88) it is
 $A_{3D,90^{\circ }}=4.67$
.
For moderate-amplitude pitch ramp motion
 $\unicode[STIX]{x1D6FC}_{max}=30^{\circ },45^{\circ },60^{\circ }$
(2D configuration), the evolution of the optimal
 $A$
with
 $K_{p}$
is different. Starting from high values close to 13–14, the optimal
 $A$
almost linearly decreases with
 $K_{p}$
down to 4.5 at
 $K_{p}=0.08$
for
 $\unicode[STIX]{x1D6FC}_{max}=30^{\circ }$
. For
 $\unicode[STIX]{x1D6FC}_{max}=45^{\circ }$
and
 $60^{\circ }$
it also decreases with
 $K_{p}$
, but with a smaller rate beyond
 $K_{p}\approx 0.02$
.
 $A$
reaches a value close to 4.9 at
 $K_{p}=0.12$
for
 $\unicode[STIX]{x1D6FC}_{max}=45^{\circ }$
, while
 $A$
is close to 6 for
 $\unicode[STIX]{x1D6FC}_{max}=60^{\circ }$
at the same reduced pitch rate. This peculiar behaviour of the optimal
 $A$
for
 $\unicode[STIX]{x1D6FC}_{max}\leqslant 60^{\circ }$
probably results from the increased delay between the bump in the normal force coefficient and the pitch rate evolution with time when the maximum angle of attack decreases (keeping the reduced pitch rate constant). Using the standard Wagner function, the ACM formulation proposed in (4.15) does not seem adapted for
 $\unicode[STIX]{x1D6FC}_{max}\leqslant 60^{\circ }$
, leading to a wrong estimation of the amplitude coefficient
 $A$
. This will be discussed in § 5.2.
4.4 Moment coefficient formulations
Like the normal force coefficient, the formulation of the ACM for the moment is built with the sum of five terms:
 $$\begin{eqnarray}\displaystyle & \displaystyle C_{M}^{ACM}=C_{M}^{Trans}+C_{M}^{Rot}+C_{M}^{Cen}+C_{M}^{In}+C_{M}^{AC}, & \displaystyle\end{eqnarray}$$
where the translational term is now based on the static moment coefficient curve, delayed using the Wagner function in the Duhamel integral:
 $$\begin{eqnarray}\displaystyle & \displaystyle C_{M}^{Trans}=C_{M}^{S}(t^{\ast }\rightarrow 0)\unicode[STIX]{x1D719}(t^{\ast })+\int _{0}^{t^{\ast }}{\displaystyle \frac{\text{d}C_{M}^{S}}{\text{d}\unicode[STIX]{x1D70E}}}\unicode[STIX]{x1D719}(t^{\ast }-\unicode[STIX]{x1D70E})\text{d}\unicode[STIX]{x1D70E}. & \displaystyle\end{eqnarray}$$
Following the classical unsteady airfoil theory (Fung Reference Fung2002), it is assumed that the normal force due to the circulatory induced-camber effect acts at the quarter chord. The associated ‘rotational’ moment can then be expressed as
 $$\begin{eqnarray}\displaystyle & \displaystyle C_{M}^{Rot}=C_{N}^{Rot}(x_{p}-0.25). & \displaystyle\end{eqnarray}$$
Linear unsteady airfoil theory also shows that the centrifugal effect induces a normal force acting at the
 $3/4$
-chord, therefore,
 $$\begin{eqnarray}\displaystyle & \displaystyle C_{M}^{Cen}=C_{N}^{Cen}(x_{p}-0.75). & \displaystyle\end{eqnarray}$$
Regarding the acceleration terms, one has to consider the impact of a normal force acting at the mid-chord and an added inertia term (Fung Reference Fung2002):
 $$\begin{eqnarray}\displaystyle & \displaystyle C_{M}^{In}=C_{N}^{In}(x_{p}-0.5)-{\displaystyle \frac{\unicode[STIX]{x03C0}}{16}}{\displaystyle \frac{\text{d}^{2}\unicode[STIX]{x1D6FC}}{{\text{d}t^{\ast }}^{2}}}. & \displaystyle\end{eqnarray}$$
In order to obtain a simple expression for the added circulatory moment one can introduce a centre point of pressure associated with the added circulatory normal force. Following the idea that this additional circulatory contribution is due to the impact of a leading edge vortex, this centre of pressure point is called
 $x_{LEV}$
and the added circulatory moment is defined as
 $$\begin{eqnarray}\displaystyle & \displaystyle C_{M}^{AC}=C_{N}^{AC}(x_{p}-x_{LEV}). & \displaystyle\end{eqnarray}$$
From what is known about the LEV process it seems difficult to define a unique and straightforward value for
 $x_{LEV}$
. Flow-field analyses of Granlund et al. (Reference Granlund, Ol and Bernal2013) and Yu & Bernal (Reference Yu and Bernal2013) suggest that the formation, length and core position of the vortex during the pitch-up motion depend on the reduced pitch rate, pivot point location and amplitude of motion.
 $x_{LEV}$
should then depend on
 $K_{p}$
,
 $x_{p}$
,
 $\unicode[STIX]{x1D6FC}_{max}$
and the reduced time. However, in the present study an attempt to define the best unique value for
 $x_{LEV}$
is made.
Using the average optimal coefficient
 $A_{2D,90^{\circ }}\approx 5.7$
and
 $A_{3D,90^{\circ }}=4.67$
, found previously for
 $\unicode[STIX]{x1D6FC}_{max}=90^{\circ }$
(figure 12
a), optimal
 $x_{LEV}$
are found for each value of the reduced pitch rate
 $K_{p}$
. The optimization procedure is the same as that the one used for
 $A$
: find the optimal
 $x_{LEV}$
that minimizes the objective function defined as the sum of the squared errors of theoretical
 $C_{M}^{ACM}$
in (4.16) and a set of experimental data. Results reported in figure 12(b) show that optimal
 $x_{LEV}$
are nearly constant over the pitch rate range. Average values can then be identified; it is close to 0.39 for the 2D flat-plate configuration and close to 0.4 for the 3D configuration. Those values are in good agreement with Mancini et al. (Reference Mancini, Manar, Granlund, Ol and Jones2015), who quantified the LEV trajectory induced by a surging flat plate at
 $\unicode[STIX]{x1D6FC}=45^{\circ }$
. They noted that the relative distance of the LEV core to the leading edge increases quickly from zero to 0.4, and then remains close to 0.4 although the normal distance of the LEV to the flat plate keeps rising.
For the other two models, namely the NVM and the SCM, the rotational, centrifugal, and inertia terms are the same (see (4.18)–(4.20)). The translational term of the SCM is also the same as that in the ACM (see (4.17)). Finally, it is assumed that the normal force due to the translational circulatory effect acts at the quarter chord for the NVM, so we used
 $$\begin{eqnarray}\displaystyle & \displaystyle C_{M}^{\mathit{Trans\_NVM}}=C_{N}^{\mathit{Trans\_NVM}}(x_{p}-0.25). & \displaystyle\end{eqnarray}$$
5 Models versus experiments
5.1 High-amplitude
 $0^{\circ }{-}90^{\circ }$
pitch ramp motion

In the present section the three models are compared with experiments for the 2D flat-plate configuration in high-amplitude pitch ramp motion (
 $0^{\circ }{-}90^{\circ }$
). For the ACM model, the average optimal values found in the previous section for the amplitude parameter
 $A$
and
 $x_{LEV}$
have been used:
 $A=5.7$
and
 $x_{LEV}=0.39$
.
The measured motion has been used to calculate the angle of attack and its derivatives at each time step. An approximate expression of the Wagner’s function attributed to Jones (Reference Jones1940) has been used:
 $$\begin{eqnarray}\displaystyle & \displaystyle \unicode[STIX]{x1D719}(t^{\ast })=1-0.165\text{e}^{(-0.0455t^{\ast })}-0.355\text{e}^{(-0.3t^{\ast })}. & \displaystyle\end{eqnarray}$$
The recurrence algorithm D-2 proposed by Beddoes (Reference Beddoes1982) was employed to calculate the Duhamel integral. Refer to Leishman (Reference Leishman2006) for a full description of the recurrence method.
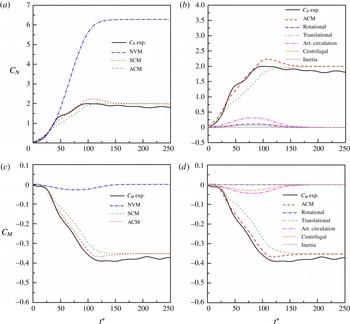
Comparison of the NVM, SCM and ACM models with experiment for the normal force (a) and pitching moment (c) coefficient evolution versus reduced time; contribution of the six terms of the ACM model in the normal force (b) and pitching moment (d) prediction; for a pitch ramp motion with
 $K_{p}=0.02$
,
 $x_{p}=0.25$
and
 $\unicode[STIX]{x1D6FC}_{max}=90^{\circ }$
.

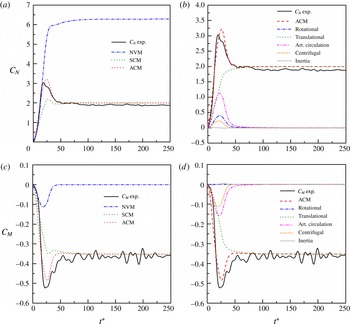
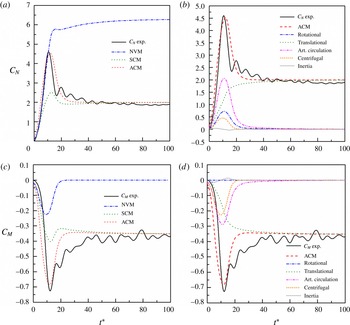
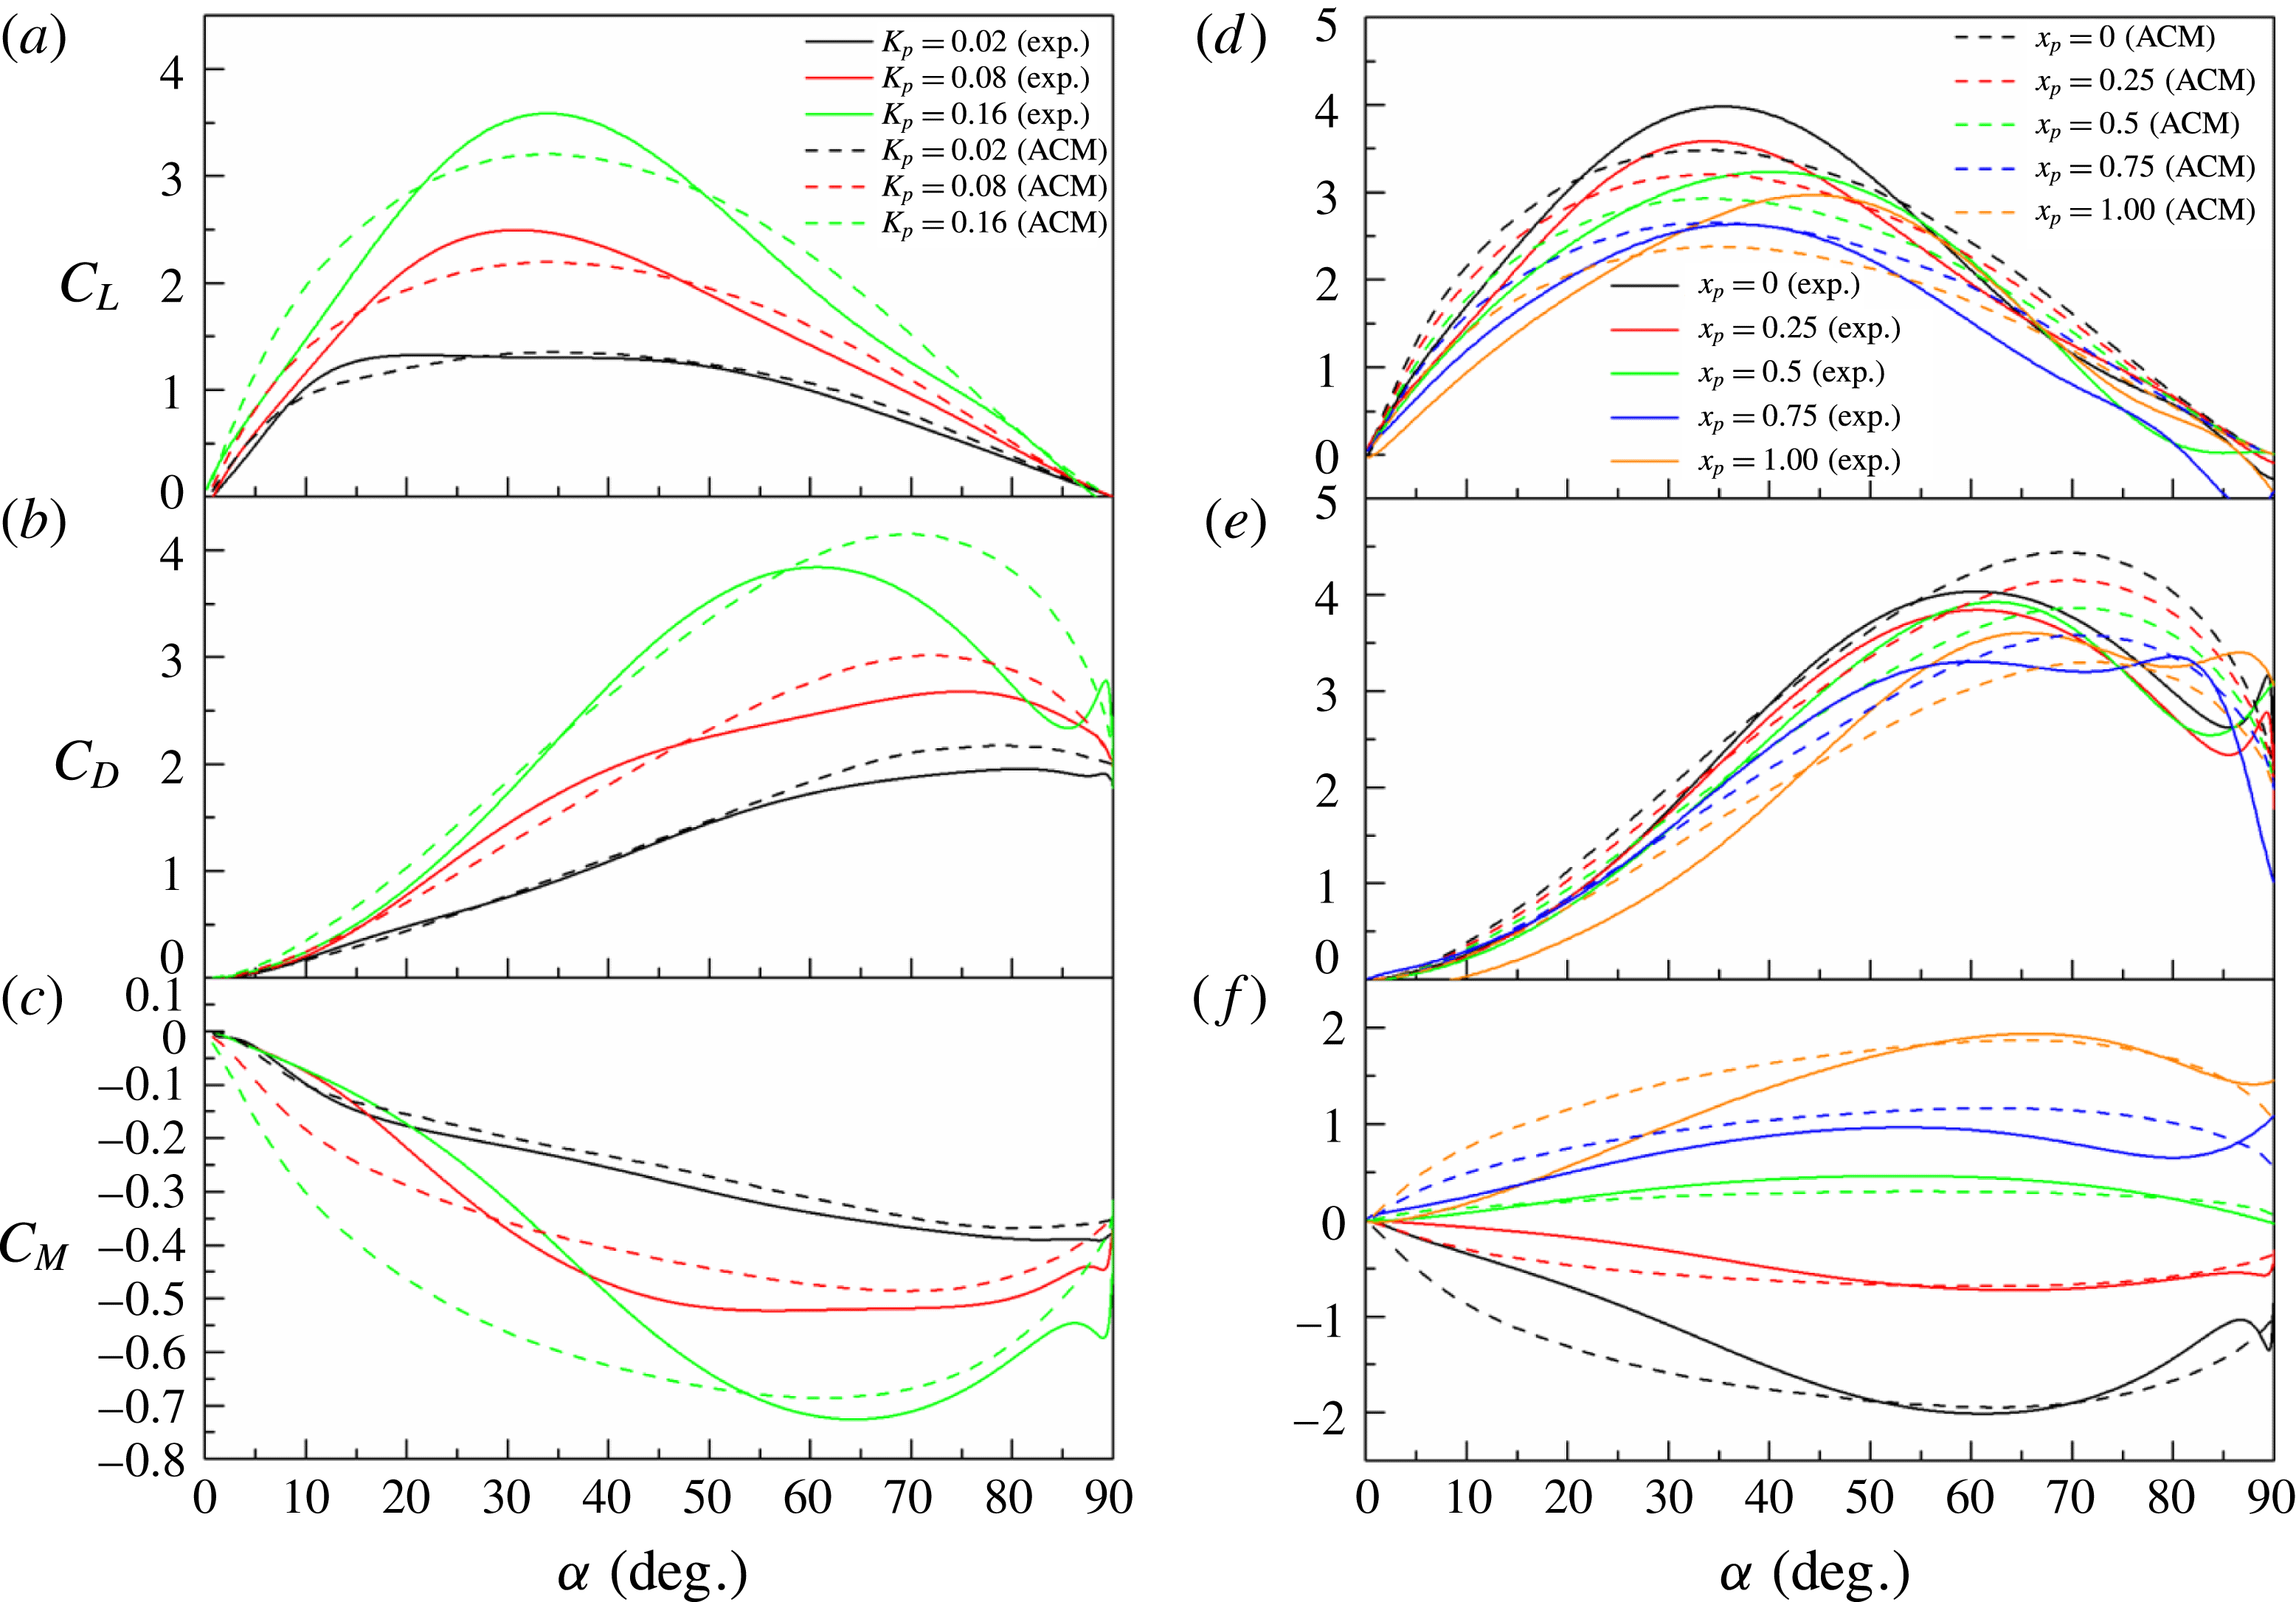
Figures 13, 14 and 15 compare the
 $C_{N}$
and
 $C_{M}$
predicted by the NVM, SCM and ACM with experiments for
 $K_{p}=0.02$
, 0.08 and 0.16,
 $x_{p}=0.25,\unicode[STIX]{x1D6FC}_{max}=90^{\circ }$
. At low reduced pitch rate (
 $K_{p}=0.02$
), the measured
 $C_{N}$
increases almost quadratically with
 $t^{\ast }=0\sim 42$
. After a small bump, the increase is more linear with
 $t^{\ast }=43$
–90. The maximum
 $C_{Nmax}\approx 2$
is reached at
 $t^{\ast }\approx 99$
. Finally,
 $C_{N}$
slightly decreases to reach its
 $90^{\circ }$
value at
 $t^{\ast }\approx 200$
. The NVM predicts the first stage for
 $t^{\ast }<40$
, but it retains a quadratic evolution with
 $t^{\ast }$
for too long and
 $C_{N}$
saturates at an unrealistic value
 $C_{N}=6.3$
at
 $t^{\ast }=140$
. In contrast, the SCM provides a reasonable prediction of the experimental
 $C_{N}$
at both the first stage
 $t^{\ast }<42$
and final stage
 $t^{\ast }>108$
, while the stage between them is underestimated. The ACM corrects that, but induces an overestimation of the maximum
 $C_{Nmax}\approx 2.3$
with a small delay to
 $t_{max}^{\ast }\approx 110$
, in comparison with experiment. The contributions of the different terms of the ACM for
 $C_{N}$
are shown in figure 13(b). The translational part mainly contributes to the response. The artificial circulation term is secondary, but it suggests that a small amount of circulation is necessary to account for the impact of the stall delay at this low reduced pitch rate regime. The rotational, centrifugal and inertial terms are marginal in that case. Figure 13(c,d) display the moments. The experimental
 $C_{M}$
first decreases slowly for
 $t^{\ast }<22$
, and then slumps almost linearly to
 $-0.39$
at
 $t^{\ast }\approx 117$
. Finally,
 $C_{M}$
slightly increases to reach its
 $90^{\circ }$
value at
 $t^{\ast }\approx 200$
. Because the translational term of the NVM is set at the quarter chord, it is not surprising that the NVM remains very low and fails to predict the dynamic moment response. Comparatively, the translational term of
 $C_{M}$
based on the combination of a static moment and the Wagner function in the Duhamel integral formulation allows the SCM to better fit the experiments, as shown in figure 13(c). As for the normal coefficient, the artificial circulation term narrows the gap between the SCM and the experimental results. Figure 13(d) also highlights that the centrifugal term shows a similar trend to that of the artificial circulation term, but with a lower amplitude. As expected, the rotational term is zero at the
 $1/4$
-chord pivot location, and the inertial term is negligible at this low reduced pitch rate.
Comparison of the NVM, SCM and ACM models with experiment for the normal force (a) and pitching moment (c) coefficient evolution versus reduced time; contribution of the six terms of the ACM model in the normal force (b) and pitching moment (d) prediction; for a pitch ramp motion with
 $K_{p}=0.08$
,
 $x_{p}=0.25$
and
 $\unicode[STIX]{x1D6FC}_{max}=90^{\circ }$
.

Comparison of the NVM, SCM and ACM models with experiment for the normal force (a) and pitching moment (c) coefficient evolution versus reduced time; contribution of the six terms of the ACM model in the normal force (b) and pitching moment (d) prediction; for a pitch ramp motion with
 $K_{p}=0.16$
,
 $x_{p}=0.25$
and
 $\unicode[STIX]{x1D6FC}_{max}=90^{\circ }$
.

For intermediate reduced pitch rate (
 $K_{p}=0.08$
) at the same pivot location
 $x_{p}=0.25$
and maximum pitch angle
 $\unicode[STIX]{x1D6FC}_{max}=90^{\circ }$
(figure 14), the first stage where
 $C_{N}$
increases almost quadratically with
 $t^{\ast }$
yields to a maximum
 $C_{Nmax}\approx 3$
at
 $t^{\ast }\approx 18$
. A second bump also appears at
 $t^{\ast }\approx 26$
, probably due to the impact of the LEV. Once the effect of the LEV vanishes, the normal force coefficient quickly decays to recover the steady value
 $C_{N}\approx 2$
at
 $90^{\circ }$
, as shown in figure 14(a). The NVM depicts the first stage of the increasing process of
 $C_{N}$
quite accurately. However, it fails to capture the overshoot and saturates to a non-realistic static value. This final stage is better predicted by the SCM, but the intermediate range in which the impact of the LEV is dominant is vastly underestimated. The ACM corrects that point and better fits the experimental results. Nevertheless, it overestimates the
 $C_{Nmax}$
, which now occurs at
 $t^{\ast }\approx 25$
, i.e. close to the second bump. For this intermediate reduced pitch rate, the aerodynamic response is the consequence of the combined effect of a delay in stall, which is not considered in the ACM model, and that of the LEV, which is modelled here via the added circulatory term.
 $C_{M}$
results are reported in figure 14(c). As before, the NVM fails to predict the response. Both the SCM and ACM converge towards the correct steady value of
 $C_{M}$
, but only the ACM satisfactorily follows the envelope of the experimental results. However, the minimum of the moment coefficient is underestimated. A possible explanation is that the relative distance of the LEV centre of pressure is slightly underestimated. In the present study the mean optimal value
 $x_{LEV}=0.39$
(§ 4.4) has been used. By increasing this value to 0.41, the ACM model predicts the right minimum moment coefficient for the experimental value. Figure 14(b,d) show that the translational term provides the basic bone curve of the ACM. Rotational, centrifugal and artificial circulation terms are responsible for the bump in
 $C_{N}$
, while the bump in
 $C_{M}$
is only due to the centrifugal and added circulation terms. At this intermediate reduced pitch rate, added mass and inertia contributions remain negligible.
Figure 15 displays the results for higher reduced frequency
 $K_{p}=0.16$
. Experimental
 $C_{N}$
exhibits one single maximum
 $C_{Nmax}\approx 4.6$
at
 $t^{\ast }\approx 11$
, followed by a decreasing regime where the normal force recovers its steady value. Experimental
 $C_{M}$
follows the same trend, but the impact of the LEV is characterized by a minimum
 $C_{Mmin}\approx -0.72$
at
 $t^{\ast }\approx 12$
. As before, the NVM overlaps the experiments in the increasing stage of
 $C_{N}$
but saturates at a higher and unrealistic value. The SCM prediction is correct at the beginning and final stage of the response, but fails to predict the impact of the LEV. The benefit of the additional circulation is evident regarding the ACM prediction of both the maximum
 $C_{N}$
and minimum
 $C_{M}$
. However, one can notice that the magnitudes of the aerodynamic loads are overestimated in the first stage of the ramp motion
 $t^{\ast }=0{-}10$
. A possible explanation is an underestimation of the time delay effect in the additional circulation term. The present model accounted for the time history effect using the Wagner function. Associated time scales could then be adjusted for a better prediction at high reduced pitch rate.
Regarding the experimental results for
 $K_{p}=0.08$
and 0.16, one can also notice some oscillations in both the normal force and moment in the recovery region. Those oscillations are due to small vibrations of the set-up at the end of the pitch motion, due to the combined effects of inertia and feedback control when the rotation stops. Therefore, only the relaxation stage of the aerodynamic coefficients was slightly affected. As shown in figure 15, one can also attest that despite those added oscillations the experimental data remain reliable regarding the model identification process performed in the present work.
The theoretical added inertia contribution for both the lift coefficient (4.11) and moment coefficient (4.20) is also worth noting. By definition, inertia effects increase with the pitch rate, but also strongly depend on the smoothing parameter
 $\unicode[STIX]{x1D70E}$
of the ramp definition (2.1). Results reported in figures 15(b) and 15(d) show that the inertia contribution remains very low in the present study, due to the smooth ramp definition (
 $\unicode[STIX]{x1D70E}=0.16$
) and moderate pitch rate range (
 $K_{p}\leqslant 0.18$
).
Comparison of the ACM time-dependant model with the semiempirical models of Strickland & Graham (Reference Strickland and Graham1987) and Granlund et al. (Reference Granlund, Ol and Bernal2013) for pitch ramp motion experiments of
 $K_{p}=0.16$
,
 $x_{p}=0.25,\unicode[STIX]{x1D6FC}_{max}=90^{\circ }$
.

A comparison of the prediction of the ACM with the models of Strickland & Graham (Reference Strickland and Graham1987) and Granlund et al. (Reference Granlund, Ol and Bernal2013) is represented in figure 16. The responses of the lift and drag coefficients are plotted versus the angle of attack. Equations (4.1) and (4.2) with the experimentally determined values of
 $C_{L\,max}$
and
 $C_{D\,max}$
for
 $K_{p}=0.16$
,
 $x_{p}=0.25$
, and
 $\unicode[STIX]{x1D6FC}_{max}=90^{\circ }$
are used to in the model of Strickland & Graham (Reference Strickland and Graham1987). Equations (4.3) and (4.4) calculate the lift and drag coefficients according to Granlund et al. (Reference Granlund, Ol and Bernal2013) using the experimental values of
 $C_{L\,max}^{x_{p}=0.75}$
and
 $C_{D\,max}^{x_{p}=0.75}$
for
 $x_{p}=0.75$
. Figure 16 highlights the benefits and deficiencies of the ACM. The main benefit is clearly a better prediction of the response at high angle of attack
 $\unicode[STIX]{x1D6FC}>45^{\circ }$
. This is particularly evident regarding the drag coefficient, which is overestimated at high angle of attack with both the semiempirical algebraic models, while the ACM captures the saturation and drop of
 $C_{D}$
. Nevertheless, the
 $C_{Dmax}$
and its corresponding angle of attack are slightly overestimated. In contrast, the lift coefficient
 $C_{Lmax}$
is underestimated in comparison with experiments. Figure 15 shows that the
 $C_{Nmax}$
predicted by the ACM model is slightly underestimated. It is also slightly delayed in time, and thus appears at a higher angle of attack. The cosine projection that reduces the
 $C_{L}$
value at high angle of attack can then explain the underestimation of the
 $C_{Lmax}$
in figure 16, while the sine projection enlarges the
 $C_{Dmax}$
value.
Lift (a), drag (b) and pitching moment (c) coefficient evolution with the angle of attack for
 $x_{p}=0.25,\unicode[STIX]{x1D6FC}_{max}=90^{\circ }$
and
 $K_{p}=0.02$
, 0.08 and 0.16; lift (d), drag (e) and pitching moment (f) coefficient evolution with the angle of attack for
 $\unicode[STIX]{x1D6FC}_{max}=90^{\circ }$
,
 $K_{p}=0.16$
and five pivot axis positions
 $x_{p}=0$
, 0.25, 0.5, 0.75, 1; comparison of the ACM model with experiment.

ACM predictions for the lift, drag and moment coefficient as a function of the angle of attack are compared with experiment in figure 17(a–c), for three reduced pitch rates
 $K_{p}=0.02$
, 0.08 and 0.16,
 $x_{p}=0.25$
, and
 $\unicode[STIX]{x1D6FC}_{max}=90^{\circ }$
. Qualitatively the ACM captures the main effect of the reduced pitch rate: increase of the overshoot in
 $C_{L}$
,
 $C_{D}$
and
 $C_{M}$
along with a coherent shifting of the associated angle of attack with
 $K_{p}$
. Quantitatively, the main problem of the ACM is the above-mentioned delayed angle of attack at which
 $C_{Nmax}$
is attained, which leads to the underestimation of
 $C_{Lmax}$
after the cosine projection. One can also notice an overestimation of the first-stage response in
 $C_{L}$
and
 $C_{M}$
when
 $K_{p}$
increases. As discussed previously, regarding the temporal results in figure 15, this could be the consequence of a prediction of the first-stage response slightly in advance in comparison with experiment, probably due to a failure to predict the delay between the LEV formation and the pitch rate in the time-dependent formulation.
Figure 17(d–f) shows the ability of the ACM to predict the effect of the pivot point location on the responses of the lift, drag and moment coefficients with the angle of attack. ACM results are plotted with experiments for
 $x_{p}=0,0.25,0.5,0.75$
and 1,
 $K_{p}=0.16$
, and
 $\unicode[STIX]{x1D6FC}_{max}=90^{\circ }$
. The qualitative agreement is good. As pointed out previously, the
 $C_{Lmax}$
is underestimated but the ACM captures its decrease as the pivot point location moves towards the trailing edge. Not surprisingly, the ACM does not predict the singular behaviour experimentally observed for
 $x_{p}=1$
. Indeed, the pivot point-dependent term is proportional to the relative distance between the pivot point and the
 $3/4$
-chord location. The ACM also predicts an increase of the angle of attack at which
 $C_{Lmax}$
and
 $C_{Dmax}$
occur when the pivot point moves towards the trailing edge, but lower than the one observed in experiments. Finally, the general trend of the
 $C_{M}$
evolution with the angle of attack is also rather convincing, but a better prediction of the first stage of the dynamic response could be done.
Lift (a), drag (b) and pitching moment (c) coefficient evolution with the angle of attack for
 $x_{p}=0.5$
,
 $K_{p}=0.08$
, and three maximum pitch angle
 $\unicode[STIX]{x1D6FC}_{max}=45^{\circ },60^{\circ },90^{\circ }$
. The amplitude coefficient
 $A=5.7$
has been used for
 $\unicode[STIX]{x1D6FC}_{max}=90^{\circ }$
. It has been adjusted according to figure 12(a) for
 $\unicode[STIX]{x1D6FC}_{max}<90^{\circ }$
:
 $A=8.24$
for
 $\unicode[STIX]{x1D6FC}_{max}=60^{\circ }$
and
 $A=7.49$
for
 $\unicode[STIX]{x1D6FC}_{max}=45^{\circ }$
. A unique value for the LEV centre of pressure,
 $x_{LEV}=0.39$
, has been used for
 $\unicode[STIX]{x1D6FC}_{max}=45^{\circ },60^{\circ },90^{\circ }$
.

5.2 Moderate-amplitude pitch ramp motion
In figure 18, ACM predictions are compared with the experimental results for pitch ramp motions with pivot point location
 $x_{p}=0.5$
, moderate pitch rate
 $K_{p}=0.08$
, and three different maximum angles of attack,
 $\unicode[STIX]{x1D6FC}_{max}=45^{\circ }$
,
 $60^{\circ }$
and
 $90^{\circ }$
. For
 $\unicode[STIX]{x1D6FC}_{max}=90^{\circ }$
, the average amplitude coefficient
 $A=5.7$
, determined in § 4.3, has been used. The amplitude coefficient has been adjusted for
 $\unicode[STIX]{x1D6FC}_{max}<90^{\circ }$
according to figure 12(a):
 $A=8.24$
has been used for
 $\unicode[STIX]{x1D6FC}_{max}=60^{\circ }$
and
 $A=7.49$
for
 $\unicode[STIX]{x1D6FC}_{max}=45^{\circ }$
. For the moment coefficient model, a unique value for the LEV centre of pressure,
 $x_{LEV}=0.39$
, has been used for
 $\unicode[STIX]{x1D6FC}_{max}=45^{\circ }$
,
 $60^{\circ }$
and
 $90^{\circ }$
.
Results for the drag are in good agreement with experiments for
 $\unicode[STIX]{x1D6FC}_{max}=60^{\circ }$
and
 $90^{\circ }$
. However, for
 $\unicode[STIX]{x1D6FC}_{max}=45^{\circ }$
, the overshoot in drag is underestimated. For the lift coefficient, the gap between the ACM prediction and experiment increases for lower values of
 $\unicode[STIX]{x1D6FC}_{max}$
. As pointed out previously, the ACM fails to predict the correct delay between the circulation buildup and the pitch rate in the time-dependent formulation. As a consequence, the magnitude of the lift is overestimated at the beginning of the ramp motion and the model predicts an overshoot at lower angle of attack. Moment coefficient results also highlight significant discrepancies. For
 $\unicode[STIX]{x1D6FC}_{max}=90^{\circ }$
the ACM model underestimates the response for angle of attack below
 $45^{\circ }$
and fails to predict the maximum experimentally observed close to
 $30^{\circ }$
. The model prediction is slightly better for
 $\unicode[STIX]{x1D6FC}_{max}=60^{\circ }$
. For
 $\unicode[STIX]{x1D6FC}_{max}=45^{\circ }$
a singular experimental behaviour is observed. The moment coefficient first increases, reaches a plateau for
 $20^{\circ }<\unicode[STIX]{x1D6FC}<30^{\circ }$
and exhibits a rather sharp bump with a maximum close to
 $\unicode[STIX]{x1D6FC}=42^{\circ }$
. This peculiar behaviour can be due to the mechanical vibrations of the set-up. The ACM fails to predict that, and largely overestimates the moment coefficient evolution with the angle of attack.
5.3 Comparison with experiments for sharper ramp motions and higher reduced pitch rates
The aim of this section is to evaluate the proposed ACM for sharper ramp motions and higher pitch rates. Such experimental results can be found in Granlund et al. (Reference Granlund, Ol and Bernal2013) for a flat-plate model of thickness-to-chord ratio 2 %, round leading and trailing edge, and a physical aspect ratio of 6. Granlund and co-authors’ experiments were conducted in a water tunnel at a Reynolds number
 $Re=2\times 10^{4}$
, for a 2D (i.e. wall-to-wall) flat-plate model experiencing
 $0^{\circ }{-}90^{\circ }$
pitch ramp motions. In the present section the ACM is compared with their experimental results for a pivot location at the leading edge, sharp ramp motion characterized by a smoothing parameter of
 $\unicode[STIX]{x1D70E}=0.9$
, and reduced pitch rates
 $K_{p}$
up to 0.5.
Evolution of the lift (a) and drag (b) coefficient with the angle of attack for
 $x_{p}=0,\unicode[STIX]{x1D6FC}_{max}=90^{\circ }$
and
 $K_{p}=0.1,0.2,0.3$
and 0.5; comparison of the ACM model with experimental results in Granlund et al. (Reference Granlund, Ol and Bernal2013); 2D flat plate of thickness-to-chord ratio 2 %, round leading and trailing edges, sharp pitch ramp motion (
 $\unicode[STIX]{x1D70E}=0.9$
) at
 $Re=2\times 10^{4}$
.

The ACM is implemented according to the experimental conditions in Granlund et al. (Reference Granlund, Ol and Bernal2013). The pitch ramp motion is calculated using the revised hyperbolic-cosine function (2.1) with a smoothing parameter
 $\unicode[STIX]{x1D70E}=0.9$
. The translational circulatory term
 $C_{N}^{Trans}$
(4.13) has been calculated using the steady aerodynamic curve provided in Granlund et al. (Reference Granlund, Ol and Bernal2013). Based on a set of four unsteady experimental results, i.e.
 $K_{p}=0.1,0.2,0.3$
and 0.5 for
 $\unicode[STIX]{x1D6FC}_{max}=90^{\circ }$
and
 $x_{p}=0$
, an average amplitude coefficient
 $A\approx 3.1$
for the additional circulation term (4.15) has been identified using the optimal method described in § 4.3. Figure 19 compares the lift and drag coefficients predicted by the ACM with the experimental results of Granlund et al. (Reference Granlund, Ol and Bernal2013). Qualitatively the ACM model is in good agreement with experiments. However, quantitatively one can notice a few discrepancies. Thanks to the inertia term (4.11), the ACM predicts the impact of fast non-circulatory load, i.e. initial spike in lift and final decline in drag, due to the large initial acceleration and final deceleration of the sharper pitch ramp motion. However, it overestimates the initial spike in lift (figure 19
a), and for
 $K_{p}=0.5$
the predicted maximum lift coefficient due to the initial acceleration is more than 50 % higher than that for experiment. However, the effect of the strong deceleration that is responsible for the abrupt decrease of the drag coefficient at the end of the ramp motion is satisfactorily predicted by the ACM (figure 19
b). The extension of the constant-pitch-rate stage for sharper ramp motions also leads the ACM to overestimate and flatten the lift coefficient for
 $\unicode[STIX]{x1D6FC}<30^{\circ }$
. As a consequence, the maximum lift coefficient is hard to identify with the model. This is due to the formulation of the additional circulation term, for which the time-varying input function is proportional to the pitch rate. This formulation also affects the prediction of the drag coefficient, which is overestimated with the ACM for
 $\unicode[STIX]{x1D6FC}>60^{\circ }$
.
Regarding the amplitude coefficient value,
 $A=3.1$
, which has been identified using the set of pitch ramp experiments plotted in figure 19 (i.e. for
 $K_{p}=0.1,0.2,0.3$
and 0.5), one can make a few comments. It is lower than the value identified in § 4.3 –
 $A=5.7$
based on the experiments that have been conducted in a wind tunnel for a 2D flat plate at moderate pitch rate
 $K_{p}\leqslant 0.18$
. Figure 20 compares the evolution of the maximum lift coefficient observed in Granlund et al. (Reference Granlund, Ol and Bernal2013) for
 $K_{p}=0.01{-}0.5$
,
 $\unicode[STIX]{x1D6FC}_{max}=90^{\circ }$
and
 $x_{p}=0$
, with the one observed in the present study for
 $K_{p}\leqslant 0.18$
. For
 $K_{p}\leqslant 0.1$
our results are close to the ones observed by Granlund and co-authors. They depart significantly for
 $K_{p}\geqslant 0.2$
. What is more, those results suggest that the maximum lift coefficient evolution with the reduced pitch rate has two quasi-linear regimes. The first one, for
 $K_{p}\leqslant 0.1$
, where a linear regression using our wind tunnel results gives a slope close to 21. And the second one, for
 $K_{p}>0.1$
, for which the linear slope decreased as shown in figure 20. For
 $0.18\geqslant K_{p}>0.1$
a linear regression using the wind tunnel results gives a slope close to 15.4. Using the water tunnel results for
 $K_{p}=0.1{-}0.5$
the slope is lower, with a value close 10.4. Anyway, those results suggest that the amplitude coefficient should be adjusted for
 $K_{p}>0.1$
, and an amplitude coefficient,
 $A=3.1$
, has been identified using the unsteady results of Granlund et al. (Reference Granlund, Ol and Bernal2013), as plotted in figure 19. In this figure the ACM prediction for
 $K_{p}=0.1$
has also been plotted for
 $A=5.7$
. It shows that the amplitude coefficient associated with the lower pitch rate regime still works well to capture the maximum lift coefficient at this intermediate reduced pitch rate.
Evolution of the maximum lift coefficient with the reduced pitch rate for
 $\unicode[STIX]{x1D6FC}_{max}=90^{\circ }$
and
 $x_{p}=0$
; (squares) present study, 2D flat plate of thickness-to-chord ratio 4.86 %, sharp edges, smooth pitch ramp motion (
 $\unicode[STIX]{x1D70E}=0.16$
) at
 $Re\approx 1.45\times 10^{4}$
; (circles) Granlund et al. (Reference Granlund, Ol and Bernal2013), 2D flat plate of thickness-to-chord ratio 2 %, round leading and trailing edges, sharp pitch ramp motion (
 $\unicode[STIX]{x1D70E}=0.9$
) at
 $Re=2\times 10^{4}$
.

5.4 Discussion
The ACM which has been proposed in the present study is a time-dependent model mainly based on the indicial response method. It can be seen as an improvement of the time-dependent model proposed in Taha et al. (Reference Taha, Hajj and Beran2014), which accounts for the nonlinear variation of steady aerodynamics. The major improvement is the addition of a circulation term in order to better capture the overshoot of the normal force during the pitch ramp motion. We have also proposed the same formulation for the moment coefficient, introducing a LEV centre of pressure point. Results for
 $0^{\circ }{-}90^{\circ }$
pitch ramp motions have shown that the growth of circulation is closely linked to the temporal evolution of the pitch rate. Accordingly, the additional circulation was modelled using Duhamel superposition with the Wagner function and a time-varying input function proportional to the pitch rate. This model introduces a unique amplitude coefficient
 $A$
.
Based on various sets of experimental data for
 $\unicode[STIX]{x1D6FC}_{max}=90^{\circ }$
and moderate pitch rate
 $K_{p}\leqslant 0.18$
, an average amplitude coefficient
 $A\approx 5.7$
has been identified for a 2D flat-plate configuration at
 $Re\approx 1.45\times 10^{4}$
. When compared with experiments, it gives a better prediction of the impact of the LEV on the aerodynamic forces and moment. For the 3D configuration (flat plate with an effective aspect ratio of 7.88) in pitch ramp motion with
 $\unicode[STIX]{x1D6FC}_{max}=90^{\circ }$
, the average amplitude coefficient
 $A$
was found to be 18 % smaller than in 2D, and the LEV centre of pressure,
 $x_{LEV}$
, was also close to 0.4. The ACM predictions in both lift and drag coefficients have also been compared with experimental results for sharper ramp motions and higher pitch rates from Granlund et al. (Reference Granlund, Ol and Bernal2013). It gives satisfactory results, at least qualitatively, up to
 $K_{p}=0.5$
, but the amplitude coefficient used in the ACM has to be adapted for
 $K_{p}>0.1$
. An amplitude coefficient value
 $A\approx 3.1$
has been found.
Several points can be highlighted for further improvements:
(i) At low reduced pitch rate
$K_{p}\leqslant 0.03$
, the aerodynamic response is ruled by a stall delay effect. The latter could be included in the time-dependent formulation, as in the dynamic stall formulation of Leishman & Beddoes (Reference Leishman and Beddoes1989) or Sheng, Galbraith & Coton (Reference Sheng, Galbraith and Coton2008).(ii) Results for high-amplitude
$0^{\circ }{-}90^{\circ }$
smooth pitch ramp motions showed that for the highest pitch rate that has been tested in wind tunnel,
$K_{p}=0.18$
, the magnitudes of the aerodynamic loads are overestimated in the first stage of the ramp motion. A possible explanation was an underestimation of the time delay effect in the additional circulation term. This could be corrected by using a modified Wagner function for which the time scales would depend on
$K_{p}$
.(iii) Overestimations of the lift coefficient response at the first stage of the ramp motion have also been observed when compared to sharper ramp motions and higher pitch rates (
$K_{p}$
up to 0.5). On the one hand, the fast non-circulatory spike in lift is overestimated by the inertia term of the model. On the other hand, the added circulation term for which the time-varying input function is proportional to the pitch rate overestimates and flattens the lift coefficient response. Regarding the circulatory effects, the NVM could be an alternative for sharper ramp motions. But a criterion must be found to predict the angular position of the overshoot and then initiate a recovery process to the steady-state value.(iv) Results for moderate-amplitude pitch ramp motion,
$\unicode[STIX]{x1D6FC}_{max}\leqslant 60^{\circ }$
, also showed that the ACM failed to faithfully predict the time, and thus the angle of attack, at which the overshoot of the normal force coefficient occurred. Again, the classical formulation of the Wagner function, which works well for unsteady linear aerodynamics, does not seem adapted to predict the correct delay between the impact of the LEV and the temporal evolution of the pitch rate. This could be fixed using a modified Wagner function for which the time scales would depend on
$\unicode[STIX]{x1D6FC}_{max}$
.(v) Regarding the effect of the pivot point location, the ACM does not predict the singular behaviour experimentally observed for
$x_{p}=1$
. This could be partially corrected using an absolute distance (instead of a relative distance) between the pivot point and the
$3/4$
-chord point location, in the corresponding term of the model. But further investigation needs to be done to clarify this specific point. Results also showed that a better prediction of the impact of the LEV with time, in both amplitude and position along the chord, would be necessary to better capture the response of lift and moment as the pivot point location changes.(vi) Effects of the wing section also need to be clarified. According to Gault (Reference Gault1957), three types of stall behaviour can be observed depending on the wing section: thin-airfoil stall, leading edge stall and trailing-edge stall. Both the thin-airfoil stall and the trailing-edge stall are known to be smooth. For a wing section characterized by a trailing-edge stall, results should be close to those one observed for the flat plate. For a wing section characterized by a sharper leading edge stall, it is not so obvious. Part of the steady stall effect could be taken into account by using the wing section steady aerodynamic curves in the ACM model, but a better description of the dynamic stall delay mechanism and its possible interaction with the LEV process might be necessary.
(vii) Regarding the wing aspect ratio and planform shape, the main effects could be addressed by the model, using the corresponding steady aerodynamic curves and identifying the amplitude coefficient and LEV centre of pressure with specific dynamic tests. But further investigations would be necessary to clarify that point.
(viii) The impact of the Reynolds number is low for the flat-plate geometry (Ol et al. Reference Ol, Altman, Eldredge, Garmann and Lian2010), but could be significant for other wing sections. Again, this effect could be partially addressed by using appropriate steady aerodynamics.


6 Conclusions
This paper is focused on the unsteady aerodynamic forces and moment on a flat plate undergoing high-amplitude pitch motions. Symmetric constant acceleration–deceleration pitch ramp motion was used. The experimental tests were carried out in wind tunnel at
 $Re=1.45\times 10^{4}$
. The effects of reduced pitch rate, pivot axis location and maximum pitch angle were examined. The results for a flat plate with effective aspect close to 8 (so-called 3D configuration) were also compared with 2D experiments.
Wind tunnel steady tests confirmed the smooth stall behaviour of the flat-plate model. 3D results showed only small differences from the 2D results, suggesting that the tip vortex for the flat plate with effective ratio close to 8 was rather small.
Dynamic tests were conducted for pitch ramp motion from
 $0^{\circ }$
to
 $90^{\circ }$
, reduced pitch rate ranging from 0.01 up to 0.18, and different pivot axis locations between the leading and the trailing edge. Experimental results are in agreement with previous studies. For pitch rates lower than 0.03, the unsteady aerodynamic is limited to a stall delay effect. For higher pitch rates the dynamic response is dominated by a buildup of the circulation, increasing with the pitch rate. This circulatory effect induces an overshoot in the lift, drag and moment coefficients. For
 $K_{p}=0.18$
and a pivot point location at the mid-chord,
 $C_{Lmax}\approx 3.4$
at
 $\unicode[STIX]{x1D6FC}\approx 41^{\circ }$
which is 3.2 times the maximum steady lift coefficient,
 $C_{Dmax}\approx 4.2$
at
 $\unicode[STIX]{x1D6FC}\approx 62^{\circ }$
, which is more than twice the maximum steady drag coefficient, and
 $C_{Mmax}\approx 0.7$
at
 $\unicode[STIX]{x1D6FC}\approx 55^{\circ }$
, which is more than five times the maximum steady moment coefficient. The impact of the overshoot is slightly reduced in the 3D configuration. For low reduced pitch rates (
 $K_{p}\leqslant 0.06$
), the effect of the pivot point location turned out to be very low on the lift and drag response. It was more pronounced for higher reduced pitch rates, for which the impact of the LEV was found to increase with the absolute distance between the pivot axis and the
 $3/4$
-chord location.
Additional tests were performed for pitch-up and pitch-down ramp motion with different maximum angles of attack
 $\unicode[STIX]{x1D6FC}_{max}=30^{\circ }$
,
 $45^{\circ },60^{\circ },90^{\circ }$
. Hysteresis loops were observed, and the hysteresis increased with the maximum angle of attack. The evolution of maximum lift coefficients and associated angle of attack with the reduced pitch rate
 $K_{p}$
also confirmed that the reduced pitch rate plays a dominant role. Both the maximum lift and angle of attack firstly increase with
 $K_{p}$
, and the curves for different
 $\unicode[STIX]{x1D6FC}_{max}$
nearly collapse. However, the saturation of both
 $C_{Lmax}$
and the angle of attack at which this maximum is attained occurs at lower
 $K_{p}$
when
 $\unicode[STIX]{x1D6FC}_{max}$
decreases.
Three time-dependent models which are mainly based on the indicial response method were tested. The first one, namely the NVM, is a simple extension of the unsteady lift formulation to arbitrary pitch motion. This model uses the Wagner function and a time-varying input function proportional to the normal velocity variation at the
 $3/4$
-chord point. It predicts the first increasing stage of the normal force response fairly well, but saturates at unrealistic high values. The second one, named SCM, is close to the one proposed in Taha et al. (Reference Taha, Hajj and Beran2014). In comparison with the NVM it better accounts for the translational circulatory term by including the steady aerodynamic curve in the Duhamel integral. As a consequence, the final stages of the forces and moment response are better predicted, while the model fails to predict the impact of the LEV. The third model, namely the ACM, is an improvement of the SCM, using an additional circulation which depends on the pitch rate and introducing an amplitude parameter that needs to be identified through dynamic tests. It gives a better prediction of the impact of the LEV. The comparison with the semiempirical model of Strickland & Graham (Reference Strickland and Graham1987) and Granlund et al. (Reference Granlund, Ol and Bernal2013) showed a real improvement at high angles of attack (
 $\unicode[STIX]{x1D6FC}>45^{\circ }$
) for both the drag and lift coefficient responses to high-amplitude (
 $90^{\circ }$
) pitch ramp motion. This new time-dependent model also satisfactorily captures the effects of both the reduced pitch rate and pivot point location experimentally observed in our wind tunnel tests.
Additional comparisons of the ACM predictions with experimental results from Granlund et al. (Reference Granlund, Ol and Bernal2013) have also shown a qualitative agreement in both lift and drag coefficient response for sharper ramp motions and higher pitch rates (up to
 $K_{p}=0.5$
). It was also highlighted that the maximum lift coefficient evolution with the reduced pitch rate has two quasi-linear regimes and that the amplitude coefficient has to be adjusted accordingly. Values of
 $A=5.7$
(low to moderate pitch rate regime,
 $K_{p}\leqslant 0.1$
) and
 $A=3.1$
(high pitch rate regime,
 $K_{p}>0.1$
) have been pointed out for the 2D flat plate.
Several points have also been highlighted for further improvement of the model. A dynamic stall formulation could be added to correct the translational circulatory term and better predict the responses at low reduced pitch rates (
 $K_{p}\leqslant 0.03$
). Results at higher pitch rates also showed that a better formulation of the impact of the LEV with time, both in amplitude and position along the chord, would improve the prediction of the lift and moment response, particularly for pitch ramp motion of moderate pitch amplitude. Finally, better formulations of both the non-circulatory and circulatory loads have to be found for sharp ramp motions, in order to better predict the fast non-circulatory spike due to a large initial acceleration and the overshoot due to the pitch-rate-induced circulation.
Acknowledgements
Y.Y. gratefully acknowledges financial support by the State Scholarship Fund from China Scholarship Council (grant 201506230015).