I. INTRODUCTION
The most common technology currently used for proton exchange membrane fuel cells (PEMFCs) utilizes Pt deposited on colloidal carbon black to function as the cathode material. This current electrode technology, while effective in its design, suffers from a number of well-known challenges. The first is carbon corrosion.Reference Wang, Yin, Shao, Zhang, Wang and Gao1, Reference Ioroi, Senoh, Yamazaki, Siroma, Fujiwara and Yasuda2 Carbon corrosion is caused by the oxidization of carbon over time while functioning as a catalyst support material for Pt. Carbon corrosion can cause the supported Pt to be released from the support material and agglomerate with other Pt catalyst particles. This agglomeration limits the catalyst surface area that can be accessed by gases such as oxygen, which, in turn, leads to the degradation of overall fuel cell efficiency.
The second issue is electrode flooding (a topic reviewed by Li et al.Reference Li, Tang, Wang, Shi, Wu, Song, Zhang, Fatih, Zhang, Wang, Liu, Abouatallah and Mazza3). As a fuel cell cathode catalyzes the oxygen reduction reaction (ORR) O2 + 4H+ + 4e− → 2H2O, which combines hydrogen and oxygen, the resulting water must be transported out of the system. For this to take place efficiently, the catalyst support material must be structured to provide adequate gas transport pathways to prevent overaccumulation of water on the catalyst material surface. If too much accumulation occurs, the resulting water will begin to block the active Pt sites, which leads to increased local potentials at the carbon–catalyst interface and reduces the efficiency of the electrode.
A strategy for overcoming these two issues involves changing both the catalyst support material and the structure of that material. In searching for a new material, there are several requirements that are important to consider. First, the material should be conductive enough to potentially allow for ultralow Pt loadings on the surface. Second, the material should bond well with Pt and be chemically stable in an oxidizing environment so as to maintain both adhesion and a conductive link to the Pt for the life of the fuel cell (i.e., no carbon corrosion). Third, the material must be structured to provide the needed gas pathways in the electrode, which will minimize water accumulation thereby preventing electrode flooding. It is anticipated that this will be accomplished by making structures that have high aspect ratios.
A. Substoichiometric TiO2
Substoichiometric TiO2 has been suggested as a possible PEMFC catalyst support material.Reference Ioroi, Senoh, Yamazaki, Siroma, Fujiwara and Yasuda2 This is so because it is known to exhibit good conductivity, stability, and corrosion resistance.Reference Ioroi, Senoh, Yamazaki, Siroma, Fujiwara and Yasuda2, Reference Li, Zhu, Qu, Wang, Hui, Zhang and Zhang4–Reference Farndon and Pletcher11 An interesting characteristic of TiO2 is that it has many substoichiometric forms. One of its more desirable characteristics is that it shows a large increase in conductivity with only slightly reduced stoichiometries. The most popular of these are commonly referred to as the Magneli phases, which are represented according to the formula TinO2n−1. As reported elsewhere,Reference Hayfield12 substoichiometric TiO2 (referred to hereafter as TiOx) shows a large increase in conductivity when the oxygen to titanium (O/Ti) ratio is in the range of ∼1.65–1.95. It was shown that an O/Ti ratio of 1.75 (i.e., Ti4O7) demonstrates the highest conductivity in this range. Since this high conductivity occurs with only a small reduction in oxygen (e.g., there are seven Ti–O bonds for every Ti–Ti bond in Ti4O7), much of the chemical stability is maintained.
In addition, Pt activity has been shown to improve when supported by TiOx due to the strong metal–support interaction.Reference Jennison, Dulub, Hebenstreit and Diebold13–Reference Lee, Alhosan, Yohe, Macy and Smyrl16 The current work compares techniques for manufacturing conductive high aspect ratio TiOx nanostructures using atomic layer deposition (ALD) over high aspect ratio (∼100:1) anodic aluminum oxide (AAO) templates and silicon nanowires (SiNWs). The aim in manufacturing these high aspect ratio structures was to create functional PEMFC cathode catalyst support materials with a structure optimized to inhibit electrode flooding. While this work only investigates the use of these materials as catalyst support structures, they may also be suitable for other applications.Reference Ioroi, Siroma, Fujiwara, Yamazaki and Yasuda5, Reference Fu, Wei, Chen, Li, Feng, Wang, Ma, Liao, Shen and Jiang6, Reference Diebold17–Reference Wang, Guo and Li19 Initial electrochemical analysis of Pt-coated TiOx structures will also be described.
B. Anodic aluminum oxide
AAO is an electrochemically grown aluminum oxide made by placing high purity aluminum in an oxidizing electrolyte solution and applying an electric potential. This oxidation growth process naturally forms an array of nanopores in the aluminum oxide whose dimensions, spacing, and growth rate are dependent on the type/temperature of electrolyte used and the potential/current applied to the aluminum surface.Reference Ono, Saito and Asoh20, Reference Saedi and Ghorbani21 Pretreatments of the aluminum and posttreatments of the AAO can also be used to help control pore regularity (i.e., consistent pore diameter, spacing, and directionality).Reference Yu, Hu, Bai and Yang22
C. Silicon nanowires
SiNWs have been a topic of research since the 1960s. The concept gained momentum following the work of Wagner and EllisReference Wagner and Ellis23 on explaining the vapor–liquid–solid (VLS) growth mechanism of SiNWs. This mechanism involves heating a small amount of solid [e.g., gold (Au)] deposited on a crystalline Si surface and small Au–Si alloy droplets form on the surface of the Si. The heated droplets are then exposed to a gaseous volatile Si compound (e.g., SiH4). The SiH4 will break apart and incorporate into the Au–Si droplets. After the droplets are saturated, the silicon will precipitate toward the droplet–Si interfaces. This precipitation upon continuous exposure and saturation of the Au–Si droplet results in Si wire growth at the droplet interface.Reference Schmidt, Wittemann, Senz and Gosele24
II. EXPERIMENT
For the current work, commercial AAO templates manufactured by Whatman Ltd.25 (Maidstone, UK) were used. These template contained nanopores, which were ∼200–300 nm in diameter and 60 μm long. ALD TiOx films (50-nm thick) were deposited on these templates using an Aixtron Stratagem300 (Herzogenrath, Germany) 300-mm wafer capable ALD cluster tool. Unheated titanium tetrachloride (TiCl4; Strem Chemicals, Inc., Newburyport, MA, 99.8+%) and H2O were used as precursor and oxygen source, respectively. Optimized TiO2 film and postdeposition reducing anneal parameters for deposition on AAO templates have been reported by the authors previously.Reference Phillips, Hansen and Eisenbraun26 It was found that the ALD deposition parameters played a critical part in the effectiveness of a postdeposition hydrogen anneal in transforming the insulating TiO2 film into a conductive substoichiometric (oxygen-reduced) film. Important ALD growth parameters were temperature (200 °C), TiCl4/H2O gas pulse times (8.0 s/2.0 s), and film thickness (≥25 nm). Optimized films measured conductivities of ∼200 S/cm and showed complete coverage of nanostructures with aspect ratios greater than 80:1. Following the TiO2 deposition and postdeposition reducing anneal in H2 (substrate at 450 °C), the AAO templates were broken up and etched using sonication and a 5.0 M solution of NaOH for 30–60 min. The separated nanotubes were then collected and cleaned using a centrifuge and deionized (DI) water. The initial tubes were separated from the NaOH solution in the centrifuge at 3000 rpm for 12 min. They were then cleaned with DI water 3–5 times (each with a separation time of 12 min at 3000 rpm in the centrifuge).
SiNWs were grown using a chemical vapor deposition (CVD) growth technique following a VLS growth mechanism. Plain Si (<110> or <111>) substrate was sonicated in acetone, ethanol, isopropyl alcohol (IPA) for 3–3.5 min, and then rinsed with DI water. The Si was then immersed in buffer hydrofluoric acid (HF) for 1 min and then rinsed again with DI water. A 5-nm layer of gold was deposited via physical vapor deposition on a cleaned Si surface, which was subsequently heated to 600 °C in an Ar flow at 100 sccm. Once at temperature, the substrate was annealed in Ar at the same temperature for 15 min to allow the formation of Au–Si alloy droplets. Then, a silane gas precursor (1% silane in 99% Ar) was leaked into the vacuum chamber at a flow of 100 sccm maintaining a pressure of ∼100 Torr. This pressure and temperature were maintained for 90 min. The resulting SiNWs were coated with an ALD TiOx film (25 nm). This film was deposited using a slightly modified recipe from that which was optimized previously.Reference Phillips, Hansen and Eisenbraun26 It was shown that the 100:1 aspect ratio pores of AAO templates required long pulse times for complete coverage. However, due to the open space nature of the SiNWs used here, the pulse time was decreased from 8 to 4 s for TiCl4 and from 2 to 1 s for H2O. This was done at no cost to the film conductivity, though decreasing pulse times beyond this (e.g., 2 and 0.5 s for TiCl4 and H2O, respectively) resulted in a decrease in conductivity from 300 to 40 S/cm.
A. Platinum deposition techniques
Two methods for depositing Pt were utilized in this work due to their individual strengths for depositing on different surfaces. A liquid phase-deposited Pt was used on TiOx tubes formed from AAO templates. Plasma-enhanced atomic layer deposition (PEALD) Pt was used to deposit Pt on SiNW surfaces. A liquid phase-deposited Pt technique works well for depositing on TiOx structures formed from AAO templates since these structures are dispersed into an aqueous medium. Liquid phase-deposited Pt has the advantage of giving Pt equal nondirectional access to all TiOx surfaces but has a tendency to produce Pt nucleation sizes (as observed in the current work) between 5 and 20 nm (more than the optimal 3–5 nm),Reference Kinoshita27 which are spread out across the TiOx surface. PEALD on the other hand has the advantage of producing very even coatings of Pt nuclei, which are 3–5 nm in diameter (something difficult to do with a liquid phase Pt deposition). However, covering structures effectively with PEALD Pt becomes tricky when working with high aspect ratio surfaces (much greater than 20:1) or after the TiOx tubes have been separated from the AAO template and are in powder form. SiNWs provide enough spacing between TiOx surfaces to accommodate the 20:1 aspect ratio limit of the Pt deposition process and are bonded to a Si substrate. For this reason, SiNWs are ideally suited for the PEALD Pt deposition process.
The liquid phase Pt deposition technique is performed using a sodium borohydride-assisted ethylene glycol reduction of chloroplatinic acid hexahydrate (H2PtCl6·6H2O, ≥37.5% Pt metal basis).Reference Kim, Joo, Kim, Kim, Song and Yi28 These depositions were accomplished following the removal and cleaning of the tubes described above. The dried material was then dispersed in a solution of DI water and ethylene glycol. A calculated amount of chloroplatinic acid hexahydrate that would nominally yield 20 wt% Pt loading was then added to the solution. While this solution was vigorously stirred, a 10:1 molar ratio solution of ethylene glycol to sodium borohydride was prepared and slowly added. This new solution was allowed to stir for 4 h following which a small portion of 0.1 M HCl was added to help ensure Pt deposition on the support material. Following an additional stir time of 15–30 min, the solid catalyst plus support material was separated, cleaned, and dried in a similar manner to TiOx nanotubes following their removal from AAO templates.
PEALD Pt depositions were performed on TiOx-coated SiNWs using a plasma capable chamber on the same Aixtron Stratagem300 300-mm wafer capable ALD cluster tool mentioned above. A metal–organic Pt precursor [Me3(MeCp)Pt] was used in conjunction with a 500 W ammonia (NH3) plasma. The substrate temperature was held at 450 °C. ALD pulse time for both the precursor and reactant gas was 8 s.
Conductivity measurements were taken of TiOx and Pt/TiOx films deposited on witness SiO2 substrates using a Signatone (Gilroy, CA) sheet resistance probe (four-point probe). Sheet resistance values were calculated based on currents measured in the μA to mA range and potentials measured in the mV range. TiOx structure and thickness measurements were performed using a Hitachi S-4800 (Tokyo, Japan) field emission scanning electron microscope (SEM) using the in-lens secondary electron detector, 1–5 kV acceleration voltages, and 3–5 mm working distances.
B. Ink formation
Inks were developed using TiOx structures obtained from AAO templates, which also obtained a ∼20 wt% Pt via liquid phase deposition. Inks were formed using a 59.6%v/v H2O, 40%v/v IPA, and 0.4%v/v of a 5 wt% Nafion solution [IonPower, Inc., New Castle, DE, D520 Dispersion (1000 EW)] in a 1 mL:2 mg (solution to catalyst material) ratio for all inks. The solution and material were then sonicated for ∼60 min (or until all materials were suspended in the solution and individual particulates were no longer visible).
C. Cyclic voltammetry and rotating disk electrode
Cyclic voltammetry (CV) is a common electrochemical characterization method in which the potential through the material to be characterized is cycled (as the name denotes) within a set range. The resulting forward and reverse bias peaks represent the various electrochemical reactions that are taking place at the electrolyte–catalyst interface. This technique is discussed in detail by Nicholson.Reference Nicholson29
A rotating disk electrode (RDE) has the ability to use CV to electrochemically characterize various catalytic materials. The working electrode of the RDE is composed of a conductive cylindrical disk that is embedded in an electrical insulator. The material of interest is made into an ink with an ionomer material (Nafion) and then dropped onto the exposed surface of the conductive disk and dried. Once the electrode has been prepared in this fashion, it is immersed in an electrolyte solution to make electrochemical measurements. The electrode is then rotated at a set rate. This rotation has the effect of drawing up fresh electrolyte toward the electrode surface, thereby increasing the reaction rate that the electrolyte has with the surface and pushing away the used product of the reaction away from the surface by centrifugal forces. This allows for the investigation of mass transport effects, and very importantly, it provides information needed to calculate the activity of catalyst/support materials. RDE as an analysis technique is reviewed and explained in greater detail by Compton et al.Reference Compton, Laing, Mason, Northing and Unwin30
Electrochemically active surface area (ECSA) calculations were made of select materials using the so-called Hupd region of the measured CV data.Reference Garsany, Baturina, Swider-Lyons and Kocha31, Reference Mayrhofer, Strmcnik, Blizanac, Stamenkovic, Arenz and Markovic32 Specific activity (I s) calculations were also made using the method outlined by Garsany et al.Reference Garsany, Baturina, Swider-Lyons and Kocha31
III. RESULTS
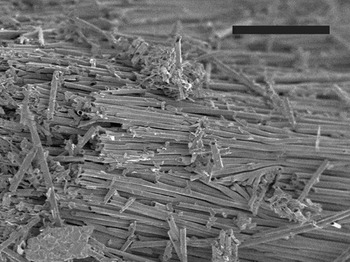
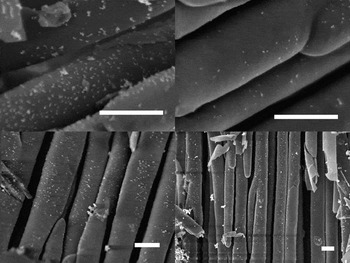
TiOx nanotubes were formed following sonication of TiOx-coated AAO membranes in a 5.0 M NaOH solution for ∼60 min (see Fig. 1). These structures possessed typical diameters of 200–300 nm and typical lengths of 10–30 μm. The liquid phase Pt deposition yielded Pt particle coatings of varying densities across the TiOx nanotubes surfaces (see Fig. 2). Pt particle sizes typically ranged from 5 to 20 nm in diameter. Sheet resistance measurement, in conjunction with SEM thickness measurements of the TiOx film deposited on flat witness SiO2 substrates (and annealed in H2), yielded conductivities between 200 and 300 S/cm.
TiOx nanotubes formed from ALD TiOx over AAO templates. A 5.0 M NaOH solution (plus sonication) was used to etch the template leaving behind high aspect ratio (100:1) structures. The scale bar represents 5 μm.

Liquid phase Pt deposited on AAO template manufactured TiOx nanotubes. Pt particle sizes typically range between 5 and 20 nm and coat the surface with varying densities depending on location. The scale bars represent 300 nm in each micrograph.

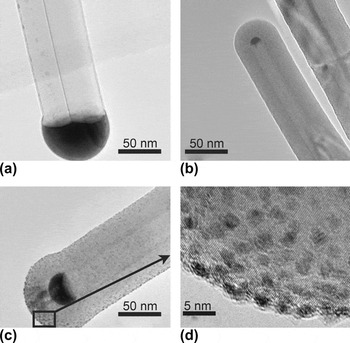
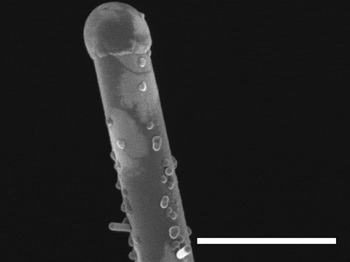
The ALD TiOx film evenly coated the SiNW as can be seen in Fig. 3(b). The film showed ∼100% conformality based on cross-sectional SEM measurements taken at three points of the TiOx-coated SiNWs (near top, middle, and near bottom). Following an oxygen reducing anneal at 450 °C in H2, similar surface morphological changes to those that were observed previously on planar TiOx witness samplesReference Phillips, Hansen and Eisenbraun26 (i.e., the color change surrounding the TiOx nuclei) could be observed on the TiOx-coated SiNWs (see Fig. 4). This is a promising visual indication that the reducing anneal has increased the conductivity of the high aspect ratio TiOx-coated structures. TiOx deposited on witness SiO2 samples and annealed in H2 consistently measured conductivities of ∼300 S/cm. The PEALD Pt deposits evenly on the surfaces of the TiOx-coated SiNWs aided by the increased spacing between surfaces characteristic of SiNW growth as expected. Figure 3(c) shows a typical SiNW evenly coated with 100 cycles of PEALD Pt. Particle size measurements performed via SEM and transmission electron microscopy (TEM) showed a small range of 3–5 nm.
TEM micrographs of the three process steps used for manufacturing Pt-coated TiOx on SiNW structures are shown here. The steps begin with the (a) CVD growth of SiNW, which utilizes the VLS growth mechanism, (b) ALD TiOx deposition and reducing anneal in H2, and (c) PEALD Pt deposition. (d) shows a close-up of the 3–5 nm particles, which typically coat the TiOx surfaces.

SEM image of TiOx-coated SiNW following a reducing anneal. Surface morphology changes that took place on two-dimensional TiOx films could also be observed on three-dimensional SiNW coatings. The scale bar indicates 1 μm.

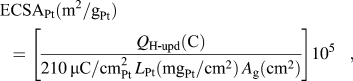
What are often referred to as ORR polarization curves can be generated using RDE analysis. These curves show the current generated by ORR reactions at the electrode surface. The curves show a sharp increase (absolute value) in the current at potentials less than ∼0.6 V versus saturated calomel electrode (SCE). The SCE used here has been calibrated to be 0.241 V versus standard hydrogen electrode. This increase continues until the ORR reactions reach their diffusion limit, known as the diffusion limiting current (DLC). These curves in conjunction with measured hydrogen adsorption charge in the Hupd region provide the information needed to make ECSA and I s calculations. The electrochemical surface area of the Pt (ECSAPt), which is expressed in units of area per mass of Pt, is given by:
 $$<![CDATA[$${\rm{ECSA}}_{{\rm{Pt}}} ({\rm{m}}^2 /{\rm{g}}_{{\rm{Pt}}} ) = \left[ {{{Q_{{\rm{H ‐ upd}}} ({\rm{C}})} \over {210\,{\rm{\mu C/cm}}_{{\rm{Pt}}}^{\rm{2}} \,L_{{\rm{Pt}}} ({\rm{mg}}_{{\rm{Pt}}} /{\rm{cm}}^2 )\,A_{\rm{g}} ({\rm{cm}}^2 )}}} \right]10^5 ,$$
where Q H-upd is the hydrogen adsorption charge, L Pt is the working electrode Pt loading (0.04 mg/cm2 for each material reported here), and A g is the surface area of the electrode (0.196 cm2). Specific activity (expressed in units of current per area of Pt) can be calculated according to:
 $$<![CDATA[$$I_{\rm{s}} ({\rm{mA}}/{\rm{cm}}_{{\rm{Pt}}}^{\rm{2}} ) = \left[ {{{I_{\rm{k}} ({\rm{A}})} \over {(Q_{{\rm{H ‐ upd}}} ({\rm{C}})/210 {\rm{\mu C}}\;{\rm{cm}}_{{\rm{Pt}}}^{ - 2} )}}} \right]10^{ - 3} ,$$
where I k is the kinetic current. I k is determined from I k + I il = I ak, where I il is the internal limiting current and I ak is the apparent kinetic current.
ORR polarization curves also provide a good basis for comparing the performance of different materials, utilizing the performance of 20 wt% Pt on colloidal carbon black as a standard. The DLC observed on the current system for Pt on carbon black is ∼5.6 mA/cm2. In the current work, this is used as a benchmark for all the materials tested.
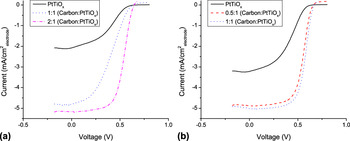
In Fig. 5, two batches of nanostructured Pt/TiOx inks are compared. All curves shown represent measurements taken with an electrode rotation rate of 1600 rpm. Batch 1 and batch 2 represent two inks deposited using the same liquid phase deposition recipe described above; however, batch 2 utilized a longer separation period of the material from the ethylene glycol than batch 1. This longer separation period had the benefit of enabling the removal of a greater percentage of catalyst material from the reaction solution. It is assumed that this longer separation period is responsible for the increase in conductivity of the unmodified Pt on TiOx ink.
ORR polarization curves are shown here for an ink made from TiOx nanotubes coated with a liquid phase-deposited Pt. Different ratios of carbon were added to the ink to increase conductivity. The behavior of the curve mimics Pt on carbon when a 2:1 ratio of carbon to Pt on TiOx material (by weight) is added to the ink for batch 1 and when only a 0.5:1 ratio is added to batch 2. All curves represent measurements taken at electrode rotation rates of 1600 rpm. Currents are reported as a densities normalized to the geometric area of the electrode.

Batch 2 shows a 60% increase in its DLC over batch 1; however, both inks fall short of the DLC seen with 20 wt% Pt on carbon. Consequently, plain carbon black was added to both of these inks in different ratios (shown as mass of carbon to mass of Pt/TiOx material) to increase the conductivity. Both batches of ink show similar behavior to a Pt on carbon ink when plain carbon is added. However, batch 2 only requires a 0.5:1 ratio of carbon to Pt on TiOx material to mimic Pt on carbon, whereas batch 1 requires 2:1 (4 times as much carbon). ECSA and I s values were determined for batch 2 inks with no carbon (ECSA = 1.3 m2/gpt, I s = 7.2 mA/cmpt2) and with a 1:1 ratio of carbon added (ECSA = 15 m2/gpt, I s = 8.6 mA/cmpt2). 20 wt% Pt on Vulcan XC 72 was also tested, which yielded ECSA and I s values of 88 m2/gpt and 0.6 mA/cmpt2, respectively. While calculated ECSA values are lower than observed for Pt on Vulcan XC 72, the I s values are significantly higher. A similar increase was reported by Maiyalagan et al.Reference Maiyalagan, Viswanathan and Varadaraju33 where this large increase in activity of Pt on TiO2 materials was attributed to OH groups that were generated near the Pt–oxide interface promoting CO removal and the strong metal support interaction between the Pt and TiO2.
IV. CONCLUSIONS
Two techniques for manufacturing conductive high aspect ratio TiOx nanostructures were established. One approach uses ALD to grow TiOx thin films over high aspect ratio (∼100:1) AAO templates, and the other uses SiNWs as high surface area nanostructures as supports for ALD TiOx films. It was shown that liquid phase Pt deposited on TiOx tubes formed from AAO templates performed well (60% DLC of 20 wt% Pt on carbon). Upon adding a 0.5:1 ratio by weight of carbon to Pt/TiOx material to this ink, DLCs of near 5 mA/cm2 were observed; this is close to the 5.6 mA/cm2 expected for 20 wt% Pt on carbon. ESCA values were notably lower for the Pt on TiOx materials than for Pt on Vulcan XC 72. However, nearly an order of magnitude increase in specific activity was also observed. Further optimization of the liquid phase Pt deposition process and sustained development of the TiOx material may continue to improve electrochemical performance to allow for purely Pt on TiOx inks with future fuel cell applications.