INTRODUCTION
As the planet's largest ice mass during the last glacial maximum (LGM), the Laurentide Ice Sheet is widely evoked as a key player in global climate through Milankovitch forcing (Denton and Hughes, Reference Denton and Hughes1983), albedo feedbacks (Broccoli and Manabe, Reference Broccoli and Manabe1987; Weaver et al., Reference Weaver, Eby, Fanning and Wiebe1998; Carlson et al., Reference Carlson, Clark, Raisbeck and Brook2007), and atmospheric interference (Manabe and Broccoli, Reference Manabe and Broccoli1985; Mayewski et al., Reference Mayewski, Meeker, Twickler, Whitlow, Yang, Lyons and Prentice1997; Ganopolski et al., Reference Ganopolski, Rahmstorf, Petoukhov and Claussen1998; Shuman et al., Reference Shuman, Bartlein, Logar, Newby and Webb2002). On submillennial timescales, whether as a cause or consequence of climate, the Laurentide also was the principal source of ice-rafted debris in North Atlantic marine sediments (Bond et al., Reference Bond, Broecker, Johnsen, McManus, Labeyrie, Jouzel and Bonani1993; MacAyeal, Reference MacAyeal1993; Hemming et al., Reference Hemming, Bond, Broecker, Sharp and Klas-Mendelson2000; Hemming, Reference Hemming2004) and thus has a long association with meltwater-induced perturbations of the thermohaline circulation (Broecker et al., Reference Broecker, Kennett, Flower, Teller, Trumbore, Bonani and Wolfli1989; Keigwin et al., Reference Keigwin, Jones, Lehman and Boyle1991; Keigwin and Lehman, Reference Keigwin and Lehman1994; Flower et al., Reference Flower, Hastings, Hill and Quinn2004; McManus et al., Reference McManus, Francois, Gherardi, Keigwin and Brown-Leger2004; Ellison et al., Reference Ellison, Chapman and Hall2006) and abrupt shifts in ocean-atmosphere heat transfer (e.g., Clark et al., Reference Clark, Marshall, Clarke, Hostetler, Licciardi and Teller2001), particularly along the ice sheet's marine-terminating North Atlantic margins.
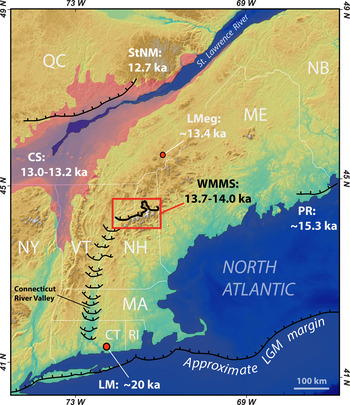
Reconstructing patterns of cryospheric change in the southeastern sector of the Laurentide Ice Sheet is fundamental to establishing the key factors controlling mass balance and, ultimately, for testing the role of North Atlantic Ocean dynamics in regional climate. Here, we build on our previous work (Bromley et al., Reference Bromley, Hall, Thompson, Kaplan, Garcia and Schaefer2015; Thompson et al., Reference Thompson, Dorion, Ridge, Balco, Fowler and Svendsen2017) on the deglacial history of northern New England during the last glacial termination (Termination 1: ~20–11 ka), a period characterized by abrupt shifts in temperature, seasonality, and meltwater flux throughout the circum–North Atlantic (e.g., Denton et al., Reference Denton, Alley, Comer and Broecker2005, Reference Denton, Anderson, Toggweiler, Edwards, Schaefer and Putnam2010) and widespread ice sheet retreat in New England. Specifically, we provide new cosmogenic 10Be surface-exposure data from the Berlin moraine complex in northern New Hampshire, part of the White Mountain moraine system (WMMS; Fig. 1; Thompson et al., Reference Thompson, Dorion, Ridge, Balco, Fowler and Svendsen2017), which reflects a regional-scale glacial readvance during Termination 1. These new data also help place the deglaciation of New England into a wider climatological context, relative to conditions downwind in the North Atlantic, and provide a new vantage on ice sheet configuration during opening of the Champlain Sea.
Map of New England, northeastern United States, and southeastern Canada, showing the locations and approximate ages of the White Mountain moraine system (WMMS; red square) and other ice-marginal positions relative to the last glacial maximum (LGM) ice sheet limit and the postglacial Champlain Sea (CS: pink shading; see Richard and Occhietti, Reference Richard and Occhietti2005). Deglacial limits in the Connecticut River valley adapted from Ridge et al. (Reference Ridge, Balco, Bayless, Beck, Carter, Dean, Voytek and Wei2012). LMeg, Lac Megantic area (mean of two calibrated basal 14C ages from Lacs Dubuc and Clinton; Elkadi, Reference Elkadi2013); PRM, Pineo Ridge moraine (Hall et al., Reference Hall, Borns, Bromley and Lowell2017); LM, Ledyard moraine (Balco and Schaefer, Reference Balco and Schaefer2006); StNM, Sant-Narcisse moraine (Occhietti, Reference Occhietti2007). Territorial abbreviations: CT, Connecticut; QC, Québec; MA, Massachusetts; ME, Maine; NB, New Brunswick; NH, New Hampshire; NY, New York; RI, Rhode Island. (For interpretation of the references to color in this figure legend, the reader is referred to the web version of this article.)

THE WHITE MOUNTAINS GLACIAL RECORD
Moraines and glacial deposits associated with the last retreat of the Laurentide Ice Sheet are abundant throughout the White Mountains region of northern New Hampshire and western Maine, where the complex glacial stratigraphy has attracted scientific attention since 1850 (Lyell, Reference Lyell1850; Agassiz, Reference Agassiz1870; Thompson, Reference Thompson1999; Balco et al., Reference Balco, Briner, Finkel, Rayburn, Ridge and Schaefer2009; Bierman et al., Reference Bierman, Davis, Corbett, Lifton and Finkel2015). In their recent study, Thompson et al. (Reference Thompson, Dorion, Ridge, Balco, Fowler and Svendsen2017) described a series of prominent moraine complexes, collectively termed the WMMS (Fig. 1), which crosses New Hampshire in a roughly east–west direction and represents deposition along the active margin of south-flowing ice approximately 300 km proximal of the Laurentide Ice Sheet's LGM terminus (Goldthwait, Reference Goldthwait1916; Thompson et al., Reference Thompson, Fowler, Dorion, Thompson, Fowler and Davis1999; Ridge, Reference Ridge, Ehlers and Gibbard2004; Ridge et al., Reference Ridge, Balco, Bayless, Beck, Carter, Dean, Voytek and Wei2012). The historically best-known section of the WMMS is the Littleton-Bethlehem complex, including the Sleeping Astronomer moraine (Fig. 2), which has been correlated with an ice advance recorded in the Connecticut Valley varve record of glacial Lake Hitchcock (Antevs, Reference Antevs1922; Crosby, Reference Crosby1934; Ridge et al., Reference Ridge, Besonen, Brochu, Brown, Callahan, Cook, Nicholson, Toll, Thompson, Fowler and Davis1999; Thompson et al., Reference Thompson, Fowler, Dorion, Thompson, Fowler and Davis1999). That this event constituted an advance, as opposed to a still stand, is indicated by widespread sedimentologic evidence for the deformation and overriding of proglacial lake sediments by south-flowing ice and incorporation of these sediments in WMMS tills (e.g., Crosby, Reference Crosby1934; Lougee, Reference Lougee1935; Thompson et al., Reference Thompson, Fowler, Dorion, Thompson, Fowler and Davis1999, Reference Thompson, Dorion, Ridge, Balco, Fowler and Svendsen2017).
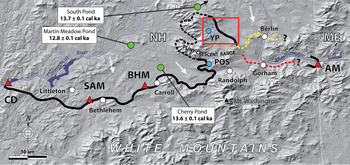
Topographic map of the White Mountains region, showing the mapped (solid black lines) and conjectured (dashed black lines) extent of the White Mountain moraine system (WMMS) and location of the Berlin moraines (red rectangle). Dashed yellow and red lines indicate the conjectured continuation of the former ice margin east of the Berlin moraines according to Thompson et al. (Reference Thompson, Dorion, Ridge, Balco, Fowler and Svendsen2017) and Bromley et al. (Reference Bromley, Hall, Thompson, Kaplan, Garcia and Schaefer2015), respectively. Proximal lake sites providing minimum-limiting 14C age control for the WMMS are indicated by green circles (note: South Pond is located just off the map in the direction of the black arrow). Distal lake sites (blue circles) mentioned in the text: POS, Pond of Safety; YP, York Pond. Key moraine sites discussed in the text are indicated by red triangles: AM, Androscoggin moraine; BHM, Beech Hill moraine; CD, Comerford Dam; SAM, Sleeping Astronomer moraine. White arrows denote former ice-flow direction. (For interpretation of the references to color in this figure legend, the reader is referred to the web version of this article.)

The eastern continuation of the WMMS has been mapped near the towns of Carroll, Randolph, and Berlin (Thompson et al., Reference Thompson, Fowler, Dorion, Thompson, Fowler and Davis1999, Reference Thompson, Dorion, Ridge, Balco, Fowler and Svendsen2017), and Bromley et al. (Reference Bromley, Hall, Thompson, Kaplan, Garcia and Schaefer2015) correlated the WMMS with the Androscoggin lateral-terminal moraine complex on the Maine–New Hampshire border (Fig. 2). Between Randolph and the Androscoggin moraines, however, the precise configuration of the ice margin during the advance is unclear, highlighting the problematic nature of reconstructing ice-marginal positions in this densely forested and challenging terrain.
The focus of this article is a set of prominent moraine ridges located west of the town of Berlin (Figs. 2 and 3). The Berlin moraines were described first by Thompson et al. (Reference Thompson, Borns and Hall2007, Reference Thompson, Boisvert, Dorion, Kirby, Pollock, Westerman and Lathrop2009) and subsequently by Thompson and Svendsen (Reference Thompson and Svendsen2015), and they were recently correlated with the nearby Randolph moraines based on the distribution of ice-marginal meltwater channels and former ice-dammed lakes (Thompson et al., Reference Thompson, Dorion, Ridge, Balco, Fowler and Svendsen2017). However, although it is tempting to regard the Berlin moraines as a continuation of the WMMS, direct age control for the sequence has been lacking. To provide this constraint, we report seven new cosmogenic 10Be ages from the Berlin moraines that enable us to place the complex firmly in the context of local and regional ice sheet behavior.
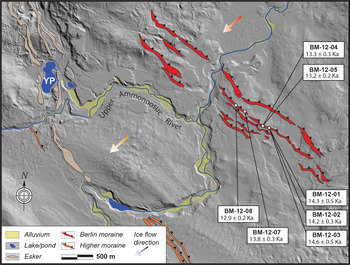
Glacial-geomorphic map of the Upper Ammonoosuc River valley study area. Locations and surface-exposure ages of sampled boulders are shown. Red and orange arrows denote approximate ice-flow direction during deposition of the Berlin and higher moraines, respectively. YP, York Pond. Underlying light detection and ranging (LIDAR) imagery obtained from the GRANIT LIDAR distribution site (http://lidar.unh.edu/map/), University of New Hampshire. (For interpretation of the references to color in this figure legend, the reader is referred to the web version of this article.)

GEOLOGIC SETTING OF THE BERLIN MORAINES
The main part of the Berlin moraine complex comprises five principal northwestern- to southeastern-oriented ridges, locally between 200 and 400 m apart, that are traceable for ~4 km across the gently undulating Upper Ammonoosuc River valley bottom (Fig. 3). Together with discontinuous moraine sections, the Berlin complex forms a belt as much as 750 m wide (Fig. 3). The sampled moraine and neighboring ridges within the complex are typically 2–10 m tall and composed of bouldery till, with crests mantled by large (>1 m tall) granite boulders, and all are weathered to a similar degree suggesting deposition over a short period. Elevations of the moraine crest at the sample sites are approximately 420 ± 3 m above sea level. The cross-valley configuration of the Berlin moraines indicates deposition along the margin of a south-flowing ice mass in the Androscoggin River valley, which at the time would have blocked the entrance to the Upper Ammonoosuc River valley.
At a distance of 2.0–2.5 km southwest of the Berlin moraines, three similar moraines represent earlier, currently undated ice-margin positions (“Higher moraine” in Fig. 3). Thompson et al. (Reference Thompson, Dorion, Ridge, Balco, Fowler and Svendsen2017) suggested that when the ice margin stood at this limit, it dammed an early stage of glacial Lake Crescent, an ice-dammed lake located in the highest part of the Upper Ammonoosuc River valley (see fig. 2 of Thompson et al., Reference Thompson, Dorion, Ridge, Balco, Fowler and Svendsen2017). However, the position of the sampled moraine indicates it was deposited when the level of the proglacial lake had dropped to ~430 m (the elevation of a spillway nearby to the east). Further lowering of Lake Crescent occurred very quickly when a few hundred meters of additional ice retreat opened the next spillway at ~411 m. Thus, we conclude that the moraine complex has been exposed subaerially for virtually all of postglacial time.
Limiting age control for the Berlin moraines is provided by 14C ages on basal lake sediments. Directly proximal to the WMMS, with which the Berlin complex is correlated, macrofossils in basal ages from three lake basins afford the minimum-limiting constraint for the moraines (Table 2): Cherry Pond (13.4–13.8 cal ka BP [11,800 ± 90 14C yr BP]; Thompson et al., Reference Thompson, Dorion, Ridge, Balco, Fowler and Svendsen2017), South Pond (13.6–13.8 cal ka BP [11,825 ± 40 14C yr BP]; Parris et al., Reference Parris, Bierman, Noren, Prins and Lini2010), and Martin Meadow Pond (12.7–13.0 cal ka BP [10,920 ± 80 14C yr BP]; Thompson et al., Reference Thompson, Dorion, Ridge, Balco, Fowler and Svendsen2017) (Fig. 2). All 14C ages discussed here have been calibrated using the IntCal13 curve (Reimer et al., Reference Reimer, Bard, Bayliss, Beck, Blackwell, Ramsey and Buck2013) and OxCal version 4.3 (Ramsey, Reference Ramsey2009) and are reported with 1σ uncertainty. The implications of these minimum-limiting radiocarbon data for the deglacial history of the region are explored further in the “Discussion.”
Within the Upper Ammonoosuc River valley itself, York Pond (Figs. 2 and 3) is a kettle hole located distal to the Berlin moraines and surrounded by glaciofluvial sands and gravels. Previous work on the lake's sedimentology revealed ~40 cm of finely laminated sediments, interpreted as varves, overlying till (Thompson et al., Reference Thompson, Boisvert, Dorion, Kirby, Pollock, Westerman and Lathrop2009). Macrofossils in those varves provided a radiocarbon date of (13.6–14.1 cal ka BP [11,980 ± 90 14C yr BP]). Ten kilometers south of York Pond, on the western end of the Crescent Range, Pond of Safety also lies distal to the WMMS (Fig. 3) and gives a basal age of (14.2–15.0 cal ka BP [12,450 ± 60 14C yr BP]; Thompson et al., Reference Thompson, Dorion, Ridge, Balco, Fowler and Svendsen2017). Although these data confirm that both York Pond and Pond of Safety were deglaciated by ~13.8 cal ka, their distal positions mean neither site can provide unequivocal limiting age control for deposition of the adjacent moraines.
Although the age of the Berlin moraine complex has not, until now, been established directly, other sections of the WMMS have been dated using cosmogenic 10Be surface-exposure dating. Four samples from the Sleeping Astronomer and Beech Hill moraines give a mean age of 13.8 ± 0.7 ka (Balco et al., Reference Balco, Briner, Finkel, Rayburn, Ridge and Schaefer2009), calculated using the northeastern North America (NENA) production rate and St scaling, as reported in Bromley et al. (Reference Bromley, Hall, Thompson, Kaplan, Garcia and Schaefer2015), which is indistinguishable from subsequent 10Be measurements (Borchers et al., Reference Borchers, Marrero, Balco, Caffee, Goehring, Lifton, Nishiizumi, Phillips, Schaefer and Stone2016). At its westernmost point, the Littleton-Bethlehem component of the WMMS has also been correlated with a till unit exposed at Comerford Dam (Fig. 2) that, according to the New England varve chronology, was deposited approximately 13.8–14.0 ka (e.g., Ridge et al., Reference Ridge, Besonen, Brochu, Brown, Callahan, Cook, Nicholson, Toll, Thompson, Fowler and Davis1999, Reference Ridge, Balco, Bayless, Beck, Carter, Dean, Voytek and Wei2012; Balco et al., Reference Balco, Briner, Finkel, Rayburn, Ridge and Schaefer2009). Farther east, seven samples from the Androscoggin moraines yielded a mean age of 13.2 ± 0.8 ka (Bromley et al., Reference Bromley, Hall, Thompson, Kaplan, Garcia and Schaefer2015), which overlaps with the Sleeping Astronomer–Beech Hill mean within analytical uncertainties.
METHODS
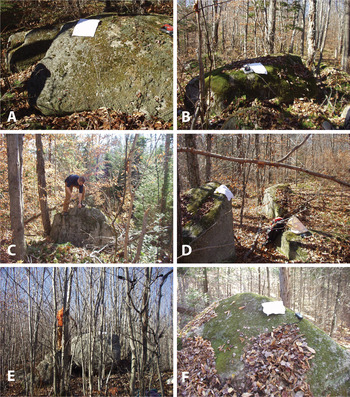
To resolve the age of the Berlin moraines, we sampled seven granite boulders (Fig. 4) located on the best-preserved moraine crest of the group, southeast of the Upper Ammonoosuc River (Fig. 3). Samples comprised the upper few centimeters of rock and were collected with a hammer and chisel. Elevations and positions for each sample were obtained from repeated measurements using a handheld GPS, and horizon data were measured with a clinometer. We note that, although they have lost all traces of glacial polish and striae because of post-depositional weathering, the sampled boulders exhibit rounding because of glacial transport (Fig. 4). To minimize the risk of sample shielding because of vegetation and/or seasonal snow cover, we selected prominent boulders of 1–1.5 m relief, and, although this does not preclude some degree of shielding, we note that there is no relationship between boulder age and height.
(color online) Sampled glacially molded boulders on the Berlin moraines: BM-12-01 (A); BM-12-02 (B); BM-12-03 (C); BM-12-04 (left) and BM-12-05 (right) (D); BM-12-07 (E); and BM-12-08 (F).

Samples were prepared for beryllium-10 analysis in the University of Maine cosmogenic isotope laboratory, where we used heavy liquids to separate quartz from the 250–500 µm fraction of the crushed samples and successive leaches in weak (2%) HF to purify the quartz (Kohl and Nishiizumi, Reference Kohl and Nishiizumi1992). Purity of quartz was assessed using ICP-OES (inductively coupled plasma optical emission spectrometry). Subsequently, beryllium was isolated via ion-exchange chemistry, and cathodes were measured at Lawrence Livermore National Laboratory and normalized to the 07KNSTD standard (10Be/9Be = 2.85 × 10⁻¹²; Nishiizumi et al., Reference Nishiizumi, Imamura, Caffee, Southon, Finkel and McAninch2007). We report ages calculated using Version 3 of the online University of Washington cosmogenic calculators (https://hess.ess.washington.edu) in conjunction with the NENA production rate (Balco et al., Reference Balco, Briner, Finkel, Rayburn, Ridge and Schaefer2009) and time-invariant Lal (Reference Lal1991)/Stone (Reference Stone2000) “St” scaling, though we stress our interpretations are independent of this choice of scaling scheme (e.g., when calculated using the time-variant “Lm” scheme [Balco et al., Reference Balco, Stone, Lifton and Dunai2008], exposure ages are within 0.5% of our St results). Individual and mean-averaged 10Be exposure ages are reported along with 1σ internal (analytical) uncertainties. Analytical results and ages are given in Table 1.
Sample details and 10Be surface-exposure ages for the Berlin moraine samples. All exposure ages and 1σ uncertainties shown are calculated using the northeastern North America (NENA) production rate (Balco et al., Reference Balco, Briner, Finkel, Rayburn, Ridge and Schaefer2009) and St scaling (Lal, Reference Lal1991; Stone, Reference Stone2000). Mean ages are reported along with the standard error of the mean.

Notes: All samples were collected in 2012. All BM samples were spiked with a 477 µg/g 9Be carrier, with the exception of BM-12-02, which was spiked with a 1029 µg/g carrier. Three procedural blanks, 10Be/9Be = (7.2 × 10⁻¹⁶ to 9.0 × 10⁻¹⁶), were processed identically to the samples. Beryllium ratios of BM samples and blanks were measured relative to the 07KNSTD standard [10Be/9Be = 2.85 × 10⁻¹²]. Ages were calculated using a rock density of 2.7 g/cm3 and assuming zero erosion.
RESULTS
Seven 10Be ages from the sampled moraine fall between 12.9 ± 0.2 and 14.6 ± 0.5 ka (Table 1; Figs. 3 and 5), with an arithmetic mean age of 13.7 ± 0.6 ka. Plotted as an age probability curve, this data set exhibits a bimodal distribution (Fig. 5) representing two statistically distinct age populations: the older population (samples BM-12-1, 2, 3, 7) gives a mean age of 14.2 ± 0.4 ka, and the younger population (samples BM-12-4, 5, 7, 8) an age of 13.3 ± 0.3 ka. We note that sample BM-12-7, which fits equally well within the normal distributions of either population, gives an exposure age (Table 1) that is statistically indistinguishable from the mean and median (13.7 ka) values for the data set as a whole. Together, the seven ages confirm the late-glacial age of the Berlin moraines; the bimodal distribution, however, poses a challenge to establishing the most representative age for moraine formation, leading us to present three possible scenarios that are discussed in the following section: (1) Moraine deposition is represented by the older population, but subsequent erosion has lowered the apparent ages of the younger samples (43% of the data set) by varying degrees. (2) Moraine deposition is represented by the younger population, but the landform includes boulders (again, 43% of the data set) reworked from a prior period of exposure. (3) Ice occupied the Berlin moraines at 14.2 ± 0.4 ka and again at 13.3 ± 0.3 ka.
Stacked age probability curves for the Berlin, Littleton-Bethlehem, and Androscoggin moraines (individual and summed probability curves denoted by black and red lines, respectively), relative to the minimum-limiting 14C age data (shown in green as a summed probability curve) discussed in the text. Exposure ages calculated using the NENA (northeastern North America) production rate and time-independent St scaling. Vertical yellow bands depict the standard deviation of the mean 10Be ages (vertical black lines). (For interpretation of the references to color in this figure legend, the reader is referred to the web version of this article.)

DISCUSSION
Age of the Berlin moraines
For boulders sampled on the Littleton-Bethlehem moraines, under similar climatic conditions to the Berlin site, Balco et al. (Reference Balco, Briner, Finkel, Rayburn, Ridge and Schaefer2009) estimated the magnitude of postdepositional surface erosion to be approximately <1.5 cm. Nonetheless, it is plausible that the nonnormal distribution of our ages simply reflects minor variations in weathering rate among the seven boulders (scenario 1), potentially accentuated by their minor lithologic differences. Furthermore, whereas erosion might cause larger data sets to exhibit a distribution with a young “tail,” the relatively small size of our sample set (n = 7) means such a feature is unlikely to be apparent.
Under scenario 2, almost half of the sampled boulders would contain concentrations of inherited 10Be, reflecting the incomplete removal of nuclide-bearing material by glacial erosion. This process typically results in age distributions with old “tails” or conspicuous old outliers. Yet the older population in our data set forms an internally consistent grouping of at least three ages (Fig. 5), thus suggesting a process other than the random incorporation of incompletely reset surfaces.
The remaining scenario (scenario 3), in which the ice margin advanced to the same moraine limit on two separate occasions, cannot be tested quantitatively within the bounds of the existing data set, nor stratigraphically, because all seven ages are from boulders located on the moraine crest and there is no field evidence for multiple periods of glacial occupation.
Therefore, we propose that the most straightforward interpretation from the beryllium data alone is that the Berlin moraines represent deposition along an active ice margin at some point between 14.2 ± 0.4 ka and 13.3 ± 0.3 ka and centered around a mean age encompassing both populations of 13.7 ± 0.6 ka. This model is supported by the minimum-limiting basal 14C data from the three proximal lakes described previously (Figs. 2 and 5; Table 2). Using the NENA production rate, the probability distributions of the 10Be and radiocarbon data overlap (Fig. 5). However, the radiocarbon distribution (oldest peak of 13.6 ± 0.1 cal ka BP) indicates that the actual age of the moraine is represented by the older population of the total 10Be age range and is unlikely to be much younger than 13.7 ka. Use of a more recent Northern Hemisphere 10Be production rate (Putnam et al., Reference Putnam, Bromley, Rademaker and Schaefer2019) produces a slightly (3%) older age for the Berlin moraines and improves the fit with the minimum-limiting radiocarbon data.
Basal radiocarbon and calibrated ages from three distal lake sites providing minimum-limiting control for the White Mountain moraine system (WMMS).

Finally, acknowledging that our samples were taken from one of five main moraines and therefore cannot document specifically the full age range of the complex, the regular spacing and uniform morphology and weathering appearance of the ridges nonetheless suggests that deposition of the Berlin complex occurred over a relatively short period centered around ~13.7 ka.
Implications for the timing of deglaciation in the White Mountains region
Comparison of our Berlin 10Be data with previously published ages from the Littleton-Bethlehem (Balco et al., Reference Balco, Briner, Finkel, Rayburn, Ridge and Schaefer2009) and Androscoggin (Bromley et al., Reference Bromley, Hall, Thompson, Kaplan, Garcia and Schaefer2015) complexes shows that the three data sets, which have been calculated here in an identical manner, exhibit considerable statistical overlap (respective mean ages agree within 1σ) and thus are close in age (Fig. 5). The most straightforward interpretation of this pattern is that the three moraine complexes constitute different sections of the WMMS and were deposited more or less contemporaneously during an advance of south-flowing ice. By that model, the moraine chronology for the WMMS prescribes an ice margin that was oriented roughly east–west across western and central portions of northern New Hampshire, but which formed a northern loop around the Pliny–Crescent Range (Fig. 2) before terminating in the Androscoggin River valley on the Maine–New Hampshire border (red dashed line in Fig. 2).
We acknowledge, however, that this interpretation conflicts with the recent suggestion by Thompson et al. (Reference Thompson, Dorion, Ridge, Balco, Fowler and Svendsen2017), based on stratigraphic relationships between moraines and former ice-dammed lakes, that the Androscoggin moraines predate the WMMS and the continuation of the ice margin east of the Berlin moraines lay north of the Androscoggin River valley (yellow dashed line in Fig. 2). To reconcile that model with the overlapping 10Be ages, Thompson et al. (Reference Thompson, Dorion, Ridge, Balco, Fowler and Svendsen2017) concluded that both the Androscoggin moraines and the WMMS were deposited within ~200 yr, potentially as different episodes in a broader period of regional ice sheet fluctuation. Although the mean age of the Androscoggin moraines aligns with those of both the Berlin and Littleton-Bethlehem moraines (Fig. 5), the relatively broad age distribution and analytical uncertainty for the former permit the Androscoggin event to have occurred slightly prior to construction of the main WMMS, as envisaged by Thompson et al. (Reference Thompson, Dorion, Ridge, Balco, Fowler and Svendsen2017). Confirmation of either scenario (i.e., the Androscoggin moraines being part of or predating the WMMS) will require detailed mapping of former glacial limits between the Berlin and Androscoggin complexes.
Implications for the deglacial configuration of the Laurentide Ice Sheet
Regardless of whether the WMMS ultimately includes the Androscoggin complex, the Berlin and Littleton-Bethlehem sites together constrain the position of an active ice margin in northern New Hampshire. The dated Berlin moraine ridge, which represents one of the inner moraines of the WMMS, dates to approximately 13.7 ± 0.6 ka (and must be >13.6 ± 0.1 ka, according to minimum-limiting 14C control). This date is similar to the mean age of 10Be samples from the Littleton-Bethlehem moraines (13.8 ± 0.2; Balco et al., Reference Balco, Briner, Finkel, Rayburn, Ridge and Schaefer2009) and to the age derived for the western end of the Littleton-Bethlehem moraines from varves (13.8–14.0 ka; Balco et al., Reference Balco, Briner, Finkel, Rayburn, Ridge and Schaefer2009, after Ridge et al., Reference Ridge, Besonen, Brochu, Brown, Callahan, Cook, Nicholson, Toll, Thompson, Fowler and Davis1999). Altogether, these ages point to a prominent late-glacial moraine-building event at ~13.7–14.0 ka. Such geochronological constraint is central to testing conceptual models of ice sheet recession during the termination. According to the current paradigm, this sector of the Laurentide Ice Sheet retreated progressively northward and northwestward from its LGM termini in southern New England and the Gulf of Maine, respectively (e.g., Ridge, Reference Ridge, Ehlers and Gibbard2004), eventually vacating the St. Lawrence River valley and enabling formation of the Champlain Sea (Fig. 1; Occhietti and Richard, Reference Occhietti and Richard2003; Richard and Occhietti, Reference Richard and Occhietti2005).
Constraining the first part of that model, 10Be data from southern (Balco et al., Reference Balco, Stone, Porter and Caffee2002; Balco and Schaefer, Reference Balco and Schaefer2006: recalculated here using the same production rate and scaling as our data) and northern (Balco et al., Reference Balco, Briner, Finkel, Rayburn, Ridge and Schaefer2009; Bromley et al., Reference Bromley, Hall, Thompson, Kaplan, Garcia and Schaefer2015; this study) New England depict ice-marginal retreat of >300 km between ~20 ka (recalculated mean age of the Ledyard moraine near the Connecticut coast [Fig. 1]) and ~13.7–14.0 ka, when the WMMS was being deposited by a reinvigorated ice margin. North of the WMMS, the timing of deglaciation and the St. Lawrence River marine transgression in adjacent Québec has been investigated extensively for almost half a century using radiocarbon dating (see Cronin, Reference Cronin1979; Parent and Occhietti, Reference Parent and Occhietti1988; Occhietti and Richard, Reference Occhietti and Richard2003; Occhietti, Reference Occhietti2007; Occhietti et al., Reference Occhietti, Parent, Lajeunesse, Robert, Govare, Ehlers, Gibbard and Hughes2011). Existing 14C dates are based primarily on marine fauna and, once adjusted for a reservoir effect of as much as 1700 14C yr (Occhietti and Richard, Reference Occhietti and Richard2003), place formation of the Champlain Sea at ~13.0–13.2 ka (see Richard and Occhietti, Reference Richard and Occhietti2005). The lower St. Lawrence River Estuary to the northeast presumably deglaciated earlier. Radiocarbon dates near the Maine-Quebec border place deglaciation there by ~13.4–13.5 ka, based on dates of the lowest organic materials in lake cores (Thompson et al., Reference Thompson, Fowler, Flanagan, Dorion and Van Baalen1996, Reference Thompson, Fowler, Dorion, Thompson, Fowler and Davis1999; Elkadi, Reference Elkadi2013). However, configuration of the remaining ice mass south of the St. Lawrence in Maine and Quebec and how that might relate to the WMMS and the chronology presented here remain uncertain.
Assuming that the Champlain Sea chronology is correct, construction of the WMMS at ~13.7–14.0 ka (Ridge et al., Reference Ridge, Besonen, Brochu, Brown, Callahan, Cook, Nicholson, Toll, Thompson, Fowler and Davis1999; Balco et al., Reference Balco, Briner, Finkel, Rayburn, Ridge and Schaefer2009; Bromley et al., Reference Bromley, Hall, Thompson, Kaplan, Garcia and Schaefer2015; this study) presents a potential wrinkle in the current understanding of Laurentide deglaciation in northern New Hampshire and adjacent southern Québec. For one, our results, in conjunction with previous work farther west on the WMMS, suggest the Berlin moraines represent deposition along the margin of a late glacial ice mass sufficiently robust not only to advance but also to maintain a semistable position in the northeastern White Mountains long enough to build the extensive and high-relief moraine system. The currently accepted model holds that this ice mass was the south-flowing Laurentide Ice Sheet (e.g., Thompson et al., Reference Thompson, Dorion, Ridge, Balco, Fowler and Svendsen2017). Yet, according to the marine chronology, within a few centuries of ice recession from the Berlin moraines, an open seaway filled the St. Lawrence River valley and by about 12.7 ka the Laurentide Ice Sheet's southern margin lay nearly 300 km north of the White Mountains at the Saint-Narcisse moraine (Fig. 1; Occhietti and Richard, Reference Occhietti and Richard2003; Occhietti, Reference Occhietti2007; Occhietti et al., Reference Occhietti, Parent, Lajeunesse, Robert, Govare, Ehlers, Gibbard and Hughes2011). Although the deglaciation of the St. Lawrence Estuary is beyond the scope of this article, the close timing between moraine and marine chronologies raises questions about ice sheet dynamics and configuration of ice masses in New England and southeastern Canada during opening of the Champlain Sea, such as how rapidly a calving embayment could evacuate the >600 km length of the estuary and what impact this approaching marine margin would have had on the configuration and retreat rates of adjacent terrestrial ice masses.
Implications for late glacial climate and ocean–cryosphere interactions
Both the new and existing 10Be data support previous findings that (1) deglaciation of the White Mountains was interrupted at least once during the late glacial period (Thompson et al., Reference Thompson, Fowler, Flanagan, Dorion and Van Baalen1996, Reference Thompson, Fowler, Dorion, Thompson, Fowler and Davis1999, Reference Thompson, Dorion, Ridge, Balco, Fowler and Svendsen2017) and (2) this advance was of sufficient magnitude and duration to build a conspicuous >90-km-long moraine belt, arguably the most prominent formed since the LGM. Although we do not yet know definitively the cause(s) of this advance, the 10Be-dated Berlin moraine in the eastern part of the WMMS provides two critical pieces of climatic information for northeastern North America.
First, along with the aforementioned moraine chronologies from southern New England (Balco et al., Reference Balco, Stone, Porter and Caffee2002; Balco and Schaefer, Reference Balco and Schaefer2006), the WMMS brackets a period of net deglaciation (~20–14 ka) during which the southern margin of the ice sheet retreated several hundred kilometers inland. Although this process was interrupted by brief pauses and/or reversals (e.g., the Rocky Hill readvance [Ridge and Larsen, Reference Ridge and Larsen1990], Chicopee readvance [Larsen, Reference Larsen1982], and Charlestown readvance [Ridge et al., Reference Ridge, Balco, Bayless, Beck, Carter, Dean, Voytek and Wei2012]), we interpret the overall pattern of ice retreat prior to deposition of the WMMS as reflecting increased summertime melting (Oerlemans, Reference Oerlemans2005; Zemp et al., Reference Zemp, Frey, Gärtner-Roer, Nussbaumer, Hoelzle, Paul and Haeberli2015). Moreover, we note that this pattern broadly mirrors moraine and deglacial transect records from other well-dated sections of the Laurentide Ice Sheet (Mooers and Lehr, Reference Mooers and Lehr1997; Glover et al., Reference Glover, Lowell, Wiles, Pair, Applegate and Hajdas2011; Hall et al., Reference Hall, Borns, Bromley and Lowell2017; Barth et al., Reference Barth, Marcott, Licciardi and Shakun2019) and European ice masses—including the Alps (Suter, Reference Suter1981; Lister, Reference Lister1988; Schlücter, Reference Schlüchter1988; Ammann and Lotter, Reference Amman and Lotter1989; Ravazzi et al., Reference Ravazzi, Pini, Badino, De Amicis, Londeix and Reimer2014), Scandinavia (Andersen, Reference Andersen, Denton and Hughes1981; Rinterknecht et al., Reference Rinterknecht, Marks, Piotrowski, Raisbeck, Yiou, Brook and Clark2005, Reference Rinterknecht, Clark, Raisbeck, Yiou, Bitinas, Brook and Marks2006; Lüthgens et al., Reference Lüthgens, Boese and Preusser2011; when 10Be exposure ages are recalculated using a more up-to-date production rate, such as those of Putnam et al. [Reference Putnam, Schaefer, Barrell, Vandergoes, Denton, Kaplan, Finkel, Schwartz, Goehring and Kelley2010, Reference Putnam, Bromley, Rademaker and Schaefer2019], Fenton et al. [Reference Fenton, Hermanns, Blikra, Kubik, Bryant, Niedermann, Meixner and Goethals2011], Kaplan et al. [Reference Kaplan, Strelin, Schaefer, Denton, Finkel, Schwartz, Putnam, Vandergoes, Goehring and Travis2011], Briner et al. [Reference Briner, Young, Goehring and Schaefer2012], Young et al. [Reference Young, Schaefer, Briner and Goehring2013], and Borchers et al. [Reference Borchers, Marrero, Balco, Caffee, Goehring, Lifton, Nishiizumi, Phillips, Schaefer and Stone2016]), and the British Isles (Ballantyne et al., Reference Ballantyne, Rinterknecht and Gheorghiu2013; Small et al., Reference Small, Benetti, Dove, Ballantyne, Fabel, Clark, Gheorghiu, Newall and Xu2017)—and aligns with marine evidence for enhanced meltwater discharge into the North Atlantic Ocean during Heinrich stadial 1 event (~18–14.7 ka; Toucanne et al., Reference Toucanne, Soulet, Freslon, Jacinto, Dennielou, Zaragosi, Eynaud, Bourillet and Bayon2015).
We note, however, that this emerging picture of widespread terrestrial deglaciation driven by summertime melting conflicts with classic North Atlantic marine (e.g., Bard et al., Reference Bard, Rostek, Turon and Gendreau2000; McManus et al., Reference McManus, Francois, Gherardi, Keigwin and Brown-Leger2004) and Greenland ice core data (Dansgaard et al., Reference Dansgaard, Johnsen, Clausen, Dahl-Jensen, Gundestrup, Hammer and Hvidberg1993; Grootes and Stuiver, Reference Grootes and Stuiver1997), which have been interpreted as reflecting extremely cold conditions at least during the ~3000-yr duration of the Heinrich stadial 1 event. One potential mechanism by which the two scenarios might be reconciled is enhanced seasonality (Denton et al., Reference Denton, Alley, Comer and Broecker2005), whereby stadial winters in the circum–North Atlantic were characterized by severe cooling because of the anomalous expansion of sea ice, yet summers were relatively warm and/or warming because of such factors as rising summer insolation and greenhouse gas concentrations (Marcott et al., Reference Marcott, Bauska, Buizert, Steig, Rosen, Cuffey and Fudge2014) and/or increased poleward atmospheric heat transport (McGee et al., Reference McGee, Donohoe, Marshall and Ferreira2014).
A second climatic implication of the Berlin 10Be chronology concerns the close agreement between this and similar glacial advances reported from a growing number of sites worldwide, and in both ice sheet and alpine glacier settings. Thompson et al. (Reference Thompson, Dorion, Ridge, Balco, Fowler and Svendsen2017) discussed similarities between the western and central parts of the WMMS and synchronous glacial still stands/readvances recorded by investigators in Maritime Canada (Nova Scotia), Norway, Sweden, Scotland, and Austria. Along the southern margin of the Laurentide Ice Sheet, for instance, Lowell et al. (Reference Lowell, Hayward, Denton, Mickelson and Attig1999, and references therein) summarized an advance (Two Rivers advance) of the Lake Superior Lobe that was underway by 13.8 ka, broadly coincident with the Middlesex readvance in central Vermont (≤13.8 ka: Larsen, Reference Larsen2001). On the opposite side of the Atlantic, Andersen et al. (Reference Andersen, Mangerud, Sørensen, Reite, Sveian, Thoresen and Bergström1995) reported numerous moraine systems in Norway that, within the 14C uncertainties, document advances that culminated during the Allerød interstade (~13.9–12.9 ka) and earliest Younger Dryas stade, a pattern that has also been reported from the British Isles (Bromley et al., Reference Bromley, Putnam, Borns, Lowell, Sandford and Barrell2018; Putnam et al., Reference Putnam, Bromley, Rademaker and Schaefer2019). Beyond the Northern Hemispheric ice sheets, alpine glacier systems in the tropics (Rodbell and Seltzer, Reference Rodbell and Seltzer2000; Bromley et al., Reference Bromley, Hall, Schaefer, Winckler, Todd and Rademaker2011; Jomelli et al., Reference Jomelli, Favier, Vuille, Braucher, Martin, Blard and Colose2014; Rademaker et al., Reference Rademaker, Hodgins, Moore, Zarrillo, Miller, Bromley, Leach, Reid, Yepez Alvarez and Sandweiss2014; Stansell et al., Reference Stansell, Rodbell, Licciardi, Sedlak, Schweinsberg, Huss, Delgado, Zimmerman and Finkel2015) and southern middle latitudes (Kaplan et al., Reference Kaplan, Schaefer, Denton, Barrell, Chinn, Putnam, Andersen, Finkel, Schwartz and Doughty2010, Reference Kaplan, Schaefer, Denton, Doughty, Barrell, Chinn and Putnam2013; Putnam et al., Reference Putnam, Schaefer, Barrell, Vandergoes, Denton, Kaplan, Finkel, Schwartz, Goehring and Kelley2010; Strelin et al., Reference Strelin, Denton, Vandergoes, Ninnemann and Putnam2011; Garcia et al., Reference Garcia, Kaplan, Hall, Schaefer, Vega, Schwartz and Finkel2012; Menounos et al., Reference Menounos, Clague, Osborn, Davis, Ponce, Goehring, Maurer, Rabassa, Coronato and Marr2013) underwent widespread advance between ~14.5 and 13.0 ka. Rather than constituting mere fluctuations of retreating ice margins, these events are reported as having been the most prominent late-glacial advances in their respective regions.
Acknowledging that temporal coincidence is not proof of common causality, and that individual ice masses may respond differently to a uniform forcing, the broad alignment of these geographically disparate moraine records nonetheless raises the possibility that, collectively, they represent a short-lived yet globally extensive synchronous cooling event. Further high-resolution, directly dated late glacial moraine records will be key to exploring this hypothesis further.
CONCLUSIONS
Our new 10Be data set from the Berlin moraines constrains a glacial advance in northern New Hampshire that culminated at 13.7 ± 0.6 ka. When combined with minimum-limiting radiocarbon data, the age of the Berlin moraine complex must be >13.6 ± 0.1 ka. Chronologically, this landform is statistically indistinguishable from the Littleton-Bethlehem moraines farther west, with which the Berlin moraines are correlated stratigraphically, leading us to conclude that both complexes represent contemporaneous or at least overlapping sections of the WMMS. 10Be ages also raise the possibility that the WMMS is coeval with the Androscoggin complex on the Maine–New Hampshire border.
Coupled with existing (recalculated) surface-exposure data from the southern New England coast, the WMMS 10Be chronology brackets a period of pronounced active recession, punctuated by readvances/still stands, during which the southeastern margin of the Laurentide Ice Sheet retreated >300 km from near its full LGM limits to the northern White Mountains. Much of this deglaciation, and thus atmospheric warming, occurred during Heinrich stadial 1 event (~18–14.7 ka), a period traditionally associated with annually cold conditions. Therefore, our interpretation of the New England deglacial record supports the hypothesis of extreme seasonality (warmer summers and much colder winters) during North Atlantic stadial events relative to non-stadial conditions.
Within their respective uncertainties, the ages of the Berlin moraines and broader WMMS (~13.7–14.0 ka) are in close agreement with robustly dated late glacial advances documented along other sections of the Laurentide ice margin, as well as with events farther afield in Europe, the tropics, and southern middle latitudes. Although any correlations among the data sets are at this stage speculative, the alignment nonetheless raises the possibility of a climate anomaly of potentially global scale that interrupted warming during the last glacial termination.
ACKNOWLEDGMENTS
Funds from the University of Maine supported this research. We are grateful to Susan Zimmerman, Center for Accelerator Mass Spectrometry (Lawrence Livermore National Laboratory), for analytical assistance and to two anonymous reviewers and associate editor Yeong Bae Seong for highly constructive comments on an earlier version of this manuscript.