


Epidemiological studies have shown a significant inverse association between whole-grain food consumption and the risk of premature mortality (Jacobs et al. Reference Jacobs, Meyer, Kushi and Folsom1999, Reference Jacobs, Meyer and Solvoll2001). Prospective studies have also shown that habitual consumption of whole-grain foods is associated with reduced risk of CVD (Anderson, Reference Anderson2003; Jensen et al. Reference Jensen, Koh-Bannerjee, Hu, Franz, Sampson, Grønbæk and Rimm2004; Seal, Reference Seal2006), type 2 diabetes (Venn & Mann, Reference Venn and Mann2004) and some (mainly gastro-intestinal) types of cancer (Jacobs et al. Reference Jacobs, Marquart, Slavin and Kushi1998, Reference Jacobs, Meyer, Kushi and Folsom1999, Reference Jacobs, Meyer and Solvoll2001). Habitual whole-grain food consumption in adulthood has also been associated with reduced risk of having the metabolic syndrome (Esmaillzadeh et al. Reference Esmaillzadeh, Mirmiran and Azizi2005) and a greater likelihood of having a lower body weight and long-term weight gain compared with those who consumed more refined-grain foods (Liu et al. Reference Liu, Willett, Manson, Hu, Rosner and Colditz2003; Koh-Banerjee et al. Reference Koh-Banerjee, Franz, Sampson, Liu, Jacobs, Spiegelman, Willett and Rimm2004).
Currently, there are few published reports of absolute whole-grain intake among adults. Apart from the reporting of absolute whole-grain intake in a large cohort of American adults (Jensen et al. Reference Jensen, Koh-Bannerjee, Hu, Franz, Sampson, Grønbæk and Rimm2004) and an earlier epidemiological study based in Norway (Jacobs et al. Reference Jacobs, Meyer and Solvoll2001), most estimates have reported either numbers of servings (Cleveland et al. Reference Cleveland, Moshfegh, Albertson and Goldman2000; Kantor et al. Reference Kantor, Variyam, Allshouse, Putnam and Biing-Hwan2001; Harnack et al. Reference Harnack, Walters and Jacobs2003) or eating occasions (Albertson & Tobelmann, Reference Albertson and Tobelmann1995; Lang et al. Reference Lang, Thane, Bolton-Smith and Jebb2003) of whole-grain-containing foods, without quantifying intakes of whole grains. Expressing whole-grain intake in absolute terms should provide a more precise and robust basis for assessing diet–disease associations.
The aim of the present study was to quantify and compare absolute intake and food sources of whole grains among adults living in Great Britain in 1986–7 and 2000–1, and assess their variation by selected socio-demographic and lifestyle factors.
Subjects and methods
Surveys
The Dietary and Nutritional Survey of British Adults (Gregory et al. Reference Gregory, Foster, Tyler and Wiseman1990) included adults aged 16–64 years and was conducted between October 1986 and September 1987. The National Diet and Nutrition Survey of adults aged 19–64 years (Henderson et al. Reference Henderson, Gregory and Swan2002) was conducted between July 2000 and June 2001. Both surveys collected dietary, biochemical, socio-economic and lifestyle data from randomly selected participants living in mainland England, Scotland and Wales. Full details of dietary methodology and all aspects of the surveys are provided in the survey reports (Gregory et al. Reference Gregory, Foster, Tyler and Wiseman1990; Henderson et al. Reference Henderson, Gregory and Swan2002). Ethical approval for all procedures was granted by Local Research Ethics Committees for each of the postcode sectors included in the surveys.
In 1986–7, 2197 individuals (1087 men, 1110 women; 83 % of the responding sample) completed 7 d weighed dietary records to assess food consumed both inside and outside the home. Of these records, diaries were analysed for 2086 individuals (1041 men, 1045 women), for the estimation of whole-grain intake among participants who also provided information for each of the assessed socio-demographic and lifestyle factors. These were sex (men, women), age group (16–34, 35–44, 45–54 and 55–64 years), self-reported cigarette smoking status (non-smoker, smoker), occupational social class of respondent (non-manual, manual), region (Scotland, North, Midlands, East Anglia, Wales, South West, London and South East) and season (Winter, January to February; Spring, April to May; Summer, July to August; Autumn, October to November).
In 2000–1, 1724 individuals (766 men, 958 women; 77 % of the responding sample) completed 7 d weighed dietary records. Of these records, diaries were analysed for 1692 individuals (758 men, 934 women), for the estimation of whole-grain intake in participants who also provided information for each of the same socio-demographic and lifestyle factors described earlier. Factor categories were identical to those in 1986–7, with the following exceptions. The youngest age group in 2000–1 was 19–34 years compared with 16–34 years in 1986–7, while for season categories were as follows: Winter, January to March; Spring, April to June; Summer, July to September; Autumn, October to December. For each survey, categories for occupational social class of head of household were derived from standard categories used in the Registrar General's Standard Occupational Classification (Great Britain Office of Population Censuses & Surveys, 1991). ‘Non-manual’ corresponded to social classes I, II and IIInm (professional, managerial, technical and skilled non-manual occupations), while ‘manual’ corresponded to social classes IIIm, IV and V (skilled manual, partly skilled and unskilled occupations).
For each survey, the representativeness of findings from adults included in the present study was assessed by comparing their socio-demographic and lifestyle characteristics with those of their counterparts who participated in the responding interview sample but who did not provide the necessary dietary records and socio-demographic/lifestyle information (n 549 and 559 in 1986–7 and 2000–1, respectively).
Estimating whole-grain intake
From over 4000 foods consumed in each survey, 196 foods were identified in 1986–7 as containing ≥ 10 % whole-grain content, on a DM basis as a percentage of the fresh weight of food, i.e. as consumed. In 2000–1, 153 foods were identified as containing ≥ 10 % whole-grain content. The cut-off point of ≥ 10 % whole-grain content was chosen in order not to exclude the contribution to whole-grain intake from porridge which, unlike other breakfast cereals consumed, was coded as being already made up with milk and/or water. Made-up porridge was estimated to have an 11 % whole-grain content.
Whole grains considered in the present study include whole wheat, wholemeal flour, wheat flakes, bulgar wheat, whole and rolled oats, oatmeal, oat flakes, oat flour, brown rice, wholemeal rye and rye flour, whole barley and popcorn. Cornmeal was not included as a whole-grain ingredient since it is usually de-hulled, de-branned and de-germed. Foods containing high amounts of bran, but being deficient in either or both of the other two components of whole grains (endosperm and germ), were not included as whole-grain foods. In contrast to its inclusion in a study of whole-grain food consumption by American young people (Harnack et al. Reference Harnack, Walters and Jacobs2003), sweetcorn was also not included as a whole-grain food in the present study since in both surveys it was coded as a vegetable rather than a grain.
The consumption of each food (g/week) was obtained at each time-point, from which whole-grain intake was estimated by assigning individual whole-grain contents through the use of recipes and ingredient information for each food. These were obtained either from the manufacturers (particularly for breakfast cereals), from different editions and supplements of McCance and Widdowson's The Composition of Foods (Paul & Southgate, Reference Paul and Southgate1985; Holland et al. Reference Holland, Unwin and Buss1988, Reference Holland, Welch, Unwin, Buss, Paul and Southgate1991; Food Standards Agency, 2002) or from a specialist recipe book for cakes and baked cereal products (Hobson, Reference Hobson2002). Weight losses of foods from processing were taken into account when estimating percentage whole-grain content.
Whole-grain-containing foods were also categorised as containing low, medium and high percentages of whole grains, corresponding to 10 to < 25, 25 to < 51, and ≥ 51 % whole-grain content. Although 51 % whole-grain content is a useful cut-off point for the purposes of food labelling and health claims (Richardson, Reference Richardson2003), and has been used for some previous analyses (Lang et al. Reference Lang, Thane, Bolton-Smith and Jebb2003; Jensen et al. Reference Jensen, Koh-Bannerjee, Hu, Franz, Sampson, Grønbæk and Rimm2004), foods containing a smaller percentage may be consumed in sufficient amounts to make a significant contribution to total whole-grain intake. The variation in the contribution to whole-grain intake from foods containing the three ranges of whole-grain content was assessed by smoking status and the different socio-demographic factors.
Data analysis
Whole-grain intake is reported in g/d and in relation to 16 g amounts; the size of a typical serving suggested in the USA (US Department of Agriculture, 2006). Individuals with energy requirements of at least 1600 kcal/d (equivalent to 6·7 MJ/d) have been recommended to consume at least three 1 oz servings of whole-grain foods/d (US Department of Health and Human Services & US Department of Agriculture, 2005). Therefore, percentages of adults consuming less than three as well as no daily 16 g amounts of whole-grain intake were also determined, by considering all foods containing ≥ 10 and ≥ 51 % whole-grain content.
The variation in whole-grain intake and the main food sources were examined by sex, age group, occupational social class, smoking status, region and season in 1986–7 and 2000–1. Food sources of whole-grain intake and consumption/non-consumption of whole-grain-containing breakfast cereals and wholemeal bread were examined for men and women together and separately.
Non-parametric statistical tests were performed when the frequency distributions of whole-grain intake (in g/d) were non-normally distributed, with the best average provided by the median and spread of values given by the interquartile range (iqr, representing the central 50 % of the distribution). The arithmetic mean (with sd or 95 % CI) is also provided for comparison. For each socio-demographic or lifestyle factor, category differences in whole-grain intake were determined using the Mann–Whitney U test and Kruskal–Wallis H test for two- and multi-level factors, respectively. For percentages of participants with whole-grain intakes below specified 16 g amounts/d, univariate analyses were conducted using the χ2 test. Multiple logistic regressions were also conducted, in order to adjust for possible confounding effects of the other factors.
Throughout, all statistical tests were two-sided with P < 0·05 denoting statistical significance. Food consumption data were collated and analysed using Excel (Microsoft Corp., Redmond, WA, USA) and SPSS (SPSS Inc., Chicago, IL, USA) software programs.
Results
In 1986–7, participants excluded from the present study (549/2635; 21 % of the ‘responding’ sample) did not differ significantly from those included with respect to smoking status, socio-demographic characteristics and region of habitation. Results obtained from participants included from 1986–7 may therefore be regarded as representative of participants included in that survey as a whole. In 2000–1, significant differences existed in the distribution of participants included in and excluded from (559/2251; 25 % of the ‘responding’ sample) the present study. Excluded participants were more likely to be aged < 35 years (35 v. 29 % of the respective sub-samples), live in Scotland or northern England (40 v. 33 %) and report being smokers (39 v. 32 %) (each P < 0·01).
Although the socio-demographic and smoking characteristics of adults from the two surveys included in the present study were broadly similar, some differences were apparent. Age group distributions differed significantly between the two surveys (P < 0·001; χ2), with a higher percentage of men and women aged < 35 years in 1986–7 v. 2000–1 (40 v. 29 %). In 1986–7, a higher percentage of participants also reported having a manual occupation compared with 2000–1 (46 v. 39 %; P < 0·01).
Whole-grain intake
Median intakes in 1986–7 and 2000–1 were 16 (IQR 0–45) and 14 (IQR 0–36) g/d, respectively (P < 0·001) Corresponding means were 29 (sd 34) and 23 (sd 28) g/d in 1986–7 and 2000–1, respectively. In 1986–7, whole-grain intake ranged from 0 to 334 g/d compared with 0 to 214 g/d in 2000–1. Inner 95 % ranges of values were 0–116 and 0–98 g/d, respectively. When whole-grain intake was estimated using foods with ≥ 51 % whole-grain content, median intakes in 1986–7 and 2000–1 were 13 (IQR 0–39) and 9 (IQR 0–29) g/d, respectively (P < 0·001). Corresponding means were 25 (sd 32) and 18 (sd 25) g/d, respectively.
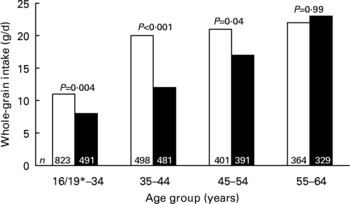
Whole-grain intake did not differ by sex but increased significantly with age in both 1986–7 and 2000–1 (each P < 0·001), as shown in Fig. 1. Whole-grain intake was significantly higher in 1986–7 v. 2000–1 in all age groups except those aged 55–64 years.
Median whole-grain intake of adults by age group in 1986–7 (□) and 2000–1 (■). *In 1986–7, 16 years; in 2000–1, 19 years. P values refer to comparisons between 1986–7 and 2000–1, for each age group.
Self-reported cigarette smokers were found to have a lower median intake of whole grains than non-smokers in 1986–7 (6 v. 25 g/d; P < 0·001) and 2000–1 (4 v. 20 g/d; P < 0·001). Consistent with the overall secular trend, both smokers and non-smokers in 1986–7 had higher median whole-grain intakes than their respective counterparts in 2000–1 (P < 0·01 and P < 0·001, respectively). At both times, adults with a manual occupation had lower whole-grain intake compared with those employed in a non-manual occupation (each P < 0·001). The decline in median whole-grain intake between 1986–7 and 2000–1 was greater among adults of non-manual v. manual occupational social class (24 v. 18 g/d, P < 0·001; 8 v. 7 g/d, P = 0·02).
Regional and seasonal differences in whole-grain intake were more subtle and variable than with other factors. For the entire sample, whole-grain intake varied significantly by region in 1986–7 but not in 2000–1. This applied whether all foods with ≥ 10 % whole-grain content were considered or only those with ≥ 51 % content. In 1986–7, whole-grain intake was lowest among adults living in Scotland, followed by those living in Wales. In 2000–1, there were no significant regional differences in whole-grain intake, owing to a decline in whole-grain intake from 1986–7 within regions other than Scotland and Wales. Median whole-grain intake almost doubled in Scotland between 1986–7 and 2000–1 (from 8 to 15 g/d), while that in Wales increased by 10 % (from 10 to 11 g/d). The largest declines in whole-grain intake between 1986–7 and 2000–1 occurred in northern England and the Midlands and, in the case of women, East Anglia. Overall, whole-grain intake did not vary significantly with season in 1986–7 or 2000–1.
In 1986–7, 77 % of adults had less than three 16 g amounts/d v. 84 % in 2000–1 (P < 0·001). When only foods containing ≥ 51 % whole-grain content were considered, these percentages became 80 and 89 %, respectively (P < 0·001). Adults of both sexes were less likely to have less than three 16 g amounts of whole-grain intake in 1986–7 compared with 2000–1 (each P < 0·01; Table 1). In both surveys, men were significantly less likely than women to have less than three 16 g amounts of whole-grain intake/d.
Percentage of adults with intakes below three 16 g amounts of whole grains/d in 1986–7 and 2000–1, by selected socio-demographic and lifestyle factors

a,b For each category of each factor, superscript letters indicate statistically significant differences between 1986–7 and 2000–1 (aP < 0·01, bP < 0·001; χ2 test).
* P values for category differences within columns are derived from univariate and multivariate analyses: univariate analyses by χ2 test, multivariate analyses by multiple logistic regression (after adjusting for each of the other five factors, including region and season). Values for region and season are not shown since they did not differ significantly (P ≥ 0·05) between categories for these two factors.
† Expressed as DM (i.e. excluding moisture content) per fresh weight of food.
‡ In 1986–7, 16 years; in 2000–1, 19 years.
Sources of whole-grain intake
In 1986–7, the biggest single contributor of whole-grain intake was bread (54 %), followed by breakfast cereals (28 %). In 2000–1, the importance of these two major contributors was reversed, with bread providing 44 % and breakfast cereals 45 % of whole-grain intake (each P < 0·001, compared with 1986–7). Biscuits contributed more to whole-grain intake in 1986–7 compared with 2000–1 (12 v. 7 %; P < 0·001); with minor contributions provided by foods such as pasta, rice, popcorn and cereal-based puddings.
Wholemeal bread provided 48 % of whole-grain intake in 1986–7 compared with only 31 % in 2000–1 (P < 0·001). Hence, in 2000–1, other whole-grain-containing breads (e.g. rye and granary breads, and some rolls) contributed significantly more to whole-grain intake than 14 years earlier. In addition, the contributions from biscuits and pasta, rice, pizza and other cereals also fell.
Foods with ≥ 51 % whole-grain content contributed 82 % (95 % CI 81, 84) of overall whole-grain intake in 1986–7 v. 73 % (95 % CI 71, 75) in 2000–1 (P < 0·001). In 1986–7, foods with 25 to < 51 % whole-grain content contributed 12 % (95 % CI 10, 13) of whole-grain intake, v. 17 % (95 % CI 15, 19) in 2000–1 (P < 0·001), with the remainder derived from foods (e.g. porridge made up with milk and/or water) containing 10 to < 25 % whole-grain content. In 2000–1, adults with manual occupations derived more of their whole-grain intake from foods with 10 to < 25 % whole-grain content compared with their non-manual counterparts (13 v. 9 %; P = 0·01). Overall, the vast majority of whole-grain intake was in the form of wheat as opposed to other cereal grains such as oats, rye and barley.
Non-consumers of whole-grain foods
In 1986–7, 25 % of adults had no reported whole-grain intake during the 7 d period of dietary assessment compared with 29 % in 2000–1 (P = 0·02). When only foods containing ≥ 51 % whole-grain content were considered, these percentages became 31 and 39 %, respectively (P < 0·001).
Percentages of men and women with no reported whole-grain intake did not differ significantly between surveys, after consideration of other socio-demographic and lifestyle factors (Table 2). However, women were less likely to report no whole-grain intake in 1986–7 compared with 2000–1 (22 v. 27 %; P = 0·02). In both surveys, adults in the youngest age group were most likely to report no whole-grain intake.
Percentage of adults with no whole-grain intake in 1986–7 and 2000–1, by selected socio-demographic and lifestyle factors

a,b,c For each category of each factor, superscript letters indicate statistically significant differences between 1986–7 and 2000–1 (aP < 0·05, bP < 0·01, cP < 0·001; χ2 test).
* P values for category differences within columns are derived from univariate and multivariate analyses: univariate analyses by χ2 test, multivariate analyses by multiple logistic regression (after adjusting for each of the other five factors, including region and season). Values for region and season are not shown since they did not differ significantly (P ≥ 0·05) between categories for these two factors.
† Expressed as DM (i.e. excluding moisture content) per fresh weight of food.
‡ In 1986–7, 16 years; in 2000–1, 19 years.
At both times, smokers were more likely than non-smokers to have no reported whole-grain intake (each P < 0·001). This was also more likely among adults of manual v. non-manual occupational social class, independent of other socio-demographic factors and smoking habit. Smokers in 1986–7 were less likely to have no reported whole-grain intake compared with 2000–1, while this also applied to those of non-manual occupational social class – when considering foods with ≥ 10 % whole-grain content.
Over the 7 d periods of assessment, a higher percentage of adults consumed no whole-grain-containing breakfast cereals in 1986–7 compared with 2000–1 (61 v. 49 %; P < 0·001). The percentages of adults who consumed no wholemeal bread were almost the reverse in 1986–7 compared with 2000–1 (49 v. 64 %; P < 0·001). In 1986–7, 35 % of adults consumed neither whole-grain-containing breakfast cereals nor wholemeal bread, compared with 36 % in 2000–1 (P = 0·27).
Discussion
The present study is the first to report comparative whole-grain intake among representative samples of adults living in the UK, in 1986–7 and 2000–1. It shows that whole-grain intake was low in 1986–7 and became even lower over time, with median intakes equivalent to only one serving per day. In each survey, over three-quarters of adults had less than three 16 g amounts of whole grains/d; more than one-quarter reported no whole-grain intake. Adults with the highest whole-grain intake in both 1986–7 and 2000–1 were more likely to be non-smokers and of non-manual rather than manual occupational social class, independent of smoking status. Similar findings were observed among British adults aged 65 years and over (Lang et al. Reference Lang, Thane, Bolton-Smith and Jebb2003) and in a sample of American adults (Cleveland et al. Reference Cleveland, Moshfegh, Albertson and Goldman2000).
Absolute intakes of whole grains are not easy to compare to other literature since previous surveys have tended to use servings of whole-grain foods, eating occasions or used a higher cut-off point for food whole-grain content (e.g. ≥ 25 and ≥ 51 %). Notwithstanding some methodological differences, the low whole-grain intake of the present study is consistent with that reported in the USA, for both adults (Cleveland et al. Reference Cleveland, Moshfegh, Albertson and Goldman2000; Jensen et al. Reference Jensen, Koh-Bannerjee, Hu, Franz, Sampson, Grønbæk and Rimm2004) and young people (Albertson & Tobelmann, Reference Albertson and Tobelmann1995; Kantor et al. Reference Kantor, Variyam, Allshouse, Putnam and Biing-Hwan2001; Harnack et al. Reference Harnack, Walters and Jacobs2003), and among older British adults (Lang et al. Reference Lang, Thane, Bolton-Smith and Jebb2003) and young people (Thane et al. Reference Thane, Jones, Stephen, Seal and Jebb2005).
Breakfast cereals and bread (mainly wholemeal bread) contributed most to whole-grain intake, with modest contributions from biscuits (7–12 %). However, whereas bread contributed most (54 %) to whole-grain intake in 1986–7, followed some way behind by breakfast cereals (28 %), by 2000–1 the contributions of these two major sources were almost identical (44–45 %), reflecting the increased popularity of whole-grain breakfast cereals and overall decline in bread consumption in recent years. It is noteworthy that 61 and 49 % of adults in 1986–7 and 2000–1 consumed no whole-grain breakfast cereals and 49 % of adults in 1986–7 consumed no wholemeal bread, compared with 64 % 14 years later. The percentages of non-consumers of these main providers of whole-grain intake are broadly comparable with those reported previously for young people (Thane et al. Reference Thane, Jones, Stephen, Seal and Jebb2005).
The decision to estimate whole-grain intake by considering consumption of all foods containing ≥ 10 % rather than higher amounts of whole-grain content raises an important issue. If only foods containing a higher percentage of whole grains were considered, for example ≥ 51 % whole-grain content, intake would have been underestimated by 18 % in 1986–7 and 27 % in 2000–1. A lower cut-off point of 25 % whole-grain content has also been used (Jacobs et al. Reference Jacobs, Marquart, Slavin and Kushi1998; Jensen et al. Reference Jensen, Koh-Bannerjee, Hu, Franz, Sampson, Grønbæk and Rimm2004). If this cut-off point had been used in the present study, whole-grain intake would still have been underestimated by 6 % in 1986–7 and 10 % in 2000–1.
It should also be noted that although the present study has focused only on foods containing the whole grain, health benefits may also be obtained by consuming grains from which only a small proportion of the whole grain has been removed during processing, and from foods with added whole-grain components such as bran. When consumed in large amounts, foods containing most or important components of the whole grain may also confer health benefits. This underlines the need to establish a clearer mechanistic basis for the health effects currently attributed to ‘whole-grain’ foods.
It is clear from the present study that whole-grain food consumption of British adults was low in 1986–7 and lower in 2000–1. Further research is required to (1) determine the level of absolute whole-grain intake associated with reduced risk of chronic diet-related diseases, and (2) examine the long-term impact of increased consumption of whole-grain foods, through controlled dietary intervention studies. Positive evidence from these two approaches will provide a stronger basis for specific dietary recommendations to increase whole-grain intake.
Acknowledgements
The present study was funded by Cereal Partners UK and the Medical Research Council. We also thank the UK Data Archive, University of Essex, Colchester for providing electronic copies of datasets for the two surveys and for granting permission for this analysis, and Professor David Richardson of DPR Nutrition Ltd, Croydon, UK for providing helpful contributions to this study.



