


Introduction
On polythermal glaciers, where superimposed ice represents a significant component of glacier mass balance, the firn-line (i.e. snow-line) position and the equilibrium line are not the same. The firn line, unlike the equilibrium line, is the physically recognizable boundary between firn and ice on the glacier surface at the end of the melt season (Reference PatersonPaterson, 1994). On polythermal glaciers the firn linemarks the transition zone to down-glacier cold ice at the surface. The transition from water-permeable firn to impermeable cold ice evolves as the snowpack in the upper firn part of the glacier becomes wet with meltwater in the summer (e.g. Reference MullerMuller, 1962). The water that percolates down and partly refreezes in the deeper layers raises the temperature of the firn to the melting point. However, down-glacier of the firn line the ice becomes impermeable, preventing penetration of meltwater except via crevasses or moulins. The ice is then cooled below the melting point during the winter. This transition is therefore complex, starting in the low-percolation (soaked) zone and finishing in the superimposed-ice zone (Reference PatersonPaterson, 1994, p. 10). The transition starts with the formation of ice lenses and ice layers in firn that contains much meltwater in summer. Some of this water refreezes, often after percolating along pipes to colder depths, and eventually spreads horizontally to form ice lenses.
Radar is an excellent tool for studying the firn–ice transition of a glacier because of the large difference in dielectric permittivity between water, firn and ice. Reference BjörnssonBjörnsson and others (1996) noted the very steep contact line between the cold and temperate ice within four polythermal glaciers in Svalbard. Only two of the glaciers studied, Kongsvegen and Uversbreen, were large enough to have a significant firn area typical of Svalbard glaciers, and all have very low surface velocities. During the course of several field seasons on Svalbard, we have mapped many glaciers using ground-penetrating radar (GPR), including several larger ones with much more typical flow regimes and larger firn areas than those studied by Reference BjörnssonBjörnsson and others (1996). We have noticed that the firn line and the structures associated with it have many common features, while also varying quite considerably between the glaciers.
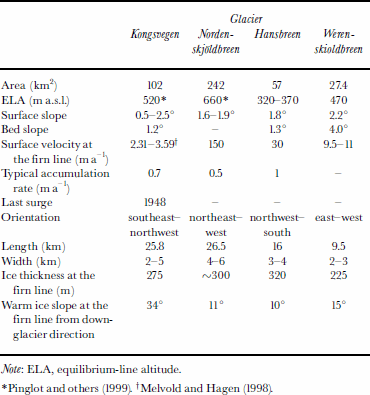
Our objectives are to interpret features of the radargrams in terms of physical structures associated with the firn–ice transition and to postulate reasons for their differences between the glaciers. We present detailed GPR data from the firn–ice transition zone of four medium and large polythermal glaciers: Kongsvegen, Nordenskjoldbreen, Hansbreen and Werenskioldbreen (Fig. 1), each of which can be considered typical of glaciers in Svalbard, although they range widely in their physical properties (Table 1). Many of the radar features are previously unreported, but seem to be present in varying degrees in all polythermal glaciers.
Map of Svalbard. Locations of Kongsvegen, Nordenskjoldbreen, Hansbreen and Werenskioldbreen.

Some physical properties of Konsvegen, Nordenskjoldbreen, Hansbreen and Wereskioldbreen
Study Area
Kongsvegen
Kongsvegen is a large tidewater glacier situated in the inner part of Kongsfjorden (Fig.1). The glacier has a shallow surface slope and it extends from sea level to 800 ma.s.l. Kongsvegen has a large firn zone and volume of temperate ice in its higher basin. In the ablation area the cold ice layer is 50–160m thick (Reference BjörnssonBjörnsson and others, 1996) and the glacier is frozen to the bed along the mountainsides (Reference LiestølLiestøl, 1988; Reference BamberBamber, 1989; Reference BjörnssonBjörnsson and others, 1996). Mass-balance measurements were started in 1987. The mean annual net balance with an estimated calving rate of 0.05 mw.e. a–1 is slightly positive, +0.11mw.e. (Reference Lefauconnier, Hagen, Ørbæk, Melvold and IsakssonLefauconnier and others, 1999). The ice-flow velocity is <4ma–1 along the entire basin, and the surplus in accumulation is not transported to the ablation area. The glacier seems to be building up towards a surge (Reference Melvold and HagenMelvold and Hagen, 1998; Reference Lefauconnier, Hagen, Ørbæk, Melvold and IsakssonLefauconnier and others, 1999).
Nordenskjoldbreen
Nordenskjoldbreen is one of the major drainage glaciers of Lomonosovfonna, one of the highest ice fields on Spitsbergen, with the summit at 1250ma.s.l. The maximum depth is estimated to be about 500 m (personal communication from V. Pohjola, 2002). There are no mass-balance data available. The accumulation rate varies along the longitudinal profile of Nordenskjoldbreen from 0.38 at the summit to 0.52– 0.78 mw.e at 1044 and 1173ma.s.l. (Reference PinglotPinglot and others, 1999; Reference PalliPalli and others, 2002). Ice-velocity measurements at the centre line close to the equilibrium line on Nordenskjoldbreen suggest high ice fluxes (Reference IsakssonIsaksson and others, 2001).
Hansbreen
Hansbreen is a tidewater glacier situated in the Hornsund fjord in southern Spitsbergen (Fig. 1). The glacier extends from sea level to 600 ma.s.l. The maximum thickness is about 400 m and the ablation area has a 20–90m thick cold-ice layer. Mass-balance studies have been made since 1989. Mean winter accumulation in 2000 was 0.93 mw.e. and mean summer balance –1.14 mw.e., so the total net balance in 2000 was –0.21mw.e. (personal communication from J. Jania and P. Glowacki, 2002). Hansbreen has a measured speed of 30 ma–1 at the equilibrium line. The glacier accelerates significantly towards the terminal ice cliff, exceeding 210 ma–1 near the terminus (Reference Jania, Mochnacki and GadekJania and others, 1996).
Werenskioldbreen
Werenskioldbreen is a land-based valley glacier next to Hansbreen but flowing from east to west (Fig.1). It is divided by a massive moraine ridge into Werenskioldbreen to the south and Skilryggbreento the north. The glacier is situated at 0–600m a.s.l. The glacier is very shallow; the thickest parts are 100–140 m on the central southern side and in the upper northern parts of the glacier. The snout is <50 m thick and the glacier is frozen to bedrock for 700 m–1km upstream from the terminus. The cold-ice layer thickness varies from 50 to 100 m. Both the sides and some areas in the upper parts, where the glacier is 550 m thick, have cold ice down to the bed. Mass balance was measured for the 1993/94 and 1998/99 glaciological years, and both net balances were negative: –0.36 and –0.66 mw.e., respectively (personal communication from P. Glowacki, 2002).
Equipment and Methods
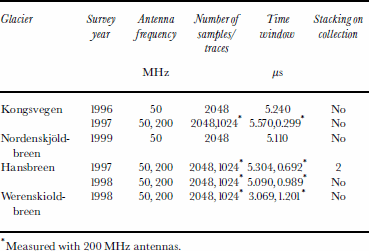
All surveys were done in the spring seasons (April and May) between 1996 and 2000, when the whole glacier was covered by a layer of winter snow, and in air temperatures around –10°C, with no evidence of any near-surface water. We used a Ramac GPR (Malå Geoscience) with 50 and 200 MHz antennas. The profile lines were driven by snowmobile with position fixed by global positioning system receivers. The radar antennas were mounted on a non-metallic sledge pulled 7 m behind the snowmobile. Post-processing used the Haescan program (Roadscanners Oy). More detailed survey information is presented in Table 2.
Measurement parameters for each GPR survey
Time–depth scale
The propagation velocities of the radar waves for snow and firn, cold ice and temperate ice on Hansbreen (Reference Macheret, Moskalevsky and VasilenkoMacheret and others 1993; Reference PalliPalli, 1998) were measured using the common-depth-point technique. We observe large differences in radar velocity due, as expected, to the different density profiles in the ice in the region down-glacier of the firn line, as compared with the area up-glacier (173 and 210 m ms–1), and large variations over short lateral distances due to variations in water content of the glacier ice (146–160 mms–1; Reference MooreMoore and others, 1999). This variability precludes the use of simple time migration, which requires a specific permittivity value and that hyperbolic diffraction patterns cannot be easily interpreted. Therefore, in the figures, we present data in terms of two-way radar-wave travel times rather than real depth; differences in glacier topography are best assessed using Table1, or estimated using the velocities quoted.
Common Features and Differences in the Firn–Ice Transition
The firn line in GPR profiles appears similar everywhere. As one goes up-glacier towards the firn line, near-surface layering starts increasing in thickness. At the firn line, strong reflections from alternating firn/ice layers dip downwards up-glacier, the cold-ice layer disappears and the whole thickness of ice becomes temperate. However, the length of the firn–ice transition zone down-glacier from the firn line varies from 300–400m on Hansbreen, Werenskioldbreen (Fig.2) and Nordenskjoldbreen (Fig. 3) to about 1.5km on Kongsvegen (Fig. 4). The complex zone below the firn line is where most of the differences between the glaciers are seen, as responses to m superimposed-ice formation, ablation and runoff and changes in firn-line position all contribute features to the radargrams.
50 MHz radar profile from Werenskioldbreen. Dipping foliations are seen clearly in the cold ice, and a strong hyperbolic diffraction indicating a likely water body. Much radar clutter is seen in the temperate ice underneath the cold-ice layer. The region of superimposed ice, estimated by the presence of weaker sub-parallel layering and sporadic hyperbolic diffractions down-glacier of the firn line, is delimited by the white line and, where it is hard to determine, by the dashed line. The number of firn layers indicates that the oldest firn is 10–15 years old.

50 MHz radar profile from Nordenskjo ldbreen. The firn line is hard to locate, as there seems to be a wet area extending down-glacier to about 1350 m of the intersection of the upward-dipping layers, which would intersect the surface around 1410 distance.

The firn–ice transition in 50 MHz GPR data of Kongsvegen. The firn line from the GPR data and the satellite image (labelled as “sat-firn line”; see Fig. 5) is marked, along with the location of stake 7. The layering in the firn area is easily interpret the hyperbolic diffractions on top of warm ice and just before the line as water bodies. Superimposed ice sporadic reflections around 200 ns and variable-strength sub-parallel reflections are delimited by the white line.

Dip angle
The steepness of dip angle of the firn–ice transition within the glacier appears to vary between the glaciers (Table1). In a steady state the angle must represent a balance between the advection rate of temperate ice and the freezing rate of water in the ice. This must be determined by the glacier flow rate and the vertical velocity at the firn line. Thus we may expect slow-moving glaciers with low downward vertical velocity at the firn line to have very steep angles of dip (cf. Kongsvegen), while fast-flowing glaciers with rapid accumulation at the firn line may have much shallower angles (cf. Nordenskjoldbreen). Data on vertical velocity at the firn line are in general lacking on most glaciers, and in any case the fact that many (if not all) of these glaciers are surge-type probably precludes a steady state.
Foliations
Down-glacier of the firn line, foliations are often seen throughout the englacial ice. However, crevasses or very wet temperate ice can destroy the foliation (Reference MooreMoore and others, 1999). On Hansbreen (Reference MooreMoore and others, 1999) and Werenskioldbreen, foliations (Fig. 2) are seen very clearly because of a fairly thick cold-ice layer or low velocity (Kongsvegen; Fig. 4). On Nordenskjoldbreen (Fig. 3) the high velocity of the glacier may partly destroy foliations, which is why they are not as numerous, as continuous nor as strong as on Hansbreen. The rather weak reflections appear to be caused by the density contrast between layers of bubble-rich ice formed from firn and relatively bubble-free ice formed by freezing of water-saturated layers.
Superimposed ice
Superimposed ice forms when meltwater refreezes onto a sub-freezing glacier surface. It can be distinguished from glacier ice by its different air-bubble content (Reference Konig, Wadham, Winther, Kohler and NuttallKonig and others, 2002). Superimposed ice has been thought to be difficult to observe with GPR, because layers and ice lenses merge into a continuous mass and would show neither as point reflectors nor as clear layering in the data. However, high-resolution 500 MHz radar data (personal communication from J. Kohler, 2002) show an easily distinguishable interface between superimposed and englacial ice on Kongsvegen that varies between the winter snow base and >12m in depth. In our 50 MHz profiles on Kongsvegen, sporadic hyperbolas and places of enhanced scattering were seen at depths of about 5–20m (or travel times of up to 200 ns), perhaps every 50–100 m in an irregular area down-glacier of the firn line. This region contrasts with the engalcial ice close to the terminus of the glacier, and the characteristic layering seen in the firn area.
In Figure 5 we map the three different zones observed by the radar, together with a composite satellite image of a SPOT infrared (IR) August 1996; Landsat Thematic Mapper (TM) IR August 1993; and European Remote-sensing Satellite-1 (ERS-1) synthetic aperture radar (SAR) September 1995. The time is close to the end of the melting season for all images. The SPOT image is from a year with moderate melting, and the Landsat image from a year with close to maximum melt. Variations in backscatter in the ERS-1 SAR image are due to topography, and reflectance of different ice types (e.g. Reference Konig, Wadham, Winther, Kohler and NuttallKonig and others, 2002). The zone of sporadic hyperbolic reflections in the 50 MHz profiles fits closely to the region that is between the maximum and minimum elevations of the snow line, the upper limit being the firn line, with the lower limit defined by the region that melts down to bare englacial ice every year. We believe that this region marks the superimposed-ice zone on the glacier, and is rather similar to the zonation of the SAR image that Reference Konig, Wadham, Winther, Kohler and NuttallKonig and others (2002) use to identify superimposed ice. Theclose fit between the GPR zones and the satellite imagery shows that GPR can be used to identify superimposed ice. A comparison between the SAR image of Konig and others (2002) and our images of the firn line between stakes 6 and 7 (Fig. 5) gives a firn-line location at about scan 4600–4625 in Figures 4 and 5. There is a difference of about 100–200m. We are unable to identify any equilibrium line in both our satellite image and that of Reference Konig, Wadham, Winther, Kohler and NuttallKonig and others (2002), as there is no apparent difference between superimposed ice that is being accumulated and superimposed ice that is being ablated.
Kongsvegen grey-toned RGB colour composite: red: SPOT96; green: TM93; blue: ERS-1 95. The 50 MHz radar runs up-glacier, along the centre line from stake 1to 9 (about 18 km), and across the firn–ice transition in several places. along the centre line refer to radar scan numbers used in Figure 4. The radar images were interpreted into three classes sections shown in black show cold ice only covered by winter snow. The sections which showed largely englacial cold features that appear to identify superimposed ice, are shown in grey. Sections marked with a dashed black line are clearly firn with strong, near-surface layering. The possible superimposed-ice-zone (seen in the SAR image as medium backscatter) boundaries are marked with thin white solid line.

The enhanced GPR scattering features on Kongsvegen appear to come from depths consistent with the base of the superimposed zone. We speculate that they are caused by dielectric contrasts due to enhanced water in the ice: each 1% increase in water content decreases the radar velocity by about 2.5% and also creates a large reflection coefficient (Reference Macheret and GlazovskyMacheret and Glazovsky, 2000). Liquid water could occur in highly concentrated solution (about 2M; Reference LideLide, 1993, p. 15– 16) consistent with ice temperatures of –3 to –5°C (temperatures seen in Hansbreen; Reference Jania, Mochnacki and GadekJania and others, 1996). It is well known that during the summer melt period, much (perhaps 90%) of the soluble impurity in the winter snow on low-elevation Svalbard glaciers is flushed out (Reference Jania, Mochnacki and GadekJania and others, 1996) and must travel through the superimposed-ice zone.
We also observed sporadic hyperbolas from Hansbreen with 200 MHz antennas down-glacier of the firn line (Fig. 6), which possibly indicates superimposed ice. These features are similar to the superimposed-ice features on Kongsvegen at 50 MHz (Fig. 4), in that they appear to show layering in the upper parts and then a hyperbolic diffraction near the bottom of each feature. The down-dipping layers can be explained by a low radar-wave velocity region caused by higher liquid-water content in the ice, and the hyperbola could come from the more saturated base of the wet patch. Fitting curves to the hyperbolas in the boxes of Figure 6 gives water contents of 1.2–3.6% in the superimposed ice with the low-velocity “pull-down” layers. The velocities calculated from the hyperbolas are potentially in error if the radar survey did not pass vertically over the source of the diffractions. An alternative hypothesis is that the features in Figure 6 are buried crevasses (Reference Arcone, Delaney, Noon, Stickley and LongstaffArcone and Delaney, 2000); however, hyperbolic diffractions would show a velocity for firn if they came from the crevasse walls, rather than the low velocity indicated. Crevasses have not been observed on this part of glacier, but are seen further down-glacier, where they produce reflections with weaker hyperbolas that start nearer the surface, with no “pull-down” layers above them.
Hyperbolic reflections (in boxes A, B, C) at 50–100 ns (5–10 m depth) ∼200 m down-glacier of the firn line in 200 MHz data of Hansbreen, possibly indicating superimposed ice (cf. Fig. 2–4). The down-dipping layers in the boxes could be due to enhanced water content in the ice, the hyperbolic scattering indicates water contents of 1.2%, 3.3% and 3.6% for boxes A, B and C, respectively.

Water bodies
The GPR data from Kongsvegen (Fig. 4), Hansbreen (Reference MooreMoore and others, 1999) and Werenskioldbreen (Fig. 2) show that these glaciers have occasional hyperbolic diffractions seen only in the cold-ice glacier ice or on top of the temperate ice. It seems plausible that only water bodies could cause such a large dielectric contrast as to be easily seen with radar. Metre-scale dimensions are indicated by the point-source reflection at 50 MHz, and would remain liquid within ice at –3°C for many years, even if the water were not connected to the glacier hydraulic system. Reference Macheret and GlazovskyMacheret and Glazovsky (2000) show that the water content of Svalbard glaciers varies considerably over time, and it is possible that many of the hyperbolas originate at voids or channels that could be empty or partially filled. An air-filled void would collapse under ice pressure relatively quickly, suggesting that they are, or have been recently, water-filled. Alternative causes such as large boulders are unlikely, given the number of hyperbolas, their strength and their rarity on the glacier surface. The temperate ice is too cluttered, and hyperbolic reflections from individual water channels are impossible to see. Nordenskjoldbreen has some hyperbolic reflectors indicating water channels, but not as many as on the other surveyed glaciers, and they often have a slightly irregular shape (also seen occasionally on Kongsvegen; Fig. 4), possibly because they are two-dimensional channels inclined to the path of the radar.
Conclusions
We have used GPR data from four different polythermal glaciers in Svalbard to study their firn–ice transition zones and discuss differences in hydrologicalstructure. The firnline and the whole firn–ice transition zone can be clearly detected with GPR with all the antenna frequencies used. On each of the four glaciers, the radar profiles show continuous layers typically about 2 m apart from each other up-glacier from the firn line. They are observed in the top 10–20m of firn and increase in thickness up-glacier. These reflecting horizons are likely from layers of ice lenses and relatively low-density firn. At the firn line, reflections from the cold-ice layer disappear and the whole thickness of ice becomes temperate.
Similar structures were observed in the firn–ice transition area, though with different emphasis on each glacier. Foliations were observed in all the glaciers, but they were most clearly seen on Hansbreen and Werenskioldbreen, which are relatively slowly flowing and have thick cold-ice layers. Superimposed ice was clearly detected on Kongsvegen and Hansbreen. The limited resolution and the sporadic nature of the reflections means that the overall extent of superimposed ice is difficult to measure accurately, though there is encouraging similarity between GPR and satellite imagery for superimposed ice on Kongsvegen. The nature of the reflections in the superimposed-ice zone, which seem to come mainly from the interface of the superimposed ice and the underlying glacier ice, is uncertain, but most easily explainable by increased water content of a few per cent at sporadic locations within the superimposed ice.
Acknowledgements
Financial support came from the Finnish Academy, the Finnish Graduate School of Snow and Ice and the Thule Institute supporting the radar development. We thank the Institute of Geophysics (PAS) and the Polish Polar Station in Hornsund and the Norwegian Polar Institute for logistic support. Our special gratitude is expressed to J. Jania,P. Glowacki,J.Kohler, N. Lonnruth, K. Michalski and A. Sinisalo for assistance in the field. The Wihuri Physics Laboratory, University of Turku, Finland, kindly allowed the first author to do her work at their office. Excellent guidance on the manuscript was given by two anonymous reviewers.



