INTRODUCTION
Rice-wheat cropping is dominant in the irrigated alluvial tract of the Indo-Gangetic Plains (IGP) in South Asia due to its high productivity and profitability. Coarse-textured soils of this tract are low in organic carbon and weakly structured (Sawhney et al., Reference Sawhney, Verma, Sharma and Sharma1992). Puddling these soils for rice culture to reduce percolation of water causes high soil strength in the upper layers (Gajri et al., Reference Gajri, Arora and Prihar1992). This leads to poor soil permeability resulting in incomplete recharge of soil water and restricted rooting of the following wheat crop (Sur et al., Reference Sur, Prihar and Jalota1981).
Resource conservation technologies like zero-tillage in wheat following rice have been developed and promoted in different regions of the IGP (Hobbs and Gupta, Reference Hobbs and Gupta2003). A recent review on zero tillage impacts in India's rice-wheat systems (Erenstein and Laxmi, Reference Erenstein and Laxmi2008) concluded that zero-till wheat had benefits over conventional tillage (CT) in Haryana, eastern Uttar Pradesh (UP) and Bihar states of the IGP through higher yields (5–7%) and lower costs (due to tillage savings). The yield gains were attributed to earlier planting in no-till than tilled systems wherein tillage may cause a delay in wheat planting.
There are, however, reports of yield reductions with no-tillage (NT) wheat in Punjab and western UP (Bhattacharyya et al., Reference Bhattacharyya, Kundu, Pandey, Singh and Gupta2008; Chaudhary et al., Reference Chaudhary, Khera and Singh1991; Gajri et al., Reference Gajri, Arora and Prihar1992; Gangwar et al., Reference Gangwar, Singh, Sharma and Tomar2006; Sharma et al., Reference Sharma, Tripathi and Singh2005). Constraints to NT wheat can include poor stand establishment and rooting due to high soil strength in the upper soil layers, and high weed competition that may lead to low fertilizer use efficiency, in particular of mobile nutrients like nitrogen (N) (Rahman et al., Reference Rahman, Chikushi, Saifizzaman and Lauren2005). No-tillage in wheat can reduce infestation of Phalaris minor, but it may also enhance populations of broad-leaved weeds (Erenstein and Laxmi, Reference Erenstein and Laxmi2008). Though initial adoption of NT wheat in the IGP has been reported to be quite encouraging, there are signs of its slowing down. Based on a tillage monitoring survey, Erenstein (Reference Erenstein2009) observed that the area under NT wheat was about 5% in Punjab and 7–8% in Haryana in 2005/06 and showed a decline in the next two years. This survey also revealed that the area under reduced tillage (1–2 passes of a disc harrow prior to planting) was a multiple of the NT area and showed a small increase in both States. The reasons for discontinuation of NT included perceived need for occasional tillage, formation of hard pan, weed control and non-availability of NT machines (Laxmi et al., Reference Laxmi, Erenstein and Gupta2007).
The arguments in favour as well as against NT suggest that the tillage effects on crop yields need to be assessed in relation to management factors (Gajri et al., Reference Gajri, Arora and Prihar2002) like fertilizers and herbicides. It is likely that additional tillage compared to NT may help in reducing inputs of fertilizer N (Rao and Dao, Reference Rao and Dao1992) and herbicides (Buhler et al., Reference Buhler, Doll, Proost and Visocky1995). Thus, all variable factors need to be considered for a comprehensive assessment of different crop establishment systems. This study examines the combined effects of tillage intensity (CT v. NT) in relation to N rates and planting time on wheat following puddled rice with respect to soil physical properties, crop productivity and N use efficiency in an irrigated environment of northwest India.
MATERIALS AND METHODS
Site characteristics
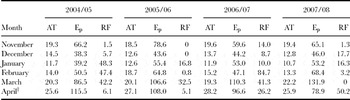
Field experiments were conducted for four seasons (2004/05 to 2007/08) at Punjab Agricultural University Research Farm, Ludhiana, India (30°54′N, 75°48′E, 247 m asl). The experimental soil was a deep alluvial sandy loam developed under a hyper-thermic regime containing 75% sand (2000–20 μm), 10% clay (< 2μm) and 0.41% organic carbon in the top 0.30 m layer. The soil is alkaline (pH 8.0) and non-saline (EC of 0.25 dS m−1). The soils at the university farm are reasonably representative of the region with 15–20% of Punjab farms having similar characteristics. The experimental field had been under rice-wheat cropping since 2000. The groundwater was more than 15 m deep. The weather data for the experimental period is given in Table 1.
Monthly mean of daily mean air temperature (AT, °C), and monthly cumulative pan evaporation (Ep, mm) and rainfall (RF, mm) in different cropping seasons.

†Up to 15 April.
Treatments
During the 2004/05 and 2005/06 seasons, combinations of tillage intensity and fertilizer N rates were evaluated in a split-plot design with tillage in the main plot and N in the sub-plot with four replications. The experiment was modified during the 2006/07 and 2007/08 seasons by including planting time as a variable. Planting time and tillage intensity combinations were kept in the main plot and N rate in the sub-plot. This modification was deemed necessary as earlier planting is an intrinsic advantage of NT systems in many real world applications. Each sub plot measured 14 m × 7.2 m. Tillage intensity included: NT-direct planting with no land preparation; and CT-soil disruption to 0.10 m depth by one pass of a disc harrow, two passes of a tine cultivator followed by one pass of a plank. Fertilizer N (urea) rates included 120 and 150 kg ha−1. The crop was planted on one date, viz. 11 and 8 November in 2004/05 and 2005/06, respectively, and on two dates viz. October 31 (D1) and November 10 and 7 (D2) during 2006/07 and 2007/08, respectively.
Crop management
After harvest of the preceding rice, the experimental field was pre-irrigated and tillage treatments were imposed as described above. Wheat (var. PBW 343) was planted at 100 kg ha−1 with a zero-till drill in NT and with a seed-cum-fertilizer drill in CT. The whole dose of 13 kg P ha−1 (single super phosphate), 25 kg K ha−1 (potassium chloride) and 5 kg Zn ha−1 (zinc sulphate) was drilled at planting. In both NT and CT, half of the fertilizer N was broadcast and then incorporated with pre-sowing irrigation, and the remaining N was applied with the first post-sown irrigation four weeks after planting. A known volume of irrigation water equivalent to 75 mm depth over the plot area was applied in NT and CT treatments. Subsequent irrigations were timed when the ratio of depth of irrigation water (75 mm) to cumulative pan evaporation minus rainfall since previous irrigation reached a value of 0.9. This is a deficit-irrigation approach that promotes the use of soil-stored water. The crop received two irrigations each during the 2004/05 and 2006/07 seasons and four irrigations each during the 2005/06 and 2007/08 seasons due to variability in rainfall amount and distribution (Table 1). Weeds were controlled by spraying sulfosulfuron (32.5 g ha−1 a.i.) for Phalaris minor, and 2–4 D (625 g ha−1) for broad-leaved weeds (Chenopodium spp., Rumex spp., Medicago denticulata) 35–40 days after sowing. The same amounts of the two herbicides were used in the two tillage treatments. The crop was harvested in mid-April.
Measurements
Soil penetration resistance was measured in 0.05 m depth increments to 0.30 m depth at planting time near field capacity wetness with a proving ring cone penetrometer (30° cone angle and 133 mm2 base area) at ten random sites in NT and CT plots during 2005/06. Soil water was monitored by the gravimetric method at 0.30 m depth increments in a 0–1.5 m profile at planting and harvesting time in NT and CT plots receiving 120 kg N ha−1 during 2005/06, and at D2 in 2006/07. Soil cores for determining root growth in NT and CT plots receiving 120 kg N ha−1 were taken at 0.15 m depth increments to the maximum soil depth at which roots were visible. Cores were taken with a 0.05 m diameter auger centred at 0.04 m away from the plant base. The soil cores were taken at the grain-fill stage during 2005/06 and D2 in 2006/07. Roots from each sample were washed over a 1-mm sieve, cleaned, dried at 70 °C and weighed. The root data were expressed as root mass density (root mass per unit soil volume, mg cm−3) in different layers of soil profile, and as root mass (root mass per unit soil area, computed as product of average root mass density in the profile with depth of rooting, mg cm−2). Above-ground biomass and grain yield were recorded at harvest from an area of 28 m2 in different seasons. Weed biomass was sampled at harvest from the same area in NT and CT plots receiving 120 kg N ha−1 during the 2005/06 season and dried at 65–70 °C. Grain and straw samples were analysed for N concentration by the Kjeldahl method (Keeney and Nelson, Reference Keeney, Nelson, Page, Miller and Keeney1982) during 2005/06. Treatment effects on grain yield were tested for significance using analysis of variance for a split-plot design. In order to evaluate year effects, the analysis was carried by pooling yield data in two sets. One set pertained to tillage and N effects in 2004/05 and 2005/06; the other set included tillage, planting time and N effects in 2006/07 and 2007/08. Tillage effects on penetration resistance, root mass density and soil water were analysed by least significant difference (Student-t) test for pair comparison (Steel and Torrie, Reference Steel and Torrie1980).
RESULTS AND DISCUSSION
Soil penetration resistance
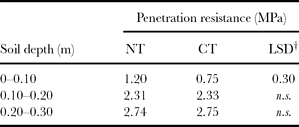
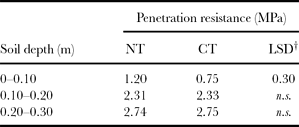
Tillage caused a significant reduction in soil penetration resistance in the tilled layer at planting-time (Table 2). During the 2005/06 season, mean penetration resistance in the top 0.10 m soil layer was 0.45 MPa lower in CT than in NT. This reduction in penetration resistance is attributed to soil loosening associated with tillage (Bennie and Botha, Reference Bennie and Botha1986). Below 0.10 m soil depth, penetration resistance was comparable in the two treatments. There were no differences in planting-time soil water content between NT and CT as the same amount of irrigation was applied in the two systems.
Tillage effects on soil penetration resistance at wheat planting-time during 2005/06 season.
†p = 0.05.
Root growth
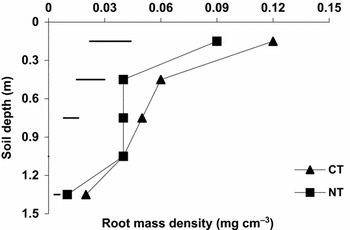
Rooting profiles of wheat at grain-fill stage during the 2005/06 cropping season are given in Figure 1. It shows that depth of rooting in NT and CT was comparable (1.5 m), but root mass density was significantly more in CT plots (LSD, p = 0.05). Root mass density was 25 and 50% more in the 0–0.30 m and 0.30–0.60 m soil layers in CT than in NT. These results suggest that greater soil strength in the surface layers (Table 2) can influence root development in deeper layers of the profile. Root mass at this stage was 8.4 and 6.6 mg cm−2 (equals 0.84 and 0.66 t ha−1) in the CT and NT. The effect of tillage on root growth was reduced in the 2006/07 cropping season. This season had higher rainfall and presumably the surface soil layers remained wetter for a longer period, and this factor reduced soil strength in the surface horizons and encouraged root development. The depth of rooting at grain-fill stage was 1.0 m in both tillage treatments, and root mass was 9.6 and 8.8 mg cm−2 in CT and NT, respectively. Lower penetration resistance in the planting zone due to soil loosening with tillage promotes deeper and denser rooting in the subsoil in field crops like wheat and maize (Bennie and Botha, Reference Bennie and Botha1986; Gajri et al., Reference Gajri, Arora and Prihar2002).
Rooting profiles of wheat at grain-fill as affected by tillage during the 2005/06 season. Horizontal bars at different depths indicate LSD values.

Water use
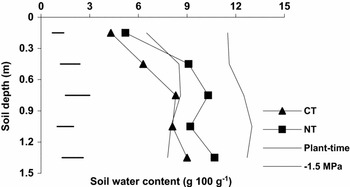
Greater proliferation of roots at depth can increase soil water acquisition. Soil water content at harvest-time of wheat during the 2005/06 season (Figure 2) show that there was 2–3% (g 100 g−1 soil) less water in the top 0.90 m profile in CT than in NT, which corresponded to differences in root mass density between NT and CT (Figure 1). Soil water profiles at planting had been comparable in NT and CT. It is also interesting to note that soil water in the surface horizon was depleted beyond water retention at −1.5 MPa in both systems. Profile water depletion beyond this threshold was to a greater depth in the CT (0.6 m) than in the NT (0.3 m). The magnitude of tillage effects on harvest-time soil water profile in high rainfall (158 mm) season of 2006/07 was less (1.5–2.0 g 100 g−1 soil) compared to low rainfall season of 2005/06. These results on profile water depletion corroborate earlier reports on rooting and water use in wheat (Bennie and Botha, Reference Bennie and Botha1986; Gajri and Prihar, Reference Gajri and Prihar1985).
Tillage effects on harvest-time soil water profiles in wheat during the 2005/06 season. The plant-time and 1.5 MPa lines correspond to soil water content at planting time for CT and NT plots and soil water content at 1.5 MPa soil water tension. Horizontal bars at different depths indicate LSD values.

Grain yield
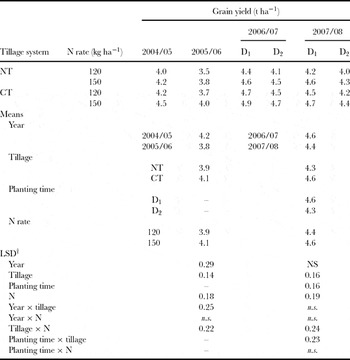
Wheat responses to tillage and fertilizer N at different planting times and cropping seasons are given in Table 3. The grain yield was lowest in 2005/06 and highest in 2006/07. The fluctuation in grain yield was likely due to differences in air temperature during February. The mean air temperature during February was 3.5 °C greater in 2005/06 than in 2006/07 (Table 1). Wheat planted 7–10 d earlier (D1) in 2006/07 and 2007/08 yielded 0.3 t ha−1 more grains than that planted later (D2). Yield reductions under D2 were likely a consequence of reduction in duration from heading to maturity by 5–7 d due to greater air-temperature during grain-fill. These results support earlier reports of planting time effects on wheat yields in the IGP (Ortiz-Monasterio et al., Reference Ortiz-Monasterio, Dhillon and Fischer1994).
Wheat yield response to tillage, fertilizer N and planting time in different cropping seasons.

†p = 0.05.
– indicates not applicable.
Across planting times and N treatments, mean yield in CT was 0.2–0.3 t ha−1 higher than in NT. These results support reports of yield advantage from tillage in wheat following puddled rice cultivation in coarse-textured soils when planting time was same in the two systems (Chaudhary et al., Reference Chaudhary, Khera and Singh1991; Gajri et al., Reference Gajri, Arora and Prihar1992). These benefits may occur for a number of reasons. In our experiments, denser rooting at depth in CT than in NT caused greater extraction of profile-stored water (Figure 2) and nutrients (Table 4). Yield benefits may also be due to differences in weed competition. Weed biomass at wheat harvest in 2005/06 in CT was 0.4 t ha−1 against 0.9 t ha−1 in NT despite herbicide use in both systems. Rahman et al. (Reference Rahman, Chikushi, Saifizzaman and Lauren2005) observed that higher weed infestation was one of the constraints in NT wheat following rice in Bangladesh.
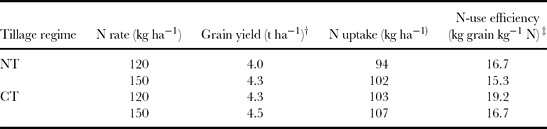
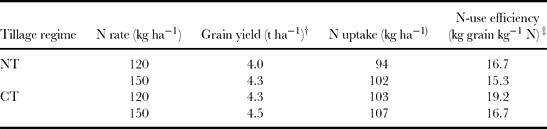
Effect of tillage and N regimes on N uptake and agronomic N-use efficiency of wheat.
†Grain yield data averaged over cropping seasons and planting time.
‡Computed using grain yield of 2.0 t ha−1 for no N (personal communication, data of long-term fertilizer experiment on rice-wheat system in Department of Soils, Punjab Agricultural University, Ludhiana).
An examination of tillage response in relation to N rate and planting time brings out their interaction effects. At a given N rate, grain yield in NT under D1 (earlier planting by 7–10 d) was comparable to that in CT under D2. For example, averaged over N rates, two years' mean yield of 4.5 t ha−1 was realized in NT under D1 as well as that in CT under D2. In a similar study, wherein NT wheat was planted 7 d earlier, grain yield in NT was 0.4 t ha−1 greater than 3.0 t ha−1 obtained in CT on a sandy loam soil (Verma et al., Reference Verma, Sinha and Srivastava1991). These results suggest that yield reductions in NT compared to CT can be eliminated by earlier planting of wheat in the NT. A large number of on-station and on-farm trials and farm surveys across the Indian IGP reported an increase in NT wheat yields in the range of 1–12% due to earlier planting. The wheat planting, otherwise, gets delayed by 7–10 d in Haryana and 8–25 d in Eastern UP owing to late harvest of rice crop and a long turn-around time (Erenstein and Laxmi, Reference Erenstein and Laxmi2008).
At a given planting date in the two tillage treatments, grain yield with 120 kg N ha−1 in CT was comparable to that with 150 kg N ha−1 in NT, suggesting that high N fertilizer rates can also be used to overcome yield penalties associated with NT. These results on tillage effects in relation to N rates endorse earlier reports (Gajri et al., Reference Gajri, Arora and Prihar1992; Gangwar et al., Reference Gangwar, Singh, Sharma and Tomar2006). Plant N concentration at harvest-time (1.6% in grains and 0.5% in straw) was not influenced by tillage and N. Since average yields were higher with CT, total N uptake was more in CT resulting in greater N-use efficiency than in NT (Table 4). Increased N-use efficiency and crop yields in CT could be linked to greater mining of fertilizer N due to deeper and denser rooting of wheat (Gajri et al., Reference Gajri, Arora and Prihar1992) and more N availability due to less weed competition (Rahman et al., Reference Rahman, Chikushi, Saifizzaman and Lauren2005).
An insight into the net economics of NT and CT has management implications. Comparable wheat yields in NT under D1 and CT under D2 in this study indicates that NT caused cost savings in tillage (Rs 2000 ha−1 at 2007/08 prices, personal communication from Department of Economics and Sociology, Punjab Agricultural University, Ludhiana, India). Under the same planting time in the two tillage systems, yield reductions associated with NT could be overcome by additional 30 kg fertilizer N ha−1. No-tillage was still cost-effective (saving of Rs 1685 ha−1 after accounting for cost of additional N at Rs 10.50 kg−1at 2007/08 prices) for realizing yields comparable to those in CT. However, higher fertilizer N use in NT may cause groundwater pollution in the long run.
CONCLUSIONS
This study has shown that under earlier planting (D1) in NT on coarse-textured soils in irrigated environments of the IGP, grain yield of wheat was comparable to that under the later planting date (D2) in CT. These findings have implications that cost saving in tillage of earlier-planted wheat in NT on coarse-textured soils would benefit rice-wheat farmers. However, under no advancement of the date of wheat planting in NT, grain yield was less by 0.2–0.3 t ha−1 than that in CT. This yield reduction in NT could be overcome by adding 30 kg ha−1 more fertilizer N suggesting that tillage enhanced N use efficiency. These tillage gains are ascribed to greater extraction of profile stored and applied water and nutrients because of denser crop rooting caused by reduction in soil strength and less weed competition. Higher N use efficiency in CT suggests that farmers could achieve fertilizer N savings with this system. The net economics of the two tillage systems showed that NT was more cost-effective than CT even after accounting for cost of additional fertilizer N to overcome associated yield penalties.