I. INTRODUCTION
Due to environmental concerns, the replacement of petroleum-based plastics by biodegradable and non-hazardous materials has been promoted. Among them is poly(lactic acid) (PLA), a biodegradable aliphatic polyester that is produced by the polymerization of lactic acid. Lactic acid itself is commercially obtained from the fermentation of carbohydrate sources, such as rice, sugar beet, sugarcane, wheat and sweet potato, Reference Avérous, Belgacem and Gandini1–Reference Datta and Henry3 including nonfood waste parts of these crops. Since PLA is naturally degraded to the nontoxic carbon dioxide and water within a few weeks under a typical compost condition, PLA is a great choice for the production of short-term packaging that would typically end up in landfill sites.
Although PLA is transparent with a high flexural and tensile modulus, and so is able to compete with polystyrene, Reference Dorgan, Lehermeier and Mang4 its application is limited by its inherent brittleness, low impact strength and low elongation at break due to its high glass transition temperature (T g = 55 °C) with low entanglement density and chain stiffness. Reference Hassouna, Raquez, Addiego, Dubois, Toniazzo and Ruch5,Reference Ho, Wang, Lin and Lee6 It has previously been suggested that the brittleness of PLA could be improved by co-polymerization of PLA with polyisoprene Reference Schmidt and Hillmyer7 or blending PLA with other polymers such as ethylene-co-acetate copolymer, Reference Ma, Hristova-Bogaerds, Goossens, Spoelstra, Zhang and Lemstra8 poly(hydroxyl butyrate) (PHB) plasticized by acetyl(tributyl citrate) (ATBC) Reference Arrieta, López, López, Kenny and Peponi9 or tributyrin (TBL) Reference D’Amico, Iglesias Montes, Manfredi and Cyras10 and block copolymers of ethylene glycol and propylene glycol. Reference Pluta and Piorkowska11 Moreover, it has been reported that the blending of PLA with natural rubber (NR) could produce the rubber-modified PLA with higher toughness and impact resistance properties and this method still maintained the bio-based characteristic product. The NR particles dispersed in the PLA phase in the PLA/NR blends are expected to act as a stress energy absorber for the rigid phase of PLA. Reference Bitinis, Verdejo, Cassagnau and Lopez-Manchado2 Nevertheless, the differences in their polarity and molecular weight of NR and PLA lead the immiscibility of the polymeric constituents in the blends resulting in phase separation and poor mechanical properties in the finished product. Reference Juntuek, Ruksakulpiwat, Chumsamrong and Ruksakulpiwat12 The compatibility of NR and PLA in the blends can be improved by two methods. One is to modify NR via epoxidation and then directly blend with PLA. Reference Tham, Poh, Ishak and Chow13,Reference Wang, Chen, Xu and Chen14 The epoxide group in the epoxidized NR (ENR) provided the higher polarity than NR and it could be used as the compatibilizer or interfacial modifier for the production of rubber–rubber blends or thermoplastic elastomers.
Another method is to use the third component or compatibilizer to enhance the miscibility of PLA and NR phases in the blends. The compatibilizers, which have been used in the PLA/NR blends, were derived from PLA–NR diblock Reference Chumeka, Pasetto, Pilard and Tanrattanakul15 or PLA–NR–PLA triblock copolymerization. Reference Chumeka, Pasetto, Pilard and Tanrattanakul16 Moreover, the graft copolymerization of some polymers such as glycidyl methacrylate onto the NR structure could be used as the compatibilizer to improve the impact strength and elongation at break of the PLA/NR blends. Reference Juntuek, Ruksakulpiwat, Chumsamrong and Ruksakulpiwat12 Since graft copolymers consisting of chemically identical segments of some polymeric constituents in the blends, they provide the higher phase compatibility resulting in the improved mechanical properties of the obtained finished product. For example, the graft copolymer synthesized by grafting PLA onto maleated thermoplastic polyolefin elastomer (TPO) via esterification could be used as compatibilizer to reduce the interfacial tension between polymeric constituent phases in the PLA/TPO blends. Reference Ho, Wang, Lin and Lee6 To apply this method, the preparation of PLA grafted onto the NR backbone (NR-graft-PLA, NR–PLA) via esterification of maleated NR with PLA has been reported. Reference Sookprasert and Hinchiranan17 However, the reaction mechanism for NR–PLA preparation and the effect of the addition of NR–PLA on the mechanical and thermal properties including morphology study of the PLA/NR blends has not been evaluated. Thus, the aim of this research was to study the role of NR–PLA as a compatibilizer for PLA/NR blends [80/20 (w/w)] in the aspect of their mechanical and thermal properties including surface morphology. The obtained results were also compared with those compatibilized by using maleated NR. Moreover, the hydrolytic degradation of the PLA/NR blends containing various NR–PLA contents was elucidated.
II. EXPERIMENTAL
A. Materials
Solid NR (STR-5L) was obtained from PAN Innovation Industry Co., Ltd. (Bangkok, Thailand). PLA (4043D) was produced by NatureWorks® LLC (Minnetonka, Minnesota) under the trade name of Ingeo™. Maleic anhydride (MAH) and 4-dimethylaminopyridine (DMAP), used as a catalyst in the esterification step, were obtained from Sigma-Aldrich (Singapore). Benzoyl peroxide (BPO), used as an initiator for grafting MAH onto NR, was purchased from Merck Schuchardt (Darmstadt, Germany). Toluene, acetone, methanol, benzyl alcohol, potassium hydroxide (KOH), and sodium hydroxide (NaOH) were obtained from Quality Reagent Chemical Co., Ltd. (New Zealand). Phenolphthalein used as an indicator for titration to evaluate the level of grafted MAH was received from Riedel-de Haën (Seelze, Germany). Nitogen gas (N2) with 99.995% purity was purchased from Praxair Co., Ltd. (Bangkok, Thailand).
B. Preparation and structural characterization of the NR–PLA graft copolymer
The procedure to prepare the NR–PLA graft copolymer was described in the previous study. Reference Sookprasert and Hinchiranan17 Briefly, NR dissolved in toluene (0.9 M) was functionalized by MAH [15 parts per hundred of rubber (phr)] and initiated by 0.3 phr BPO at 80 °C for 2 h under inert atmosphere. Then, the maleated NR (NR-MAH) was precipitated in acetone and dried at 40 °C to a constant weight. The amount of carboxylic group obtained from hydrolysis of NR-MAH was defined as the level of grafted MAH, which could be determined by titration with 0.025 N KOH in 1/9 (v/v) methanol/benzyl alcohol mixture using 1% (v/v) phenolphthalein in methanol as the indicator. Reference Sookprasert and Hinchiranan17,Reference Nakason, Kaseman and Supasanthitikul18 At this condition, the produced NR-MAH contained 2.66% (w/w) grafted MAH.
For the esterification step, the NR-MAH solution obtained from the previous section before precipitation was mixed with PLA pellets (1.0–5.0 (w/w) PLA/NR-MAH). Then, 5 mL DMAP dissolved in toluene (0–0.8 M) was applied into the reaction mixture to catalyze the esterification of NR-MAH with PLA to form NR–PLA. The reaction was performed in a stainless steel vessel under inert atmosphere and vigorous stirring at the desired reaction temperature (120–160 °C) and time (8–24 h). To terminate the reaction, the obtained NR–PLA solution was casted in an aluminum tray and placed in a hood to evaporate toluene. The level of grafted PLA in the NR–PLA structure was evaluated from the mass loss following soxhlet extraction with 0.38 M NaOH in methanol for 24 h to remove unreacted PLA portion and then dried at 40 °C in a vacuum oven for 24 h. The % grafted PLA in NR–PLA was calculated by the following Eq. (1):
 $$\% \;{\rm{Grafted\ PLA}} = {{{w_{{\rm{after}}}}} \over {{w_{{\rm{before}}}}}} \times 100\quad ,$$
where w before and w after are the weights of NR–PLA before and after soxhlet extraction, respectively.
The chemical structure of NR before and after modification by grafting with MAH and esterification with PLA was evaluated by using 1H NMR spectroscopy (Varian Inova 500 MHz Spectrometer, Varian Medical Systems, Haan, Germany) at 25 °C. The 10 mg samples were dissolved in 5 mL deuterated chloroform (CDCl3, Sigma-Aldrich, Singapore) for overnight before analysis.
C. Preparation of PLA/NR blends
PLA pellets were dried in an oven at 100 °C for 24 h before use and then kept in a desiccator at room temperature. The NR was first masticated using an internal mixer (HAAKE Polydrive, Karlsruhe, Germany) with a rotor speed of 80 rpm at 120 °C for 3 min. Then, PLA was blended with the masticated NR at a 80/20 (w/w) PLA/NR ratio with the addition of the NR-MAH or NR–PLA compatibilizer at various contents [1–5% (w/w) based on the amount of PLA/NR blends] in the internal mixer at 190 °C with a rotor speed of 80 rpm for 8 min. The obtained polymer blends were milled using a ZERMA granulator (ZERMA Machinery & Recycling Technology, Shanghai, China) to small pieces of 5 × 5 × 5 mm3 and kept in a desiccator at room temperature. The small pieces were melted and sheeted (approximately 3 mm thickness) using an electrical compression mold (Wabash MPI, Wabash, Indiana) at 120 atm and 190 °C for 20 min. The obtained sheet was then cooled down under the same pressure for 15 min.
D. Mechanical properties testing
The tensile strength and elongation at break of the blends were evaluated using a Universal Testing Machine (Shimadzu DSS-10T, Shimadzu Corp., Tokyo, Japan) according to ASTM D638 type I at room temperature. The crosshead speed was controlled at 10 mm/min and a 50 mm gauge length was used. The sample sheets obtained from the previous section were laser-cut to a dumbbell shape. All tests were performed at least five times and the mean value with standard deviation (SD) was reported.
The notched Izod impact strength was also investigated using an Impact tester (CEAST® Resil Impactor, CCSi, Akron, Ohio) according to ASTM D256. The specimens were hit by a 1 J impact hammer at a constant speed of 3.46 m/s at room temperature. The dimensions of the standard specimens were 63.5 × 12.7 × 3.2 mm3. The average value with SD obtained from five specimens was presented.
The hardness of the samples (approximately 6 mm thickness) was measured using Durometer hardness tester REX 2000 Shore B (Rex Gauge, Buffalo Grove, Illinois) according to ASTM D2240 at room temperature. The measurements were taken from five different points distributed over the samples and the mean value with SD of five measurements was recorded.
E. Thermal properties testing
The decomposition temperatures of PLA, NR, modified NRs, and 80/20 (w/w) PLA/NR blends with and without the addition of the respective compatibilizer at 1–5% (w/w) were determined using thermogravimetric analysis (TGA; Perkin-Elmer Pyris Diamond TG/DTA, Perkin-Elmer, Rodgau, Germany). The sample (10 mg) was placed into a platinum pan and heated from 40 to 1000 °C with a heating rate of 10 °C/min under inert atmosphere at a flow rate of 50 mL/min. The initial decomposition temperature (T id) was obtained from the intersection of two tangents at the initial stage of decomposition of the thermogravimetric (TG) curve. Moreover, the temperature at the maximum weight loss rate (T p) of the differential thermogravimetry (DTG) plot of samples was also observed.
The T g, melting temperature (T m), cold crystallization temperature (T cc), and degree of crystallinity (χc) of PLA pellet, NR and modified NRs were determined using differential scanning calorimetry (DSC 204-F1 Phoenix®, Netzsch Group, Selb, Germany). All samples (approximately 10 mg) were sealed in a 40 µL aluminum pan and scanned from −100 to 300 °C with a heating rate of 10 °C/min under a N2 atmosphere at a flow rate of 50 mL/min. T g was evaluated from the midpoint of the transition region. T cc and T m were the temperatures at the optima of the peaks related to those thermal events. For the molded samples, the DSC data of a PLA plate and PLA/NR blends [80/20 (w/w)] with and without the addition of the modified NRs were obtained from the first heating scan since the original crystalline state of the PLA related to the mechanical properties of the samples. Reference Feng, Hu, Yin, Zhao and Jiang19 The level of χc of each sample was calculated following Eq. (2):
 $${\chi _{\rm{c}}}(\% ) = {{\Delta {H_{\rm{m}}}} \over {\Delta {H_{\rm{f}}} \times {w_{{\rm{PLA}}}}}} \times 100\quad ,$$
where ΔH m is the enthalpy of melting; ΔH f is the enthalpy of fusion associated with 100% crystalline PLA (approximately 93.6 J/g), and w PLA is the net weight fraction of the PLA. Reference Tham, Poh, Ishak and Chow13
F. Morphology of PLA/NR blends
To evaluate the relationship between mechanical properties and morphology of the blends, the morphology of fractural surfaces obtained after impact testing of PLA and PLA/NR blends [80/20 (w/w)] with and without the addition of the modified NRs was examined by scanning electron microscopy (SEM) on a JEOL model JSM-6480LV (JEOL Ltd., Tokyo, Japan) operated at 10 kV. The fractural surface of each sample was coated with gold. The size of the rubber phase dispersed in the blends was observed from the cross sectional area of specimens. The size of rubber droplet dispersing throughout the PLA matrix was determined by SemAfore passive image digitizer software. Weight-average rubber droplet size diameter (d m) and rubber droplet size distribution (σ) were then calculated by using Eqs. (3) and (4), respectively Reference Bai, Bai, Xiu, Liu, Zhang, Wang, Deng, Chen, Fu and Chiu20 :
 $${d_{\rm{w}}} = {{\sum\limits_{i = 1}^N {{n_i}d_i^2} } \over {\sum\limits_{i = 1}^N {{n_i}{d_i}} }}\quad ,$$
 $$\ln \sigma = \sqrt {{{\sum\limits_{i = 1}^N {{n_i}{{\left( {\ln {d_{\rm{i}}} - \ln {d_{\rm{w}}}} \right)}^2}} } \over {\sum\limits_{i = 1}^N {{n_i}} }}} \quad ,$$
where n i is the number of the rubber droplets with the diameter of d i and σ is the polydispersity, respectively.
G. Molau test
The Molau test was used to comparatively evaluate the interfacial interaction or compatibility of polymeric constituents in the PLA/NR blends with and without the addition of graft NR products. Reference Ho, Wang, Lin and Lee6,Reference Yang, Cao, Ma, An, Ke, Liu and Wang21 The Molau test was performed by dissolving 0.5 g blend samples in 10 mL chloroform or methanol under ultrasonication for 4 h and further shaking for 10 min. The mixture solutions were left to stand for 48 h at room temperature before observation.
H. Hydrolytic degradation testing of PLA/NR blends
The specimens were prepared in a square shape with a dimension of 10 × 5 × 1 mm3 by using the electrical compression mold at 190 °C for 20 min. Each sample was immersed in a vial containing 2.5 mL distilled water and all vials were placed in the water bath at a constant temperature of 58 °C for 6 weeks. Three specimens were picked out every week, washed with distilled water and dried in an oven at 40 °C until the weight was constant. The weight loss was calculated from Eq. (5) Reference Huang, Zhang, Pan, Zhou, Jiang and Dan22 :
 $${\rm{Weight\ loss\ }}(\% ) = \left( {{{{w_{\rm{b}}} - {w_{\rm{a}}}} \over {{w_{\rm{b}}}}}} \right) \times 100\quad ,$$
where w b and w a were the weights of specimens before and after degradation, respectively. The hydrolytic degradation rate of each sample could be calculated from the slope of % weight loss versus time interval.
III. RESULTS AND DISCUSSION
A. Structural characterization of the modified NR and proposed reaction mechanism
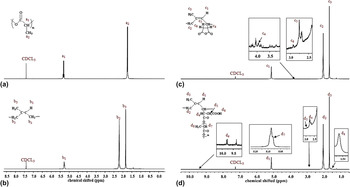
The chemical structures of the NR, NR-MAH, and NR–PLA were comparatively investigated using 1H NMR spectroscopy as shown in Fig. 1. The characteristic peaks of PLA [Fig. 1(a)] were evident at 1.56 (a 2) and 5.11 (a 1) ppm attributed to the methyl and methine protons in PLA, respectively. Reference Choi, Choi, Han, Park and Ha23 For NR [Fig. 1(b)], the peaks at 5.12 (b 1), 2.09 (b 2), and 1.68 (b 3) ppm were assigned as the olefinic proton, methylene protons (–CH2–), and the methyl protons (–CH3), respectively. Reference Kookarinrat and Paoprasert24 After grafting with MAH to produce NR-MAH, Fig. 1(c) indicated new signals at 3.85 (c 4) ppm generated from the methine proton of the succinic anhydride ring and 2.76 (c 5) and 2.92 (c 6) ppm attributed to the two methylene protons in grafted MAH. Reference Wongthong, Nakason, Pan, Rempel and Kiatkamjornwong25 When NR-MAH was grafted with PLA via esterification, Fig. 1(d) showed new peaks at approximately 9.81 (d 6) ppm assigned as the proton of the carboxylic acid obtained from the ring opening of the anhydride ring. Reference Wongthong, Nakason, Pan, Rempel and Kiatkamjornwong25 Moreover, the methyl protons of internal lactyl and methine protons of terminal lactyl at 1.55 (d 8) and 5.11 (d 7) ppm, respectively of the grafted PLA on the NR-MAH were observed. Reference Hua, Chen, Liu, Yang and Yang26
1H NMR spectra of (a) PLA, (b) NR, (c) NR-MAH [2.66% (w/w) grafted MAH content] and (d) NR–PLA [36.7% (w/w) grafted PLA content].

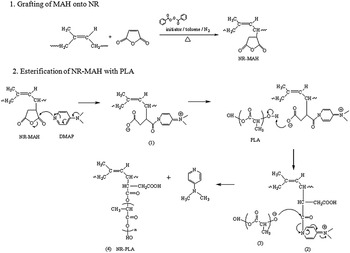
From the structural characterization, the reaction mechanism for the synthesis of NR–PLA via grafting NR with MAH and then esterification could be proposed as shown in Fig. 2. NR was grafted with MAH to produce NR-MAH. Then, in the presence of toluene, the DMAP used as the catalyst for esterification was reacted with NR-MAH at the succinic anhydride groups to promote anhydride-ring opening, yielding species (1) presented in Fig. 2. The electron of the acetate groups from species (1) attacked the terminal hydroxyl group of PLA resulting in the removal of a proton from the PLA and yielding species (2). The PLA with a lone pair electron [species (3)] then reacted with species (2) to form a bond with the tertiary carbon near the DMAP and deprotonated the DMAP to release NR–PLA [species (4)] and DMAP again for using as the catalyst of the system. Reference Xu, Held, Kempf, Mayr, Steglich and Zipse27
Proposed reaction mechanism for NR–PLA synthesis.

B. Effect of the reaction parameters on the NR–PLA synthesis
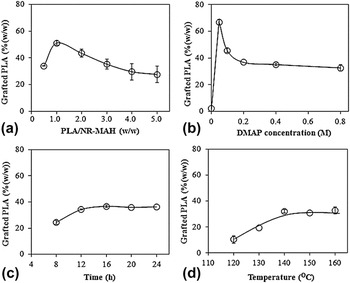
To prepare the NR–PLA, the NR-MAH containing 2.66% (w/w) grafted MAH was esterified with PLA catalyzed by DMAP to obtain NR–PLA. The effects of the DMAP concentration, PLA/NR-MAH (w/w) ratio, reaction time and reaction temperature on the grafted PLA content in the NR–PLA were individually investigated sequentially starting from the central condition of 0.2 M DMAP, 2/1 (w/w) PLA/NR-MAH at 140 °C for 16 h. The obtained results were summarized as shown in Fig. 3.
Effect of reaction parameters on the level of grafted PLA in NR–PLA: (a) PLA/NR-MAH (w/w) ratio, (b) DMAP concentration, (c) reaction time and (d) reaction temperature [central condition: 2.0 (w/w) PLA/NR-MAH and 0.2 M DMAP at 140 °C for 16 h].

With respect to the effect of the PLA/NR-MAH (w/w) ratio, the increase in the amount of PLA in the PLA/NR-MAH mixture from 0.5 to 1.0 (w/w) increased the level of grafted PLA in the NR–PLA 1.5-fold from 34.0 to 51.1% (w/w) [Fig. 3(a)], presumably because the higher PLA loading provided a higher possibility to react with the MAH groups in the NR-MAH. However, the increase in the amount of PLA from 2.0 to 5.0 (w/w) PLA/NR-MAH decreased the level of grafted PLA from 43.4 to 27.6% (w/w) PLA/NR-MAH. This was due to the limitation of the grafting sites obtained from the ring opening of anhydride group in the NR-MAH structure via esterification. Accordingly, the PLA/NR-MAH ratio at 1.0 (w/w) was selected as optimal.
To consider effect of the DMAP concentration on the degree of grafted PLA, the esterification did not occur without the addition of 0.05 M DMAP [Fig. 3(b)]. However, higher DMAP concentration than 0.05 M reduced the amount of grafted PLA in the NR–PLA from 66.8% (w/w) to 32.6% (w/w) at 0.8 M DMAP. A high loading of DMAP likely promoted the depolymerization of PLA at a high reaction temperature possibly resulting in the reduction of the grafted PLA content in the NR–PLA. Reference Ho, Wang, Lin and Lee6 Thus, 0.05 M DMAP concentration was appropriate to be selected for studying the further experiments.
The effect of the reaction time on the level of grafted PLA in the NR–PLA structure was shown in Fig. 3(c). The increase in the reaction time from 8 to 12 h significantly increased the level of grafted PLA in the resulting NR–PLA from 24.5 to 34.2% (w/w), but it then remained essentially the same as the reaction time increased further up to 24 h. This might reflect the steric hindrance effect obtained from the PLA grafted onto the NR-MAH at the earlier stage. This result suggested that the reaction time of 16 h was optimum for grafting process. This phenomenon was also observed for the system of graft copolymerization of methyl methacrylate (MMA) onto hydrogenated NR backbone. Reference Kookarinrat and Paoprasert24
Finally, the increase in the reaction temperature from 120 to 140 °C increased the level of grafted PLA in the NR–PLA from 8.30 to 36.7% (w/w) [Fig. 3(d)], but it then tended to remain constant at reaction temperatures above 140 °C. This was due to the limited amount of functional MAH groups on the NR-MAH structure.
C. Mechanical properties and morphology of the PLA/NR blends with and without the addition of modified NRs
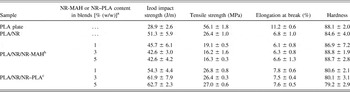
The effect of modified NRs, NR-MAH [2.66% (w/w) grafted MAH content] and NR–PLA [36.7% (w/w) grafted PLA content], used as compatibilizers on the mechanical properties of the 80/20 (w/w) PLA/NR blends was comparatively summarized as presented in Table I.
Effect of NR-MAH and NR–PLA contents on the mechanical properties of the PLA/NR blends [80/20 (w/w)].

a wt% based on the content of PLA/NR blend.
b Grafted MAH content = 2.66% (w/w).
c Grafted PLA content = 36.7% (w/w).
For the impact strength property, the neat PLA had the izod impact strength only 28.9 J/m. This was improved 1.8-fold to 51.3 J/m when PLA was blended with NR at a ratio of 80/20 (w/w) PLA/NR. Thus, NR could be used as an impact energy absorber for PLA, which was a rigid material. The addition of modified NRs such as NR-MAH and NR–PLA was expected to enhance the impact strength of PLA/NR blends. However, it was observed that the addition of NR-MAH at 1–5% (w/w) to the PLA/NR blend [80/20 (w/w)] failed to improve the impact strength, but rather reduced it 1.1- to 1.2-fold. In contrast, the addition of NR–PLA at 1–5% (w/w) significantly increased the Izod impact strength of the PLA/NR blends to 54.3–62.7 J/m. This could be explained as that the NR–PLA had both PLA and NR phases that could be distributed into both phases better than NR-MAH. Moreover, it was possible that the grafting MAH onto NR induced graft product having high gel content and Mooney viscosity. Reference Nakason, Saiwaree, Tatun and Kaesaman28 This led poor distribution in the PLA/NR blends resulting in the poor mechanical properties of the finishing product.
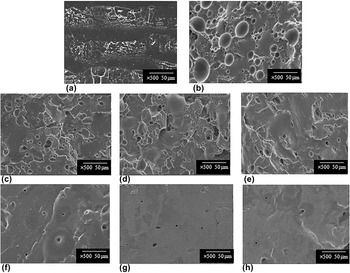
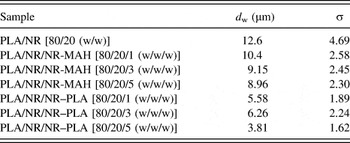
To confirm the explanation for the impact strength testing, the effect of the modified NRs on the compatibility between PLA and NR phases in the blends was also observed by SEM to analyze the impact-fractured surface as exhibited in Figs. 4 and 5. For the low magnification as ×500, the PLA plate [Fig. 4(a)] showed a smooth and sharp fracture with stress-whitening zones, indicating high strength and hardness behavior of this brittle material. Reference Liu, He, Zeng, Xu and Wang29 When PLA was blended with NR at 80/20 (w/w) ratio of PLA/NR without the addition of compatibilizer, phase separation between the dark gray matrix of the PLA phase and the black spherical NR droplets was evident [Fig. 4(b)]. The average size of the NR droplets (d w) dispersed in the PLA matrix as summarized in Table II was 12.6 μm with a diameter distribution parameter (σ) of 4.69. It also showed the numerous cavities throughout the fractural surface. These cavities generated from the rubber particles dispersed in the blends could possibly act as the impact energy absorber, Reference Arayapranee, Prasassarakich and Rempel30 which provided the higher impact strength than the PLA plate.
SEM images (500× magnification) of the fractural surfaces obtained from the impact strength testing: (a) PLA plate, (b) 80/20 (w/w) PLA/NR, (c) 80/20/1 (w/w/w) PLA/NR/NR-MAH, (d) 80/20/3 (w/w/w) PLA/NR/NR-MAH, (e) 80/20/5 (w/w/w) PLA/NR/NR-MAH, (f) 80/20/1 (w/w/w) PLA/NR/NR–PLA, (g) 80/20/3 (w/w/w) PLA/NR/NR–PLA and (h) 80/20/5 (w/w/w) PLA/NR/NR–PLA [graft MAH content in NR-MAH = 2.66% (w/w) and graft PLA content in NR–PLA = 36.7% (w/w)].

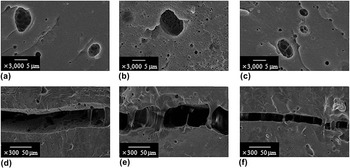
SEM images (3000× magnification) of the cavities and cracks appeared on the fractural surfaces obtained from the impact strength testing: (a) cavities of 80/20/1 (w/w/w) PLA/NR/NR–PLA, (b) cavities of 80/20/3 (w/w/w) PLA/NR/NR–PLA, (c) cavities of 80/20/5 (w/w/w) PLA/NR/NR–PLA, (d) crack of 80/20/1 (w/w/w) PLA/NR/NR–PLA, (e) crack of 80/20/3 (w/w/w) PLA/NR/NR–PLA and (f) crack of 80/20/5 (w/w/w) PLA/NR/NR–PLA [graft PLA content in NR–PLA = 36.7% (w/w)].

Effect of the addition of NR-MAH and NR–PLA on the weight-average diameter (d w) and diameter distribution parameters (σ) of NR droplets dispersed throughout PLA phase in the PLA/NR blends [80/20 (w/w)].

NR-MAH contained 2.66% (w/w) grafted MAH content and NR–PLA contained 36.7% grafted PLA content
For the addition of the modified NRs into the PLA/NR blends, the results in Table II showed that the addition of NR-MAH [1–5% (w/w)] into the PLA/NR blends [Figs. 4(c)–4(e)] showed the reduction of d w and σ of cavities to 8.96–10.4 μm and 2.30–2.58, respectively. However, the reduction of the cavity size could not enhance the mechanical properties of the blends as described above. These results were opposite to the addition of NR–PLA into the PLA/NR blends with the similar contents. Figures 4(f)–4(h) exhibited the more homogeneity of the PLA and NR constituents in the blends. The d w and σ of the cavities presented in the PLA/NR/NR–PLA composites were decreased to the range of 3.81–6.26 μm and 1.62–2.24, respectively. Moreover, the network inside the cavities with several microfibrils between the crack traces was observed as shown in Figs. 5(a)–5(c) and 5(d)–5(f), respectively. This was believed that these fibrils and network could improve the interfacial adhesion between PLA and NR phases resulting in the higher impact strength of the blends. Reference D’Amico, Iglesias Montes, Manfredi and Cyras10,Reference Wang, Chen, Xu and Chen14
For the tensile properties aspect (Table I), the PLA plate had a high tensile strength and low elongation at break of 56.1 MPa and 11.2%, respectively reflecting the rigid material. Although the blending of PLA with soft material such as NR was expected to enhance the tensile properties of the blend, the results shown in Table I indicated that the tensile strength and elongation at break of PLA/NR blend at 80/20 (w/w) decreased approximately 53% and 39%, respectively from those of the PLA plate. This was possibly due to the phase separation resulted from the dissimilarity in the polarity of the NR and PLA phases. For the blends containing modified NRs, the addition of NR-MAH at 1–5% (w/w) in the PLA/NR blends did not improve the tensile properties of the PLA/NR blend. The results in Table I showed that the increase in the amount of NR-MAH to 5% (w/w) in the PLA/NR blends decreased the tensile strength of PLA/NR blends as approximately 39% with remaining the elongation at break. To compare with NR–PLA at the similar blend compositions, it was observed that the PLA/NR blend containing NR–PLA had similar tensile strength with uncompatibilized PLA/NR blends. This was possible that the cavities in the blends attested by SEM analysis decreased the tensile properties of both PLA/NR and PLA/NR/NR–PLA composites. This behavior was also observed in the acrylonitrile–butadiene–styrene (ABS) copolymer blended with polystyrene-g-natural rubber Reference Pisuttisap, Hinchiranan, Rempel and Prasassarakich31 and ABS produced from polybutadiene (PB) latex with larger particle size (325 nm). Reference Xu and Xu32 However, the tensile properties of PLA/NR/NR–PLA blends were higher than those compatibilized by NR-MAH. This implied that NR–PLA was more compatible to both PLA and NR phases than NR-MAH.
For the hardness testing, Table I showed that the hardness of the PLA/NR blend (84.6) was lower than that of the PLA plate (88.1). However, the addition of NR-MAH in the range of 1–5% (w/w) into PLA/NR blends promoted the higher hardness value to approximately 87–89. Nakason et al. Reference Nakason, Kaseman and Supasanthitikul18 has reported that the T g of NR was elevated after grafting with MAH indicating the restriction of chain mobility and flexibility of the maleated NR. In the case of PLA/NR compatibilized by using NR–PLA [36.7% (w/w) grafted PLA content], the addition of 1–5% (w/w) NR–PLA into the PLA/NR blend decreased the hardness of the PLA/NR blend from 84.6 to 79.2–80.6. This implied that the NR–PLA could partially compatibilize the brittle PLA segment and soft NR phase and so induced a lower hardness in the PLA/NR blends.
D. Thermal properties of the NR-MAH, NR–PLA, and PLA/NR blends
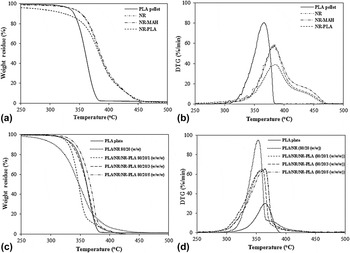
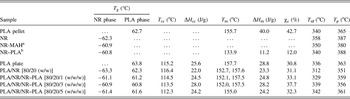
The thermal properties, in terms of the T g, T cc, T m, ΔH m enthalpy of crystallization (ΔH cc), T id, and T p of the PLA and NR before and after functionalization with MAH and esterification with PLA were investigated as shown in Fig. 6(a), Figs. 7(a)–7(b), and Table III. Since the impact property of PLA/NR blends containing NR–PLA was improved, the thermal properties of PLA/NR/NR–PLA blends at various amounts of NR–PLA [36.7% (w/w) grafted PLA content] were comparatively summarized as shown in Figs. 6(b), 7(c), 7(d), and Table III.
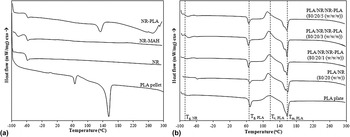
DSC thermograms of (a) PLA, NR, NR-MAH and NR–PLA and (b) PLA plate and PLA/NR blends [80/20 (w/w)] with and without the addition of NR–PLA compatibilizers [graft MAH content in NR-MAH = 2.66% (w/w) and graft PLA content in NR–PLA = 36.7% (w/w)].

TGA thermograms: (a) TG and (b) DTG curves of PLA pellet, NR, NR-MAH and NR–PLA and (c) TG and (d) DTG curves of PLA plate and PLA/NR blends [80/20 (w/w)] with and without the addition of NR–PLA compatibilizer [graft MAH content in NR-MAH = 2.66% (w/w) and graft PLA content in NR–PLA = 36.7% (w/w)].

Thermal properties of PLA pellet, NR, modified NRs, PLA plate and PLA/NR blends (80/20 (w/w)) with and without the addition of NR–PLA.

a Grafted MAH content = 2.66% (w/w).
b Grafted PLA content = 36.7% (w/w).
To consider the thermal properties of raw materials, the T g and T m of the PLA pellet were 62.7 and 155.7 °C, respectively, compared to T g of NR of −62.3 °C with no discernible T m [Fig. 6(a)]. Moreover, the cold crystallization behavior could not be observed for PLA pellet, but the strong peak of melting endotherm was appeared indicating the perfect crystalline and high crystallinity (χc = 42.7%). Reference Huang, Zhang, Pan, Zhou, Jiang and Dan22 When NR was grafted with MAH to produce NR-MAH [2.66% (w/w) grafted MAH content], the T g of NR was slightly elevated to −60.9 °C, which reflected the lower chain mobility and flexibility due to the steric hindrance caused by the bulky grafted MAH on the NR backbone. Reference Nakason, Kaseman and Supasanthitikul18 For NR–PLA [36.7% (w/w) grafted PLA content], the esterification of NR-MAH with PLA did not significantly affect the T g of NR-MAH (T g of NR–PLA = −60.8 °C), but the T m of NR–PLA (133.9 °C) was appeared due to the effect of PLA. It was also observed that the melting enthalpy of PLA decreased from 40.0 J/g to 11.2 J/g after grafting with NR indicating the reduction of intrinsic crystalline phase resulting in the decreasing χc value from 42.7% for the neat PLA to 12.0% for NR–PLA graft copolymer. Reference Choi, Choi, Han, Park and Ha23
Analysis of the decomposition temperature of PLA pellet and modified NRs [Fig. 7(a), 7(b), and Table III] showed that T id and T p of PLA pellet were 340 and 365 °C, respectively, which were only slightly lower than those of NR (T id = 358 °C, T p = 387 °C) and so implied that NR had slightly higher thermal stability than PLA. When NR was grafted with MAH to produce NR-MAH [2.66% (w/w) grafted MAH content], the T id and T p slightly decreased to 350 °C and 380 °C, respectively possibly due to the effect of MAH that could induce the chain scission. Reference Yanfeng, Yuanliang, Xufeng, Chunhua and Sujun33 For NR–PLA [36.7% (w/w) grafted PLA content], its T id was lower than that of NR and similar to that of pure PLA pellet, while the T p of the NR–PLA was similar to that of NR. This result could confirm the success of graft copolymerization of PLA onto NR backbone.
For the molded samples, the PLA plate showed the cold crystallization exothermic peak (T cc) at 115.2 °C due to the cooling step during preparation of PLA plate in the compression mold [Fig. 6(b)]. The T g and T m of the PLA plate (63.8 and 157.7 °C) were slightly higher than those of the PLA pellet indicating the higher rigidity with more difficulty to be melted. Moreover, the crystallinity of the PLA plate was decreased from the PLA pellet at 42.7–30.8%. Reference Jaratrotkamjorn, Khaokong and Tanrattanakul34 For the uncompatibilized PLA/NR blend, Fig. 6(b) and Table III indicated that the addition of NR did not significantly affect the T g values of both NR (−63.3 °C) and PLA (62.3 °C) phases. The T cc of the PLA/NR blends and crystallinity of the PLA phase in the PLA/NR blend was slightly increased from 115.2 °C to 116.4 °C and 30.8–31.1%, respectively. These results reflected the immiscible characteristics of the polymeric constituents in the blends and the addition of NR did not affect the crystallization behavior of PLA phase in the blends. To consider the melting peak [Fig. 6(b)], the uncompatibilized PLA/NR blends exhibited the bimodal melting peaks at 152.7 °C and 157.6 °C. This possibly involved with the different crystalline arrangement induced by NR in the blends.
In the case of the addition of 1–5% (w/w) NR–PLA [36.7% (w/w) grafted PLA content[ into the PLA/NR blends, the results in Fig. 6(b) and Table III exhibited the slightly higher T g values of NR phase in the blends from −63.3 °C to approximately −61 °C. Meanwhile, the T g of the PLA phase in the blends shifted from 63.8 °C to slightly lower temperature approximately 61–62 °C. This indicated that the addition of NR–PLA could promote the partial miscibility of the NR phase in the rigid PLA segment, resulting in an enhanced PLA-polymer chain mobility. Reference Pongtanayut, Thongpin and Santawitee35,Reference Dechatiwong Na Ayutthaya and Poompradub36 To consider the cold crystallization of the blends, it was noticed that the increase in the NR–PLA up to 5 wt% into the PLA/NR blends induced the lower T cc of the PLA phase in the blends from 116.4 °C to 112.3 °C. This implied that the crystallization kinetics of PLA in the blends was depended on the amount of applied NR–PLA. Reference Pongtanayut, Thongpin and Santawitee35 Moreover, the significant reduction of T cc of PLA phase in the PLA/NR/NR–PLA blends indicated the improvement of compatibility in the blends. Reference Choi, Choi, Han, Park and Ha23 This was presumed that the added rubber possibly acted as the nucleating agent at the interface or the relatively short chains of PLA obtained during melt blending had ability to induce the faster crystallization at lower T cc of PLA in the blends. Reference Bitinis, Verdejo, Cassagnau and Lopez-Manchado2,Reference Tham, Poh, Ishak and Chow13,Reference Jaratrotkamjorn, Khaokong and Tanrattanakul34,Reference Pongtanayut, Thongpin and Santawitee35 For the melting temperature, the DSC thermograms showed that the increasing NR–PLA content gradually shifted the bimodal melting endothermic phenomenon of the blends as a single melting peak at 155 °C when the amount of NR–PLA in the blends was increased to 5 wt%. This was also the evidence for the miscibility enhancement of the constituent phases in the blends. Reference Dechatiwong Na Ayutthaya and Poompradub36 Moreover, the increase in the melting enthalpy of the blends from 23.3 J/g to 28.2 J/g with increasing the NR–PLA content from 0 wt% to 3 wt% promoted the higher degree of crystallinity from 31.1% to 37.7% indicating the improved compatibility between PLA and NR phases in the blends. This observation was similar to the system of the PLA/epoxidized NR blends. Reference Pongtanayut, Thongpin and Santawitee35 However, the crystallinity of the blend was decreased to 32.3% when 5 wt% NR–PLA was applied.
With respect to the thermal decomposition of the PLA/NR blends with and without the addition of modified NRs as shown in Figs. 7(c), 7(d) and Table III, the T id (312 °C) and T p (351 °C) of the uncompatibilized PLA/NR blend were markedly lower than those of pure NR and PLA plate (T id = 336 °C and T p = 363 °C) due to the severe condition for sheeting at 190 °C. Moreover, its thermal decomposition rate was highest (92.1%/min) indicating the poor thermal resistance property. The addition of 1–5% (w/w) NR–PLA into the PLA/NR blends increased the decomposition temperature to 329–342 °C and 356–361 °C for T id and T p, respectively with the thermal degradation rate of 60–63%/min [Fig. 7(d)]. This exhibited that the NR–PLA could also enhance the thermal stability of the 80/20 (w/w) PLA/NR blend due to the improved homogeneity between the NR and PLA phases.
E. Molau test of PLA/NR blends
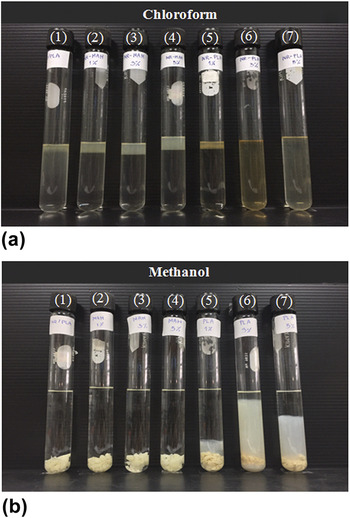
To confirm the results obtained from the mechanical and thermal properties testing, the improved compatibility of polymeric constituents in the blends was also investigated via Molau test as shown in Fig. 8. In this test, chloroform and methanol were selected as the solvents since chloroform could well dissolve both PLA and NR; whilst, methanol was a good solvent for PLA, but it was a poor solvent for NR.
Molau test of PLA/NR blends with and without the addition of the modified NRs in the presence of (a) chloroform and (b) methanol [(1) 80/20 (w/w) PLA/NR, (2) 80/20/1 (w/w/w) PLA/NR/NR-MAH, (3) 80/20/3 (w/w/w) PLA/NR/NR-MAH, (4) 80/20/5 (w/w/w) PLA/NR/NR-MAH, (5) 80/20/1 (w/w/w) PLA/NR/NR–PLA, (6) 80/20/3 (w/w/w) PLA/NR/NR–PLA and (7) 80/20/5 (w/w/w) PLA/NR/NR–PLA] [graft MAH content in NR-MAH = 2.66% (w/w) and graft PLA content in NR–PLA = 36.7% (w/w)].

In the case of chloroform, Figs. 8(a-1) exhibited the obvious phase separation. The upper layer was the part of NR solution and the lower layer was the translucent solution of PLA. This indicated the incompatibility of PLA and NR due to their polarity difference. When the NR-MAH at various contents [1–5% (w/w)] based on the amount of PLA/NR content [80/20 (w/w)] was added into the PLA/NR blends [Figs. 8(a-2)–8(a-4)], the phase separation was still observed. This implied that only modification by grafting MAH could not improve the compatibility between PLA and NR phases resulting in poor tensile and impact properties of the blends. However, it was noticed that the addition of 3–5% (w/w) NR–PLA effectively improved the phase compatibility of PLA and NR portions in the blends. The solution of PLA/NR/NR–PLA at 80/20/3 and 80/20/5 (w/w/w) exhibited the homogeneous turbidity as shown in Figs. 8(a-6)–8(a-7).
For the use of methanol as the solvent, Figs. 8(b-1)–8(b-4) showed the phase separation for uncompatibilized PLA/NR and PLA/NR/NR-MAH blends. However, the milky solution was found for the PLA/NR/NR–PLA blends. The amount of the milky phase was depended on the NR–PLA content in the blends [Figs. 8(b-5)–8(b-7)]. The PLA/NR blends containing 3–5 wt% NR–PLA showed the high content of milky solution implying the higher compatibility or miscibility of the blends. Thus, the results from Molau test in the presence of chloroform or methanol was another evidence to show that the NR–PLA could be used as the emulsifying agent or compatibilizer for PLA and NR phase in the PLA/NR blends. Reference Ho, Wang, Lin and Lee6,Reference Yang, Cao, Ma, An, Ke, Liu and Wang21
F. Hydrolytic degradation of PLA/NR blends
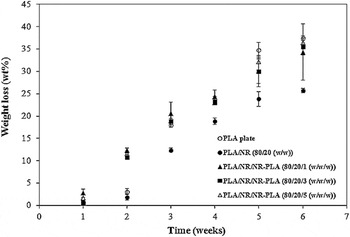
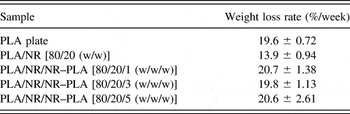
The study of hydrolytic degradation of PLA and PLA/NR/NR–PLA blends with and without the addition of NR–PLA [36.7% (w/w) grafted PLA content] was comparatively investigated as shown in Fig. 9 and Table IV. The hydrolysis experiment was conducted in the distilled water with constant temperature at 58 °C. Due to the good water permeability of the amorphous region in PLA, Reference Huang, Zhang, Pan, Zhou, Jiang and Dan22 the hydrolytic degradation rate of the PLA plate was 19.6%/week with the maximum mass loss as 37.5% when it was immersed in water for 6 weeks. For the uncompatibilized PLA/NR blends [80/20 (w/w)], the hydrolytic degradation rate of the PLA/NR blend decreased to 13.9%/week and the mass loss of the blends at 6 weeks of exposure time was only 25.7%. This indicated that the addition of NR delayed the hydrolytic degradation of the blend because of the hydrophobicity of NR portion. Reference Huang, Zhang, Pan, Zhou, Jiang and Dan22 For the PLA/NR compatibilized by various contents of NR–PLA [36.7% (w/w) grafted PLA content], it was noticed that the addition of NR–PLA in the range of 1–5 wt% into the PLA/NR blends showed the hydrolytic degradation rate of PLA/NR/NE–PLA blends as approximately 20–21%/week with the maximum mass loss as 34–36 wt% at 6 weeks of immersion period. These results were similar to those of PLA. This indicated that the addition of NR–PLA could promote the improved compatibility between PLA and NR phase and water could be easily diffused into the amorphous PLA matrix in the blends.
Hydrolytic degradation of PLA plate, NR–PLA and PLA/NR blends with and without the addition of NR–PLA compatibilizer [graft PLA content in NR–PLA = 36.7% (w/w)].

Hydrolysis degradation rate of PLA and PLA/NR blends.

IV. CONCLUSIONS
Graft copolymerization of PLA onto a NR backbone was successfully prepared via esterification of NR-MAH [2.66% (w/w) grafted MAH content] with PLA catalyzed by DMAP. A maximum grafted PLA content of 66.8% was obtained when NR-MAH was reacted with PLA at a 2.0 (w/w) PLA/NR-MAH ratio and catalyzed by 0.05 M DMAP at 140 °C for 16 h. The addition of 5% (w/w) NR–PLA (36.7% (w/w) grafted PLA content) into the PLA/NR blend [80/20 (w/w)] increased the Izod impact strength to 62.7 J/m, which was 2.17- and 1.22-fold higher than the neat PLA and PLA/NR, respectively. With respect to the compatibility between PLA and NR phases in the PLA/NR blend with NR–PLA, SEM analysis indicated that the incorporation of NR–PLA reduced the size of the NR phase dispersed in the PLA/NR blend resulting in a better NR dispersion in the PLA phase. Moreover, the addition of 1–3% (w/w) NR–PLA into the PLA/NR blend slightly increased the T g of the NR phase with a slight reduction of T g for the PLA segment. This reflected that the NR–PLA promoted a partial compatibility between the NR and PLA constituents in the blends. The results from Molau test were also the evidence for the improved compatibility in the PLA/NR/NR–PLA blends. Moreover, it was observed that the PLA/NR/NR–PLA blends exhibited the higher resistance to the thermal decomposition of the uncompatibilized one. The results from the test of hydrolytic degradation revealed that the improved compatibility of PLA/NR/NR–PLA blends could maintain the hydrolytic degradation rate same as that of the neat PLA.
ACKNOWLEDGMENTS
The authors gratefully acknowledge the funding support from the Thailand Research Fund (TRF) (RDG5650118/IRG5780001) and Special Task Force for Activating Research (STAR), Ratchadaphiseksomphot Endowment Fund, Chulalongkorn University. The authors also thank Robert Douglas John Butcher (Publication Counseling Unit, Faculty of Science, Chulalongkorn University) for English language editing and our staffs, Ms. Siriya Angnanon, Ms. Tatiya Kittiwattanakul, Ms. Godchaporn Bunmee and Mr. Ratchanon Piemjaiswang for their assistance throughout this research.