Introduction
Political parties are essential for American democracy. They provide structure to legislative politics and prevent chaos from stalling legislation (Aldrich Reference Aldrich1995; Rohde Reference Rohde1991). They simplify the choices voters face, make informed electoral decisions possible (Lupia and McCubbins Reference Lupia and McCubbins1998), and solve collective action problems (Downs Reference Downs1957). There is the growing concern, however, that the political parties in the American system of government may hamper the ability of government to act, especially when the control of government is divided between two highly polarized parties (Fiorina Reference Fiorina1996; Mann and Ornstein Reference Mann and Ornstein2013; McCarty et al. Reference McCarty, Poole and Rosenthal2006). Silbey (Reference Silbey, Galderisi, Herzberg and McNamara1996: 23) notes that “divided government stands out in the record for its persistent quality, its importance in . . . political affairs, and its acceptance as a fact of political life.” How much do the divisions between the parties and the prospect of divided partisan control of government contribute to the ability of government to pass legislation?
Over the past two decades, a central debate in the study of American politics is whether unified party control is, in fact, more productive than divided government. Mark Peterson's Legislating Together (1990) provides one of the first such investigations. He finds that party control of government, without controlling for other factors, does have a substantial effect on the number of laws passed from Truman through Reagan. The signal work in this vein of research, though, is David Mayhew's Divided We Govern (Reference Mayhew1991). In that book, Mayhew develops a classification of significant acts of Congress throughout the postwar era and concludes, somewhat surprisingly, that periods of unified party control of government do not correspond to higher levels of significant legislative accomplishment (Mayhew Reference Mayhew1991). Subsequent research has built on and critiqued Mayhew's classification of significant legislation and reexamined this question using alternative measures and methodologies (Clinton and Lapinski Reference Clinton and Lapinski2006; Grant and Kelly Reference Grant and Kelly2008; Howell et al. Reference Howell, Adler, Cameron and Riemann2000; Kelly Reference Kelly1993; Lapinski Reference Lapinski2013).Footnote 1 This intriguing approach faces its own complications if the data are not standardized and different databases are on different metrics and scales. Some authors have tried to redefine the problem, arguing that significant legislation is not the right measure of what Congress accomplishes, different issue areas have different dynamics (Lapinski Reference Lapinski2013), legislation is a response to problems, and significance can only be measured against a baseline of what problems face the country (Binder Reference Binder1999), or that divided control is about blocking not passing legislation and so failure rates are a better measure (Edwards et al. Reference Edwards III, Barrett and Peake1997). All these refinements present important observations about the nature and meaning of legislation. Ultimately, though, the literature dissipates into ambiguity, with some authors finding substantial effects of divided control and others no difference between unified and divided control.
The challenge presented by Mayhew's simple observation remains. It appears that divided control is just as productive as unified control, measured as total bills passed or as significant bills passed (regardless of domain). We think the problem is not measurement but time. We argue that Mayhew's approach is perfectly valid, but the slice of time is too short and the data too sparse to answer the questions posed. Peterson and Mayhew both focus on the five decades from 1946 to 1991. This era has 22 different Congresses, 9 of which are unified and 13 of which are divided. The limited time frame makes inference difficult, especially since the mid-1960s appear to be unusually productive and perhaps historically unusual. Nearly all other research in this literature focuses on the same era. Clinton and Lapinski (Reference Clinton and Lapinski2006) is an exception. Clinton and Lapinski (Reference Clinton and Lapinski2006) studies the period from 1877 to 1994 using an item response model to assess legislative accomplishment based on a range of other rankings.Footnote 2 The contribution of our article is to examine whether Mayhew's conclusions—based on data post-1946—are universal throughout US history, using his method to define significant legislation. To this end, we follow the methodology developed by Mayhew, and construct a new data set of significant legislation for the entire history of the US Congress. We have constructed the database independently from Mayhew's efforts, but we have endeavored to apply the same principles and methodology. As an additional check and for purposes of validation, we compare our data set to other databases of significant legislation.
To our knowledge, Stathis (Reference Stathis2014) represents the only other comprehensive direct attempt to develop a list of significant legislation for the entire history of Congress. Stathis has compiled a catalog of significant legislation, organized by Congress and indexed by topic. We use Stathis's data as a complement to the database we assembled and as a robustness check.
Looking at the entire span of US history, we address two somewhat different questions. First, does divided government have a significant effect on the ability of the national government to pass legislation? This debate has taken on an even larger cast in the discussion among theorists of American governmental institutions over whether parties can capture government (Aldrich Reference Aldrich1995; Cox and McCubbins Reference Cox and McCubbins1993, Reference Cox and McCubbins2005; Rohde Reference Rohde1991) or whether the median voter (or, perhaps, the filibuster pivot) remains the key player in the legislative domain (Brady and Volden Reference Brady and Volden1998; Krehbiel Reference Krehbiel1998). Second, do parties and party control of government offer a substantial explanation of what Congress does and when it does it? Do party-based explanations account for the historical variation in legislative productivity?
While this article focuses on answering the first of these questions, our newly assembled data also allows for insights into the second question. We estimate the effect of unified and divided control of government on the passage of legislation and of significant legislation throughout the history of the US Congress—and we assess the stability of this effect in different historical periods.Footnote 3
We find that under divided control of government Congress passes fewer pieces of significant legislation enacted into law—one fewer law per Congress in the nineteenth century and four fewer laws per Congress in the twentieth century. These differences are statistically distinguishable from zero, indicating that unified party control does contribute to legislative accomplishment. However, the incidence of unified and divided control of government throughout the long history of the United States cannot explain the overall historical trends in the passage of historical legislation. Divided party control of government is more prevalent in the second half of the twentieth century than throughout the nineteenth century, but much more significant legislation is passed under divided control of government in the twentieth century than was passed under unified control of government in the nineteenth century.
We think the long time horizon allows us to see the effects of divided government more clearly. Our approach represents a departure from other studies that have, for example, tweaked the definitions or measurement techniques for “significant” legislation. Howell et al. (Reference Howell, Adler, Cameron and Riemann2000) divides significant legislation into four different classes: landmark enactments (which correspond to a subset of Mayhew's significant legislation—acts judged significant by contemporaneous sources), major enactments, ordinary enactments, and minor enactments. Based on these criteria and some technical adjustments to the estimation procedure, the authors find that divided government is associated with a 30 percent reduction in landmark legislation. Similarly, Kelly (Reference Kelly1993) argues that the distinction between contemporaneously and retrospectively judged legislation is crucial. Revising the list of significant legislation restores the expected negative effect of divided government.
Another threat to the validity of Mayhew's assertion—and to much of the follow-up work—is that other important explanatory variables have been omitted. Coleman (Reference Coleman1999) accounts for several institutional features thought to mediate the influence of unified/divided control such as which party is in control, whether a supermajority exists in the Senate, factionalism within parties, and public mood. Across several different measures of legislative productivity, Coleman finds that, on balance, unified government does play a role when accounting for important institutional features.Footnote 4 Other work in the same vein has examined the role of ideological coalitions cutting across parties (Frymer Reference Frymer1994) and ideological cohesion (Taylor Reference Taylor1998).
Divided government could also influence the character of legislation while not altering the total output of important legislation. Members of Congress might not enact as much “partisan” legislation, essentially deviating from their ideal points to facilitate coalition building so that the legislation will pass (Thorson Reference Thorson1998). Put another way, the legislation passed might shift to less “conflictual” policy areas (Bowling and Ferguson Reference Bowling and Ferguson2001). In addition, a trend toward more omnibus legislation might render simple counts of significant legislation incomparable across eras (Taylor Reference Taylor1998).
The difficulty of determining what is significant legislation may also obscure assessments of how partisan control influences what gets done. Divided government appears to result in increases in congressional investigations (Kriner and Schwartz Reference Kriner and Schwartz2008; Parker and Dull Reference Parker and Dull2009), more protectionist trade policies (Epstein and O'Halloran Reference Epstein and O'Halloran1996; Lohmann and O'Halloran Reference Lohmann and O'Halloran1994), and an uptick in placing on the agenda controversial issues that might harm an opposing party president (Rose Reference Rose2001). According to these studies, even if we cannot observe a large effect of divided government on significant legislation, other aspects related to legislative productivity may be hurt by partisan divisions.
There is also not necessarily a consensus about the implications of reduced legislative productivity, if it does in fact result from divided partisan control. It could be that the electorate prefers divided government, and rationally splits votes between candidates of competing parties to ensure maintenance of the status quo (Fiorina Reference Fiorina1996). In this telling, citizens are less concerned with seeking out positive reforms and rather prefer to limit government action. Or perhaps voters evaluate presidential candidates differently than members of Congress, and are willing to vote for a presidential candidate they disagree with on some issues because they know that opposing members of Congress will constrain his or her actions (Jacobson Reference Jacobson1990).
Our contribution with this article is to introduce a new, independent data set on all significant legislation to better assess the various claims made in the partisan control literature. The database presented here covers all Congresses, which allows for better estimation of the effects of party control on legislative productivity, both because there are more data points from 1790 to 2010 than from 1947 to 2010 and because the effect may not be constant across historical eras. The broad sweep of history reveals that Mayhew's assessment is ultimately right in questioning whether party control can explain what Congress does because long-term trends in party control are at odds with long-term trends in the number and significance of congressional enactments. Critics of Mayhew's original conclusion that unified party control has statistically insignificant effects on significant legislation may be right on that narrow question, but upon reconsideration of the evidence a larger problem for the party-control theory emerges. Unified and divided party control cannot explain the broad patterns of legislation in American history, especially the gross differences between the nineteenth century and the twentieth century, or even between the first half of the twentieth century and the decades since World War II.
Data
Evaluating the effects of party control for the full history of Congress presented a number of challenges. To guide our efforts, we assembled our data set using a simple definition of significant legislation based on meeting one of two criteria. First, is the bill important in historical context? When we look back on the legislation from our current perspective, did this bill accomplish something important, such as establish a major governmental agency, introduce a major policy change, declare war, or pass a constitutional amendment? Second, was the bill viewed as an important legislative accomplishment in its own time? This type of bill is harder to identify, and requires histories or the Congressional Record to determine its importance. For example, some slavery-related bills that preceded the Civil War did not have long-lasting significance due to the abolition of slavery, but they were major legislative accomplishments addressing the critical issue of their time. In making these assessments, we relied on historical treatments of the Congress and politics of the period, such as the Antebellum period, the New Deal, and so forth. For our data collection sources, see appendix B.Footnote 5
Our final database includes 1,040 significant bills that Congress enacted into law.Footnote 6 We also use counts of total public and private bills passed in each Congress. For the Congresses between 1789 and 1976 we used appendix F of Galloway and Wise (Reference Galloway and Wise1976), and for the remaining years we used counts from the Library of Congress (2015a).
While our data set was collected in a similar manner to Mayhew (Reference Mayhew1991), our data set does not contain the exact same significant legislation for the overlapping period. There are some bills in our data that Mayhew did not include, and others that Mayhew included that we did not code as significant. For example, Mayhew's data set excluded the Twenty-Third Amendment, which was passed by the 87th Congress and granted Washington, D.C., votes in the electoral college.
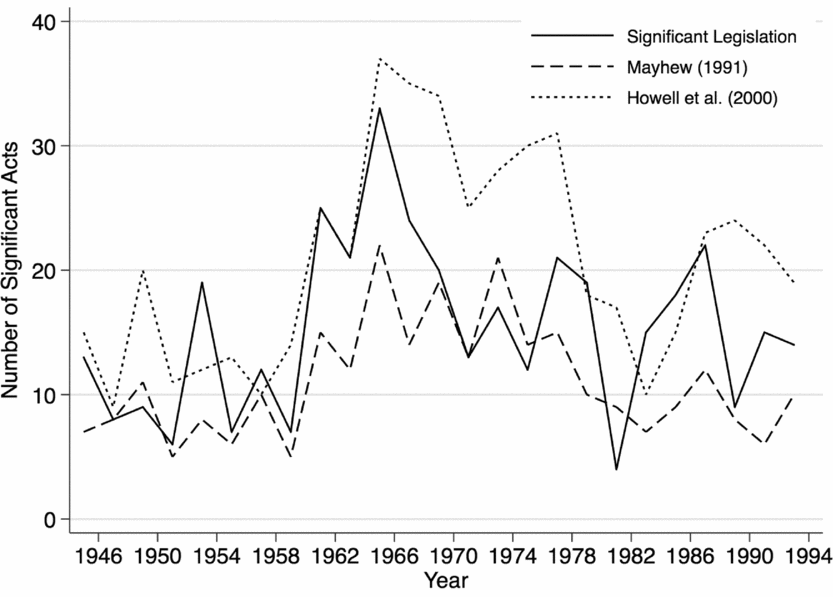
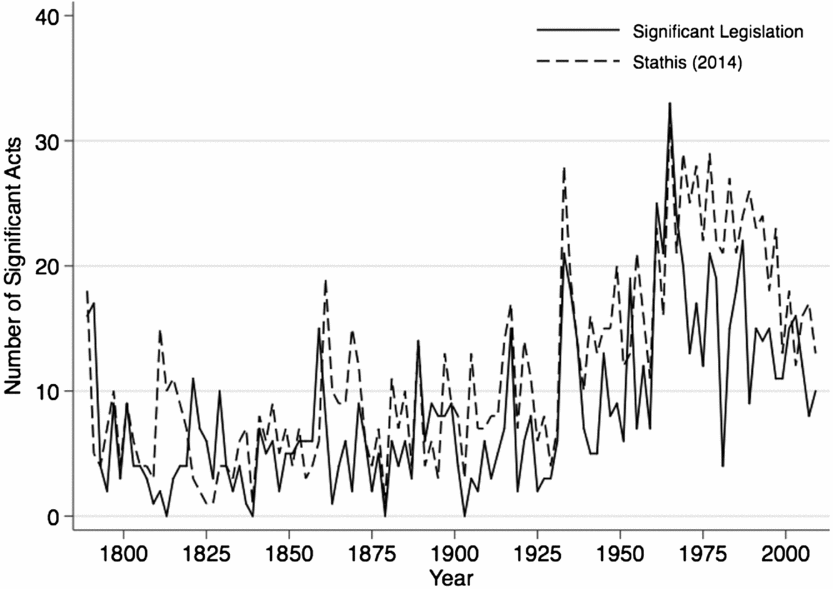
Figure 1a plots the number of significant bills by Congress in our data set and the data sets utilized in Mayhew (Reference Mayhew1991) and Howell et al. (Reference Howell, Adler, Cameron and Riemann2000) from the 79th Congress to the 104th Congress. The figure shows that our data roughly corresponds to these other data sets. The Howell et al. data was created by supplementing the Mayhew data with additional legislation. Therefore, the Howell et al. counts of significant legislation are always higher than the Mayhew counts. For a majority of the Congresses, our data falls in between these two data sets. As an additional validation test for our data collection before 1945, figure 1b compares our data to counts of significant legislation from Stathis (Reference Stathis2014).Footnote 7
Comparison of significant legislation to previous studies: This figure displays our measure of significant legislation in comparison to Mayhew (Reference Mayhew1991) and Howell et al. (Reference Howell, Adler, Cameron and Riemann2000). Our measure correlates with Mayhew at 0.6855 and with Howell et al. at 0.6287.

Comparison of significant legislation to previous studies: This figure displays our measure of significant legislation in comparison to Stathis (Reference Stathis2014). Looking back across all past Congresses, our measure of significant legislation correlates with Stathis at 0.6825.

Trends in Legislative Action
When the members of the 1st Congress convened in 1789, there were no national laws governing the budget, economy, citizenship, federal crimes, or many other domains that today we take as given. The Constitution had left large portions of the federal government undefined, especially the president's cabinet and the organization of the judiciary. Against that background, it was, perhaps, unavoidable that the 1st Congress would enact some of the most significant legislation in the nation's history. Without federal legislation to enable the functioning of the judiciary and executive, the new constitution would likely have failed. The 1st Congress and the 2nd Congress, which continued the essential work of implementing the Constitution, were clearly exceptional. We are concerned with more mundane times. Over the two centuries since the founding, what explains when Congress does and does not act?
The central claim of David Mayhew's Divided We Govern and the subsequent literature is that the partisan organization of Congress and the presidency explains a substantial portion of the variation in when Congress acts and when it does not. This article tests that claim using the time series of legislation and significant legislation from the founding to the present. In this section, we describe the time trends in total legislation and significant legislation over the entire history of the US Congress.
Before describing the ebbs and flows of legislative activity, a detour is needed concerning the changing nature of legislation. Nearly all work on Congress and legislation treats bills as the same over time. A bill in 1790 is the same as a bill in 2010. Reading through the historical record of the US Congress it is clear that the nature of legislation has evolved substantially since the 1st Congress.
The first bill introduced into the new Congress in 1789 was an act to levy fees on the tonnage of ships, introduced by Mr. Adams of Massachusetts. The resolution simply lists various types of vessels on which tonnage fees were to be charged, but actual fees are left as blanks to be filled in later. The bill has no number and no title, no reference to existing code, no definition of terms, no reference to the implementing or enforcing government agency, no time frame, no means of implementation, and no reference to other, potentially conflicting legislation—none of the trappings of a modern bill. For the first several Congresses that was standard. Bills and statutes had yet to be rationalized.
The early Congresses also often proceeded in an ad hoc manner. There was no budget act and there were no appropriation acts; there was no budget process. Appropriations were made piecemeal, in response to individual requests for funds. The minutes of the early Congresses are littered with requests to fund construction of lighthouses or post roads in specific locations or the removal of snags from various rivers or to compensate individuals who were surveying western lands. These various activities, taken together, are important; they represent the Congress at work building a nation, one project at a time. Viewed through the lense of “significant legislation,” these various activities do not rise to the level of Congress taking singular and sweeping actions that set policy by creating long-lived or transformative statutes.
Legislation has changed considerably from the early republic to the modern era. Over the past two centuries, Congress has systematically rationalized the legislative process. Bills now follow a formula and have a legalistic and bureaucratic aspect. Congress has developed a language and code that defines the legal apparatus to define and constrain the executive branch. In the 1820s, Congress developed omnibus bills as a way of combining many specific requests. After its first half century, in 1849, the US House decided to create a permanent standing committee on rules to manage how legislation is brought to the floor. And, during the Civil War, the modern approach to budgeting emerged, separating appropriation from taxation and developing subcommittees to deal with specific areas of the government.
Perhaps the clearest example of the rationalization of legislation is the treatment of private bills. Throughout the nineteenth century, Congress used private legislation to pay for military pensions, benefits for military widows, compensation for property, and a variety of other particular transactions (Skocpol Reference Skocpol1993, Reference Skocpol1995). Private acts are distinct from public acts. Public acts take the form of statutes, judicial and executive appointments, approval of treaties, and other actions that have the standing of public laws. The number of such transactions grew exponentially over the decades following the Civil War, and Congress eventually decided to create a pension law to get the thousands of requests for relief off the legislature's agenda. Private legislation continued into the twenty-first century, but it became extraordinarily rare. The end of the era of private legislation marked the end of one style of legislating and the emergence of the form of legislation to which we are accustomed today; it is the transition from specialized and specific actions to general policy.
The growing rationalization of legislation likely affected the productivity of Congress. Each time that Congress moves to rationalize a legislative arena, such as appropriations or pensions or the creation of committee systems, it frees up time for the entire legislature to address other matters. Hence, it may be the case that the growing rationalization of the legislative process creates the capacity—but not the need—to develop more legislation in the future.
This article gauges the amount of legislation Congress produces and its significance. Also evolving and changing is the content of legislation. We do not track that change here, but there are notable shifts that occur with the changing nature of the nation. Throughout the nineteenth century, Congress is centrally concerned with the territory and expansion of the United States, including the admission of states and the management of territories. And, throughout the nineteenth century, the United States’ relationship with Native American tribes is a major activity of the Congress, including treaties, wars, and mass relocations of people. As the country changed so too did the content of legislation. We assume that those changes in content do not drive the changes in the format and significance of individual pieces of legislation.
The changing nature of legislation is not reflected in our measures of total and significant acts. It is worth flagging how the changed nature of legislation might affect the picture of various trends. A law that creates a comprehensive approach to such private legislation becomes a significant act, but the many private bills leading up to it are not. The many ad hoc appropriation bills in the first half of the nineteenth century do not rise to the level of significance, but the budget acts that rationalize the process do.
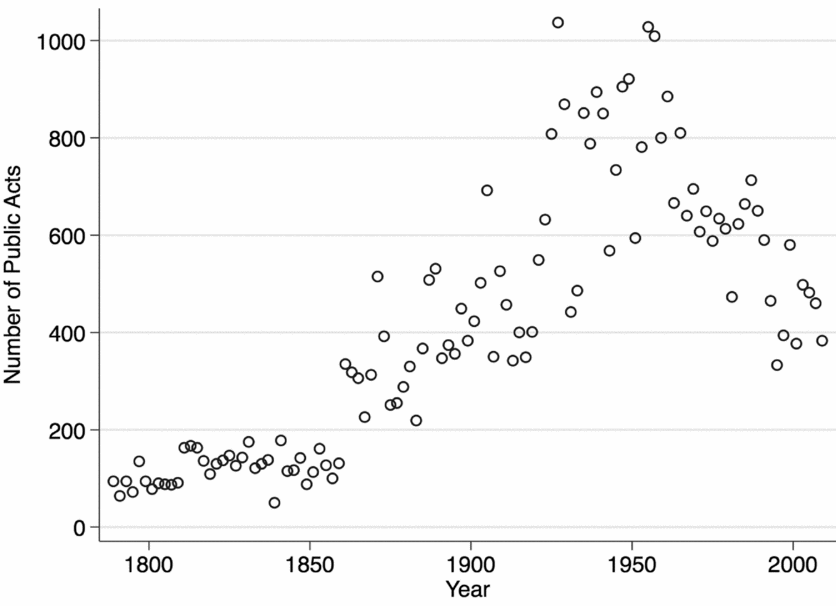
Figure 2a presents the number of public acts passed by each Congress from 1789 to 2010. This is simply the total number of acts passed and does not depend on classifications of significance. The patterns in figure 2a help us put prior work on the study of divided government in context. To begin with, Mayhew's path-breaking study began with the 78th Congress (the post–World War II era). The 78th Congress passed approximately 600 acts. The next 20 years saw a precipitous growth in legislative action, peaking with the Great Society Congresses (the 84th Congress and 85th Congress)—each of which produced more than 1,000 acts. The era from World War II to the Great Society was unusually active. Since 1966, there has been a steady decline in total legislation passed, and the number of public acts passed today is less than half the number passed in the peak years of the late 1950s and early 1960s.
Acts of Congress: This figure displays the total number of public acts plotted over time.

Today, there has been much written about the institutional paralysis brought on by a surge in partisan polarization. The trends in figure 2a suggest a more measured interpretation. The low number of bills passed in the most recent Congresses are predictable forecasts from the steady trend downward in number of laws passed since the 1960s.
Figure 2a also reveals that the post–World War II period differs markedly from what had come before. There are clearly four eras of congressional history, in terms of total legislative output. The first is the Antebellum period (1789 to 1861). A typical Congress passed only 150 public acts. Despite their obvious importance, the first two Congresses were not that productive in total numbers of bills passed. And, the 26th Congress earns the title of the Do Nothing Congress, which managed to pass only a few dozen public acts. The second era is the Industrial period (from 1862 to 1925), roughly the Civil War through the end of World War I (1862 to 1925). Throughout this time, there was a steady rise in the number of public acts from 200 to 500 acts per Congress. This is an era of rapid industrialization in the nation and, interestingly, corresponds almost exactly to the period that Skowronek identifies as the era of the development of the American national executive (Skowronek Reference Skowronek1982). The third era is the New Deal, which begins before FDR's election and extends to the Great Society. Some scholars term this the Modern Era in Congress. The number of laws passed by Congress jumped in 1927–29 and stays at that very high level of productivity from 1927 through 1966. This era also coincides with the rise of the conservative coalition and the partisan realignment that leads to the ascendancy of the Democratic Party nationally. The fourth era, the Postmodern Congress, begins in 1967. The 1966 midterm elections marked the beginning of a turn in American politics, which ultimately brought the rise of Richard Nixon and Ronald Reagan. Legislative activity drops substantially from 1965–66 to 1967–68 and has continued to trend downward since. Aldrich and Niemi (Reference Aldrich, Niemi and Craig1996) characterize this as a protracted period of partisan dealignment, rising incumbency advantages and campaign expenditures, and growing public dissatisfaction with Congress. Legislative output declined steadily from 1967 to 2015. There was much handwringing about the number of bills considered and passed in the 112th Congress. Mann and Ornstein (Reference Mann and Ornstein2013) blame the declining productivity on “the new politics of extremism,” which caused gridlock in the American constitutional system. Figure 2a puts those concerns in historical context. The levels of productivity that we see today are back to the levels associated with the period from 1870 through 1920, and extend the downward trend that started in 1967.
The arc of congressional history raises numerous questions. There is a great rise in legislation over the first 150 years of Congress and then a 50-year decline in output. Why the rise and decline? Spikes in legislative activity do not coincide with electoral realignments or policy realignments. The most productive Congresses are the 70th (1927–29) and 84th (1959–61), not, as we might have guessed, the 73rd (1933–35) or 89th (1965–67). And, Reagan's first congress—the 97th from 1981 to 1983—is remarkably unproductive. Why the jump in legislative activity in the 1920s, before the New Deal, and in 1960, before the Great Society?
We are also struck by the tremendous differences between the nineteenth and twentieth centuries. The first two Congresses set the stage for the development of the American state, but it took a full century before Congress got into the swing of legislating what we might consider today to be public policy. Why is the nineteenth century “policy free”?
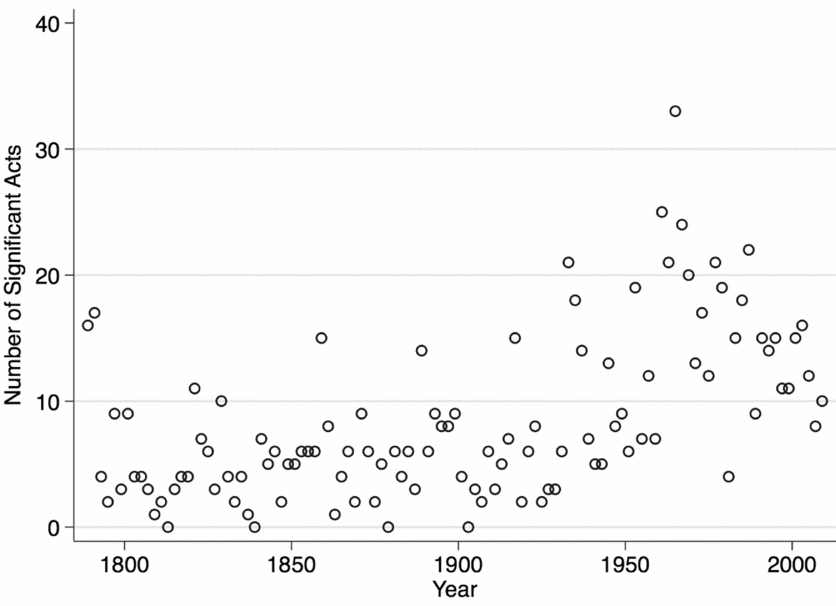
The history of significant legislation adds to the richness of the picture and tells a subtly different story about Congress. Figure 2b presents the history of significant acts passed by Congress. Each point in the plot is a Congress. This graph consists of all public acts determined by our project to be significant acts of Congress.
Significant acts of Congress: This figure displays significant acts of Congress plotted over time.

As with total legislation, there is a marked difference between the nineteenth and twentieth centuries. The nineteenth century produced much less significant legislation than the twentieth century. The amount of significant legislation passed by a typical Congress rises from the end of the nineteenth century through the middle of the twentieth century, peaks in the 1960s, and then steadily declines. Today the number of significant acts passed by a typical Congress is now back to the levels typical of the end of the nineteenth and beginning of the twentieth centuries (Congresses 55, 56, and 57), but still above the historical average.
Total legislation and significant legislation have very different peaks. The 1st and 2nd Congresses stand above the rest of the nineteenth century in terms of number of pieces of significant legislation passed. From then to the New Deal, three other spikes occur—the first Civil War Congress (the 36th, 1859–61), the 51st Congress (1889–91), and the World War I Congress (the 65th, 1917–19). Two of these spikes correspond to major war efforts. The other, the 51st, is more curious. It is the first term of Harrison's presidency, which historians do not describe as a notable presidency. But it is also the first two years of Thomas Brackett Reed's speakership, and the beginning of the transformation of political power within Congress. The twentieth-century spikes correspond to significant policy realignments. There are tremendous jumps in the numbers of significant acts with the advent of the New Deal (the 73rd, 74th, and 75th Congresses) and the creation of the Great Society programs (the 87th, 88th, and 89th Congresses). In these two eras Congress passed very large numbers of acts that had long-lasting significance to the nation.
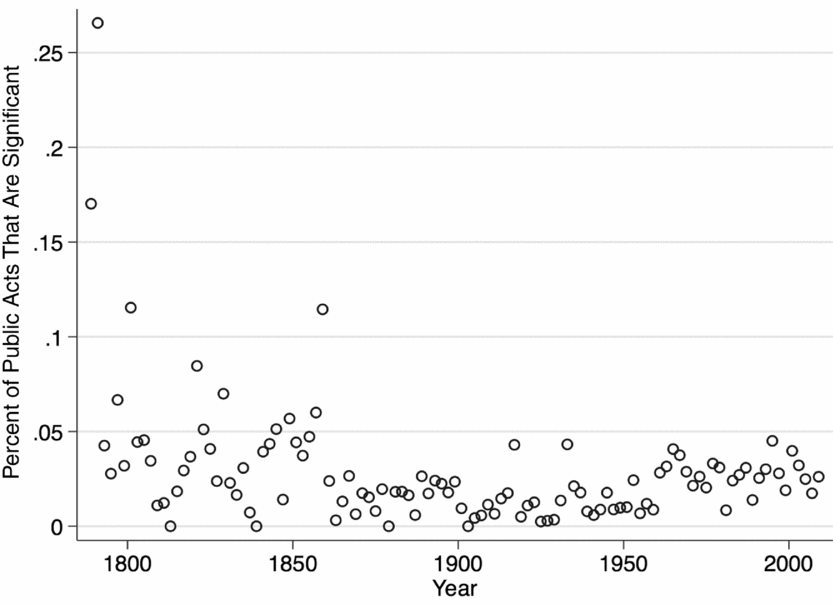
There is another way to understand the incidence of significant legislation, and that is as a percent of total legislative output. One simple story is that no Congress is particularly special in its ability to produce significant legislation, but that the more legislation a Congress passes the more likely it is to pass significant legislation. This is perhaps the “dartboard theory of Congress.” The more darts one throws the more likely one is to hit a bullseye. Figure 2c presents this alternative view of the history of congressional legislative output. We simply took the ratio of significant acts to total public acts for each Congress. We view this ratio as a measure of the effectiveness of congressional action.
Acts/significant acts of Congress: This figure displays the percent of all public acts that are significant.

Viewed from this perspective the Antebellum Congresses are exceptional. The 1st and 2nd Congresses were, by far, the most effective legislative sessions in our history. One in six acts passed by the 1st Congress were deemed significant, and one in four acts passed by the 2nd Congress were determined to be significant. For that reason alone, they deserve special attention. But the rest of the Antebellum era also appears to have been unusually effective. The 7th Congress (1801–3), the 17th and 18th (1821–25), and the 36th (1859–69) had unusually high percentages of significant acts. These Congresses dealt with the expansion of the nation (especially the admission of states), reorganizations of the executive, and the recurring problems of slavery and Indian relations. The problems pressing on the country, then, meant that they seem bound to pass significant legislation. But this is also an era in which Congress, on occasion, ground to a complete standstill, as with the 13th, 26th, and 38th Congresses. The significance of these early Congresses, though, points to a weakness with prior inquiries. Much happened before 1946 or 1877 that ought to inform how we think about what Congress does and when it does it.
Setting aside the pre–Civil War Congresses, no clear pattern emerges. From the 37th to the 112th Congress, the percent of legislation that one might consider significant hovers around 2 to 3 percent of all acts passed. Even the 73rd, 87th, and 88th Congresses show a very low level of effectiveness. In all three cases, less than 5 percent of all legislation was considered significant. There does, however, appear to be a slight difference between the pre–New Deal and the post–New Deal Congresses. The rate at which Congress passes significant legislation is slightly higher since the New Deal. The percent of legislation that is considered significant, then, appears to be a fairly constant percent of all acts.
The patterns in figures 2a to 2c provide us some confidence in the coding of significant legislation. Figure 2c demonstrates that our database of significant legislation does not suffer from “recency bias.” In percentage terms, bills from the nineteenth century are no less likely to be considered significant than bills from more recent times. There is simply a greater volume of legislation in the twentieth and twenty-first centuries, and that drives the number of significant bills.
One interpretation of the patterns in figures 1 and 2 is that the history of Congress is one of increasing organizational capacity for doing its most basic task: passing laws. Improvements in procedures, staffing, technology, and so on, have all improved the efficiency of the organization and the ability to get things done. Even when Congress appears divided and dysfunctional today, it still has a much greater ability to deal with legislation, and it can function with much greater ease than it has in the past.
Significant legislative actions are rare. They occur infrequently, but every Congress in modern history makes its mark. The frequency of significant legislation has also been driven by the increased organizational capacity of Congress. Just as Congress is able to do more thanks to procedures, people, and technology, so too is it better able today to take significant actions and make sweeping legal changes. Around those generally upward trends in both total legislation and significant legislation are some very notable variations in legislative activity.
The time trends examined here lay the groundwork for the second part of this article: understanding why Congress passes more and more significant laws at some times in our history than it does at other times. One of the central conjectures of modern political science is that partisan control of the branches of government shapes the ability of Congress to get things done. Specifically, it is widely argued that unified partisan control of the government creates a much larger opportunity to change the laws of the land than does divided party control of the government. When the same party has majorities in the House and Senate and controls the White House, the policy differences among the branches of government are thought to be much smaller, and the possibilities for reaching agreement in negotiations over changes in laws are thought to be much greater. Such opportunities, of course, can be squandered by political leaders, and there may be moments when events bring politicians to act together (e.g., the first Gulf War in 1991) despite partisan differences. Such moments, however, are thought to be unusual; in the normal course of politics, unified partisan control of government, as David Mayhew conjectured in Divided We Govern, creates the necessary conditions for significant changes in public laws.
In the next section we use variation in the passage of both significant legislation and total legislation to gauge how much unified or divided partisan control of government contributes to congressional productivity.
Two caveats are in order. First, the argument is not that unified partisan control is everything. Congress accomplishes a great deal when politics are divided. The 91st and 100th Congresses—both divided—passed as many significant laws as the 73rd. But on the margin, there does seem to be a relationship. The 1st and 2nd (unified) are more productive than the 3rd and 4rth (divided), and so forth. We aim to measure how much additionally Congress gets done when the same party controls the House, the Senate, and the presidency.
Second, the value in looking at the entire history of Congress is that it gives us added perspective on our own time. Today, the debate that is raging among political commentators and political scientists concerns the destructive nature of partisan polarization. There is tantalizing evidence in the historical time series that partisan polarization and legislative productivity are related. The rise in productivity in Congress in figures 1 and 2 corresponds quite closely with the decline in polarization in the House and Senate, and especially with the percent of legislators from each party who are “overlapping”—that is Democrats to the right of at least one Republican and Republicans who are to the left of at least one Democrat. In particular, Poole and Rosenthal (Reference Poole and Rosenthal1997) identify the 70th Congress (1927–29) as the beginning of a substantial decline in polarization within the Congress, and after the 90th Congress polarization gradually increases. This era from 1927 to 1973 is often looked back on as the standard for how Congress ought to behave by commentators such as Thomas Mann and Norman Ornstein (Reference Mann and Ornstein2013), and it does appear that broad historical fluctuations in polarization correspond with broad ebbs and flows in the tide of significant legislation. But, what is causing what? Both the measure of polarization and the measure of legislative activity concern the same outcome—legislative decision making. These two factors are so closely tied to each other that it seems unlikely that there is a clean causal account. It may be that Congress can get more things done when politics are less divided. It seems just as plausible that when legislators decide to get a great deal done party becomes much less important.
Effects of Divided Government
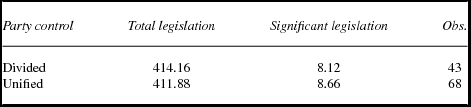
How does divided government influence legislative output? Examining the full span of the history of Congress, divided government has produced 8.12 significant bills per Congress on average; in contrast, unified governments averaged 8.66 significant bills.Footnote 8 For this simple comparison of means, performing a hypothesis test with a null hypothesis of no difference in legislative productivity for unified versus divided government does not allow us to reject the null at standard significance levels. Furthermore, when examining total legislation (see table 1), divided government corresponded to a slightly higher level of legislation than unified government, with a total of 414.16 pieces of legislation under divided control versus 411.88 under unified control. These initial results do not provide strong support for Mayhew's conjecture, but importantly they neither control for important variation in the levels of legislation for different historical eras of Congress, nor do they account for time trends in legislative productivity.
Mean legislative output per Congress

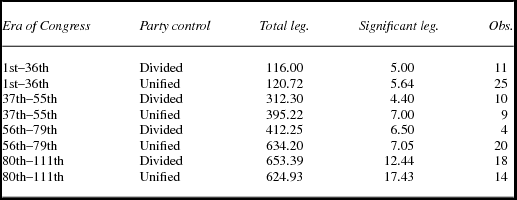
To begin to account for these possibilities, we examine legislative productivity in four distinct eras: pre–Civil War (1st–36th Congress), post–Civil War but before the turn of the century (37th–55th Congress), post-1900 to the conclusion of World War II (56th–79th Congress), and post–World War II (80th–111th Congress).Footnote 9 While the size of the differences varies across eras, in each case unified partisan control produces a higher level of significant legislation. The largest raw increase in legislative productivity occurred in the post–World War II era: Unified partisan control led to five more significant acts per Congress than divided partisan control, amounting to a 40 percent gain. The post–Civil War period also registered a large increase in legislative productivity under unified government, with a raw increase of 2.6 significant acts per congress, or roughly a 60 percent increase. In the pre–Civil War era, unified partisan control registered 5.64 significant acts per Congress versus five significant acts under divided partisan control (less than a 10 percent jump). Finally, for the period post-1900 to the end of World War II, the difference narrows further to just 0.55 bills per Congress. Turning to total legislation, the results mostly track with the pattern observed for significant legislation. The one exception is the post–World War II era, when divided control yielded higher total legislation per Congress than unified government. Breaking out legislative output by era also reveals a general upward time trend for both total legislation and significant legislation, with the upward trend being more pronounced for total legislation.
While examining mean legislative output per Congress by era reveals a gap in productivity between unified and divided governments, this approach does not fully control for some crucial factors that may influence legislative output. Table 2 reveals substantial increases in the level of significant legislation over time. That is, as time passes, Congress has grown more productive under both divided and unified government. As a result, we must explicitly account for time trends in legislative output, which we do in several ways. First, we estimate ordinary least squares regressions of legislative productivity on unified government and include indicator variables for each era of Congress. Second, we include an alternative specification that uses first differences to remove time trends from the data, allowing us to focus on how legislative productivity changed from Congress to Congress after changes in partisan control.
Mean legislative output per Congress, by era

Another concern not addressed by a simple comparison of means is that context can change systematically from one presidential administration to another. Comparing legislative output across presidential administrations may overlook the fact that the effectiveness of a president's administration could play a role in legislative output, while also influencing the partisan composition of government. For example, the legislative effectiveness of a first-term president influences their odds of winning a second term and, through partisan tides, the odds of winning for copartisan members of Congress. Thus, a successful president might be responsible for high levels of legislative productivity and, due to this success, also be responsible for unified partisan control. This scenario might lead us to attribute changes in legislative productivity to partisan control when in fact the causation runs in the opposite direction. By including a fixed effect for each president, we can examine how party control affects legislative productivity within a president's term, thereby ruling out variations due to different administrations.
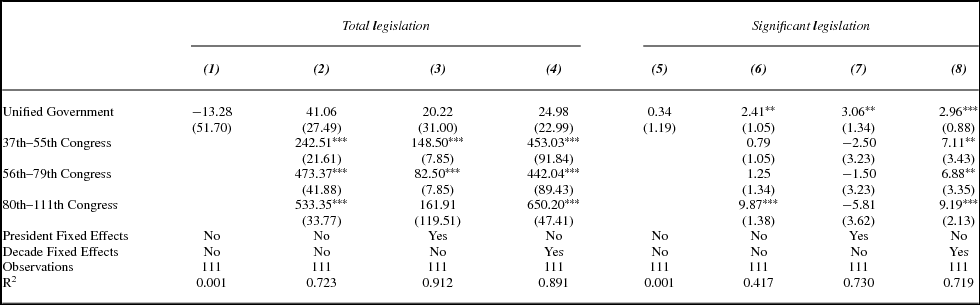
We report ordinary least squares estimates of the effect of unified government on legislative productivity in table 3. We find that unified government is associated with between 2.41 and 3.06 additional significant acts (as compared to divided government). This result obtains when we include era dummy variables as well as when we include president fixed effects. The effect sizes are substantively large. Congress has averaged fewer than nine significant pieces of legislation under divided control, so the increase in productivity under unified partisan control amounts to an increase of more than one third. In fact, if we log-transform legislative output and reestimate the model, unified government is associated with an even larger percentage increase in significant legislation for our preferred specification: Table C1 in appendix C suggests that instances of unified control, when compared to divided control in the same presidential administration, coincided with an increase in significant legislation of 38 percent. Conversely, we do not find consistent evidence that unified government affects total legislation (models 1–4 in appendix Table C1).
Divided/unified government and legislative output

Note: Robust standard errors are in parentheses.
Including the period dummy variables plays an important role in the estimation of unified government's effect on significant legislation, especially regarding legislative output since the end of World War II. Before the 80th Congress, there were 24 cases of divided government and 55 cases of unified government. After the 80th Congress the numbers were more equal with 18 cases of divided government and 14 cases of unified government. The fact that there have been proportionally more cases of divided government since 1945, combined with Congress's tendency to produce more legislation over time, means that not accounting for the systematic differences in eras would lead us to potentially underestimate the effect of unified government for the full period.
Examining the models in table 3 more closely, we note that the effect is robust to several different specifications. When we look at the effect of unified government only within the same presidential administration, we still estimate an effect of three additional significant acts. Similarly, when we use decade fixed effects—designed to control for any variation in how data was gathered from decade to decade—the effect also remains stable at three additional acts under unified government.
We also reestimate the results using a polynomial time trend rather than era dummy variables. Table C2 in appendix C presents these results. Using a time trend rather than era dummy variables does not substantively alter our finding on the effects of unified/divided government. Our estimates using this alternative specification find that unified government is still associated with approximately two to three additional significant acts depending on the specification.
As another way to counter the time trends in the data, we take first differences. We examine the change in significant legislation from one Congress to the next as a function of changes in partisan control. After first differencing, the outcome variable (the change in legislation from one Congress to the next) appears to follow a stationary process with a mean of zero and constant variance over time.
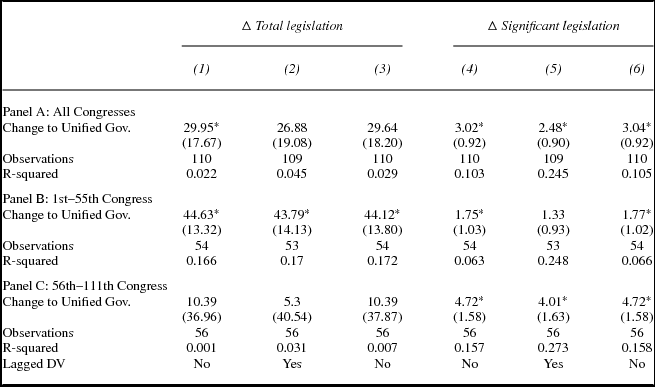
Our findings provide further support for the notion that unified partisan control is associated with increased output of significant legislation. In panel A of table 4 we estimate that a change to unified government yields an increase of three significant acts. When including a lagged term, under the theory that momentum from previous years might influence legislative output, our results remain unchanged. In addition, the effect sizes are substantively large, as the share of significant acts increases by roughly one third.Footnote 10 To place the result in context, consider that Congress has changed from divided to unified control or vice versa 42 times (21 times from divided to unified and 21 times from unified to divided) and that each change is associated with a gain or loss of between three and four pieces of significant legislation. All told the estimates suggest that Congress's legislative record might be markedly different were there substantially more years of uninterrupted divided or unified control. Finally, in contrast to the large effect on significant legislation, we find that changes in party control have no effect on changes in total legislation.
Changes in unified government and legislative output

Note: Robust standard errors are in parentheses.
Examining the estimated effects era by era illustrates that the effects of a change from divided to unified government has not been constant over time. Panel B in table 4 reestimates the model using only sessions of Congress from before 1900. Unified control in this era was associated with between one and two additional pieces of legislation. By contrast, we observe a larger and more robust effect for 1900 and after. Panel C in table 4 reveals that changes to unified government coincided with an uptick in legislative productivity of four bills for Congresses that convened in 1900 and after.
Part of the explanation may be that Congress has done more after 1900—Congress averaged 200 public acts before 1900 and more than 620 public acts since. Indeed, panels B and C of table C3 in appendix C confirm that on a percentage basis the effect of unified government before 1900 is not significantly different from the effect after 1900. Both estimates hover around 30 percent depending on the specification. Thus, if we consider the upward trend in the number of public acts and significant legislation over time, the effect of unified government on its own does not appear to have changed drastically.Footnote 11
Examining the full history of Congress, we find that changes in party control have a sizeable effect on the passage of significant legislation; however, we find no such pattern for the passage of total legislation. These contrasting results underscore the value of studying significant legislation, as opposed to all legislation. Congress passes many symbolic acts, including naming post offices, issuing proclamations to recognize causes or groups, or passing resolutions that lack force of law but expresses concerns. Most of these inconsequential bills are not controversial, and the roll call votes often near-unanimous and nonpartisan. When Congress engages with a substantial change in the national law and policy, we see the effects of partisan politics in clearer relief. Thus, a change in government from divided to unified partisan control is associated with a 30 to 40 percent increase in the number of significant laws passed. While the level effect has grown in line with the upward trend in legislation, the effect as a share of significant legislation has remained stable over time.
Given that eras of unified government coincide with increased legislative productivity, the next step is to ask (1) what mechanisms best account for the observed upticks in productivity under unified control; and, (2) are there alternative explanations that account for the observed increases in legislative productivity? The span of congressional history has seen much other significant institutional variation. The introduction of the cloture rule, changes in the use of the filibuster, changes in the concentration of power in party leadership in the House, and changes in the strength of political parties (to name just a few) all likely have some influence on legislative productivity.
In fact, some of these factors might be “necessary conditions” that work in tandem with unified government to boost legislative productivity. To determine whether this is the case, we examine the relationship between legislative productivity and several additional variables: an indicator for a supermajority in the Senate, the size of the budget deficit as a share of federal outlays, time since the president's party last held unified control, time since the party opposing the president last held unified control, and time since the last instance of divided control. Our goal is to see whether these issues interact meaningfully with the link we observed between unified partisan control and legislative productivity. If not, then the simplest possible explanation—having a majority across both chambers of Congress—sufficiently explains variation in productivity during moments of unified control.
In our main specifications, we have focused on Mayhew's conjecture that divided partisan control of government affects the amount of significant legislation passed by Congress. Krehbiel (Reference Krehbiel1998, Reference Krehbiel, Adler and Lapinski2006) offers a further claim that the location of the filibuster pivot (i.e., the senator whose vote would prove pivotal in ending a filibuster) helps determine the ability of Congress to pass significant legislation. Specifically, Krehbiel argues that a “gridlock” zone exists in the area between the filibuster pivot and the veto override pivot. When the status quo policy falls between these two points, Congress will struggle to pass legislation because both the president and filibuster pivot will block any legislation moving away from their ideal points.
We account for the filibuster pivot by tracking when a party held a filibuster-proof majority. Other researchers (e.g., Gray and Jenkins Reference Gray and Jenkins2016) have found weak support for the filibuster pivot argument, especially compared to the divided government argument. When there is unified control across all branches of government, a filibuster in the Senate might nonetheless lead to gridlock. For example, in the first two years of the Clinton administration, a minority group of Senate Republicans employed the filibuster to prevent passage of a broad range of bills including health-care reform, campaign finance reform, and limits on lobbying. Though the Democrats held control of the presidency, House, and Senate, passage of several pieces of significant legislation was obstructed by filibuster. If the Democrats had held a filibuster-proof majority (more than two thirds since 1917 and more than three fifths since 1975), they could have been more productive.
To test the degree to which a supermajority makes a difference for legislative productivity, we estimate a model that includes indicator variables for unified government, a supermajority, and, finally, the interaction between the two. A coefficient with positive sign for the interaction term would suggest that Congresses in which there was unified party control and a Senate supermajority coincide with increased legislative productivity. Specification 4 in table C4 in appendix C coincides with our expectations. We observe a positive effect for the interaction term between unified control and supermajorities when significant legislation is the outcome variable. The marginal effect of unified government on its own (without the interaction term) is also still positive, though its 95 percent confidence intervals does now include zero. In combination, this suggests that the effect of unified government might be amplified in Congresses that coincide with a Senate supermajority, but that even without a supermajority there is still substantial positive effects of unified government on legislative productivity. Specification 3 provides weaker evidence in support of the notion that supermajorities are important. When we do not include period dummy variables, all coefficients’ 95 percent confidence intervals overlap with zero. One reason is that any test of theories involving supermajorities must rely on a reduced sample size—from 1917 onward—after adoption of the cloture rule.
Budgetary issues could serve as another way in which institutional constraints shape the effects of unified government on legislative productivity. If the government has run a large deficit in the previous Congress, pressure to balance the budget might reduce possibilities for significant action. Table C5 demonstrates that this explanation does not carry much weight. In fact, in moments where a higher deficit (in terms of percent of federal outlays) has coincided with unified government, Congress has been more likely to pass significant legislation. This account is consistent with the notion that periods of spending with less regard for short-term deficits are associated with higher legislative productivity (i.e., Congresses during the New Deal and Great Society).Footnote 12
Long stretches of opposition party control or of divided government might influence subsequent levels of legislative productivity during periods of unified control. Specifically, a unified Congress and president might have less to do if they held unified control very recently; however, a long stretch of divided control or of the opposition party holding unified control might elicit a wave of legislation designed to make up for past gridlock (divided control) or to undo previous legislation (unified opposition control). Table C6 in appendix C presents the results from this model. With the caveat that focusing on unified government only has reduced our sample size, we find no evidence that who controlled Congress previously makes a difference during periods of unified control.
Based on this array of evidence, it appears that unified partisan control on its own is generally sufficient for increased legislative productivity, though also having a filibuster-proof majority helps. Our second concern is that explanations other than unified government better define the observed increases in legislative productivity. For instance, if certain institutional changes correlate with both divided government and legislative productivity, then these omitted factors—rather than divided partisan control of government—could be more crucial for determining legislative productivity.
Here, we examine two possibilities. First, what role does the length of the legislative session play? If the number of days in session correlates with divided government, and we do not control for session length, then we might incorrectly attribute increased productivity to unified control of government. In practice, it appears that days in session has increased almost linearly over time. When we include a variable measuring days in session, our central results do not change. Table C7 (specifications 1 and 4) illustrate this point. On its own, days in session is not predictive of any change in legislative productivity. Furthermore, including it in a specification with an indicator for unified government does not meaningfully change our previous estimates.
Second, does accounting for variation in the centralization of power in House and Senate leadership change our conclusions in any way? For instance, between 1890 and 1910, power was so centralized in the Speaker of the House that he was often referred to as a czar (Galloway and Wise 1975) and controlled committee appointments, the Rules Committee, and recognition of motions for unanimous consent and suspension of the rules (Cooper and Brady Reference Cooper and Brady1981). Cooper and Brady (Reference Cooper and Brady1981) makes the case that party strength (measured, e.g., through the share of party-line votes) was a key ingredient to enabling a centralized party leadership. The effect this might have on legislative productivity is ambiguous. Cooper and Brady (Reference Cooper and Brady1981) argues that leaders with centralized powers were more likely to be “task or goal oriented,” but also less likely to reach consensus and negotiate. Furthermore, one of the key complaints that precipitated the revolt against Speaker Joseph Cannon was the objection to his tendency toward the status quo in the face of rising demand for progressive reforms. Whatever the case, if unified party government tended to occur in tandem with strong parties and centralized leadership (and these affected legislative productivity), then our primary estimates might suffer from important omitted variable bias.
We test whether including measures of leadership centralization in the House and the Senate attenuates our estimates of the effect of unified government on significant legislation. To measure centralization of leadership, we employ a coding scheme developed in Brady et al. (Reference Brady, Cooper and Hurley1979) and extended in Aldrich et al. (Reference Aldrich, Berger, Rohde, Brady and McCubbins2002) that covers Congresses from the late nineteenth century onward. In table C7, we include a specification that includes a dummy variable that takes a value of one in cases when both the House and Senate are coded to have had centralized leadership. The coefficient on this variable is negative and its 95 percent confidence intervals do not overlap with zero, suggesting a decrease in legislative productivity under centralized leadership. However, including this additional variable does not meaningfully attenuate the coefficient on our primary variable of interest: We continue to observe that unified government coincided with increases in roughly four bills per Congress. When we use a slightly different measure of centralization (including separate variables for the House and the Senate, along with an indicator for a strong party caucus in the House), our primary estimate stays the same.
Another possible concern about our analysis is that the results are dependent on our particular approach to collecting and identifying significant legislation. To reduce this concern, we replicated our analysis using counts of major legislation from Stathis (Reference Stathis2014). Appendix A presents these results. In table A1 we replicate the analysis of the effect of unified government on significant legislation (table 2). When we include data from all Congresses, the coefficients are all positive, but the results are only statistically significant in one of the four model specifications. However, when we subset the data to include only our first three periods from the 1st to 79th Congresses, the results are significant across all specifications. As shown in figure 2, our data differs more from Stathis's data in the later Congresses; Stathis finds more bills to be significant. The difference in results is thus attributable to the coding of recent legislation. In table A2, we replicate the analyses in tables 4, 5, and 6, where we measure the relationship between a change in unified government and a change in significant legislation. We find a statistically significant effect for all Congresses and for the 1st through 55th Congresses period, but the results for the 56th through 111th Congresses alone are not significant. Overall, the models with the Stathis data confirm our findings, and show that when the full legislative output of Congress is studied, there is a positive effect of unified government on productivity. While we see differences in the effect of unified government in legislative productivity for the postwar period, this matches the literature, where the result is dependent upon the coding of significant legislation.
Conclusion
Today it seems taken as axiomatic that the political parties in the United States have created a dysfunctional legislative process that is incapable of passing legislation, let alone legislation of any significance. This line of thinking, taken as a broad argument about American government, would predict that when government is divided and when parties are polarized ideologically, little can get done. This analysis puts the current Congresses in historical context and shows Congress to be more productive than popular accounts would have the public believe. Our assessment is that there is an effect of divided partisan control of government on the likelihood that Congress passes significant legislation. Congress passes about 30 percent more significant acts when the House, the Senate, and the presidency are controlled by the same party than it does when different parties control the branches of government. Interestingly, that is not the case for all bills, only significant legislation. However, this finding does not mean divided government is completely dysfunctional. Instead of passing 12 significant laws, which is the average for unified government in the twentieth century, a divided government typically passes nine significant laws. Even in a Congress that many observers described as the most dysfunctional ever, the House and Senate managed to hammer out a complete rewriting of the US patent law, redefining what is patentable in the country.
The importance of party control comes into sharper focus once we take a long historical perspective, but so too do the limits of party-based arguments about law making. In particular, party control of government cannot explain most of the variation in what Congress has done throughout US history. Party control cannot explain why there is much more legislation and much more significant legislation in the twentieth century than in the nineteenth century. Nor can party control explain the surge in significant legislation and overall legislation from the 1930s to the 1960s and the ebb in significant legislation since. It cannot explain why the 1960s were so much more productive than the 1930s or the 1890s. It cannot explain why unified party control during the nineteenth century is less productive than divided party control in the twentieth and twenty-first centuries. It cannot explain the legislative accomplishments of Congress during the Nixon years, compared to more recent spells of unified government under Bill Clinton, George W. Bush, and Barack Obama. And it cannot explain the steady downward trend in legislative productivity in the United States since 1970, a trend that all Congresses—whether during unified or divided government—seem incapable of escaping.
A closer look at the data make even clearer the inadequacy of party control of government as an explanation for the broad trends in legislative activity throughout the history of Congress. First, unified control of government occurred more often during the first 110 years of Congress (65 percent of Congresses were unified) than for the next 115 years of Congress (61 percent). Second, unified party control, without including any other factors in the regressions, explains a tiny percent of the total variation. When we model the data using just party control of government, the R-Squared is less than 1 percent. Third, when the models include simple time trends (four eras of congressional history), most of the variation in the data is explained. Fourth, indicators of presidencies account for another 20 to 30 percent of the variability. Who is president, then, may be much more important than whether control of government is unified in the hands of one party or divided between them. We offer no causal or theoretical account for these eras, except to note that they explain 40 to 70 percent of the systematic variation and are far more important than party, a finding consistent with Peterson's Legislating Together. Why might that be the case? We leave that question unanswered—a challenge for future theorizing and empirical investigation. The study of Congress and legislation is usually inward looking, focused on the institution. The importance of the individual president (rather than the party of the president) in explaining the variation in legislative productivity suggests that forces outside the institution are essential to understanding what Congress does and when it does it.
The data marshaled here have helped us to put the party explanations of legislation in a broader historical perspective. They both provide evidence of an effect of party control on law making and expose the limitations of that line of explanation. Several broad historical patterns cry out for explanation and cannot be accounted for by the usual party control of government account. In particular, why did the demand for national legislation begin to grow in the second half of the twentieth century? The American Congress since 1945, or perhaps 1932, appears to be a fundamentally different institution in terms of significant legislation passed than the institution that existed before the middle of the twentieth century. There was a profound change in the 1930s, or perhaps the 1940s, in what people seem to demand from national government, and even during the years of New Federalism and deconstruction of the Great Society and New Deal, the amount of significant legislation enacted by Congress has far exceeded what came before the 1920s. Perhaps that puzzle may be waved away by noting that life is just more complicated now, but that only begs the question (or perhaps the explanation). Is it the case, then, that Congress does what it does and when it does it not because of political polarization, party control, or other internal and institutional accounts, but because Congress responds to the needs of an increasingly complex nation? That is, perhaps Congress does what it does, as Arthur Maass argued three decades ago and James Madison argued two centuries ago, because it acts in the Common Good.
Supplementary material
To view supplementary material for this article, please visit https://doi.org/10.1017/ssh.2017.42