When do the wealthy support redistribution? Political economy theories produce conflicting expectations about the relationship between income and support for redistribution. Arguments based on material self-interest predict that the wealthy will systematically oppose redistribution: progressive taxes and transfers leave the wealthy worse off.Footnote 1 Several studies of advanced democracies lend support to this expectation.Footnote 2
But there are reasons to suspect that self-interest is not the whole story. Behavioral economists offer extensive evidence that interpersonal comparisons can trump pocketbook considerations. In lab experiments, subjects have shown a willingness to give up some monetary pay-offs if doing so allows them not to fall behind others; this is disadvantageous inequity aversion or resentment.Footnote 3 Interpersonal comparisons can also mean that people suffer utility losses when others earn less than they do; this is advantageous inequity aversion or altruism.Footnote 4 To the extent that political economists have studied the impact of interpersonal comparisons on preferences for redistribution in real-world settings, the discussion has been dominated by explorations of altruism, which can either complement pocketbook considerationsFootnote 5 or displace them.Footnote 6
This focus has led to an imbalance. Though it is not difficult to elicit a ‘keeping-up-with-the-Joneses’ mentality in a lab setting, in real-world settings we know little about the effects of intra-class resentment.Footnote 7 Testing for interpersonal comparisons in the real world is important, since government interventions often end up treating similarly situated individuals differently, such as when taxes have discontinuous rate structuresFootnote 8 or economic actors can exploit loopholes.Footnote 9 What’s more, the perception that fiscal and public pricing policies impose iniquitous burdens may be widespread.Footnote 10
Our article takes a step toward correcting this imbalance. We take advantage of a unique opportunity to compare the impact of pocketbook concerns, altruism, empathy and resentment in response to a real-world income shock. As described below, in 2012, the Argentine Government quintupled public utility rates for gas, electricity and water in some wealthy areas of Buenos Aires, while leaving rates unchanged for similar wealthy households in the same neighborhoods. Because the price hike was equivalent to a 5 per cent increase in the income tax paid by the typical household in the affected area, it might have provoked pocketbook reactions. But if behavioral experiments have external validity, interpersonal comparisons might also have been provoked. Because only affluent households saw their rates rise, and because the government justified the hike on redistributive grounds, it might have elicited altruism. And because some wealthy people’s rates rose sharply while those of others remained unchanged, the rate hike might have provoked empathy among those who escaped the price hike and resentment among those who did not. We evaluate each of these possibilities by embedding a survey experiment, which induced people to make intra- and cross-class comparisons, within the quasi-experiment created by the Argentine Government.
In addition to studying inequity aversion outside the lab, our study contributes new evidence on the redistributive preferences of the wealthy. While investigators often make assumptions about the attitudes of this subset of the population, they rely on representative sample surveys in which the number of wealthy respondents is small.Footnote 11 By drawing a representative sample of wealthy individuals, our study opens a window into the preferences of this hard-to-reach – yet theoretically crucial – population.
To anticipate our findings, resentment was the most salient reaction. Respondents withdrew support for redistribution when they were reminded that they paid for it while others were spared. Though perhaps this reaction is unsurprising, its dominance over all others is surprising, and cuts against expectations in the literature. For instance, pocketbook effects were basically absent. People whose disposable incomes dropped substantially because of the price shock did not, for this reason alone, evince more anti-redistributive preferences. And whereas altruism has been much discussed in studies of distributive preferences, we find little evidence of it in the wake of a real-world fiscal shock: the cross-class redistributive aims of the policy had only modest resonance among our samples. Just as striking as the absence of altruism is the absence of empathy in wealthy Argentines’ responses. Those who escaped the price shock and were reminded that some among their peers had been singled out to pay more were mostly unmoved.
HYPOTHESES
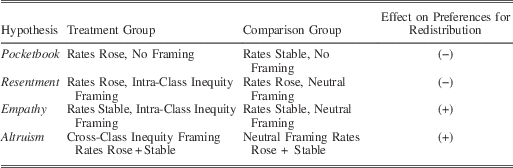
We posit four possible reactions to the price shock. The first one operates through the pocketbook: individual reactions to redistributive policies are driven by the impact of the price hike on income. The remaining reactions operate through interpersonal comparisons, which we classify along two dimensions (Table 1). First, do the wealthy compare themselves with similarly affluent neighbors or with lower-income citizens?Footnote 12 Secondly, when the reference group is their peers, are they more bothered by dropping behind others or by rising above them?Footnote 13
Types of Inequality Aversion

We describe people who do not incur an income loss due to the policy but are reminded that some of their peers did incur an income loss as empathetic, in the sense that they dislike seeing others fall behind. People who feel resentment are ones who turn against redistribution when they suffer a loss and are reminded that others among their peers were spared this loss. In turn, people are altruistic, in our usage, to the extent that they are other-regarding and focus on the relative welfare of people below them on the income ladder.Footnote 14
With these ideas in mind, we randomly assigned respondents whose rates rose or remained unchanged to treatments that elicited intra-class comparisons (emphasizing that the burden of redistribution was allocated differently among similar wealthy people) or cross-class comparisons (emphasizing the egalitarian goals of the policy). The following hypotheses focus on the effect of the price hikes and framings on support for the price hike and for other forms of redistribution:
Hypothesis 1 (Pocketbook orientation): Experiencing a policy-induced income loss leads to reduced support for redistributive measures.
Hypothesis 2 (Resentment): Experiencing a policy-induced income loss when it is salient that others in one’s peer group avoided it leads to reduced support for redistributive measures.
Hypothesis 3 (Empathy): Not enduring a policy-induced income loss when it is salient that others in the peer group did endure it leads to reduced support for redistributive measures.
Hypothesis 4 (Altruism): Experiencing a redistributive policy that benefits poorer people leads to increased support for redistributive policies.
Table 2 summarizes the testable implications that each hypothesis generates.
Predictions

THE PUBLIC PRICE SHOCK
The 2012 price hike in Buenos Aires was an attempt to shift away from highly subsidized public utility rates, a holdover from the deep 2001–02 recession.Footnote 15 Even some relatively wealthy Argentines faced difficulties paying for basic services, and Peronist governments kept gas, water, electricity and public transportation prices uniformly low. A decade later, when the crisis had given way to a commodity export boom and incomes had rebounded, this pricing structure was anachronistic and wasteful. It was anti-redistributive, in a country governed by a center-left political party; it also underwrote heavy consumption, and it represented a drain on the treasury. The government found itself in a ‘policy trap’.Footnote 16
The price hike implemented by the government of Cristina Fernández produced starkly divergent rates among residents of wealthy neighborhoods in the City of Buenos Aires. Prices rose by 500 per cent for some affluent households yet remained unchanged for other households in the same neighborhood. (Prices did not rise in any middle- or working-class areas of Buenos Aires or in other cities.) Households located across the street from one another in some instances faced vastly divergent utility rates.
The price hikes were large in magnitude, even for wealthy rate payers. Before the rate increase, utility payments absorbed 1.25 per cent of median monthly individual incomes in the areas where rates were later increased. After the hikes they absorbed more than 6 per cent. If one conceives of the increment to a person’s payments for public utilities as an additional tax, this would represent about a doubling of taxes paid on income by a typical person in our sample, from 6.6 per cent to 10.7 per cent.Footnote 17
The policy design reflected multiple, and sometimes conflicting, imperatives.Footnote 18 An international financial crisis and mounting domestic public spending placed fiscal pressures on the Argentine treasury, which therefore sought to boost revenues sharply. In turn, raising public utility rates on the wealthy was consonant with the government’s redistributive goals.Footnote 19 And the targeted areas were, indeed, wealthy. The household incomes of people in our samples, whether their rates rose or remained unchanged, placed them in the top 5 per cent of Argentine households.Footnote 20 But at the same time the government was anxious to avoid an upsurge in inflation. Raising rates in some wealthy areas but not others was a way to dampen the inflationary effects of the price hikes.
Why did the government use geographic targeting criteria rather than, say, energy consumption or household income? The government’s choices reflect considerations of efficiency and administrative capacity. In interviews, government officials reported having considered targeting households by income or consumption. But ultimately the staff did not trust the accuracy of its household-level data on income, and believed consumption to be an unreliable indicator of social class. Therefore the blunt instrument of geography emerged as a reasonable and quick option.
RESEARCH DESIGN
The government announced the price increases in November 2011, and raised rates for different utilities at distinct moments, beginning in March 2012. By September 2012, it had increased rates in all of the targeted areas. Our telephone survey was carried out in October and November.
The Quasi Experiment
Crucial to our research strategy is that the price hikes were assigned in a manner that was as-if random, so that those who saw their rates spike were no different, on average, than those whose rates remained unchanged. Assignment to the price hikes would not have been as-if random if political operatives had been able to choose whose rates would rise and whose would not. But the government lacked the motivation and capacity to select the targeted areas based on political loyalties. Clientelistic party machines, which trade favors for votes, are widespread in other parts of the country but absent in the wealthy areas exposed to the price hike.Footnote 21 Even if the government attempted to assign the price hike to households based on past vote choice, the way in which voters are assigned to voting stations prevented it from doing it precisely enough to match the individuals in the vicinity of the borders covered by our sampling frame.
We went to additional lengths to maximize the similarity of our subjects across conditions. Our sample included people who did and who did not experience the price hike living within a three-block radius. We used nearest-neighbor matching applied to census tract data to select similar treatment and control areas from which to sample (Figure 1 shows sampled census tracts). Balance tests suggest that as-if random assignment to the price hike is plausible. Individuals in the treatment and control groups are statistically indistinguishable along a host of observables.Footnote 22
Control and treated census tracts for the final sample

The Survey Experiment
A key feature of our research design was a survey of people residing on both sides of the policy border. We drew a sample of approximately 500 people from the population on each side of the policy border, for a total sample size of 1,005 heads of household.
The interviews included survey experiments that probed the sensitivity of respondents’ preferences for redistribution to interpersonal comparisons. We take advantage of individuals’ limited knowledge about how widespread the increases were in their neighborhood to frame reactions to the policy.Footnote 23 The survey experiment entailed randomly assigning respondents on each side of the policy border to one of four treatment groups:Footnote 24
∙ The intra-class inequality treatment made salient interpersonal comparisons between wealthy peers. The wording depended on whether the individual’s rates had risen or remained unchanged.
∙ The cross-class inequality treatment made salient its potential for redistribution from the wealthy to the poor, emphasizing the altruistic dimensions of the policy. This question, like the placebo, is the same for those who experienced and those who avoided the price hike.
∙ The placebo treatment group heard a neutral description of the policy.
∙ The control group received no framing of the policy and was not asked for an opinion about it. This group allows a clean test of the pocketbook effect of the price hike on attitudes towards redistribution that is not contaminated by priming the policy.
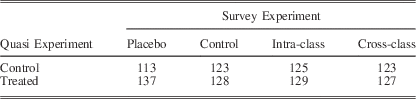
∙ The combination of the four groups in our survey experiments with the exposure or non exposure to the price hike produces eight experimental groups of roughly 125 individuals (Table 3).
Number of Observations per Experimental Group

ANALYSIS
Empirical Strategy
We examine several outcomes that gauge preferences for redistribution. One outcome of interest was support for the price adjustment policy. After the introductory framings just discussed, we asked respondents, ‘How would you characterize the government’s decision? Would you say it was very good, good, neither good nor bad, bad, or very bad?’ Also of interest are spillover effects: any impact the price shock, and framings of it, might have on attitudes towards redistribution and unemployment insurance.Footnote 25
Our core estimation strategy is instrumental variables (IV) regression.Footnote 26 This approach allows us to consistently estimate the causal effect of the policy in the presence of some non-compliance with treatment assignment.Footnote 27 It means that our estimate of any pocketbook effect of the price hike on preferences is a local average treatment effect (LATE).Footnote 28 The instrument is measured only by location, defined by whether the respondent’s home is on one side or the other of the policy border. Given the absence of public records, we measured treatment receipt with a survey question that asked whether the respondent had experienced the price hike.Footnote 29
In addition, our interest in the joint influence of rate increases and framings focuses our attention on conditional average treatment effects. Thus we estimated separate IV regressions of each outcome on the following independent variables: (1) exposure to the price hike instrumented by a binary indicator of treatment assignment, (2) a binary indicator of survey experimental condition, and (3) the interaction of these two variables. We obtained the standard errors using the Huber-White estimator. To ease interpretation, we have rescaled all ordinal dependent variables to have a mean of zero and a standard deviation of one.
Testing Hypothesis 1: Pocketbook Effects
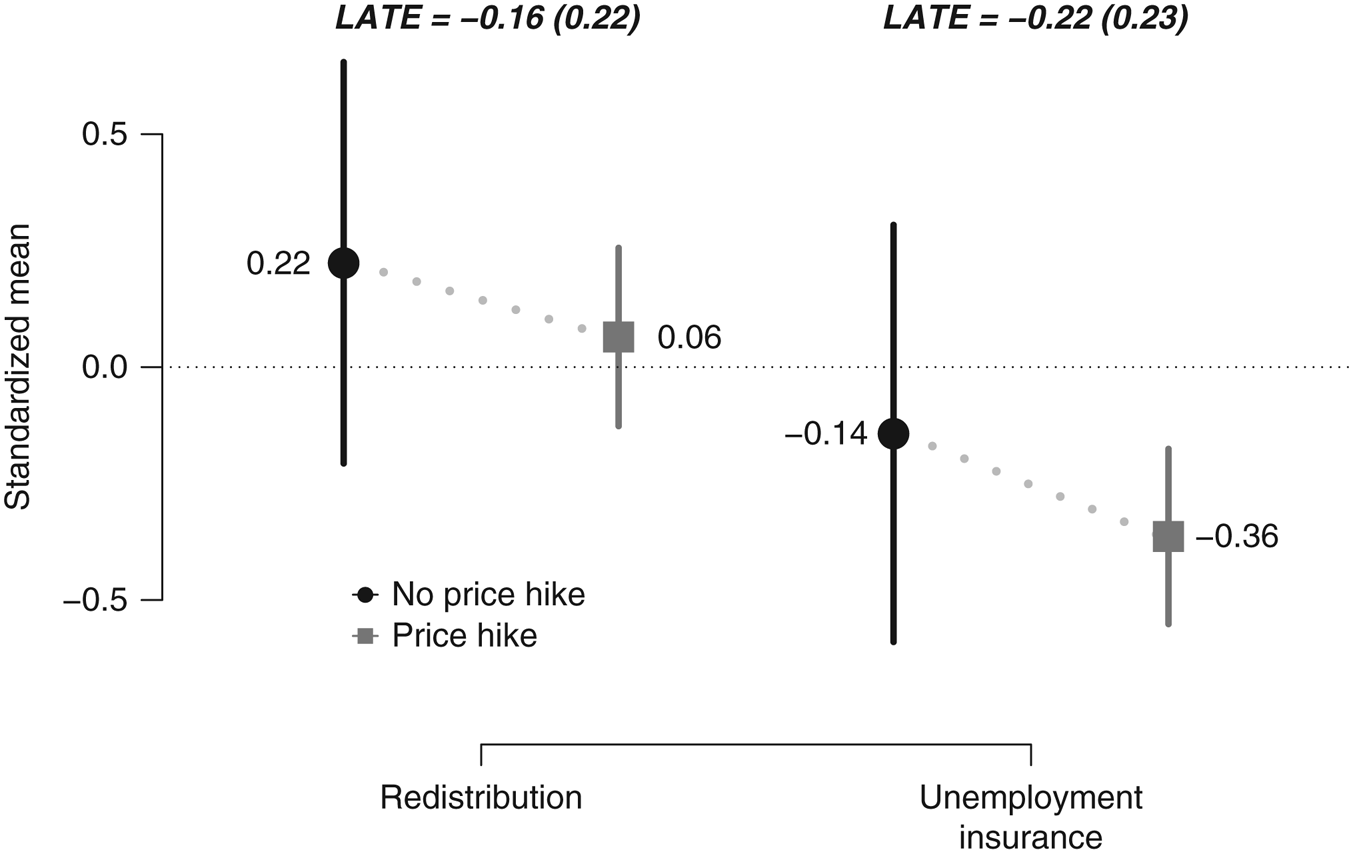
We first estimate the pocketbook effect: did wealthy people who have just endured a sharp utility rate increase display heightened opposition to redistribution? For this test we focus on respondents who were assigned to the control group in the survey experiment, and compare their attitudes conditional on exposure to the price hike. Results from IV tests of the pocketbook hypothesis are reported in Figure 2. The evidence in its favor is scant. Support for redistribution and unemployment insurance were very similar between the rate-hike and rate-stable groups.Footnote 30 None of the differences in mean levels of support is significantly different from zero. There was therefore little evidence of pocketbook considerations.
Testing Hypothesis 1: Pocketbook Effects Note: support for redistribution and unemployment insurance by exposure to price hike among respondents in the control group. Numbers in bold are local average treatment effects (LATEs) with robust standard errors in parentheses. Black dots (no price hike) and dark gray squares (price hike) represent the mean standardized level of each outcome by treatment group; vertical segments are 95 per cent confidence intervals. ***p<0.01, **p<0.05, *p<0.1

Testing Hypothesis 2: Resentment
What happens when subjects whose rates rose are reminded that other affluent households escaped it? The question points to the most salient and robust finding of our study: the fragility of support for redistribution in the face of invidious comparisons among the wealthy. Figure 3 compares levels of support for redistribution among people whose utility rates rose, depending on whether they were exposed to the intra-class inequity or the placebo treatment. Support for the price adjustment policy, redistribution and unemployment insurance all slipped sharply when people whose rates rose were reminded that they had been singled out whereas their neighbors were left alone.
Testing Hypothesis 2: Resentment Note: support for the policy, redistribution and unemployment insurance among subjects exposed to the price hike, comparing intraclass inequality with placebo. Numbers in bold are conditional average treatment effects (CATEs) with robust standard errors in parentheses. Dark gray squares (intraclass inequality) and black dots (placebo) represent means; vertical segments are 95 per cent confidence intervals. ***p<0.01, **p<0.05, *p<0.1

The evidence therefore suggests a strong predisposition among the wealthy toward disadvantageous inequality aversion – that is, resentment. The price increase did not in itself turn large numbers against redistribution. But when those who endured the price shock were reminded that their losses were not shared by others of their economic stratum, their views of redistribution soured.
Testing Hypothesis 3: Empathy
How did people whose rates remained unchanged respond to the intra-class inequity framing? If they also evinced low levels of support, the inference would be that they experienced empathy (advantageous inequity aversion) vis-à-vis their peers. But this group evinces nothing like the across-the-board collapse of support for redistribution on display among people in the intra-class inequity framing whose rates rose. We do see a drop in support for the price hike policy itself when those with stable rates were reminded of the price hike (Figure 4). But this drop in support does not spill over onto broader attitudes towards redistribution. The asymmetrical reaction among people who did and did not experience the price hike suggests that, while there may be a norm of fairness in play – that ‘similarly situated individuals should get the same fiscal treatment’ – it is less potent than the invidious comparisons on display in Figure 3.
Testing Hypothesis 3: Empathy Note: support for the policy, redistribution and unemployment insurance among subjects not exposed to the price hike, comparing intra-class inequality with placebo. Numbers in bold are CATEs with robust standard errors in parentheses Dark gray squares (intraclass inequality) and black dots (placebo) represent means; vertical segments are 95 per cent confidence intervals. ***p<0.01, **p<0.05, *p<0.1

Testing Hypothesis 4: Altruism
Did our samples evince support for the price hike policy and redistribution when reminded that the state’s intervention reduced the gap between the wealthy and the poor? The altruism (cross-class inequality) framing had a modest effect on people’s support for the price adjustment policy. In comparison with the placebo group, average levels of support were higher in the cross-class treatment group, by a modest one-fifth of a standard deviation (Figure 5). Beyond views of the policy, however, the cross-class treatment caused scarcely a ripple in our samples’ opinions of state-led redistribution. Thus Hypothesis 4 receives little support. A general lesson from our study, then, is that appeals to altruism and cross-class empathy left our affluent samples relatively unmoved. The power of these appeals paled compared to feelings of resentment.
Testing Hypothesis 4: altruism Note: support for the policy, redistribution and unemployment insurance by exposure to cross-class inequality treatment or a placebo, pooling across price-hike and price-stable groups. Numbers across the top are the ATE of the cross-class inequality treatment compared to the placebo; robust standard errors of the ATE are in parenthesis). Black dots (placebo) and dark gray squares (cross-class treatment) represent means; vertical segments are 95 per cent confidence intervals. ***p<0.01, **p<0.05, *p<0.1

RIVAL INTERPRETATIONS
Here we take up several possible objections and alternative interpretations of the findings.
Frame Strength
One possible concern is that the intra-class inequity aversion framing was inherently stronger than the other frames.Footnote 31 If so, our main finding of widespread resentment driving down support for redistribution would merely be an artifact of a particularly powerful frame. Yet if this were the case, we would expect this frame to have uniformly powerful impacts across our subjects. But the intra-class treatment had little impact on respondents who escaped the price hike. Thus it seems unlikely that the intra-class resentment finding was an artifact of a strong frame.
Might frame weakness explain the very modest impact of the altruism treatment? Perhaps wealthy residents of Buenos Aires, many of them staunch opponents of the Peronist government, had altruistic predispositions but were disinclined to believe that the government was capable of achieving redistributive results. With this problem in mind, we worded the cross-class treatment in a way that attributed the claim that the policy achieved redistributive goals to neutral experts, rather than to the government. In addition, we examine an empirical prediction from the ‘weak frame’ interpretation. In the framing literature, the strength of a frame is associated with its persuasiveness. Thus a weak frame should influence individuals whose ideological priors are aligned with its message but leave the ideologically distant unmoved.Footnote 32 We therefore explored whether the altruism frame elicited polarized reactions among respondents, depending on their prior ideological leanings measured by vote choice. We find no such polarization.Footnote 33
Compound Treatment
Another question has to do with the exact nature of the price hike ‘treatment’. While we used the government’s unusual rollout to study the impact of fiscal shocks on attitudes, perhaps the uneven rollout was itself the most salient treatment, rather than lost income. This possibility would have been of greater concern had we found that the price shock per se had generated opposition to the policy. But this is not what we found. Neither income losses nor the rollout of the program turned people against it; their reactions relied on framings that made interpersonal comparisons salient.
Elite Framing
The politicization of the price hike could contaminate our results if our treatments made respondents more sensitive to elite messages. We believe this alternative explanation is implausible for two reasons. The first reason is that the nature of elite discourse would have led to quite different results. Rather than questioning the government’s expressed progressive goals, the opposition criticized the government for portraying an effort to raise revenue as a progressive income policy. Government elites, in turn, stressed the social benefits of redistributing income and generating revenue for social programs. The second reason is empirical. If elite discourse drove the results, left-leaning individuals, who might have taken their cues from the government, should not exhibit the patterns of resentment that we observe. But they did.Footnote 34 Further analyses show that the force of resentment was so strong that it eroded support even among a minority of respondents who were leftist government sympathizers.Footnote 35 Thus the influence of elite discourse is unlikely to have lain behind the response of our samples to the intra-class treatment.
ELITE RESENTMENT AND THE FRAGILITY OF SUPPORT FOR REDISTRIBUTION
The Argentine Government’s unevenly imposed fiscal shock opened a window into the political-economic views of affluent citizens of a middle-income developing country. We find that wealthy people’s reactions to redistributive measures had little to do with the measure’s pocketbook effects, even when it amounted to a fivefold increase in their public utility bill. People who endured the price shock were not more opposed to it, nor to other forms of state intervention, than were their similarly situated peers who escaped the shock. Instead of pocketbook reactions, the clearest driver of opinion was resentment: an allergy to the idea that one had suffered while one’s peers had not. The reaction was self- (not other-) oriented. We found few signs of intra-class empathy among those whose rates remained unchanged.
Our study sheds light on the origins of preferences for redistribution, a debated topic among social scientists. Our strong research design allows us to overcome some of the pitfalls of conventional regression analyses and offer causal evidence on the preferences of individuals when they are exposed to a redistributive policy. This allows us to show that the resentful ‘keeping up with the Joneses’ mentality identified in laboratory experiments might be a powerful force shaping attitudes towards redistribution in the real world.
Our study has important implications for research on the political economy of redistribution. We contribute to comparative research concerning the political conditions under which redistributive policies are viable. If one were to set about building support for redistribution, a lesson from our study is not to write the wealthy off from the outset. The loss of post-fisc income did not in itself mobilize opposition among the wealthy. And responses to questions in our survey about subjects’ past voting behavior indicate that about a quarter of the sample came into the study probably supporting some redistribution.Footnote 36 For the majority of the sample that needed more persuading, the key strategic lesson is to steer clear of policies that might leave them feeling relatively ill treated compared to their affluent peers. Any inkling of differential treatment aroused powerful antipathy, even among the minority of left-leaners.
Are these strategic lessons useful beyond Argentina, and beyond the kind of policies we study? One distinctive feature of the Argentine experience is the government’s decision to impose a price shock in a starkly inequitable manner. But concerns about inequities in the incidence of burdens are hardly unique to the Argentine case. Tax codes, for instance, feature discontinuous rate structures and invite the exploitation of loopholes, not to mention partial compliance or evasion.Footnote 37 And there is evidence from both advanced and developing economies suggesting that perceived inequities in tax systems affect citizens’ incentives to pay taxes.Footnote 38 For these reasons, the implications of our study are likely to be relevant to a broader range of countries.
Another particularity of the Argentine experience is that the redistributive policy involved a hike in public prices and not a change in the tax structure. But the conceptualization in political-economic models of taxation and redistribution, a la Meltzer and Richard, envision a flat tax. We cannot know whether a tax hike with arbitrary discontinuities would have yielded similar results. But it is important to underscore that consumer subsidies play a central role in redistribution in the developing world.Footnote 39 They represent a sizable share of the public budget and have substantial pocketbook implications, which are often to transfer income from the poor to the middle and upper classes. Given the salience of subsidies in the politics of redistribution, it is reasonable to use them as a window into the formation of preferences among the wealthy.