

Introduction
Mental health disorders are among the leading contributors to the global burden of disease, yet substantial inequalities persist both within and across countries. Understanding the social determinants of mental health has therefore become a major policy priority. Education is widely regarded as one of the most important of these determinants because it shapes employment opportunities, income, health literacy and access to essential resources. Despite its central role, however, there remains considerable uncertainty regarding whether education consistently protects against poor mental health, particularly across countries at different stages of economic development. Mental health statistics reveal significant global disparities between high-income countries (HICs) and low- and middle-income countries (LMICs), reflecting deep-seated differences in healthcare infrastructure and social determinants. For example, in HICs, the average lifetime rate of experiencing a depressive disorder of some kind is approximately 15%, compared to 11% in LMICs (Heim et al., Reference Heim, Wegmann and Maercker2017). The disparity in reported figures between HICs and LMICs may be partly explained by a ‘treatment gap’ for mental health disorders where service coverage ranges between 31–35% in HICs, compared to only 4–13% in LMICs (Jaeschke et al., Reference Jaeschke, Hanna, Ali, Chowdhary, Dua and Charlson2021)
Education is widely recognised as an important social determinant of mental health. According to the Social Determinants of Health (SDH) framework (Solar & Irwin, Reference Solar and Irwin2010), education shapes access to different resources, which are considered to be key determinants of mental wellbeing such as income security, food security and healthcare. It also enhances health literacy and cognitive skills, enabling individuals to process information and adopt healthier behaviours (Baranowska-Rataj & Strandh, Reference Baranowska-Rataj and Strandh2021; Kenkel, Reference Kenkel1991). From a public wellbeing perspective, education also supports social participation and engagement in meaningful activity, conditions that reduce chronic stress and promote psychological wellbeing (Fisher, Reference Fisher2022). Beyond these psychosocial benefits, higher educational attainment is typically associated with more stable employment and improved earnings, potentially reducing the psychological distress linked to poverty and labour-market precarity (Marcus, Reference Marcus2013; Schiele & Schmitz, Reference Schiele and Schmitz2016). At the same time, education may introduce new stressors. In competitive labour markets, highly educated individuals may experience unmet expectations or underemployment, contributing to frustration, anxiety, depression and generally lower levels of satisfaction in life (Bracke et al., Reference Bracke, Pattyn and Von dem Knesebeck2013; Bracke et al., Reference Bracke, van de Straat and Missinne2014; Dudal & Bracke, Reference Dudal and Bracke2019; Piper, Reference Piper2015). Rising educational costs and student debt burdens have also been linked to poorer mental health outcomes among young adults (Qian & Fan, Reference Qian and Fan2023). Given these competing mechanisms, the net association between education and mental health remains theoretically ambiguous and likely depends on the broader socioeconomic context. Empirically, the literature reflects this ambiguity. Some studies identify the protective effects of education (Schneeweis et al., Reference Schneeweis, Skirbekk and Winter-Ebmer2014), while others report null or even negative associations (Avendano et al., Reference Avendano, De Coulon and Nafilyan2020).
The contradictions within the current literature are largely driven by three key factors: measurement heterogeneity, contextual variation, and analytical divergence. Systematic reviews show that mental health outcomes differ substantially depending on whether mental health is assessed through clinical diagnoses, symptom-based scales or subjective wellbeing measures, leading to difficulty comparing findings (King & Fazel, Reference King and Fazel2021). Moreover, mental health outcomes vary across populations because they are shaped by broader social, economic and institutional structures, including inequalities in education and income (Compton & Shim, Reference Compton and Shim2015). This complexity is particularly evident in cross-national comparisons, as most mental health research has historically neglected LMICs, where the drivers of psychological distress differ fundamentally from those in high-income settings (Zhang et al., Reference Zhang and Mori2025). These discrepancies underscore the importance of using harmonised, cross-national data to reduce measurement noise and reconcile inconsistent findings. They also highlight the need to account for broader economic contexts when analysing the education–mental health nexus. By applying a consistent analytical strategy across diverse settings, this study aims to integrate and clarify these divergent strands of the literature. This paper addresses these limitations by providing one of the largest harmonised cross-national analyses of the education–mental health relationship to date. Using individual-level data from over 120,000 respondents across 121 countries, we examine whether the association between education and mental health differs systematically between HICs and LMICs. In doing so, we move beyond the predominantly single-country literature and provide evidence on how the mental health returns to education depend upon socioeconomic context.
Methodologically, we utilise rich individual-level data from over 120,000 participants across forty-two HICs and seventy-nine LMICs to study the impact of education on mental health. We also ‘open the black box’ by examining the effect of education on different essential material and intermediary determinants, including financial security, food security and access to clean water and medical services. Our findings indicate that while education reduces mental health issues across the global sample, the effect is only statistically significant within LMICs, providing strong empirical support for a social causation pathway. In these contexts, education operates as a critical structural gatekeeper to the resources necessary to buffer against the chronic stressors of poverty. Conversely, in HICs, where such material resources are largely decoupled from educational status due to stronger social safety nets, this ‘material-effect’ is attenuated. These results are robust to the use of Lewbel’s (Reference Lewbel2012) instrumental variable approach to address potential endogeneity. Ultimately, our study suggests that mental health policy must be tailored to socioeconomic context: LMICs should prioritise education as a public health tool, while HICs may need to focus on interventions addressing the unique stressors faced by highly educated populations.
The paper is structured as follows: immediately following the introduction is a review of relevant literature in this area. The next section summarises the data set used within our analysis, including definitions of the variables used, where necessary details of how variables were constructed/calculated, and the presentation of summary and descriptive statistics. Following this is a discussion of the methodology, detailing the methods utilised in our empirical analysis. An empirical results section provides an econometric overview of our estimates, followed by a final discussion and concluding section that addresses the implications of our findings, limitations of our analysis and directions for future research.
Literature review
While less substantial in volume than research estimating the effects of education on physical health, the literature examining the effects of education on mental health appears to be inconsistent with respect to the direction and significance of the aforementioned relationship. Utilising UK data, Chevalier and Feinstein (Reference Chevalier and Feinstein2006) find that an increase in education reduces the likelihood of depression. It should be noted, though, that the effects of an increase in education are not equal across different income brackets and levels of education. The most substantial effects observed were with those holding low and medium levels of education and among older people. In analysing the effects of changes in compulsory education legislation in the UK, Banks and Mazzonna (Reference Banks and Mazzonna2012) find that the change in legislation brought about improved long-term cognitive planning skills in over fifties. Schneeweis et al. (Reference Schneeweis, Skirbekk and Winter-Ebmer2014) and Crespo et al. (Reference Crespo, López-Noval and Mira2014) examine changes in compulsory schooling throughout the EU. Using data from the EU Survey of Health, Aging and Retirement, and compulsory schooling laws in Austria, Czech Republic, Denmark, France, Germany and Italy, Schneeweis et al. (Reference Schneeweis, Skirbekk and Winter-Ebmer2014) identify the positive effects of education in the form of improved memory function, once again in the population aged fifty and over. Utilising the same data set, Crespo et al. (Reference Crespo, López-Noval and Mira2014) quantifies the effect of education on depression, finding that an additional year of education decreases the risk of depression by 6.5 per cent.
While the majority of the research in this area utilises data from developed countries, Lund et al. (Reference Lund, Breen, Flisher, Kakuma, Corrigall, Joska and Patel2010) investigate the effects of education on mental health in low- and middle-income countries. Their systematic review of the literature in this area found that approximately 80 per cent of studies support a negative association between poverty indicators and mental health, where education was identified as having a strong effect, which causes a decrease in the prevalence of common mental disorders.
A perspective that can be used to understand the positive impact of education on mental health may be found within the Social Determinants of Health (SDH) framework. Within the SDH framework, education is understood as a structural resource shaping exposure to material and psychosocial conditions, such as income, employment security, housing quality and access to healthcare, rather than exerting a direct causal influence on mental health itself (Solar & Irwin, Reference Solar and Irwin2010). This view aligns with fundamental cause theory, which emphasises that education grants differential access to flexible resources that protect mental wellbeing across varying contexts (Adler & Ostrove, Reference Adler and Ostrove1999; Link & Phelan, Reference Link and Phelan1995). Extensive evidence demonstrates that poverty, precarious employment, indebtedness and poor housing environments elevate chronic stress and increase risk for common mental disorders (Lund et al., Reference Lund, De Silva, Plagerson, Cooper, Chisholm, Das and Patel2011; Marmot, Reference Marmot2005). Research in social policy further shows that structural arrangements, such as welfare regimes, labour market institutions and local service provision, play a decisive role in shaping the magnitude of health inequalities. For example, welfare state analyses indicate that political and economic contexts influence how effectively social protections mitigate health gradients (Bambra, Reference Bambra2011). Related work demonstrates that regional differences in worklessness can significantly attenuate or amplify educational gradients in health, highlighting how employment conditions mediate the link between education and mental wellbeing (Bambra & Popham, Reference Bambra and Popham2010). In addition, local comparative studies show that progress in reducing health inequalities often hinges on the interaction between targeted interventions and contextual features such as population stability and service quality (Blackman & Dunstan, Reference Blackman and Dunstan2010). Together, these findings reinforce that any change in the education–mental health association is best explained by shifts in the broader social and policy environment rather than by education alone.
Perhaps running counter to expectations is the volume of literature that finds either an insignificant or occasionally negative effect of education on mental health. Avendano et al. (Reference Avendano, De Coulon and Nafilyan2020) analysed the effects of changes to compulsory schooling legislation in the UK in 1972, finding that the legislation failed to improve mental health. This is in part attributed to the population of young people who, due to a combination of ability and preference, are unlikely to benefit from an additional year of education. The returns they experience are comparatively smaller relative to the potential gains from entering the labour market earlier. Entrapping individuals in a competitive academic environment where they have no desire to be, and in which they are unlikely to succeed, imposes a detrimental emotional and psychological cost. Courtin et al. (Reference Courtin, Nafilyan, Glymour, Goldberg, Berr, Berkman, Zins and Avendano2019) find equivalent results with respect to compulsory schooling legislation changes in France, where increasing compulsory schooling by two years increased mental health issues, particularly among women. While one might assume that education confers a positive effect on health through the mitigation of the stress associated with unemployment, the empirical findings reveal a more nuanced perspective. French and McKillop (Reference French and McKillop2017), in their examination of the effects of debt and financial stress on health, find that education has little effect on health, except in instances where the qualification attained is work-related.
While the majority of the literature again focuses on developed countries, Das et al. (Reference Das, Do, Friedman and McKenzie2009) examine the prevalence of mental health in five developing countries. Using nationally representative surveys collected between 2001 and 2005 in Bosnia, Indonesia, Mexico, India and Tonga, they find little observed relationship between mental health and either consumption, poverty or education. Sudden shocks such as illness or a form of crisis within one’s life are more likely to impact an individual’s mental health. Addae and Kuhner (Reference Addae and Kühner2022) examine the interplay between happiness, education and health in Ghana. Those with more education were shown to be less happy, while those with overall better health reported higher levels of happiness. Such findings are also a function of additional factors beyond one’s education, including socioeconomic status and social capital, thereby highlighting that education alone may not always suffice to provide an improvement in health.
A consistency in research finding an insignificant or negative association between education and mental health involves an extension in the methodology beyond simple Ordinary Least Squares (OLS). This point is raised specifically by Dahmann and Schnitzlein (Reference Dahmann and Schnitzlein2019) when estimating the effects of compulsory schooling in West Germany. While OLS estimates support the positive effect of education on mental health, use of an instrumental variable (IV) technique indicates no causal effects with respect to the ability of education to protect against mental health issues, and that a negative effect cannot be ruled out. Within other research, the use of an IV approach has produced similar findings. Johansson et al. (Reference Johansson, Böckerman, Martelin, Pirkola and Poikolainen2009) find no causal effect for years of education on mental health in Finland, using parental education as an instrument. Viinikainen et al. (Reference Viinikainen, Bryson, Böckerman, Elovainio, Pitkänen, Pulkki-Råback, Lehtimäki, Raitakari and Pehkonen2018) use genetic information as an instrument and similarly find no causal effect on education and on the improvement of depressive symptoms. Kamhofer et al. (Reference Kamhöfer, Schmitz and Westphal2019), using university availability as an instrument, find no effect of university education on improving the mental health score of German adult respondents.
It is evident from the review of the literature that the findings regarding the relationship between education and mental health are inconsistent, varying significantly based on methods employed, and the degree of development within the country. It is therefore necessary that further analysis be employed to shed greater light on the direction and the extent of the effect between these two variables, with the added consideration of the country’s level of income, in an attempt to control for the different effects that socioeconomic status might have on this relationship.
Data and methodology
We collected data from The Lloyd’s Register Foundation World Risk Poll for 121 countries (forty-two high-income and seventy-nine low- and middle-income) in 2021.Footnote 1 The analysis is based exclusively on publicly available, anonymised secondary data from the Lloyd’s Register Foundation World Risk Poll. The authors neither recruited participants nor collected primary data, and no personally identifiable information was accessed. Consequently, the research presents minimal ethical risk, with ethical responsibilities limited to the appropriate use, analysis and reporting of the anonymised data.
The dataset includes questions about the experience of serious mental health issues in the past two years. Participants have four response options (personally experienced, know someone who has experienced, both, no). We use this question to construct our mental health variable. Our variable equals 1 if a participant experienced a personal mental health issue (i.e. they answer personally experienced or both) and 0 if they did not experience a personal mental health issue (they answer either know someone who has experienced or no). Importantly, several studies discuss the issues associated with self-reported mental health data, such as non-optimal response styles, including over- or under-reporting and the problem of cross-cultural bias (Cheon & Chiao, Reference Cheon and Chiao2012; Fekih-Romdhane et al., Reference Fekih-Romdhane, Jahrami, Stambouli, Alhuwailah, Helmy, Shuwiekh, Lemine, Radwan, Saquib, Saquib and Fawaz2023; Krendl & Pescosolido, Reference Krendl and Pescosolido2020). This bias arises when measures of mental disorders are developed and primarily validated in high-income Western populations, assuming a Western understanding of mental disorders and symptoms (see Sunderland et al., Reference Sunderland, Batterham, Calear and Carragher2019). However, an extensive body of literature demonstrates the role of large sample sizes in enhancing the generalisability of findings across different populations and demographics, as well as in minimising the influence of outliers and extreme responses. This can lead to more accurate self-reported data, as the average responses from a larger group better reflect the broader population. For example, Haroz et al. (Reference Haroz, Ritchey, Bass, Kohrt, Augustinavicius and Bolton2017) conducted a systematic review of qualitative literature on mental health issues, highlighting the role of larger sample sizes in capturing diverse cultural expressions of depression and reducing biases associated with self-reported measures. Additionally, Baldwin and Hoffmann (Reference Baldwin and Hoffmann2002) and Kuntsche and Kuntsche (Reference Kuntsche and Kuntsche2009) illustrate how larger samples help minimise extreme values and outliers, reducing measurement errors in self-reported data. Finally, several studies show that a large sample size increases the likelihood that results are not biased by cultural misunderstandings or differences in interpreting survey items, allowing researchers to control for these differences and ensure that findings are more generalisable across cultural contexts (see, for example, Chen, Reference Chen2008; Cheung & Rensvold, Reference Cheung and Rensvold2000; Van de Vijver & Leung, Reference Van de Vijver and Leung1997). Be that as it may, beyond the large sample size used for our analysis, we cannot control for the differences in the reporting of mental health issues based on cross-cultural differences. Therefore, our analysis must be interpreted with the understanding that the results reflect persistent differences in a willingness to acknowledge and address mental health issues across different countries.
The education variable captures three different levels of education (primary, secondary and tertiary). This variable is measured using the harmonised classification provided by the Lloyd’s Register Foundation World Risk Poll. Although countries maintain their own education systems and qualification structures, all education responses in the survey are recoded into three comparable categories for global analysis: primary (0–8 years), secondary (9–15 years) and tertiary (16 or more years). These categories are defined functionally, where primary corresponds to completing up to lower secondary education; secondary includes completion of secondary, or some post-secondary education short of a bachelor’s degree; and tertiary corresponds approximately to the completion of a four-year university degree. The World Risk Poll documentation emphasises that precise institutional definitions vary across countries, but the harmonised framework ensures comparability in cross-national research.
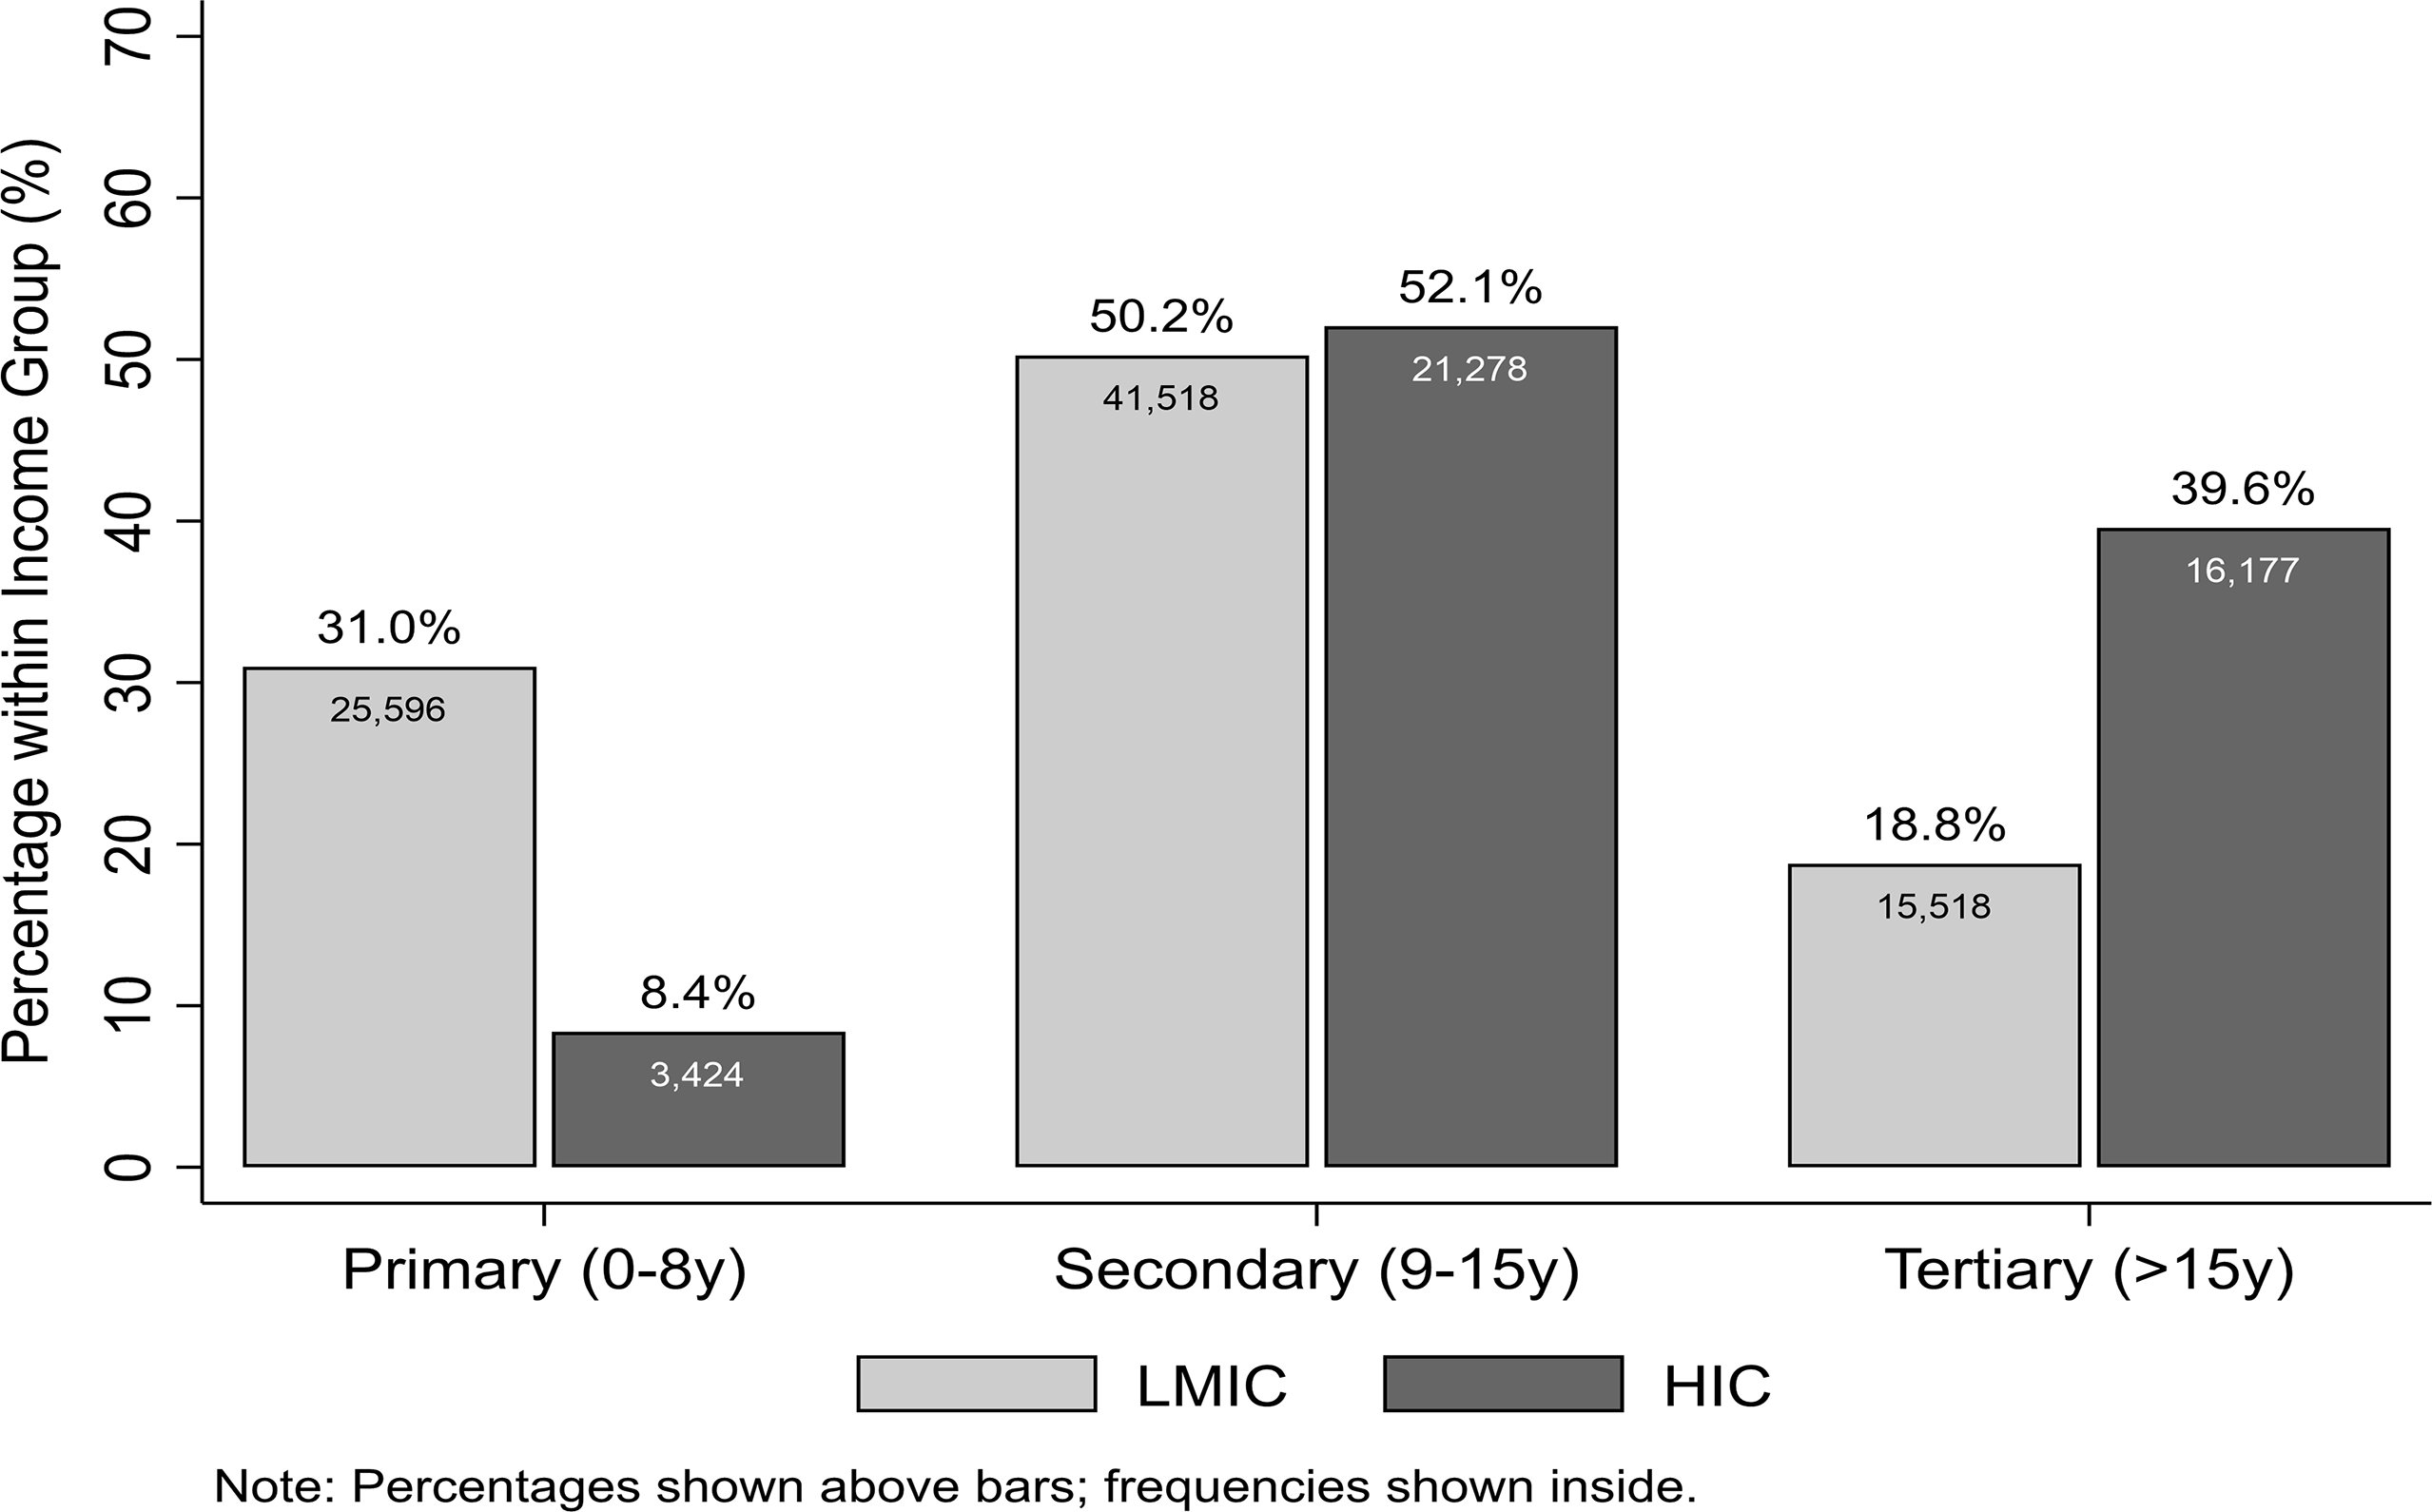
Figure 1 illustrates the distribution of educational attainment across the sample, stratified by country income level. A clear divergence in educational structures is evident: in LMICs, nearly one-third of the population (31.0 per cent, n = 25,596) attain only primary education, compared to only 8.4 per cent (n = 3,424) in HICs. Conversely, the share of individuals with tertiary education is more than double in HICs (39.6 per cent) relative to LMICs (18.8 per cent). These differences highlight the structural variation in educational attainment across development levels and motivate our use of broad, harmonised educational categories in the empirical analysis.
Education distribution HIC vs LMIC.

To help explain the education–mental health nexus, we examine the role of education in shaping several SDH for which data are available. In particular, we assess the impact of education on financial security, a key determinant of mental health outcomes such as anxiety and depression. Financial security is measured using responses to the Feelings About Household Income question. We construct a binary financial security indicator that equals 1 if respondents report living comfortably on present income or getting by on present income, and 0 if they report finding it difficult or finding it very difficult on present income. In addition, we analyse access to basic needs using the following survey questions: Happened for More Than a Day: Been Without Clean Drinking Water, Happened for More Than a Day: Been Without Food, and Happened for More Than a Day: Unable to Obtain Medical Help or Medicine. These variables are used to construct Water Safe, Food Safe and Medical Access indicators. Each indicator is coded as 1 if respondents answer No (i.e. they did not experience deprivation) and 0 if they answer Yes, ensuring that higher values consistently reflect better living conditions.
Table 1 presents summary statistics for the whole sample and the HIC and LMIC subsamples. The table shows that mental health and education are slightly different between these two subsamples. The average of gender (1; male and 2; female) is 1.512 and 1.536 for HIC and LMIC, respectively, which indicates that the sample is approximately balanced by gender. We can observe the same for Per Capita Income Quintiles, as the averages are around 3 (note that 1; Poorest 20%, 2; Second 20%, 3; Middle 20%, 4; Fourth 20% and 5; Richest 20%). The main difference between these two subsamples is age, with a mean age of 48.911 in HICs and 38.393 in LMICs. This reflects the higher life expectancy and better health conditions and services in the former. Finally, household size is larger in LMICs than in HICs. This variable has four values (1; 1–2 people, 2; 3–4 people; 3; 5–9 people and 4; 10 or more). Noticeably, Table 1 reveals substantial inequalities in key social determinants of health across contexts. Overall, around 64 per cent of respondents are classified as financially secure, but this average masks a stark divide between HICs and LMICs. In HICs, nearly 86 per cent of individuals report financial security, compared to just 53 per cent in LMICs. Similar disparities are evident for access to basic needs. While access to clean drinking water, food security and medical care is close to universal in HICs, at around 93 per cent for water and medical access and 97 per cent for food security, these figures drop markedly in LMICs, where only 60 per cent report reliable access to clean water, 77 per cent to sufficient food and 69 per cent to medical care. These differences are substantively important and suggest that, in LMICs, large shares of the population face persistent material deprivation in dimensions that are fundamental to both physical and mental health. In contrast, in HICs, essential living conditions are largely secured for most individuals. Thus, we evaluate the role of education in securing these basic needs, especially where they are not universally met. By doing so, we can test whether education plays a role in improving individuals’ ability to secure stable income and access to essential services, and thereby reduce exposure to daily stressors.
Summary statistics

Table 1. Long description
The table presents summary statistics for the whole sample and the HIC and LMIC subsamples. It includes observations, mean, standard deviation, minimum, and maximum values for variables such as mental issue, education, age, urbanicity, gender, per capita income quintiles, employment status, financial security, water safety, food safety, medical access, and household size. The table has 15 rows and 6 columns. Row 1: All, Mental issue, 123511, 0.076, 0.265, 0.000, 1.000. Row 2: All, Education, 123511, 2.022, 0.701, 1.000, 3.000. Row 3: All, Age, 123511, 41.874, 17.389, 15.000, 99.000. Row 4: All, Urbanicity, 123511, 1.453, 0.498, 1.000, 2.000. Row 5: All, Gender, 123511, 1.528, 0.499, 1.000, 2.000. Row 6: All, Per Capita income quintiles, 123511, 3.247, 1.413, 1.000, 5.000. Row 7: All, Employment status, 120096, 3.435, 2.135, 1.000, 6.000. Row 8: All, Financial security, 121784, 0.637, 0.481, 0.000, 1.000. Row 9: All, Water safe, 122794, 0.711, 0.454, 0.000, 1.000. Row 10: All, Food safe, 123029, 0.838, 0.368, 0.000, 1.000. Row 11: All, Medical access, 122530, 0.769, 0.422, 0.000, 1.000. Row 12: All, Household size, 123511, 2.004, 0.872, 1.000, 4.000. Row 13: HIC, Mental issue, 40879, 0.080, 0.271, 0.000, 1.000. Row 14: HIC, Education, 40879, 2.312, 0.618, 1.000, 3.000. Row 15: HIC, Age, 40879, 48.911, 17.795, 15.000, 99.000. Row 16: HIC, Urbanicity, 40879, 1.551, 0.497, 1.000, 2.000. Row 17: HIC, Gender, 40879, 1.512, 0.500, 1.000, 2.000. Row 18: HIC, Per capita income quintiles, 40879, 3.234, 1.394, 1.000, 5.000. Row 19: HIC, Employment status, 40879, 3.182, 2.254, 1.000, 6.000. Row 20: HIC, Financial security, 40646, 0.857, 0.350, 0.000, 1.000. Row 21: HIC, Water safe, 40673, 0.930, 0.255, 0.000, 1.000. Row 22: HIC, Food safe, 40806, 0.972, 0.164, 0.000, 1.000. Row 23: HIC, Medical access, 40649, 0.930, 0.256, 0.000, 1.000. Row 24: HIC, Household size, 40879, 1.609, 0.723, 1.000, 4.000. Row 25: LMIC, Mental issue, 82632, 0.074, 0.262, 0.000, 1.000. Row 26: LMIC, Education, 82632, 1.878, 0.695, 1.000, 3.000. Row 27: LMIC, Age, 82632, 38.393, 16.084, 15.000, 99.000. Row 28: LMIC, Urbanicity, 82632, 1.404, 0.491, 1.000, 2.000. Row 29: LMIC, Gender, 82632, 1.536, 0.499, 1.000, 2.000. Row 30: LMIC, Per capita income quintiles, 82632, 3.254, 1.422, 1.000, 5.000. Row 31: LMIC, Employment status, 79217, 3.566, 2.060, 1.000, 6.000. Row 32: LMIC, Financial security, 81138, 0.526, 0.499, 0.000, 1.000. Row 33: LMIC, Water safe, 82121, 0.602, 0.490, 0.000, 1.000. Row 34: LMIC, Food safe, 82223, 0.772, 0.420, 0.000, 1.000. Row 35: LMIC, Medical access, 81881, 0.689, 0.463, 0.000, 1.000. Row 36: LMIC, Household size, 82632, 2.199, 0.873, 1.000, 4.000.
To assess the impact of education on mental health, we estimate the following model:
 $M{H_{ij}} = \alpha + {\beta _\;}Educatio{n_{ij}} + {\gamma _\;}{X_{ij}} + {\mu _j} + {\varepsilon _{ij}}$
where MH is the mental health status of participant i in country j, Education is the measure of education level, and X is a set of control variables, which includes income group, employment status, gender, age and urbanicity. These variables are commonly used in the literature (e.g. Dahmann & Schnitzlein, Reference Dahmann and Schnitzlein2019; Avendano et al., Reference Avendano, De Coulon and Nafilyan2020). μ is country effect, which allows us to control for national time-invariant factors that affect mental health, such as culture, legislation and geographical location. ϵ is the residual. To examine whether our findings hold across different economic contexts, we estimate the model for all countries as well as separately for LMIC and HIC groups. We use OLS and adjust the standard errors to ensure they remain reliable even when the variability of data differs across countries, a condition known as heteroscedasticity, by clustering at the country level. We also estimate the model using Logit regression. We expect β is negative and statistically significant for LMIC and insignificant for HIC.
We address endogeneity concerns by utilising the Lewbel (Reference Lewbel2012) two-stage least squares estimator (Lewbel 2SLS). The Lewbel 2SLS is an external instrument-free estimator that generates its internal instrument to address endogeneity. This estimator constructs its internal instrument, which is a heteroscedasticity-based instrument. The heteroscedasticity-based instrument is constructed from the product of the auxiliary equation residuals and each of the included exogenous variables in mean-centred form. This methodology offers a robust alternative to traditional IV methods by exploiting heteroscedasticity for identification. This innovative approach has expanded the toolkit available for econometricians dealing with endogenous and mismeasured regressors, providing a practical solution when external instruments are scarce or unavailable.
To assess the impact of education on SDH, we estimate the following model:
 $SD{H_{ij}} = \alpha + {\beta _\;}Educatio{n_{ij}} + {\gamma _\;}{X_{ij}} + {\mu _j} + {\varepsilon _{ij}}$
where SDH is one of the following factors: Financial Security, Water Safe, Food Safe or Medical Access of participant i in country j. The remaining variables are as above. However, we consider household size as an additional control variable. We estimate this model for LMIC and HIC subsamples.
Results
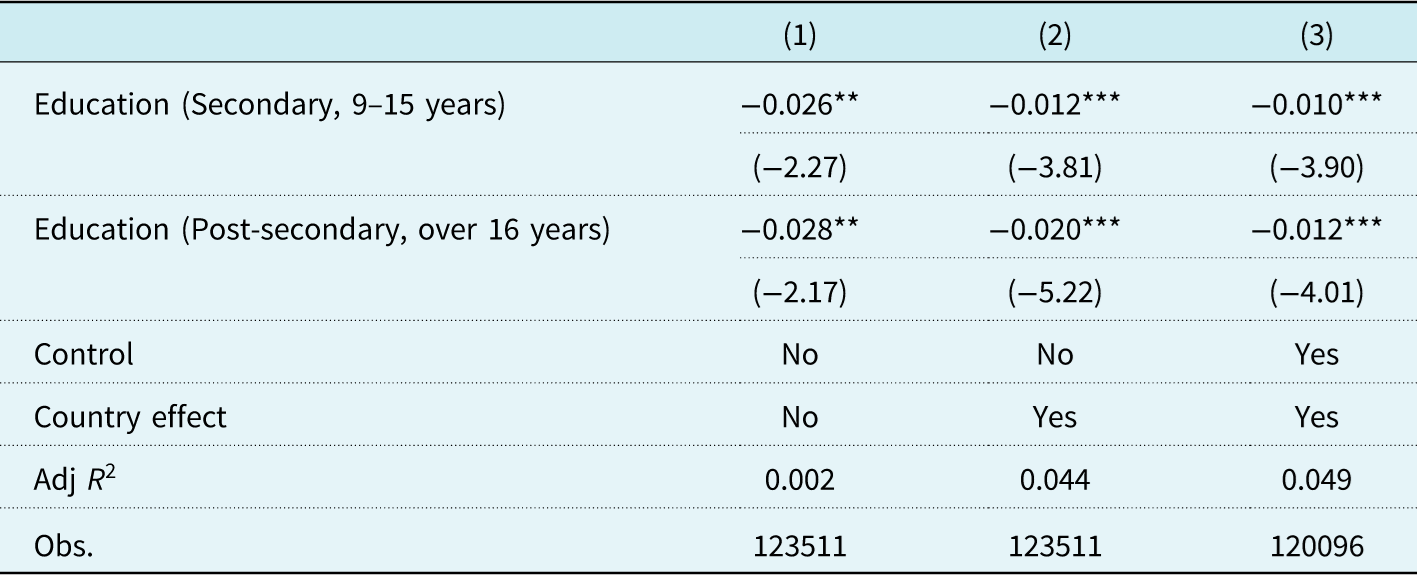
Table 2 presents the results of estimating our model for the whole sample using OLS estimation. The first column shows the results without control variables and country fixed effects. The second column presents the results with country fixed effects, whilst the third column displays the results with both country fixed effects and control variables (income group, employment status, gender, age and urbanicity). Considering that primary education is the reference group, the negative and statistically significant coefficients of both secondary and post-secondary education indicate that education reduces mental health issues. These results are robust for different specifications. Our findings are in line with the literature that shows a positive relationship between higher levels of education and better mental health outcomes. Particularly, individuals with lower levels of education are at a higher risk of developing specific mental health disorders, such as depression and anxiety. For instance, Lorant et al. (Reference Lorant, Deliège, Eaton, Robert, Philippot and Ansseau2003) found that individuals with lower educational attainment had significantly higher rates of depression compared to those with higher education.
OLS estimations – effect of education on mental issue

Table 2. Long description
The table presents the results of OLS estimations for the effect of education on mental health issues. It has three columns and six rows. The columns are labeled (1), (2), and (3). The rows are labeled with different variables and their respective values. Row 1: Education (Secondary, 9-15 years) with values -0.026**, -0.012***, and -0.010***. Row 2: Education (Post-secondary, over 16 years) with values -0.028**, -0.020***, and -0.012***. Row 3: Control with values No, No, and Yes. Row 4: Country effect with values No, Yes, and Yes. Row 5: Adj R^2 with values 0.002, 0.044, and 0.049. Row 6: Obs. with values 123511, 123511, and 120096. The table shows the impact of secondary and post-secondary education on mental health issues, with and without control variables and country fixed effects.
t statistics in parentheses. * p < 0.10, ** p < 0.05, *** p < 0.01.
While our findings indicate that individuals with higher levels of education experience fewer mental health problems, the relationship between education and mental health is complex and embedded within broader socioeconomic structures. As emphasised in the SDH literature (e.g. Solar & Irwin, Reference Solar and Irwin2010), the association is unlikely to reflect the intrinsic effect of education per se, but rather differential exposure to material, social, and institutional conditions. Education, therefore, operates primarily as a structural mechanism through which access to these determinants of well-being is distributed.
These pathways are likely to be more salient in LMICs than in HICs. In contexts where basic living conditions are not universally secured, educational attainment plays a critical role in mediating exposure to essential material and intermediary determinants that underpin the social causation of mental ill health. We therefore expect this material effect linking education to mental health to be more pronounced in low-income, high-poverty settings. To assess this heterogeneity, we re-estimate the model separately for HIC and LMIC subsamples.
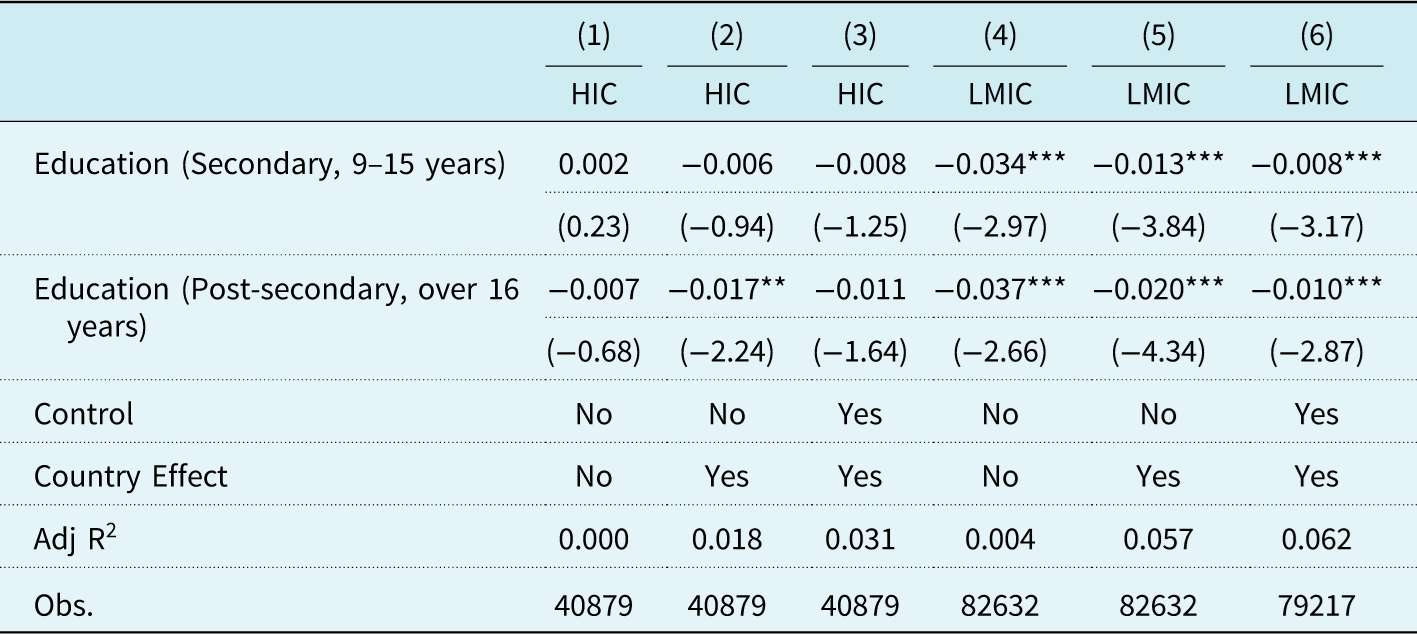
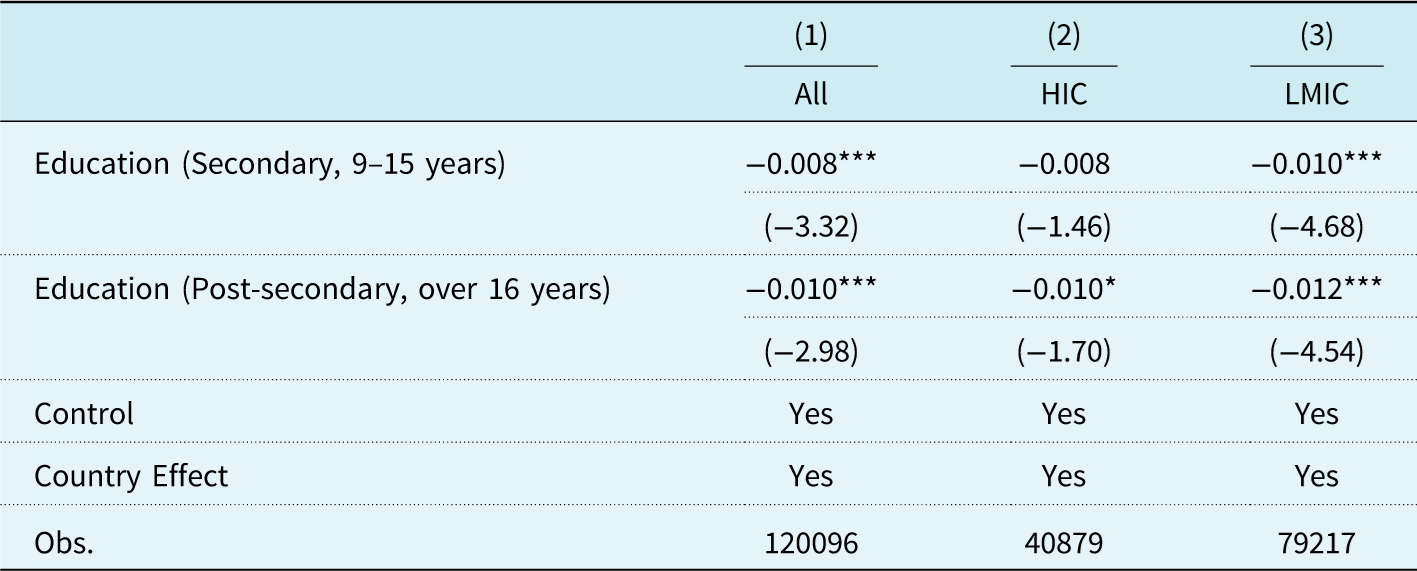
Table 3 presents the relationship between education and mental health, revealing that higher educational attainment significantly reduces mental health issues. However, this effect is statistically significant only within the LMIC subsample. This disparity supports our argument that the protective influence of education is contingent upon a country’s income level and broader socioeconomic structure. We also estimate the model using a Logit model, and the results support our findings that the education effect is more pronounced in LMICs than in HICs (see Table 4).
OLS estimations – effect of education on mental issue (HIC vs LMIC)

Table 3. Long description
The table presents the relationship between education and mental health issues, comparing high-income countries (HIC) and low- and middle-income countries (LMIC). It includes six columns labeled (1) to (6), with rows for different educational levels and control variables. The educational levels are secondary (9-15 years) and post-secondary (over 16 years). The table also includes controls for country effects and adjusted R-squared values. Row-wise data: Row 1: Education (Secondary, 9-15 years), Column 1: 0.002 (0.23), Column 2: -0.006 (-0.94), Column 3: -0.008 (-1.25), Column 4: -0.034*** (-2.97), Column 5: -0.013*** (-3.84), Column 6: -0.008*** (-3.17). Row 2: Education (Post-secondary, over 16 years), Column 1: -0.007 (-0.68), Column 2: -0.017** (-2.24), Column 3: -0.011 (-1.64), Column 4: -0.037*** (-2.66), Column 5: -0.020*** (-4.34), Column 6: -0.010*** (-2.87). Row 3: Control, Column 1: No, Column 2: No, Column 3: Yes, Column 4: No, Column 5: No, Column 6: Yes. Row 4: Country Effect, Column 1: No, Column 2: Yes, Column 3: Yes, Column 4: No, Column 5: Yes, Column 6: Yes. Row 5: Adj R^2, Column 1: 0.000, Column 2: 0.018, Column 3: 0.031, Column 4: 0.004, Column 5: 0.057, Column 6: 0.062. Row 6: Obs., Column 1: 40879, Column 2: 40879, Column 3: 40879, Column 4: 82632, Column 5: 82632, Column 6: 79217.
t statistics in parentheses. * p < 0.10, ** p < 0.05, *** p < 0.01.
Logit estimations – effect of education on mental issue

Table 4. Long description
The table presents the relationship between education and mental health, focusing on secondary and post-secondary education across all countries, high-income countries (HIC), and low- and middle-income countries (LMIC). It has three columns labeled All, HIC, and LMIC, and four rows labeled Education (Secondary, 9-15 years), Education (Post-secondary, over 16 years), Control, and Country Effect. The table also includes the number of observations (Obs.) for each category. Row 1: Education (Secondary, 9-15 years) shows values -0.008***, -0.008, and -0.010***, with corresponding z-scores (-3.32), (-1.46), and (-4.68). Row 2: Education (Post-secondary, over 16 years) shows values -0.010***, -0.010*, and -0.012***, with corresponding z-scores (-2.98), (-1.70), and (-4.54). Rows 3 and 4 indicate that Control and Country Effect are included in all categories. The number of observations (Obs.) are 120096 for All, 40879 for HIC, and 79217 for LMIC.
t statistics in parentheses. * p < 0.10, ** p < 0.05, *** p < 0.01. Logit estimates, marginal effects reported.
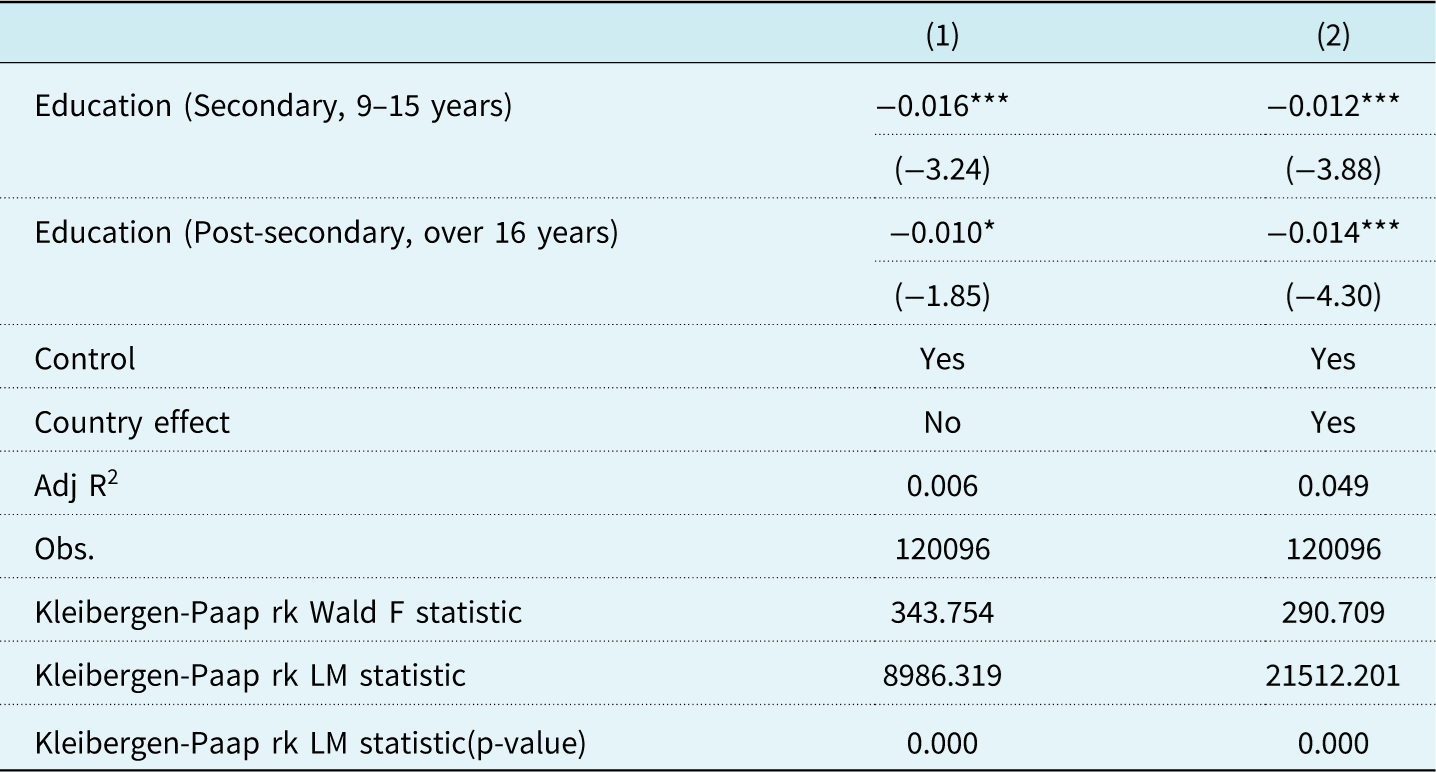
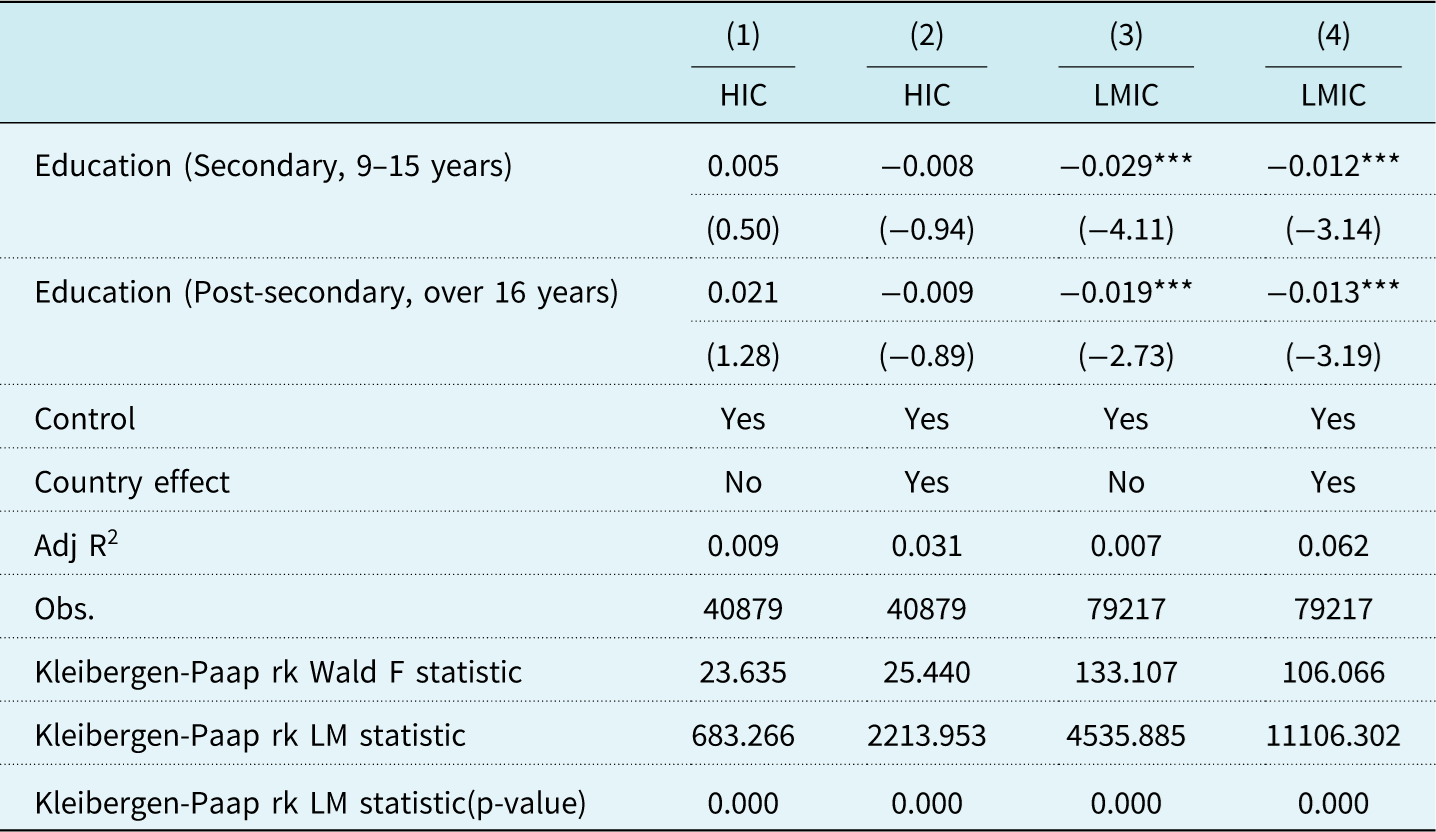
Our model may suffer from endogeneity, which can arise due to omitted variables or reverse causality. More specifically, individuals with mental health challenges might struggle to acquire education due to the disruptive impact of their condition on learning, unlike their mentally healthier peers. Consequently, endogeneity arises, as individuals may self-select into higher education based on their mental health (Dahmann & Schnitzlein, Reference Dahmann and Schnitzlein2019). To deal with potential endogeneity, we employ Lewbel’s (Reference Lewbel2012) two-stage least squares estimator technique, which enables the identification of structural parameters in a regression model with potentially endogenous regressors (education in our case). This method does not require external instruments, i.e. an external instrument-free estimator, as the instruments are generated directly from simple functions of the model’s existing data. The results of Lewbel 2SLS for the whole sample support the findings of Table 2, i.e. a negative and statistically significant impact of education on mental health issues (see Table 5). The findings of LMIC and HIC also confirm our previous results, as we find a significant negative impact only in LMICs. This shows the robustness of our results to the issue of endogeneity (see Table 6).
Lewbel 2SLS – effect of education on mental issue (all countries)

Table 5. Long description
A table with two columns and six rows comparing the effect of education on mental health issues using Lewbel 2SLS. Row 1: Education (Secondary, 9-15 years), -0.016***, (-3.24). Row 2: Education (Post-secondary, over 16 years), -0.010*, (-1.85). Row 3: Control, Yes, Yes. Row 4: Country effect, No, Yes. Row 5: Adj R^2, 0.006, 0.049. Row 6: Obs., 120096, 120096. Row 7: Kleibergen-Paap rk Wald F statistic, 343.754, 290.709. Row 8: Kleibergen-Paap rk LM statistic, 8986.319, 21512.201. Row 9: Kleibergen-Paap rk LM statistic(p-value), 0.000, 0.000.
t statistics in parentheses. * p < 0.10, ** p < 0.05, *** p < 0.01. The null hypothesis of Kleibergen-Paap rk LM test is that the structural equation is under-identified. The null hypothesis of Kleibergen-Paap rk Wald F statistic is that the instrument is weakly correlated with the endogenous variable. The Kleibergen-Paap rk LM test p-value rejects the null hypothesis that the structural equation is under-identified. The Kleibergen-Paap rk Wald F statistic rejects the null hypothesis that the instrument is weakly correlated with the endogenous variable since their values are greater than the Stock-Yogo weak ID test critical values at 10%.
Lewbel 2SLS – effect of education on mental issue (HIC vs. LMIC)

Table 6. Long description
The table presents the results of Lewbel 2SLS analysis on the effect of education on mental health issues, comparing high-income countries (HIC) and low- to middle-income countries (LMIC). It has four columns labeled (1) HIC, (2) HIC, (3) LMIC, and (4) LMIC, and several rows with data on education levels and statistical measures. Row 1: Education (Secondary, 9-15 years) with values 0.005, -0.008, -0.029***, and -0.012***. Row 2: Education (Post-secondary, over 16 years) with values 0.021, -0.009, -0.019***, and -0.013***. Row 3: Control with values Yes, Yes, Yes, and Yes. Row 4: Country effect with values No, Yes, No, and Yes. Row 5: Adj R^2 with values 0.009, 0.031, 0.007, and 0.062. Row 6: Obs. with values 40879, 40879, 79217, and 79217. Row 7: Kleibergen-Paap rk Wald F statistic with values 23.635, 25.440, 133.107, and 106.066. Row 8: Kleibergen-Paap rk LM statistic with values 683.266, 2213.953, 4535.885, and 11106.302. Row 9: Kleibergen-Paap rk LM statistic (p-value) with values 0.000, 0.000, 0.000, and 0.000. The table shows the impact of secondary and post-secondary education on mental health issues, with significant negative impacts observed in LMICs.
t statistics in parentheses. * p < 0.10, ** p < 0.05, *** p < 0.01. The null hypothesis of Kleibergen-Paap rk LM test is that the structural equation is under-identified. The null hypothesis of Kleibergen-Paap rk Wald F statistic is that the instrument is weakly correlated with the endogenous variable. The Kleibergen-Paap rk LM test p-value rejects the null hypothesis that the structural equation is under-identified. The Kleibergen-Paap rk Wald F statistic rejects the null hypothesis that the instrument is weakly correlated with the endogenous variable since their values are greater than the Stock-Yogo weak ID test critical values at 10%.
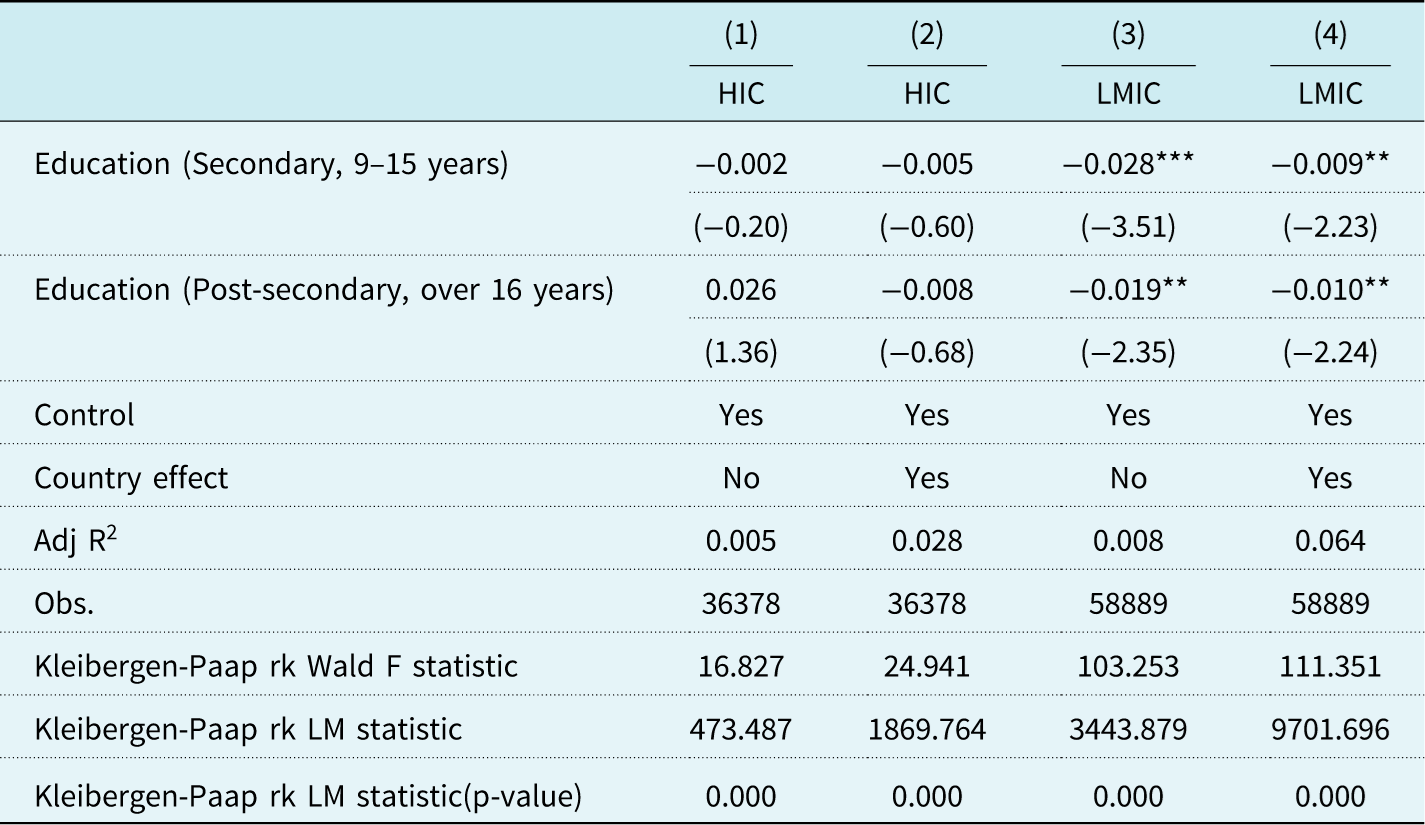
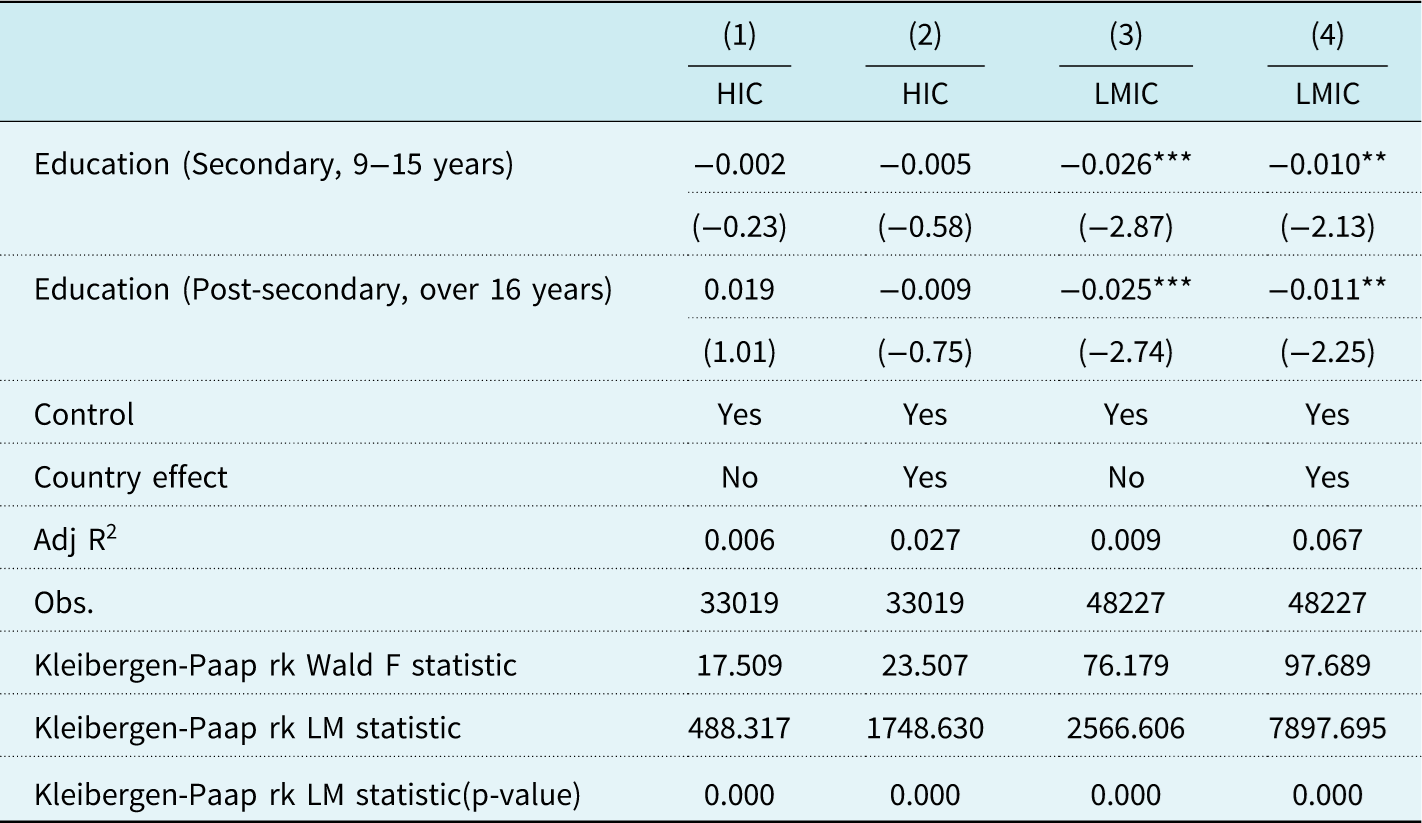
In our previous analysis, we included observations from individuals aged 15 to 99. However, younger individuals had not yet completed their full secondary or post-secondary education. To assess the robustness of the findings presented in Table 6, we re-estimate the model using data from adults aged 25 and older and, separately, adults aged 30 and older. The results confirm the findings in Table 6 (see Appendices B1 and B2).
In LMICs, education appears to operate predominantly through a social causation pathway. In these contexts, it functions as a critical structural determinant shaping individuals’ exposure to essential material and intermediary conditions, including financial security, food security, access to clean water, and medical services. Because basic living standards are not universally secured in many LMICs, education plays a foundational role in providing the resources necessary to buffer against the chronic stressors associated with poverty. Consequently, the material effect of education, where mental health is protected through access to tangible resources, is considerably more pronounced in LMICs than in HICs. In higher-income settings, where access to basic services is more universal or less tightly linked to educational attainment, the marginal material returns to education are likely attenuated.
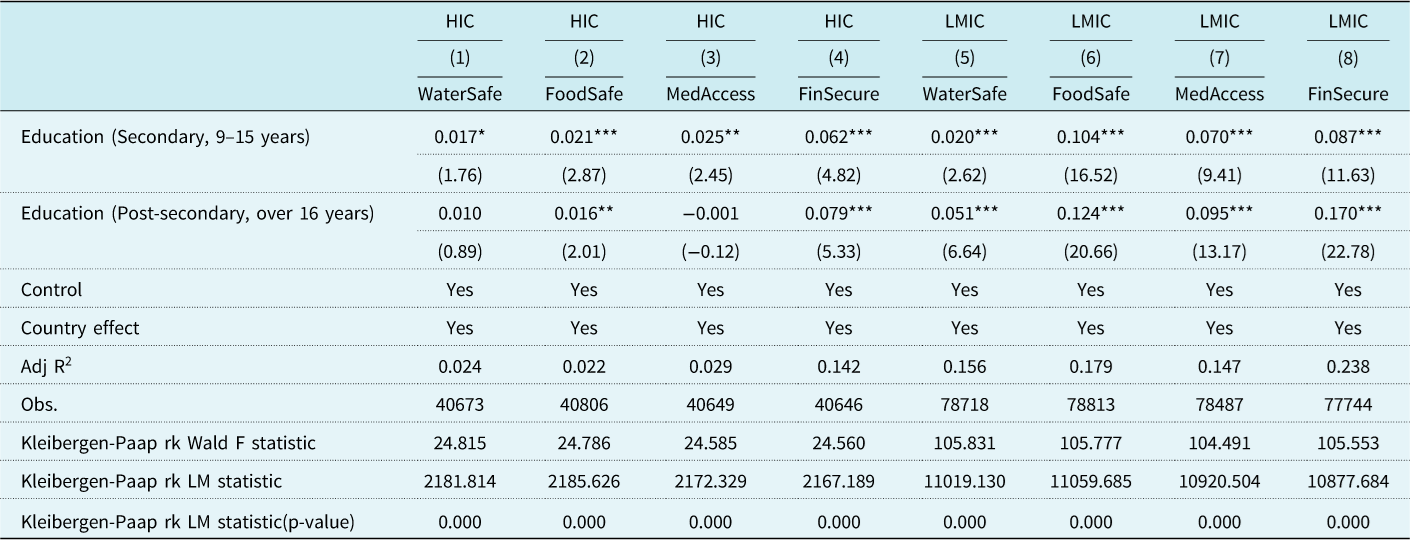
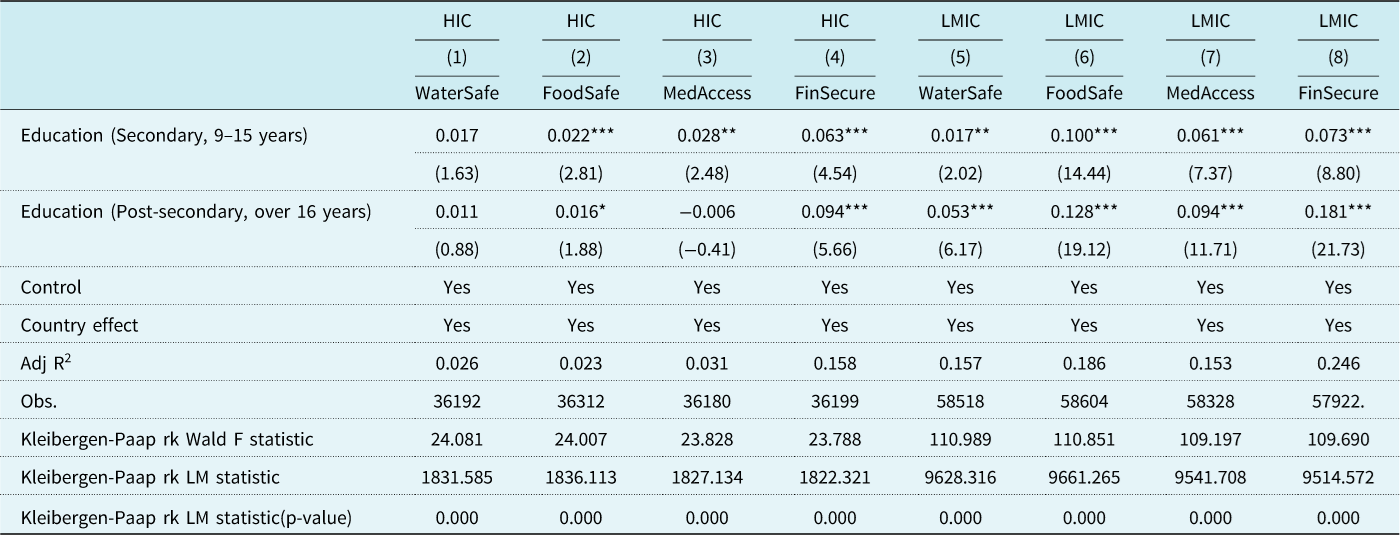
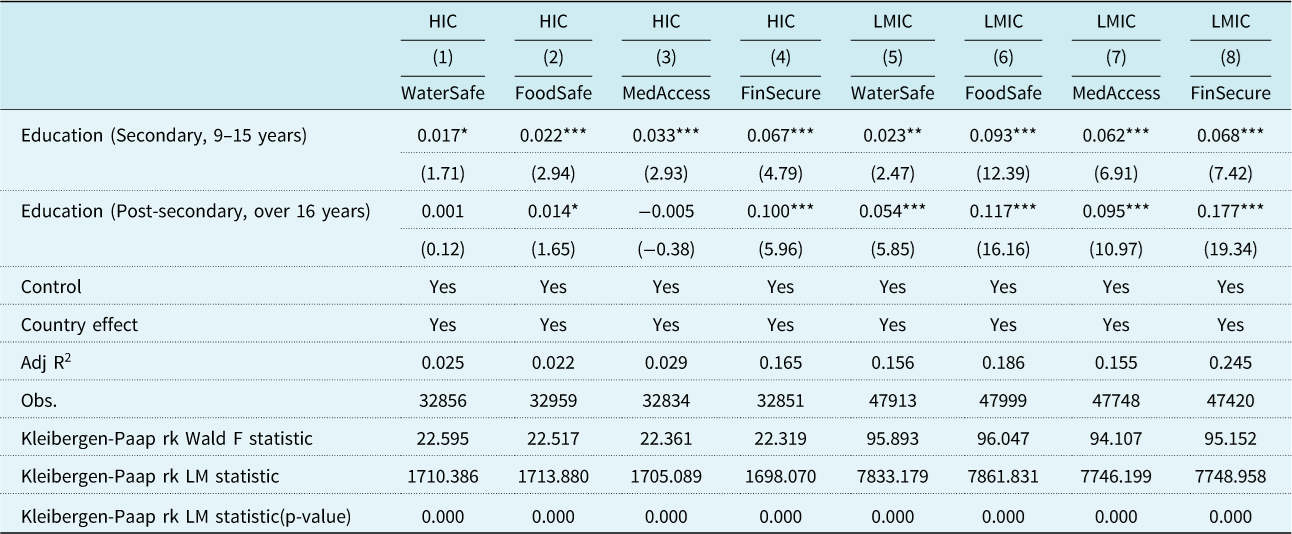
In the final step of our analysis, we therefore examine how education shapes key determinants of mental well-being as conceptualised within the SDH framework. Specifically, we estimate the effect of education on financial security, access to clean water, food security, and healthcare services. The results indicate that education positively influences these core determinants in both HICs and LMICs, but the magnitude of the effects is substantially larger in LMICs. In HICs, education primarily enhances financial security, with relatively small effects on access to safe water, food and medical services. By contrast, in LMICs, both secondary and post-secondary education significantly improve access to financial security, safe water, food and healthcare, with post-secondary attainment generating the largest gains. These findings are consistent with the SDH framework and underscore education’s role as a structural pathway through which access to essential resources and services is distributed, particularly in contexts where such resources are not universally guaranteed (see Table 7). We find the same results for adults aged twenty-five or thirty and older (see Appendices C1 and C2).
IV Estimations – effect of education on social determinants of health

Table 7. Long description
A table comparing the effect of education on social determinants of health in high-income countries (HIC) and low- and middle-income countries (LMIC). The table has 8 columns and 10 rows. Column headers are HIC WaterSafe, HIC FoodSafe, HIC MedAccess, HIC FinSecure, LMIC WaterSafe, LMIC FoodSafe, LMIC MedAccess, and LMIC FinSecure. Row labels include Education (Secondary, 9–15 years), Education (Post-secondary, over 16 years), Control, Country effect, Adj R², Obs., Kleibergen-Paap rk Wald F statistic, Kleibergen-Paap rk LM statistic, and Kleibergen-Paap rk LM statistic(p-value). Row 1: Education (Secondary, 9–15 years): 0.017*, 0.021***, 0.025**, 0.062***, 0.020***, 0.104***, 0.070***, 0.087***. Row 2: Education (Post-secondary, over 16 years): 0.010, 0.016**, -0.001, 0.079***, 0.051***, 0.124***, 0.095***, 0.170***. Row 3: Control: Yes, Yes, Yes, Yes, Yes, Yes, Yes, Yes. Row 4: Country effect: Yes, Yes, Yes, Yes, Yes, Yes, Yes, Yes. Row 5: Adj R²: 0.024, 0.022, 0.029, 0.142, 0.156, 0.179, 0.147, 0.238. Row 6: Obs.: 40673, 40806, 40649, 40646, 78718, 78813, 78487, 77744. Row 7: Kleibergen-Paap rk Wald F statistic: 24.815, 24.786, 24.585, 24.560, 105.831, 105.777, 104.491, 105.553. Row 8: Kleibergen-Paap rk LM statistic: 2181.814, 2185.626, 2172.329, 2167.189, 11019.130, 11059.685, 10920.504, 10877.684. Row 9: Kleibergen-Paap rk LM statistic(p-value): 0.000, 0.000, 0.000, 0.000, 0.000, 0.000, 0.000, 0.000.
t statistics in parentheses. * p < 0.10, ** p < 0.05, *** p < 0.01.
Conclusion
The relationship between education and mental health remains theoretically contested and empirically mixed, with evidence largely drawn from HICs. Consequently, we know little about whether the education–mental health gradient operates similarly in LMICs, where socioeconomic conditions, access to basic services and poverty exposure differ substantially. This gap is important because education may play a fundamentally different role in contexts where access to material resources is not universally secured. Without systematic cross-country comparison, it is difficult to determine whether existing conclusions generalise to the majority of the world’s population.
This study addresses that gap by providing a large cross-country analysis covering 121 countries (forty-two HICs and seventy-nine LMICs) in 2021 and explicitly testing heterogeneity in the education–mental health gradient across income groups within a unified empirical framework. Using multiple estimation methods, including IV regressions based on Lewbel’s (Reference Lewbel2012) approach to address potential endogeneity, we find that education is associated with fewer mental health problems in the full sample. However, when the sample is stratified by country income level, the protective effect of education is statistically significant only in LMICs. These findings demonstrate that the mental health returns to education are context-dependent, underscoring the importance of moving beyond single-country or high-income-focused analyses when drawing conclusions about the broader social benefits of education.
In LMICs, our findings provide empirical support for a social causation pathway. In these contexts, education operates as a critical structural mechanism that mediates access to essential material and intermediary determinants, such as financial security, food security and access to clean water and medical services. Because basic living conditions are not universally secured in many LMICs, education serves as a primary gatekeeper to the resources necessary to buffer against the chronic stressors associated with poverty. Conversely, in HICs, where such material resources are more decoupled from educational status, this ‘material-effect’ is attenuated. While education still improves financial security, its overall protective effect on mental health is weaker. Education may also introduce new stressors. Educated individuals may face job market saturation or unmet expectations for social and economic advancement, leading to frustration, anxiety or depression (Bracke et al., Reference Bracke, Pattyn and Von dem Knesebeck2013; Bracke et al., Reference Bracke, van de Straat and Missinne2014; Dudal & Bracke, Reference Dudal and Bracke2019; Piper, Reference Piper2015). This harmful channel is more likely in HICs, where education levels and labour market competition are higher. In these countries, the positive mental outcome of education may be weaker, as income levels are generally higher and poverty rates are lower compared to LMICs. The difference in the findings by income level may also reflect different societal attitudes towards the reporting of mental health issues, with a greater willingness/openness to report such issues among a better-educated population in HICs, compared with a generally less-educated population in LMICs (Dahmann & Schnitzlein, Reference Dahmann and Schnitzlein2019). It should also be noted that in HICs, the number of years of compulsory education required by law tends to be much higher than in LMIC. Such legislation requires that pupils in HICs who might prefer to leave school earlier to work are required to stay at school past a point that they feel either interests them or is beneficial for their career aspirations. These factors, combined with being exposed to an environment where their performance is below that of their peers, may negatively impact their mental health (Eckstein & Wolpin, Reference Eckstein and Wolpin1999).
Our findings have important implications for both LMICs and HICs. For LMICs, governments and policymakers should prioritise increasing access to quality education, especially for disadvantaged populations, since education significantly reduces mental health issues in these countries. In addition, schools should integrate mental health support services and education into their curricula to promote early awareness and intervention. Furthermore, education policies should align with poverty reduction strategies by promoting vocational training and employability, helping to lift households out of poverty and alleviate related stress, further improving mental health outcomes.
Although education in HICs does not exhibit a statistically significant protective effect on mental health in our estimates, it nonetheless continues to generate important material advantages, including greater financial security and improved access to basic services. Education expansion in HICs therefore remains valuable for broader socioeconomic development. However, our results indicate that in contexts where baseline living conditions are already widely secured, education alone may be insufficient as a lever for improving mental health outcomes. Enhancing mental wellbeing in HICs is likely to require complementary interventions, including strengthened mental health services, workplace and community-based support systems and social policies that reduce stressors unrelated to educational attainment. In addition, potential psychosocial mechanisms, such as expectation-related pressures, labour market mismatch and competitive academic environments, merit further empirical investigation to better understand why education does not confer the same protective mental health effects observed in LMICs.
Overall, it is important to adapt policies to align with the socioeconomic environment in which they will be implemented. Governments should recognise that the mental health benefits of education differ between LMICs and HICs. Policy frameworks should be context-specific, with LMICs focusing on education as a tool for mental health improvement, while HICs should complement education policy with broader mental health interventions that address the wider social, economic and psychosocial stressors that affect mental health across the population. Finally, to address mental health issues effectively, there must be coordination between health and education sectors in both LMICs and HICs, ensuring policies are aligned to support holistic well-being. By targeting the unique needs of each socioeconomic context, these policies can help maximise the mental health benefits of education while addressing its limitations in different regions.
Data availability statement
The data used in this paper comes from The Lloyd’s Register Foundation World Risk Poll and can be accessed at https://www.lrfoundation.org.uk/wrp/world-risk-poll-data
Competing interests
The authors declare none.
Appendix
Country list

Appendix A. Long description
A table categorizes countries into High-Income Countries (HIC) and Low- and Middle-Income Countries (LMIC). The table has two columns: HIC and LMIC, and multiple rows listing countries under each category. Row 1: Australia, Afghanistan; Row 2: Austria, Albania; Row 3: Belgium, Algeria; Row 4: Canada, Argentina; Row 5: Chile, Armenia; Row 6: Croatia, Bangladesh; Row 7: Cyprus, Benin; Row 8: Czech Republic, Bolivia; Row 9: Denmark, Bosnia Herzegovina; Row 10: Estonia, Brazil; Row 11: Finland, Bulgaria; Row 12: France, Burkina Faso; Row 13: Germany, Cambodia; Row 14: Greece, Cameroon; Row 15: Hong Kong, China; Row 16: Hungary, Colombia; Row 17: Iceland, Congo Brazzaville; Row 18: Ireland, Costa Rica; Row 19: Israel, Dominican Republic; Row 20: Italy, Ecuador; Row 21: Japan, Egypt; Row 22: Latvia, El Salvador; Row 23: Lithuania, Gabon; Row 24: Malta, Georgia; Row 25: Netherlands, Ghana; Row 26: New Zealand, Guinea; Row 27: Norway, Honduras; Row 28: Poland, India; Row 29: Portugal, Indonesia; Row 30: Saudi Arabia, Iran; Row 31: Singapore, Iraq; Row 32: Slovakia, Ivory Coast; Row 33: Slovenia, Jamaica; Row 34: South Korea, Jordan; Row 35: Spain, Kazakhstan; Row 36: Sweden, Kenya; Row 37: Switzerland, Kosovo; Row 38: Taiwan, Kyrgyzstan; Row 39: United Arab Emirates, Laos; Row 40: United Kingdom, Lebanon; Row 41: United States, Malaysia; Row 42: Uruguay, Mali; Row 43: Malaysia, Mauritius; Row 44: Mexico, Moldova; Row 45: Mongolia, Morocco; Row 46: Mozambique, Myanmar; Row 47: Namibia, Nepal; Row 48: Nicaragua, Nigeria; Row 49: North Macedonia, Pakistan; Row 50: Panama, Paraguay; Row 51: Peru, Philippines; Row 52: Romania, Russia; Row 53: Senegal, Serbia; Row 54: Sierra Leone, South Africa; Row 55: Sri Lanka, South Africa; Row 56: Tajikistan, Tanzania; Row 57: Thailand, Togo; Row 58: Tunisia, Tunisia; Row 59: Turkey, Uganda; Row 60: Ukraine, Ukraine; Row 61: Uzbekistan, Venezuela; Row 62: Vietnam, Vietnam; Row 63: Zambia, Zambia; Row 64: Zimbabwe, Zimbabwe.
IV estimations – effect of education on mental issue (adults +25)

Appendix B1. Long description
The table presents data on the effect of education on mental health issues in adults aged 25 and older, comparing high-income countries (HIC) and low- to middle-income countries (LMIC). It has four columns and seven rows, including headers and footnotes. The columns are labeled (1) HIC, (2) HIC, (3) LMIC, and (4) LMIC. The rows include education levels, control variables, country effect, adjusted R-squared values, observations, and statistical tests. Row 1: Education (Secondary, 9-15 years) with values -0.002, -0.005, -0.028, -0.009 and t statistics (-0.20), (-0.60), (-3.51), (-2.23). Row 2: Education (Post-secondary, over 16 years) with values 0.026, -0.008, -0.019, -0.010 and t statistics (1.36), (-0.68), (-2.35), (-2.24). Row 3: Control with values Yes, Yes, Yes, Yes. Row 4: Country effect with values No, Yes, No, Yes. Row 5: Adj R2 with values 0.005, 0.028, 0.008, 0.064. Row 6: Obs. with values 36378, 36378, 58889, 58889. Row 7: Kleibergen-Paap rk Wald F statistic with values 16.827, 24.941, 103.253, 111.351. Row 8: Kleibergen-Paap rk LM statistic with values 473.487, 1869.764, 3443.879, 9701.696. Row 9: Kleibergen-Paap rk LM statistic (p-value) with values 0.000, 0.000, 0.000, 0.000. The table includes footnotes explaining the statistical tests and their interpretations.
t statistics in parentheses. * p < 0.10, ** p < 0.05, *** p < 0.01. The null hypothesis of Kleibergen-Paap rk LM test is that the structural equation is under-identified. The null hypothesis of Kleibergen-Paap rk Wald F statistic is that the instrument is weakly correlated with the endogenous variable. The Kleibergen-Paap rk LM test p-value rejects the null hypothesis that the structural equation is under-identified. The Kleibergen-Paap rk Wald F statistic rejects the null hypothesis that the instrument is weakly correlated with the endogenous variable since their values are greater than the Stock-Yogo weak ID test critical values at 10%.
IV estimations – effect of education on mental issue (adults +30)

Appendix B2. Long description
The table presents data on the effect of education on mental health issues in adults over 30, comparing high-income countries (HIC) and low- and middle-income countries (LMIC). It has four columns and seven rows, including headers and footnotes. The columns are labeled (1) HIC, (2) HIC, (3) LMIC, and (4) LMIC. The rows are labeled with different variables: Education (Secondary, 9-15 years), Education (Post-secondary, over 16 years), Control, Country effect, Adj R2, Obs., Kleibergen-Paap rk Wald F statistic, Kleibergen-Paap rk LM statistic, and Kleibergen-Paap rk LM statistic (p-value). Each cell contains numerical values and t-statistics in parentheses. The table also includes footnotes explaining the null hypotheses and the significance of the statistics.
t statistics in parentheses. * p < 0.10, ** p < 0.05, *** p < 0.01. The null hypothesis of Kleibergen-Paap rk LM test is that the structural equation is under-identified. The null hypothesis of Kleibergen-Paap rk Wald F statistic is that the instrument is weakly correlated with the endogenous variable. The Kleibergen-Paap rk LM test p-value rejects the null hypothesis that the structural equation is under-identified. The Kleibergen-Paap rk Wald F statistic rejects the null hypothesis that the instrument is weakly correlated with the endogenous variable since their values are greater than the Stock-Yogo weak ID test critical values at 10%.
IV estimations – effect of education on social determinants of health (adults +25)

Appendix C1. Long description
The table presents data on the effect of education on social determinants of health for adults over 25 in high-income countries (HIC) and low-middle-income countries (LMIC). It includes eight columns: four for HIC (WaterSafe, FoodSafe, MedAccess, FinSecure) and four for LMIC (WaterSafe, FoodSafe, MedAccess, FinSecure). The rows are labeled with education levels: Secondary (9-15 years) and Post-secondary (over 16 years). Each cell contains a value and a t-statistic in parentheses. The table also includes control and country effect indicators, Adj R² values, observation counts, and Kleibergen-Paap rk Wald F and LM statistics with p-values. Notable trends include higher values for post-secondary education in LMIC compared to HIC.
t statistics in parentheses. * p < 0.10, ** p < 0.05, *** p < 0.01
IV estimations – effect of education on social determinants of health (adults +30)

Appendix C2. Long description
The table presents data on the effect of education on social determinants of health for adults aged 30 and above, comparing high-income countries (HIC) and low- and middle-income countries (LMIC). The table has 8 columns and 8 rows, including headers and labels. The columns are labeled as HIC WaterSafe, HIC FoodSafe, HIC MedAccess, HIC FinSecure, LMIC WaterSafe, LMIC FoodSafe, LMIC MedAccess, and LMIC FinSecure. The rows include Education (Secondary, 9-15 years), Education (Post-secondary, over 16 years), Control, Country effect, Adj R², Obs., Kleibergen-Paap rk Wald F statistic, Kleibergen-Paap rk LM statistic, and Kleibergen-Paap rk LM statistic (p-value). Each cell contains numerical values and t-statistics in parentheses. Notable trends include varying effects of secondary and post-secondary education on different social determinants of health across HIC and LMIC.
t statistics in parentheses. * p < 0.10, ** p < 0.05, *** p < 0.01.



 Open access

