To say that John McCain's selection of Sarah Palin as his running mate in 2008 excited some controversy is, at minimum, a gross understatement. According to reports (Allen and VandeHei Reference Allen and VandeHei2012; Scarborough Reference Scarborough2012), Mitt Romney was much more risk-averse than McCain, looking for a “safer” choice. What other factors will come into play as he considers his selection?
A small body of research has identified several statistically significant factors in the vice presidential selection process that informs this question. This article briefly reviews this scholarship, highlighting these factors. Results are then presented from a conditional logit model that uses these and other variables, analyzing the 20 vice presidential nominations from 1960 forward and correctly predicting 14 (70%). Finally, the pool of names from which Romney will make his selection are added and a prediction of who his running mate is generated.
VICE PRESIDENTIAL SELECTION: WHAT WE KNOW
In the past two decades three articles have modelled the vice presidential selection process in the modern era (Baumgartner Reference Baumgartner2008; Hiller and Kriner Reference Hiller and Kriner2008; Sigelman and Wahlbeck Reference Sigelman and Wahlbeck1997). These analyses focus on both the nominees as well as all of the individuals who were considered for the nomination. Several points emerge from a review of this scholarship.
First, there is little consistency among the findings. Part of this can be explained by differences in how the dependent variable was operationalized (more on this later), but the decision of which independent variables to include and how to operationalize these matter as well. In addition, the analyses are especially sensitive to which cases (nominations and candidacies) are included. Sigelman and Wahlbeck (Reference Sigelman and Wahlbeck1997) examine nominations from 1940 through 1992, Hiller and Kriner (Reference Hiller and Kriner2008) from 1940 through 2004, and Baumgartner from 1960 through 2008. Because relatively few cases are used in an analysis of this sort, the inclusion or exclusion of a nomination or candidacy can have an important effect on the model.
Case selection rules are also important because there are good theoretical and empirical reasons to believe that the calculus used to select a running mate has changed in important ways from 1940 to the present. Baumgartner uses 1960 as a starting point because candidates (rather than parties) became the sole decision maker in the process then. Hiller and Kriner illustrate this change by interacting dummy variables based on whether the candidacies occurred before or after the McGovern-Fraser reforms of the 1970s (post-1972 and pre-1976) with several other variables.
This said, from this research some agreement emerges about which factors are significant in the selection of a vice presidential candidate. First, the conventional wisdom that the size of the candidate's home state and adding regional and ideological balance to the ticket probably does not apply in the modern era (Baumgartner Reference Baumgartner2008; Hiller and Kriner Reference Hiller and Kriner2008). Second, having challenged the presidential nominee for the nomination in the present election cycle seems to have a negative effect on the chance an individual will be selected. Sigelman and Wahlbeck (Reference Sigelman and Wahlbeck1997) and Hiller and Kriner (Reference Hiller and Kriner2008) found that selecting a vice presidential candidate who was either significantly younger or older than the presidential candidate was significant, while Baumgartner (Reference Baumgartner2008) found that age itself has a negative effect; these findings are probably consistent. Baumgartner (Reference Baumgartner2008) and Hiller and Kriner (Reference Hiller and Kriner2008) also found that years of political experience has a positive effect on the selection process. Each analysis found one or more other variables to be significant as well, but again, there is no consensus across analyses on these.
DATA AND METHOD
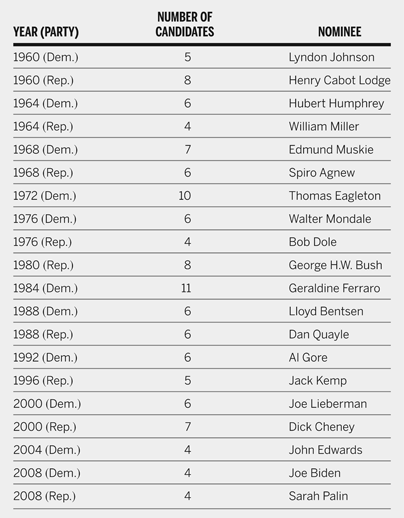
In this analysis the prediction is based on a model that examines the 20 contested major party vice presidential nominations from 1960 to 2008. Attention is restricted to this post-1960 time period because, as noted previously, prior to 1960 political parties had total or partial say in the nomination; this is not the case after 1960 (Mayer Reference Mayer and Mayer2000). Table 1 lists the nominations included.
Contested Major Party Vice Presidential Nominations, 1960–2008

The candidate list from Hiller and Kriner (Reference Hiller and Kriner2008; in turn based on Sigelman and Wahlbeck Reference Sigelman and Wahlbeck1997) provided the foundation for case selection from 1960 to 2004, although several candidates were either added to or dropped from their list for this analysis.Footnote 1 Baumgartner's (Reference Baumgartner2008) list was used for 2008.
The dependent variable is “nominated.” Other researchers (e.g., Hiller and Kriner Reference Hiller and Kriner2008; Sigelman and Wahlbeck Reference Sigelman and Wahlbeck1997) have used the presidential candidate's “first choice” as the dependent variable, regardless of whether that individual actually appeared on the ticket in November.Footnote 2 Here, the approach is to use the individual who actually received the nomination at the convention, primarily because the first choice may not have been an individual who would have been willing to accept the nomination.
Several independent variables are used to predict the eventual nominee, each of which corresponds to a factor thought to be significant in the selection process and has been used in previous analyses. All of these variables are included here, regardless of whether they were significant in these previous analyses because their inclusion results in better predictions. Due to space constraints, each is introduced and described only briefly; more complete theoretical and operational discussions of each can be found in Baumgartner (Reference Baumgartner2008; see also Hiller and Kriner Reference Hiller and Kriner2008; Sigelman and Wahlbeck Reference Sigelman and Wahlbeck1997).Footnote 3
“Size of state” is the percentage of total Electoral College votes from the individual's home state. Like most variables in the model (unless otherwise indicated) the effect of state size is expected to be positive. “Regional balance” was coded “1” if the vice presidential and presidential candidate were from different regions and “0” otherwise. “State competitiveness” was calculated by averaging the difference (in absolute values) between the percentage of the Democratic and Republican presidential vote share in the candidates' home state for the previous three elections. Because a smaller value reflects a more competitive election, this variable should have a negative effect.
“Ideological balance” is a dummy variable, coded “1” if the vice presidential candidate balanced the ticket ideologically and “0” otherwise. The “rivals” variable, also a dummy, captures whether the vice presidential candidate was a challenger for the presidential nomination in the present election cycle. The effect of this variable is expected to be negative.
“Media exposure” is a measure of mentions in the national press. Variations of each candidates' name were entered as search terms in the archives of The New York Times and the Washington Post from January 1 of the year prior to the election through May 31 of the election year. These two totals were combined to form an index (Cronbach Alpha = .853), and because there was an inordinately high degree of variation, logged values of the scores were used.
“Political experience” is the number of years (through the present election year) the candidate served in (1) subnational (local and state) office, (2) the US House of Representatives, (3) the US Senate, and (4) other national office. In the event that state governors or US senators are more likely to be selected, two “last office” served (governor and senator) dummy variables are included in the model (other offices are left as the reference category). A related measure, “insider-outsider balance,” captures whether the vice presidential selection balanced the presidential selection in terms of Washington insider or outsider status (based on last office served; 1 = balanced, 0 = unbalanced).
Several demographic variables are included as well. “Education” is coded “0” if the candidate did not have a college degree, “1” for a four-year college degree, and “2” for a post-undergraduate education. “Veteran” is a dummy, coded as “1” if the candidate served in any capacity in the military. “Age” measures the candidate's age, and unlike most variables in the model, is expected to have a negative effect (Baumgartner Reference Baumgartner2008). If both vice presidential and presidential candidates were white, male, and of Northwest European descent, “gender/racial/ethnic balance” was coded as “0”; if one satisfied all of these conditions and the other did not, it was coded as “1” (balanced). Finally, “religious balance” was coded as “1” if one of the candidates was Protestant and the other was not, and “0” if both or neither were Protestant.
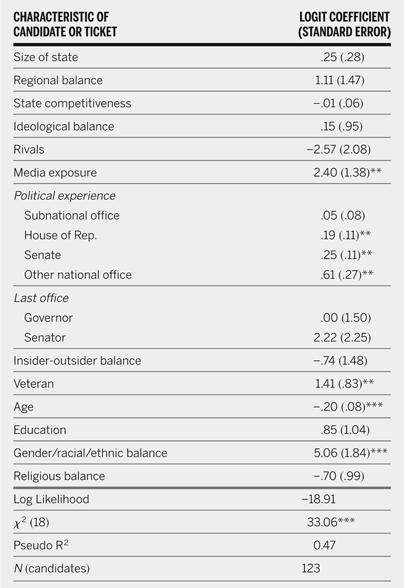
The model was tested using conditional logit (also known as discrete choice analysis), which estimates effects within predefined groups of choices (e.g., Democrats, 1960; see Greene Reference Greene2003; McFadden Reference McFadden and Zarembka1974). The model is not very parsimonious, but VIF scores suggest that there is no problem with multicollinearity (mean VIF = 1.77, and no single score > 3.39). Results are shown in table 2.
Vice Presidential Selection, 1960–2008

* p < .10,
** p < .05,
*** p < .01 (one-tailed).
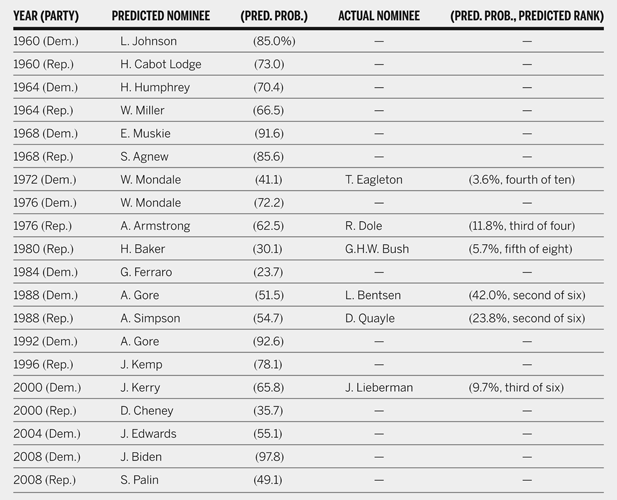
As in Baumgartner's previous model (Reference Baumgartner2008), media exposure, three of the political experience variables, veteran status, and age are significant and in the expected direction.Footnote 4 State competitiveness was significant in the 2008 model, but is not in this analysis. The 2008 model collapsed gender/racial/ethnic and religious balance into a single “demographic balance” variable, which was not significant. Dissagregating the two (as per Hiller and Kriner Reference Hiller and Kriner2008 and Sigelman and Wahlbeck Reference Sigelman and Wahlbeck1997), likely in conjunction with the selection of Palin in 2008, helps gender/racial/ethnic balance attain statistical significance. Of course, the true test of the model is its predictive ability. Table 3 shows the predicted and actual winners for each nomination. The model correctly predicts 14 of the 20 nominees (70%) during this time period.Footnote 5
Vice Presidential Selection, 1960–2008: Predicted Probabilities

Next, the Republican vice presidential selection of 2012 is discussed.
THE VEEPSTAKES 2012
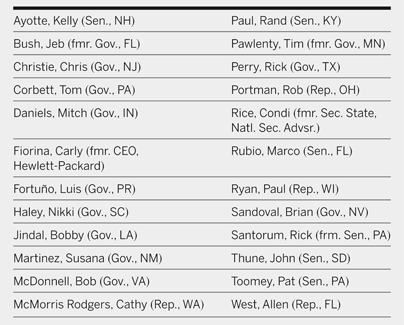
The 2012 veepstakes began almost six months before any primary or caucus votes were cast (Habernan Reference Habernan2011). Since July 2011, roughly two dozen names of possible running mates were put forward by politicians, pundits, commentators, and political observers in serious accounts of the campaign. Most of these individuals were mentioned under the assumption that Mitt Romney would be the eventual nominee. Table 4 contains a fairly complete list of these names. Interestingly, half of these individuals are either governors or ex-governors; six are sitting or former members of the US Senate. In addition, most are associated with the conservative (or in some cases, the “Tea Party”) wing of the Republican Party, something Romney cannot credibly claim. The group is also fairly diverse, perhaps surprising for the Republican Party: six women, several individuals of Latin descent, two African Americans, and two Indian Americans are included.
Names Mentioned in the 2012 Republican Veepstakes

Of course, simply because their names were mentioned in the popular press did not guarantee that any of these individuals would be actually considered by Romney as a possible running mate. Furthermore, a few of these individuals probably did not want the job. In the extremely unlikely event that all of these names were actually being considered, the model predicts that Chris Christie would be the nominee (51.3%), followed by Marco Rubio (17.1%), Allen West (8.6%), and Bobby Jindal (7.6%).
THE SELECTION
By early April Romney had officially begun his search, and within few weeks was presented with of 20 names by long-time aide Beth Myers. From this he compiled a shorter list, and calls were made to each of the individuals on it asking if they would like to be considered. By July Romney was presented with the results of the vetting process, and by the end of the month only three candidates were still under consideration, namely, former Minnesota Governor Tm Pawlenty, Ohio Representative Rob Portman, and Wisconsin Representative Paul Ryan. In meeting with Myers and his top advisers on August 1 he let it be known that of the three, he was leaning toward Ryan. He then called Ryan, setting up a secret meeting between the two for August 5. The selection was officially announced at 8:00 a.m. on August 11 (Allen, Gibson, and Haberman Reference Allen, Gibson and Haberman2012).
Romney's short list therefore consisted of only three individuals: Pawlenty, Portman, and Ryan. If the model is run with only these three names added, it predicts the selection of Ryan with an 86.1% certainty (Portman receives 13.6%). Romney reportedly selected Ryan over the likely safer Pawlenty and Portman to try and focus the campaign on fundamental policy differences.
However, the descriptive data in the model reveal little about why Ryan emerges as the winner. Looking first at the nonsignificant variables in the model, Ryan's state is far less competitive than Portman's and has fewer Electoral College votes; Ryan does not bring religious balance to the ticket, while the other two candidates do; and he is less educated than the others. Moreover, like Portman his “last office served” is in the House (unusual for recent vice presidential candidates). Both Portman and Ryan bring insider-outsider and ideological balance to the ticket, and neither was not a rival for the presidential nomination in 2012. All three individuals balance the ticket regionally.
In terms of the significant variables, Ryan has an edge over Portman in terms of media exposure, but is equal to Pawlenty. Ryan and Portman have served equal number of years in the House, but Portman has experience in the Senate and in the “other national office category,” while Ryan does not (Pawlenty has no national experience whatever). None of the three individuals brought military experience or gender/race/ethnic balance to the ticket. The one variable that clearly separates Ryan from the other two is age: He is 42, while Pawlenty is 52 and Portman is 57.
This brief discussion suggests that the veepstakes is a far more complex “game” than most observers believe. Moreover, is also illustrates that in the end it may not be possible to quantify all of the important factors that are important in the selection process. This said, the correct prediction of Ryan brings the model average up to 71.4 percent (15 of 21), which represents a respectable start.