Introduction
The most recent evaluation of the status of animal genetic resources for food and agriculture (AnGR) globally showed that 9 percent of the breeds reported to Food and Agriculture Organization of the United Nations (FAO) were already extinct and 21 percent were classified as at risk (FAO, 2009b). A further 36 percent of breeds had an unknown risk status, because of a lack of population data (ibid.). Given the multiple roles and values of AnGR and their contribution to food security, livelihoods, rural development, and to the cultural, social and religious fabrics of rural societies, the erosion of these resources requires urgent action. The importance of maintaining livestock diversity is underlined in the Global Plan of Action for Animal Genetic Resources (GPA), adopted by the member countries of FAO in 2007 (FAO, 2007b).
Actions to reduce or halt the erosion of AnGR need to be well targeted and their outcomes evaluated. To these ends, it is important that the status and trends of AnGR diversity be monitored effectively. It is also important that the outputs of monitoring processes be made available in forms that are easily understood and easily assimilated into decision-making processes. The need to provide policy-makers with succinct, yet informative, messages about complex problems is widespread in the field of biodiversity management and much effort has been dedicated to the development of the so-called “indicators” – measures of biodiversity or related phenomena – that can serve this purpose. This paper focuses on the uses of indicators in the field of AnGR management: reviewing previous and ongoing initiatives and discussing potential future developments particularly at the global level.
Work on indicators under the Convention of Biological Diversity and the Commission on Genetic Resources for Food and Agriculture
While global data on the diversity of AnGR and the risk status of these resources have been collated and published in a number of publications over a substantial period (FAO/UNEP, Reference Loftus and Scherf1993, Reference Scherf1995, Reference Scherf2000; FAO, Reference Rischowsky and Pilling2007a), the specific issue of developing a global indicator (or indicators) for AnGR has come to prominence more recently. The current focus on indicators is the outcome of a series of developments in the intergovernmental fora that address the management of biodiversity and genetic resources for food and agriculture.
As early as 1995, Parties to the Convention of Biological Diversity (CBD) began discussing the need to develop indicators to describe changes in the state and trends of biological diversity as well as progress in the implementation of the CBD at national, regional and global levels. The need for indicators became more urgent following the adoption of the Strategic Plan of the CBD in 2002 and its 2010 Biodiversity Target “to significantly reduce the current rate of biodiversity loss at the global, regional and national level” (CBD, 2002). Work on indicators was therefore stepped up. It was concluded that because of the complexity of biodiversity, incomplete taxonomic knowledge and the high costs of assessments, most biodiversity monitoring should be based on a small number of indicators for which data are available or could be acquired in a cost-effective manner. This practical approach led Parties to endorse, at the Seventh Conference of the Parties to the CBD (COP) in 2004, a limited number of trial indicators to be used to assess global progress towards the 2010 Biodiversity Target and to communicate trends in biodiversity related to the three objectives of the Convention (Decision VII/30, CBD, 2004). At the following COP, held in 2006, Parties established institutional responsibilities for finalizing potential indicators (Annexure V of decision VIII/15; CBD, 2006). FAO was given responsibility for coordinating the delivery of all indicators describing trends in major components of agricultural genetic diversity (genetic resources for food and agriculture).
The process of indicator development was given added impetus by the establishment of the 2010 Biodiversity Indicators ProjectFootnote 1 (acknowledged by COP Decision VIII/15). The project includes a component (in which FAO is the “key partner”) that addresses indicator development in the field of “genetic diversity of terrestrial domesticate animals”, which falls under the CBD headline indicator “trends in genetic diversity of domesticated animals, cultivated plants, and fish species of major socioeconomic importance”.
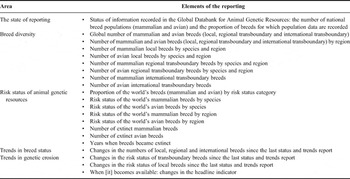
In parallel to developments at the CBD, the GPA was endorsed by the 2007 FAO Conference. The GPA notes that it will be necessary periodically to assess the status and trends of AnGR and that “the Commission on Genetic Resources for Food and Agriculture should regularly receive, from countries, status and trends reports on national animal genetic resources and factors influencing change, in order to review progress and further develop country-based early-warning and response systems for animal genetic resources” (FAO, 2007b, 2007d). As a follow-up, the FAO Commission on Genetic Resources for Food and Agriculture (CGRFA), at its 11th Regular Session, requested that the Intergovernmental Technical Working Group on Animal Genetic Resources (ITWG-AnGR) provide recommendations on the form and content of future status and trends reports on AnGR and options for responding to the identification of breeds at risk (FAO, 2007c). The recommendations of the ITWG-AnGR (FAO, 2009c) were adopted by the CGRFA at its 12th Regular Session in 2009 (FAO, 2009d). Table 1 shows the contents of the status and trends reports as agreed upon by the CGRFA. It can be seen that trends in genetic erosion were to be described, in line with the previous global assessment presented in The State of the World's Animal Genetic Resources for Food and Agriculture (FAO, Reference Rischowsky and Pilling2007a), in terms of changes in the risk status of breeds reported to the Domestic Animal Diversity Information System (DAD-IS). It is well recognized that breed risk-status figures do not provide a full picture of the state of genetic diversity. They do not account for the fact that some breeds are genetically more diverse than others or for the effects of genetic dilution caused by uncontrolled cross-breeding (FAO, Reference Rischowsky and Pilling2007a). The risk-status trend figures were to be complemented by the (as yet undefined) CBD headline indicator once it became available.

The background to recent efforts to develop AnGR indicators is therefore: a mandate from the CBD for the development of an indicator of “trends in genetic diversity”; a mandate from the CGRFA for this indicator to be included in biennial status and trends reports on AnGR; and an absence of mechanisms to monitor genetic diversity per se as opposed to proxies based on the risk status of breed populations.
What is an indicator?
According to OECD (2003b), an indicator is a parameter or a value derived from parameters that points to, provides information about or describes the state of a phenomenon/environment/area and that has significance that extends beyond that directly associated with a parameter value. Indicators should serve four basic functions: simplification, quantification, standardization and communication. They summarize complex and often disparate sets of data. They should be based on comparable scientific observations or statistical measures, and be developed using standardized methodology. They should also provide a clear message that can be communicated to, and used by, decision-makers and the general public (CBD, 2003c). Baldi (Reference Baldi2001) offers the following definition: “An indicator can be defined as something that helps us to understand where we are, where we are going and how far we are from the goal. Therefore, it can be a sign, a number, a graphic and so on. It must be a clue, a symptom, a pointer to something that is changing. Indicators are presentations of measurements. They are bits of information that summarize the characteristics of systems or highlight what is happening in a system”.
Indicators can be single parameters, sets of individual parameters presented together or indices constructed using several parameters. They can be used at various levels: local, national, regional and international. At the local level, indicators are often used for research purposes or to monitor changes in specific habitats and ecosystems and provide an assessment of various aspects of the local environment. At the national level, indicators are important for planning, policy development and programme priority setting, as well as for raising awareness (OECD, 2003b). At the international level, indicators are used to describe the state of the environment and progress towards environmental goals, either regionally or globally.
The objective of using biodiversity indicators is often to build a bridge between policy-making and science. The role of policy-makers is to create a vision, a set of objectives and measurable targets. The task of scientists is to identify relevant biodiversity variables and develop models and tools that will support monitoring of the current state of biodiversity and projections of future trends. These two dimensions are not easy to merge (Levrel, Reference Levrel2007). The policy dimension requires indicators that are comprehensible to a large non-expert audience. Conversely, to the scientist, an indicator must be methodologically sound and amenable to unambiguous interpretation.
What makes a good indicator?
Various criteria for evaluating the quality of potential indicators have been proposed. OECD (1993) lists the following three key quality criteria: political relevance and utility for users; analytical soundness/robustness; and measurability. According to CBD (2003a, 2003c), indicator sets should recognize the target audiences, and should be ecosystem and policy relevant, simple and easily understood, quantitative, scientifically credible, normative (allowing comparison with a baseline situation and policy target), responsive to changes in time and space, cost effective and unambiguously useable for future projections, allowing aggregation at the level of ecosystem/habitat types or nationally and possibly internationally. The CBD's Subsidiary Body on Scientific, Technical and Technological Advice, at its ninth meeting, decided on seven principles for choosing and evaluating indicators (CBD, 2003a) – indicators should
• be policy relevant and meaningful (provide clear messages at appropriate levels);
• be biodiversity relevant;
• be scientifically sound;
• have broad acceptance;
• enable affordable monitoring;
• enable affordable modelling;
• be sufficiently sensitive, i.e. they should be able to show trends and, where possible, permit distinction between human-induced and natural changes. They should not only be able to detect changes in systems in relevant time frames and scales but also be sufficiently robust so that measuring errors do not affect their interpretation.
A set of indicators should preferably be small in number, in order to be more easily communicable to policy-makers and the public, and to lower the costs involved. Indicators should be designed in a manner that facilitates aggregation at a range of scales. Aggregation at the level of ecosystem types or at national or international levels requires the use of coherent indicator sets and consistent baselines (CBD, 2003a).
What can we learn from previous initiatives?
The indicator concept has been used more widely in the field of wildlife biodiversity than in AnGR management. The most often used biodiversity indicator is species richness, which is the number of species present in a given area (ecosystem, country, etc.) or in the biosphere as a whole (Levrel, Reference Levrel2007). Species diversity, however, comprises not only the number of species but also their relative abundance; i.e. a population that is dominated by a few, very common, species is less diverse than one in which the species abundance is more equally distributed (ibid.). Indices such as those of Shannon and Simpson combine species richness and relative abundance into a single figure (Shannon, Reference Shannon1948; Simpson, Reference Simpson1949). As an indicator of trends in the state of biodiversity, species richness is rather inadequate. Richness only falls when one or more species become extinct. Relative abundance is a more sensitive indicator. A change in relative abundance is often a sign that an ecosystem has been disturbed in some way (e.g. as a result of overharvesting or pollution). Clearly, substantial declines in the abundance of individual species are also a matter of concern; they indicate that if trends continue, the species in question may face extinction and that the overall diversity of the population will decline. Many species-level indicators of wild biodiversity are calculated on the basis of trends in the abundance of a set of species. Examples include the living planet index, the wild bird index and mean species abundance (MSA; see further discussion below). Red list indices are calculated based on the number of species falling into risk-status categories, assigned on the basis of their abundance, distribution and trends (Butchart et al., Reference Butchart, Stattersfield, Bennun, Shutes, Akçakaya, Baillie, Stuart, Hilton-Taylor and Mace2004). Indicators of wild biodiversity include descriptors not only of species diversity but also of ecosystem diversity. Ecosystem-level indicators normally focus on the extent of particular habitats, such as forests, mangroves or coral reefs. Genetic diversity within wild species generally receives little attention in terms of indicator development (Laikre et al., Reference Laikre, Allendorf, Aroner, Baker, Gregovich, Hansen, Jackson, Kendall, McKelvey, Neel, Olivieri, Ryman, Schwartz, Short Bull, Stetz, Tallmon, Taylor, Vojta, Waller and Waples2010).
Although, as described above, breed diversity does not adequately reflect the underlying genetic diversity in a livestock population, the breed is commonly the unit in which AnGR diversity is discussed. It is generally accepted that the extinction of a breed represents an unwelcome loss of genetic options for the future, as does the loss of within-breed genetic diversity that occurs when breed populations decline to low levels or experience increased inbreeding levels owing to the excessive use of a limited number of sires. Indicators based on richness, abundance and extinction risk at breed level present a clear message that potentially valuable resources are being, or are in danger of being, lost. The status and trends of AnGR have often been described in such terms (FAO, 2009a and other examples described below). Indicators that incorporate the concept of relative abundance signal that the composition of the population is changing, but do not provide such an unambiguous message to policy-makers as those that are based on risk status. While a more even pattern of breed abundance may be desirable in some respects, it is not clear that a livestock population that is becoming less even in its breed composition is necessarily being mismanaged. It is still less clear that maximizing a specific index such as that of Shannon or Simpson is an appropriate objective.
In the environmental field, many indicators have been developed within the Pressure-State-Response framework (OECD, 1993, 2003a, 2003b). This framework distinguishes three types of indicators: pressure indicators, which describe pressures imposed on the environment by human activities; state indicators, which describe the current quality or condition of the environment; and response indicators, which describe responses to environmental changes and concerns. A more detailed framework, Driving force–Pressure–State–Impact–Response, has been used in various projects that have developed environmental indicators (EEA, 1999; EC, 2000). The definitions used to describe the various elements of these frameworks are not always appropriate to the AnGR context. However, the basic distinction between pressures, states and responses may be useful. Indicators of the “state” of genetic diversity (or proxies such as breed diversity and risk status) might be complemented by indicators of “pressure” (e.g. extent of economic growth and market integration; extensification, intensification or homogenization of production systems; utilization of modern technologies; or the number of breeding goals) and indicators of response (e.g. the state of conservation programmes or the implementation of measures to support the sustainable use of AnGR).
Since the late 1990s, a number of international organizations have been actively engaged in developing biodiversity indicators covering a range of issues including agricultural impacts on soil, water, air, biodiversity, habitats and landscapes. Key contributors to the development of agrobiodiversity indicators include the Organisation for Economic Co-operation and Development (OECD) (OECD, 1999a, 1999b, 2001, 2008); the European Topic Centre on Biological Diversity of the European Environment Agency (EEA) (EEA, 2005, 2007, 2009a, 2009b); the European Regional Focal Point for Animal Genetic Resources (Charvolin, Reference Charvolin2007, Reference Charvolin2008); and the United Nations Environment Programme's World Conservation Monitoring Centre (Bubb, Jenkins and Kapos, Reference Bubb, Jenkins and Kapos2005). There have also been project-based initiatives such as Global Methodology for Mapping Human Impacts on the Biosphere (GLOBIO) (Alkemade et al., Reference Alkemade, van Oorschot, Miles, Nellemann, Bakkenes and ten Brink2009; www.globio.info), and research undertaken by the scientific community.
In the field of AnGR diversity, major inputs were provided by the Institute of Organic Agriculture, University of Bonn, Germany (Wetterich, Reference Wetterich2003); Wageningen University and the Centre for Genetic Resources in the Netherlands (Eaton et al., Reference Eaton, Windig, Hiemstra, van Veller, Trach, Hao, Doan and Hu2006; Hiemstra et al., Reference Hiemstra, Eaton, Trach, Hao, Doan and Windig2006; Buiteveld et al., Reference Buiteveld, van Veller, Hiemstra, ten Brink and Tekelenburg2009); and Scottish Agricultural College and Roslin Institute, United Kingdom (Villanueva et al., Reference Villanueva, Sawalha, Roughsedge, Rius and Woolliams2009a, Reference Villanueva, Sawalha, Roughsedge, Rius-Vilarrasa and Woolliams2009b). This work that focused specifically on indicator development had been preceded, not only by the earliest of the above-mentioned global assessments of AnGR diversity but also by a number of regional initiatives in the assessment of the state and trends of AnGR in Europe. The first such assessment was initiated across Europe in 1980 (Maijala et al., Reference Maijala, Cherekaev, Devillard, Reklewski, Rognoni, Simon and Steane1984) stimulated by the FAO/UNEP Technical Consultation on AnGR Conservation and Management (FAO, 1981). The Working Group on AnGR of the Commission on Animal Genetics of the European Association for Animal Production, organized in 1982, 1985 and 1988, three successive surveys on European livestock breeds of cattle, sheep, goats and pigs, with the participation of 22, 17 and 12 countries, respectively (Simon and Buchenauer, Reference Simon and Buchenauer1993). The European Animal Genetic Data Bank (AGDB) at Hannover Veterinary University (TIHO) was established during the 1980s.
In 2001, the OECD proposed the following set of indicators to monitor the diversity of crop varieties and livestock used in agricultural production (OECD, 2001):
1. For the main crop/livestock categories (e.g. wheat, rice, cattle and pigs) the total number of crop varieties/livestock breeds that have been registered and certified for marketing.
2. The share of key crop varieties in total marketed production for individual crops (e.g. wheat, rice and rapeseed).
3. The share of the key livestock breedsFootnote 2 in respective categories of livestock numbers (e.g. the share of Friesian, Jersey, Charolais in total cattle numbers).
4. The number of national crop varieties/livestock breeds that are endangered.
This indicator set in theory provides quite a comprehensive description of the state of breed diversity. For each livestock species covered, it includes a measure of breed richness, a measure of relative abundance and a summary measure of the abundance of individual breeds. However, a few problems should be noted. With respect to the breed richness figures, apart from the possibility that they change simply because of changing rules and procedures for registering and certifying breeds, there is no means of distinguishing changes that arise because of imports of new breeds from abroad (or abandonment of efforts to introduce a new breed) from changes to the existing “native” population (e.g. extinctions). The abundance of the three commonest breeds relative to the whole population gives some indication of the homogeneity of the population in terms of its breed composition. However, it should be recalled that the relative abundance of breeds in a national population is likely to be affected by the relative extent of the production systems and environments to which they are adapted, which in turn is affected, inter alia, by the significance of industrial production systems and the diversity of the country's geography. There is no “ideal” breed rank abundance curve that is appropriate for all countries. The indicator is also vulnerable to gaps or inconsistencies in the reporting of population figures (e.g. how cross-breeds are accounted for) and does not reveal whether the three dominant breeds are native or non-native. Finally, no basis for estimating the endangerment status was specified by the OECD. Some of these problems were recognized by Wetterich (Reference Wetterich2003) who proposed that OECD indicators 1 and 3 be modified in order to allow native breeds to be distinguished from non-native breeds, indicator 4 should cover native breeds and endangerment status classification should be standardized based on the work of Bodó (Reference Bodó and Hodges1992). Wetterich (Reference Wetterich2003) also proposed two additional indicators, as follows:
1. Frequency of application of high-selective breeding methods in the species concerned. The argument for including this indicator is based on the assumption that artificial insemination and embryo transfer will, respectively, decrease the number of sires or parents of successive generations, and therefore will lead to a reduction of within-breed diversity. This effect has, indeed, been observed especially in high-performing international transboundary breeds. However, if the application of modern reproduction methods is evaluated only at the species level, it will not reflect the situation of particular breeds. Moreover, it is doubtful whether hybrid breeding in pigs should be included in the calculations (ibid.), as this aspect of breeding is purely commercial and terminal and, as such, the animals do not contribute to future pure-bred populations. It should also be noted that this indicator is in conflict with credible strategies for genetic improvement and germplasm utilization.
2. Number of breeders' associations. The argument for including this indicator is based on the assumption that each association manages its own breeding programme, and therefore the number of officially accredited breeders' associations within a given species provides a measure of the number of independent breeding populations and breeding schemes. If this is the case, a decline in the number of breeders' associations implies that populations are being merged and that common breeding goals and higher selection intensity are being applied, with the long-term consequence that the risk of genetic erosion increases. This indicator may work well for some countries (e.g. Germany) but will not necessarily enable similar conclusions to be drawn in other countries. Not all breeders' associations are organized at the breed level. Sometimes they have regional structures and provide services to all breeders of a particular species or sector of production (e.g. dairy or beef) regardless of the specific breed they keep. New breeding organizations may be established following the import of exotic breeds. Moreover, a single breeding organization can ensure that a breed is bred in a sustainable way and that within-breed genetic diversity is maintained: the Norwegian Red cattle breed is an example (FAO, Reference Rischowsky and Pilling2007a). A modified version of this indicator, such as “number of breeds represented by a breeders' organization” or “share of breeds represented by a breeders' organization,” might be more widely applicable.
The distinction between native and non-native breeds has been included in a number of proposed indicators (see further examples below). Several distinct motives for this inclusion can be identified. As mentioned above, it prevents indicators based on national trends in breed richness from being distorted by imports. Moreover, Wetterich (Reference Wetterich2003) argues that countries have a greater responsibility for ensuring that their native breeds do not become extinct than for ensuring the survival of breeds from elsewhere. A less prescriptive way of putting this is that countries are more likely to be concerned about, and take responsibility for, breeds that are locally adapted and/or considered a part of their national heritage (although the costs involved may mean that this is not the case everywhere). Countries may therefore be interested in having indicators that allow these breeds to be distinguished. From an international perspective, the decline of breeds in their native countries shows that the breeds are no longer thriving “in situ” in their production systems of origin and in the countries where they are most likely to be valued and conserved. An additional argument is that the diversity of the native breed population can be expected to be more genetically diverse than the non-native, which will usually be dominated by a limited number of intensively selected breeds. Finally, it can be argued that the balance between native and non-native breeds is an indicator of the extent of a country's self-sufficiency in meeting its needs for AnGR.
The IRENA operation (Indicator Reporting on the Integration of Environmental Concerns into Agriculture Policy) coordinated by the EEA, aimed to further develop agri-environmental indicators for monitoring the integration of environmental concerns into the Common Agricultural Policy of the European Union (EU) (EEA, 2005). The operation, conducted between 2002 and 2005, led to the development of a set of 35 indicators, which included two indicators related to biodiversity and one addressing genetic diversity. The latter was defined as the number and range of crop varieties and livestock breeds and was divided into three subindicators, two of which focused on animals (IRENA, 2002):
• IRENA 25-2: Diversity of breeds in the total livestock population for different types of livestock (cattle, pigs, sheep, goats and poultry).
• IRENA 25-3: Distribution of the risk status of national livestock breeds in agriculture.
Breed diversity (IRENA 25-2) was calculated as the number of breeds divided by the total livestock population for the main livestock categories (cattle, pigs, sheep, goats and poultry) that are registered in the herd-books in individual EU countries and reported to FAO. A problem with this indicator is that if the total species population falls, “diversity” will appear to rise even if many breeds have slipped towards extinction. It is also based on the assumption that herd books and breeding societies are in place for each breed. The IRENA 25-3 indicator summarized the risk status of national livestock breeds for the main livestock categories. It was estimated using national data included in DAD-IS in July 2003. The indicator utilized only the three following categories: (1) extinct; (2) endangered or critical; and (3) not at risk or unknown. This approach was too simplistic: in particular, combining breeds categorized as not at risk and breeds with no population data was likely to lead to misleading conclusions.
To ensure a coherent approach to the development of indicators at the European level, the EU launched the SEBI2010 project (Streamlining European 2010 Biodiversity Indicators) (EEA, 2007). This Pan-European initiative aimed to develop a European set of biodiversity indicators to assess and provide information on progress towards the European 2010 target to halt biodiversity loss (SEBI2010, 2009a, 2009b, 2009c). The project resulted in the establishment of a set of 26 indicators, nested within seven focal areas (EEA, 2007). Within the focal area: “Status and trends of the components of biological diversity”, the indicator of “livestock genetic diversity” was defined as “the share of breeding female population between introduced and native breed species (namely, cattle and sheep) per country, as a proxy to assess the genetic diversity of these species”.
The indicator also shows the proportion of native breeds that are endangered due to the low number of breeding females (EEA, 2007). Definitions of endangerment levels and native versus non-native breed status are based on countries' own criteria (i.e. are not consistently defined across all countries). Initial calculations of this indicator were based on existing data for 1995, 2000 and 2005 (±2 years). The indicator was calculated for cattle and sheep only.
As described above, there are several reasons why distinguishing native from non-native breeds may be useful. Nonetheless, the share of population made up of native breeds does not, in itself, indicate very clearly whether or not there is actually a significant problem of diversity loss that needs to be addressed. The practical impact of this element of the indicator as a guide for policy-makers can particularly be questioned in circumstances where increasing the proportion of non-native breeds in the national population is the most feasible means of meeting the rising demand for animal products.
In contrast, the other element of the indicator – proportion of native breeds that are endangered – does indicate the presence of specific problems. However, the indicator requires that good risk-status statistics are available, which globally is not yet the case. Moreover, it is not necessarily a good indicator of progress, because if a breed becomes extinct, the percentage of the endangered breeds will go down and the indicator will show a positive trend. The latter problem might be addressed by adding an additional category: “proportion of native breeds that are extinct”.
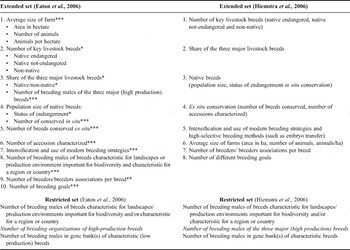
Two studies conducted by a team from the Centre for Genetic Resources (CGN) and Wageningen University, the Netherlands, in collaboration with partners from Viet Nam, built on the above-described OECD and Wetterich indicators and developed and tested further sets of indicators (Eaton et al., Reference Eaton, Windig, Hiemstra, van Veller, Trach, Hao, Doan and Hu2006; Hiemstra et al., Reference Hiemstra, Eaton, Trach, Hao, Doan and Windig2006). The extended and restricted sets of indicators that emerged from these studies are shown in Table 2. Having tested these new indicator sets and a number of already available sets (CBD, OECD, Wetterich) against four OECD evaluation criteria: policy relevance, analytical soundness, measurability and interpretation, the authors of these studies concluded that no single set of indicators had outstanding overall scores in comparison with the others. In other words, the conclusion was that there would be trade-offs between certain aspects of indicator quality and feasibility in use. One thing to note about the lists of indicators shown in Table 2 is that they include not only indicators of the “state” of diversity (richness, relative abundance, risk status, etc.) but also some indicators that describe the production environment (farm size, etc.), and some that describe the state of responses to the loss of diversity (e.g. the quantity and quality of conservation programmes).
Sets of indicators proposed by Eaton et al. (Reference Eaton, Windig, Hiemstra, van Veller, Trach, Hao, Doan and Hu2006) and Hiemstra et al. (Reference Hiemstra, Eaton, Trach, Hao, Doan and Windig2006).

Note: the asterisks indicate the original proposers of the respective indicators: * = OECD (2001/2003a); ** = Wetterich (Reference Wetterich2003); *** = Eaton et al. (Reference Eaton, Windig, Hiemstra, van Veller, Trach, Hao, Doan and Hu2006); *** = Hiemstra et al. (Reference Hiemstra, Eaton, Trach, Hao, Doan and Windig2006).
Another study carried out by the CGN in cooperation with the Netherlands Environmental Assessment Agency was part of a project aiming to widen the analytical scope of GLOBIO3 – Modelling Global Biodiversity (Buiteveld et al., Reference Buiteveld, van Veller, Hiemstra, ten Brink and Tekelenburg2009). The objective of this project was to identify a number of key biodiversity indicators for crops and livestock, with the ultimate goal of using them in modelling global trends and possible changes in agrobiodiversity. Case studies were undertaken to test selected indicators using data from the Netherlands and Germany. The main novelty in this study was the use of an indicator referred to as mean variety abundance (MVA) which had been suggested by Hiemstra (Reference Hiemstra2007; cited in Buiteveld et al., Reference Buiteveld, van Veller, Hiemstra, ten Brink and Tekelenburg2009). MVA is an adaptation of MSA, which is used as an indicator in the field of wild biodiversity (Alkemade et al., Reference Alkemade, Bakkenes, Bobbink, Miles, Nellemann, Simons, Tekelenburg, Bouwman, Kram and Klein Goldewijk2006). The distinctive feature of MSA is that it compares current biodiversity with the state of biodiversity at a point in the past considered to represent a “natural” or low impacted state. “Exotic” species, which were not present in the natural state, are not included in the calculations. Similarly, the MVA as applied to livestock breeds is based on the abundance of native breeds relative to their original abundance. The baseline could, for example, be 1950 (“pre-intensification times”) (Buiteveld et al., Reference Buiteveld, van Veller, Hiemstra, ten Brink and Tekelenburg2009) or 1850 (“pre-industrial times”) (CBD, 2003b). One practical advantage of this indicator is that it is based on a fixed set of breeds. Therefore, trends cannot be distorted by the import of additional breeds from outside or by a reclassification of breeds between categories, as can happen with breed richness-based indicators and those that classify breeds according to their current distribution. Conversely, the indicator provides no information about the diversity of recently introduced breeds (commonly the high-output transboundary breeds). The indicator is also very demanding in terms of the baseline data required: i.e. an accurate description of the state of the population at some quite distant point in the past. For the countries covered by the Buiteveld et al. (Reference Buiteveld, van Veller, Hiemstra, ten Brink and Tekelenburg2009) study, a baseline around 1950 captured the beginning of a period of rapid intensification and technological innovations, such as artificial insemination. The assumption was that before 1950 only local breeds were kept. The pre-industrial baseline (1850) proposed by the CBD would refer to the state of traditional agriculture before industrialization (CBD, 2003b).
Further work on indicators has been carried out by the UK Biodiversity Partnership, which in 2007 agreed on 18 indicators and 33 component measures to summarize some of the key priorities for biodiversity in the United Kingdom. One of these indicators addresses genetic diversity in native sheep and cattle breeds (Defra, 2009b). Within-breed genetic diversity is described in terms of the effective population size (N e). The indicator was defined as the species average population size (N e) for the lower tail (20 percent) of the distribution of N e across breeds. The strengths of this indicator include the fact that it addresses genetic variation within breeds and focuses on the breeds that are most at risk (Villanueva et al., Reference Villanueva, Sawalha, Roughsedge, Rius and Woolliams2009a, Reference Villanueva, Sawalha, Roughsedge, Rius-Vilarrasa and Woolliams2009b). The evaluation covered the period from 2001 to 2007. The results were presented in a graphic form that was easy to communicate to the public (Defra, 2009a). The application of such an indicator is dependent on the availability of the relevant data. In the United Kingdom, the relevant data were obtained for 53 percent of sheep breeds and 58 percent of cattle breeds considered to be native to the country. The figures were calculated on the basis of pedigree data for individual animals or, in the case of breeds where these data were not available, of the numbers of male and female breeding animals used each year, the numbers of years of active breeding for males and females, proportions of breeding males and females remaining in the herd/flock from one year to the next and the number of offspring per dam surviving to breeding age (Villanueva et al., Reference Villanueva, Sawalha, Roughsedge, Rius and Woolliams2009a).
In summary, initiatives in the development of indicators for AnGR diversity have largely been restricted to Europe and reflect the characteristics of AnGR management in this region. They all require that the animal population be assigned to distinct breeds: something that is relatively easy in Europe with its long tradition of breed societies, but which is far less so in many other parts of the world. Indicators that are based only on herd-book breeds, or breeds that are registered or certified, are even less feasible to implement globally. The same is true for indicators that require detailed pedigree data or detailed records of the past characteristics of livestock populations (while herd books and official statistics are not the only potential source of such data – local livestock keepers and breeders are often very knowledgeable – compiling regularly updated national indicators based on these alternative sources would be extremely challenging if not impossible). A further lesson is that indicators that involve classifying breeds need to be carefully defined if they are to meet the criterion of providing decision-makers with clear and unambiguous information. Problems may arise, for example, if indicators used for international summaries or comparisons are based on national statistics that use different definitions of risk status or native-breed status. Indicators of trends over time may be distorted if, for example, countries' rules allow for additional breeds to be added to the native category (e.g. breeds previously unrecognized by national authorities that are “discovered” among “non-descript” populations when breed surveys are conducted or composites of native breeds that newly meet the criteria for inclusion). Care is also needed to ensure that indicators are not unduly affected by other minor changes that may have little policy significance, such as the import of a small number of animals from exotic breeds that were previously not present in the country (increases total breed richness).
What data are available?
Plans for a global indicator have to take into account the constraints imposed by the limited availability of data on a global scale. At present, the only AnGR information system that has global coverage and includes a standardized set of fields for recording demographic data is DAD-IS (and associated FABISnet systems). The basic unit for recording demographic data in DAD-IS is the national breed population. If breed populations in different countries are considered to be part of a common gene pool, they are linked within the system and treated as part of a so-called “transboundary” breed. Breeds that are present in only one country are described as “local”. The unit for supranational (regional or global) analyses is therefore the breed. It is possible to break such analyses down by distributional category (local vs. transboundary). However, it is important to understand that these categories were developed in order to avoid double-counting in global statistics, not as a means of distinguishing whether or not breeds are “native” or “locally adapted” to particular countries.
If DAD-IS is the source of data, it follows that a global indicator of genetic diversity will have to be based on the breed as a unit of analysis. The global indicator will therefore not solve the above-described problems, such as the absence of a method to describe the effects of indiscriminate cross-breeding or the difficulty involved in assigning many animal populations in developing countries to specific breeds.
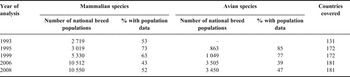
The breed inventory available in DAD-IS allows basic breed richness statistics to be calculated at national, regional or global levels. However, indicators based on abundance or on risk status also require that the size (and preferably the structure) of the populations be recorded. In 2008, 48 percent of mammalian national breed populations and 53 percent of avian national breed populations recorded in DAD-IS had no population data recorded (Table 3). Only 64 percent of breeds could be assigned to a risk-status category (FAO, 2009b).
Status of information recorded in the Global Databank for Animal Genetic Resources.

Source: FAO (2009b).
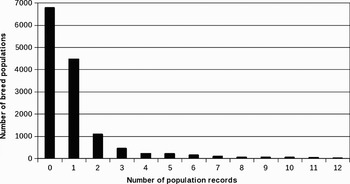
Indicators can only illustrate trends if the data on which they are based are recorded repeatedly over time. FAO initiated collecting breed data for some species in some countries in 1987 and on a world scale in 1991/1992 (FAO/UNEP, Reference Loftus and Scherf1993). Countries are encouraged to update their breed population records frequently and to enter whatever “historical data” (population figures from earlier years) that they have available. Table 3 shows that the number of breeds and the number of population records has increased over the years, but Figure 1 shows that the number of breeds for which a time series of population data is available is very limited.
Number of population records available for the breeds recorded in DAD-IS.

Issues and problems in developing a global indicator
An expert workshop on indicators took place in Rome in February 2010 with the objective of providing recommendations on livestock genetic diversity indicators. The workshop recognized the limitations of breed-based analysis, but also that there was no feasible alternative to basing the indicator on data from DAD-IS. A number of “candidate indicators” were discussed. The workshop decided that global indicators similar to the SEBI indicators described above (share of native and non-native breeds in national populations, complemented by a summary measure of breed risk status) would be desirable. However, it was recognized that the existing local versus transboundary breed classification in DAD-IS could not be used for this purpose (see the previous section). The workshop therefore recommended that a new native versus non-native classification should be developed and implemented in DAD-IS. The workshop also decided that once a native versus non-native classification is available, it would be worthwhile calculating national breed richness figures for native breeds as a basic indicator of diversity.
The workshop considered the range of species that might be covered by the indicators. It was agreed that the following 14 species and groups of species should be included: asses, buffalo, cattle and yaks, camels, goats, horses, llamoids, pigs, rabbits, sheep, chickens, ducks, geese and turkeys: in total 13 mammalian and four avian species. Although it would involve producing a large number of different statistics, the workshop decided that separate indicators for each species are needed because of the diverse nature of the production and breeding systems under which different species are kept.
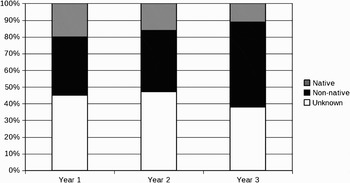
A number of problems have to be resolved before the suggested indicator set can be implemented. Apart from the above-mentioned need to develop an additional breed classification system (which will have to be applicable globally and acceptable to the countries that supply DAD-IS data), an indicator based on the share of the population accounted for by native and non-native breeds requires a complete set of population data (all breeds). Missing data for a single abundant breed could heavily distort a country's indicators. It was proposed that the problem be addressed by adding a third population category to cover animals that do not belong to a breed for which population data are available in DAD-IS. See Figure 2 for an example of how the indicator could be presented in graphical form. The number of animals in the “unknown” category obviously cannot be obtained from DAD-IS. However, it may be possible to calculate this figure indirectly by subtracting the number of known native and non-native animals from the total population size for the respective species recorded in FAO's statistical database (FAOSTAT) for the relevant years. The feasibility of combining the two data sources needs to be evaluated before the indicator can be finalized. It will not be possible to calculate the indicator for species to which the categories in DAD-IS and FAOSTAT do not correspond.
Illustration of the proposed indicator based on population share.

The main practical problem associated with an indicator based on risk-status figures is the lack of regular updating of population data in DAD-IS (Figure 1 and Table 2). The CGRFA has requested status and trends reports on AnGR every 2 years. However, without regular updates the reports will be of little value. In fact they may give a false impression of stability in the status of AnGR or fail to indicate recent changes in the direction of trends. The workshop discussed the possibility of calculating trends based only on breeds for which a genuine trend can be calculated, i.e. for which two recent population figures have been reported (e.g. one within the last 2 years and another within the last 4 years). However, it was recognized that given the current rate of population-data updating in DAD-IS there would be little to report if such strict criteria were imposed. Another alternative considered was that after a given period of time (e.g. 10 years), if no new population data are reported, breeds should revert to “unknown” risk-status classification.
Conclusions
No global indicator for genetic diversity per se can be calculated at present. Development of a sound, a methodologically rigorous indicator of genetic diversity might require for instance a global estimate of an effective number of breeds in each species weighted by their within-breed diversity (based on the estimation of the N e). However, with the information we have today it is a challenge that is impossible to meet and this is likely to remain the case for the foreseeable future.
It is possible to provide summaries of the risk statuses of breeds, and it may be feasible to describe the relative abundance of different categories of breeds (e.g. native and non-native). However, the usefulness of indicators based on these measures, would be affected by the large gaps that currently exist in the availability of data. Monitoring trends is even more problematic. Countries' updates of their breed population data in DAD-IS remain far too infrequent to allow global trends to be calculated accurately on the 2-year reporting cycle requested by the CGRFA.