Introduction
Neurons in area V1 generally fire a burst of action potentials when an optimal stimulus is first presented, and the number and/or timing of spikes is thought to be the basis of visual perception. It is, therefore, noteworthy that many V1 neurons also increase their firing rate when a stimulus is turned off. We refer to these transients, which occur when a stimulus within the receptive field (RF) is terminated, as “termination responses” or simply TRs. Such TRs have been examined in several studies looking at their stimulus-duration dependence (Duysens et al., Reference Duysens, Schaafsma and Orban1996; Macknik & Livingstone, Reference Macknik and Livingstone1998; Macknik & Martinez-Conde, Reference Macknik and Martinez-Conde2004; Li et al., Reference Li, Jiang and Wang2012), their existence in simple vs. complex cells (Liang et al., Reference Liang, Shen, Sun and Shou2008), and their role in visual persistence (Duysens et al., Reference Duysens, Orban, Cremieux and Maes1985; Eriksson et al., Reference Eriksson, Tompa and Roland2008) and stimulus visibility (Macknik & Livingstone, Reference Macknik and Livingstone1998).
Previous studies typically quantified termination responses by turning off a stimulus in the RF of a fixating animal. However, the more common situation in natural vision is that a stimulus leaves an RF because the eyes move. As saccades occur several times per second in natural vision and they influence neural responses and perception (Cai et al., Reference Cai, Pouget, Schlag-Rey and Schlag1997; Ross et al., Reference Ross, Morrone and Burr1997; Ruiz & Paradiso, Reference Ruiz and Paradiso2012; Niemeyer & Paradiso, Reference Niemeyer and Paradiso2016), it is important to examine the occurrence of termination responses in situations involving eye movements. Several previous studies reported changes in V1 neural activity around the time of saccades (Purpura et al., Reference Purpura, Kalik and Schiff2003; Rajkai et al., Reference Rajkai, Lakatos, Chen, Pincze, Karmos and Schroeder2008; McFarland et al., Reference McFarland, Bondy, Saunders, Cumming and Butts2015), but they were not designed to quantify termination responses and compare them in conditions with and without saccades. One previous study (Gawne & Martin, Reference Gawne and Martin2002) reported that TRs caused by eye movements were observed in 8 of 22 V1 neurons. However, due to that study’s experimental goals, the authors did not examine responses in the absence of visual stimuli, leaving the possibility that the responses were caused by eye movements rather than the disappearance of the visual stimulus. Furthermore, that study did not examine within-cell differences in TRs when a stimulus left an RF by flash-off vs. saccade. Our study aimed to answer the following questions: (1) Do TRs occur when a stimulus leaves a V1 RF because of a saccade and in what percentage of V1 neurons is this seen? (2) In individual neurons, are TRs different between a fixation condition and a more natural saccade condition? (3) Do TRs occur in the absence of a visual stimulus?
Using a stimulus duration on par with natural fixation periods, our study finds that TRs are observed in a significant percentage of V1 neurons and that TRs have smaller amplitude when stimulus termination results from a saccade rather than a stimulus being turned off during fixation. Importantly, we find that the saccade-induced TRs depend on the disappearance of the visual stimulus and are not simply a consequence of a saccadic eye movement. However, we do find a weak saccade-specific TR when no stimulus is used, as others found with microsaccades (Troncoso et al., Reference Troncoso, McCamy, Jazi, Cui, Otero-Millan, Macknik, Costela and Martinez-Conde2015). We speculate that the weakening of TRs in the saccade condition may be related to saccadic suppression. The results have implications for V1 coding and perception in natural vision.
Materials and methods
Experiments were performed with two male macaques (Monkey F weighed 10.4 kg, Monkey M 10.1 kg). All procedures conformed to the National Institutes of Health guidelines and were approved by the Brown University Institutional Animal Care and Use Committee. In aseptic surgeries, the animals were implanted with a custom titanium headpost and a 96-channel “Utah” array of 1 mm electrodes (Blackrock Microsystems, Salt Lake City, Utah, USA) in area V1 of the right brain hemisphere in Monkey F and left hemisphere of Monkey M.
A Cerebus system (Blackrock Microsystems) recorded spiking activity at 30 kHz while the animals performed the task described below. Single units in area V1 were isolated during each recording session and confirmed later using Offline Sorter (Plexon, Dallas, Texas, USA). Multiunit data were recorded on several occasions when the “unit” had a clearly defined RF. We simultaneously recorded multiple channels when RFs measured on multiple electrodes were overlapping (and thus only one stimulus was presented in the visual field), but no channels were used more than once. Calibrated eye position was monitored at 1 kHz using an Eyelink 1000 infrared eye tracker (SR Research, Ottawa, Ontario, Canada). Prior to the behavioral task (during eye fixation), RF size and location were examined using Gabor stimuli of 80% Michelson contrast.
The stimulus used in the task was a static Gabor patch of 80% contrast on a homogenous gray background of 55 cd/m2. In both animals, the Gabor stimulus was generally set to have a spatial frequency of 1 cyc/deg and horizontal orientation to reduce the amount of luminance change (motion) over the RF produced by horizontal saccades in the eye-off condition. In 21 units of Monkey F, the orientation and spatial frequency of the Gabor stimuli were optimized to see if this altered the results. We found that this had an effect on the average spike rate, but the key differences between test conditions were unaltered. Stimuli were presented in a dimly lit room on a CRT monitor with a P22 phosphor (Iiyama Viewmaster HM204DT, Tokyo, Japan). The resolution was 1280 × 1024 pixels and the refresh rate was 120 Hz. The CRT was placed 63 cm from the subject and subtended 33 deg × 26 deg high. Stimulus presentation and behavioral monitoring were run by the Monkeylogic control system (Asaad et al., Reference Asaad, Santhanam, McClellan and Freedman2013). A photodiode system connected to the Cerebus recording hardware, recorded at 10 kHz, was used to confirm the timing and duration of visual stimuli.
V1 spiking activity and eye position were analyzed with custom MATLAB scripts. Analysis was performed on 35 units from Monkey F and 37 units from Monkey M. In each eye movement trial, the saccade start was defined as the point at which eye velocity reached 4.5% of the peak velocity. This objective criterion was chosen after manually examining eye traces to determine when a clear start of the saccade had begun, ensuring that this time would be comparable to the point at which the stimulus disappeared in the flash-off condition. Unless otherwise stated, all statistical values come from two-way t-tests (α = 0.05) performed on average spike rates or peak responses between conditions.
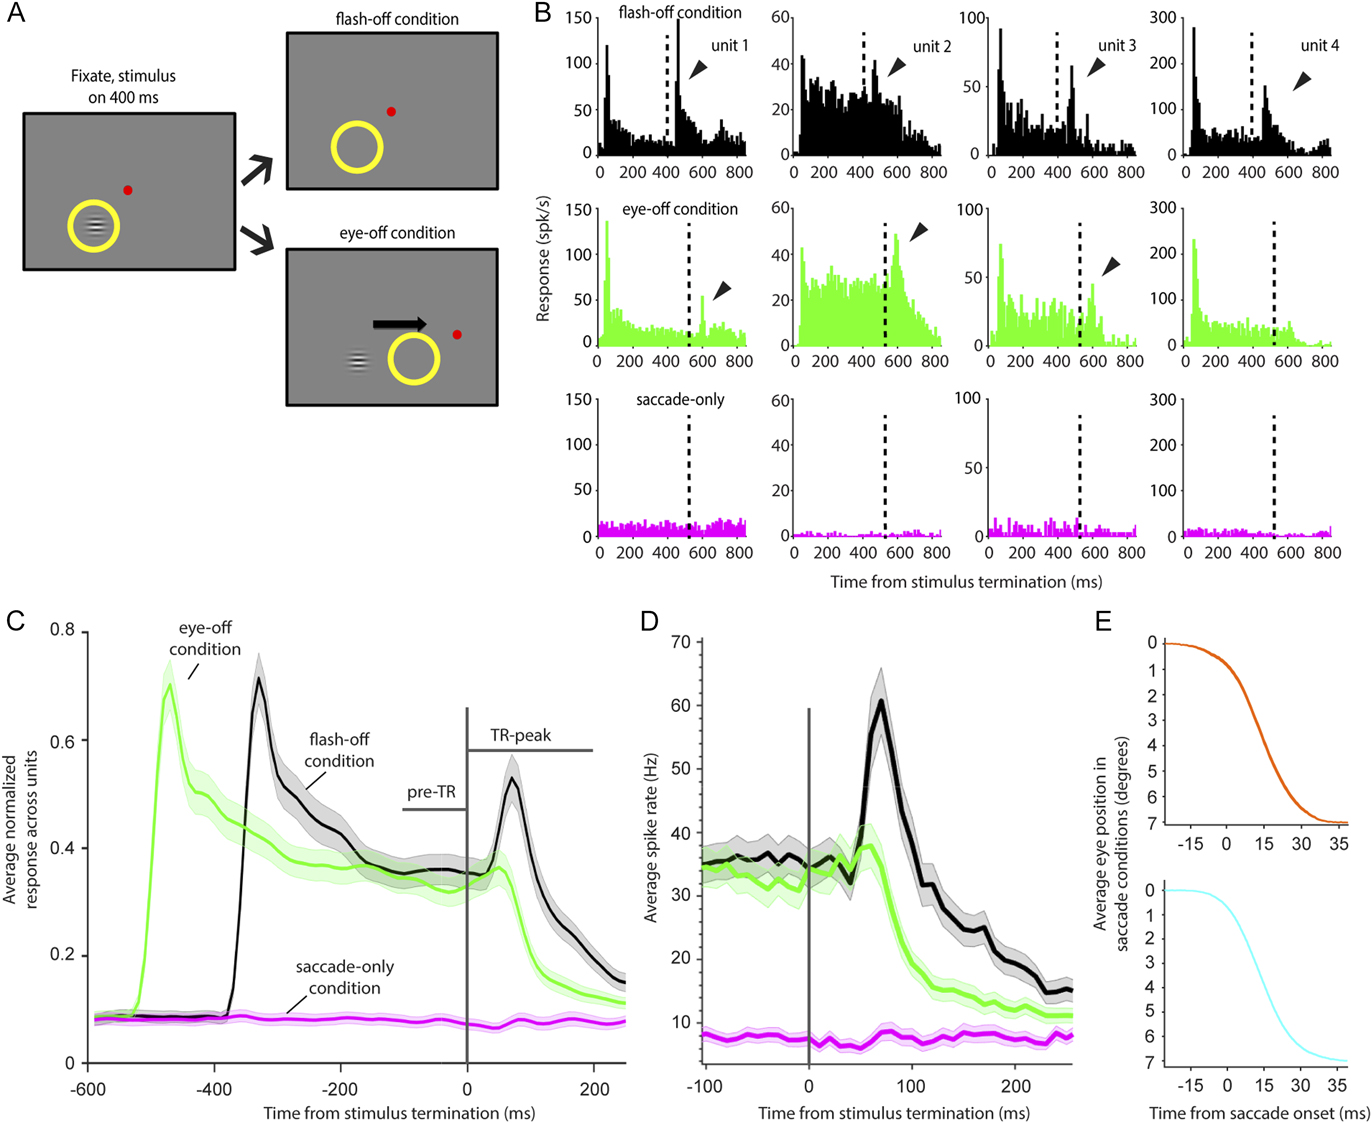
Three experimental conditions were randomly interleaved (∼50 trials per condition), two of which involved visual stimulation of the RF (Fig. 1A). The two visual-stimulation conditions started with presentation of a central fixation point. If fixation was maintained for 200 ms, a Gabor stimulus was presented in the RF. Visual stimulation ended in one condition by turning off the Gabor stimulus after it had been displayed for 400 ms (flash-off condition). In the other, eye-off, condition, a second fixation point was presented after the Gabor had been displayed for 400 ms; these trials ended when the animal made a saccade to the second fixation point. Thus, in the eye-off condition, a saccade made the Gabor stimulus leave the RF rather than turning off the stimulus. In most units (68 of 72), a third condition was employed; the saccade-off condition was identical to the eye-off condition except that no Gabor stimulus was presented.
(A) Experimental task. After the animal fixated a central red point for 200 ms, a Gabor stimulus was presented inside the V1 RF (yellow circle). After 400 ms, the stimulus either turned off (flash-off condition) or a saccade target was presented 7-deg to the right (for Monkey F, as shown) or left (for Monkey M) of the central fixation point (eye-off condition). The animal was required to saccade to that target within 150 ms, bringing the RF away from the Gabor stimulus. In 68 of the 72 V1 units studied, a third condition, saccade-only, was included in which the timing parameters were the same as the eye-off condition except no Gabor stimulus was presented. (B) Average responses of 4 single units (columns), across trials, from Monkey F (units 1 and 2) and Monkey M (units 3 and 4). The top panels show responses in the flash-off condition, middle panels show responses in the eye-off condition, and bottom panels show responses in the saccade-only condition. Stimulus termination time is marked by dotted vertical lines at time = 400 ms for flash-off stimuli and 530 ms in the eye-off condition (though this varied slightly across saccadic trials). Significant TRs are marked with arrows. In the flash-off and eye-off conditions, data are aligned to stimulus onset time (0 ms) and a response to the stimulus onset can be seen within the first 100 ms. Note that, due to this alignment, the TR in the eye-off condition is shifted rightward relative to the flash-off condition (where stimulus termination was at time 400 ms); this is caused by variable saccade latency of the monkey, which was typically 120–150 ms. Subsequent analyses were performed after aligning stimulus termination time in flash-off trials and saccade onset time in eye-off and saccade-only trials. (C) Population responses across trials in the flash-off (n = 72 units), eye-off (n = 72), and saccade-only conditions (n = 68). Data shown are averages of the smoothed normalized data from individual units (shaded regions are ±SEM). In the flash-off and eye-off conditions, data are aligned to stimulus termination and saccade onset (t = 0 ms), respectively, allowing comparison of the neural response to the disappearance of the Gabor stimulus inside the RF. In the saccade-only condition, data are aligned to saccade onset. The pretermination response period (pre-TR), is a 100 ms window indicated by a horizontal line above the data. The termination response peak (TR-peak) is a 200 ms window, indicated by another horizontal line, following saccade onset. (D) Raw average spike rates (Hz) of the neuronal population around stimulus termination time (n = 72 units in flash-off and eye-off condition; n = 68 units in the saccade-only condition); line color IDs are identical to C. (E) Average eye position traces in eye-off conditions for Monkey M (top) and Monkey F (bottom) in single example sessions; shaded SEM is present but not easily discernible. Saccade durations were typically about 30 ms.

Results
Almost all previous experiments on termination responses involved turning off a stimulus in a V1 RF while an animal fixated (as in our flash-off condition). As termination responses may play a significant role in perception, it is important to determine if they occur in the more natural situation in which a saccade removes a stimulus from the RF (eye-off). Fig. 1B compares responses in flash-off (top) and eye-off conditions (middle) aligned to stimulus onset; bottom panels show saccade-only data, when no Gabor stimulus was presented. The example responses demonstrate that some, but not all (unit 4), of the V1 units displayed a TR when a saccade caused the RF to leave a stimulus. Fig. 1C shows responses, averaged across neurons, in the three experimental conditions. In the population average, the termination response (after time = 0 ms) is somewhat earlier and significantly lower in amplitude in the eye-off condition compared to the flash-off condition. It is interesting to note that the lower amplitude termination response in the eye-off condition parallels the lower onset responses found with stimuli that appear in an RF via saccade compared to flashed stimuli (Martinez-Conde et al., Reference Martinez-Conde, Macknik and Hubel2002, Niemeyer & Paradiso, Reference Niemeyer and Paradiso2016, Ruiz et al., 2012).
Fig. 1D shows raw population responses from all recorded cells but zoomed in on the stimulus termination time (vertical line). Prior to stimulus termination in the eye-off condition (green), the responses of V1 cells appear to be slightly lower; conceivably this could result from the longer stimulus presentation time in this condition (an unavoidable effect of variable saccade latency by the animals). However, the difference in eye-off and flash-off activities before the terminations was not significantly different in either the 100 ms period before stimulus termination or in the 10 ms time bin immediately before stimulus termination (where responses appear most different). Another observation from Fig. 1D is that, despite very low firing rates, some cells appear to show a slight inhibition and then increase in firing rate after saccades when no stimuli were present in the RF (magenta line). Such inhibition-followed-by-excitation was observed in response to microsaccades (Troncoso et al., Reference Troncoso, McCamy, Jazi, Cui, Otero-Millan, Macknik, Costela and Martinez-Conde2015). However, comparing population spiking responses in 30 ms epochs of time before and after what appears to be a shift from inhibition to excitation revealed no significant differences in neural activity.
To compare stimulus terminations between saccade and flash conditions, it is important that these terminations occur on a similar timescale. Indeed, in the eye-off trials, stimuli slide out of the RF while in the flash-off condition, the stimuli disappear at fixation. Fig. 1E shows that the timescales are comparable: average eye traces from eye-off trials in the two monkeys demonstrate that saccades occurred in about 30 ms, meaning that in the eye-off trials, the stimuli disappeared from the ∼1 deg RFs in only a few milliseconds. While the stimulus termination time may have been slightly different in flash-off trials, we do not believe that a few millisecond-difference could account for the significant differences in TRs we observe.
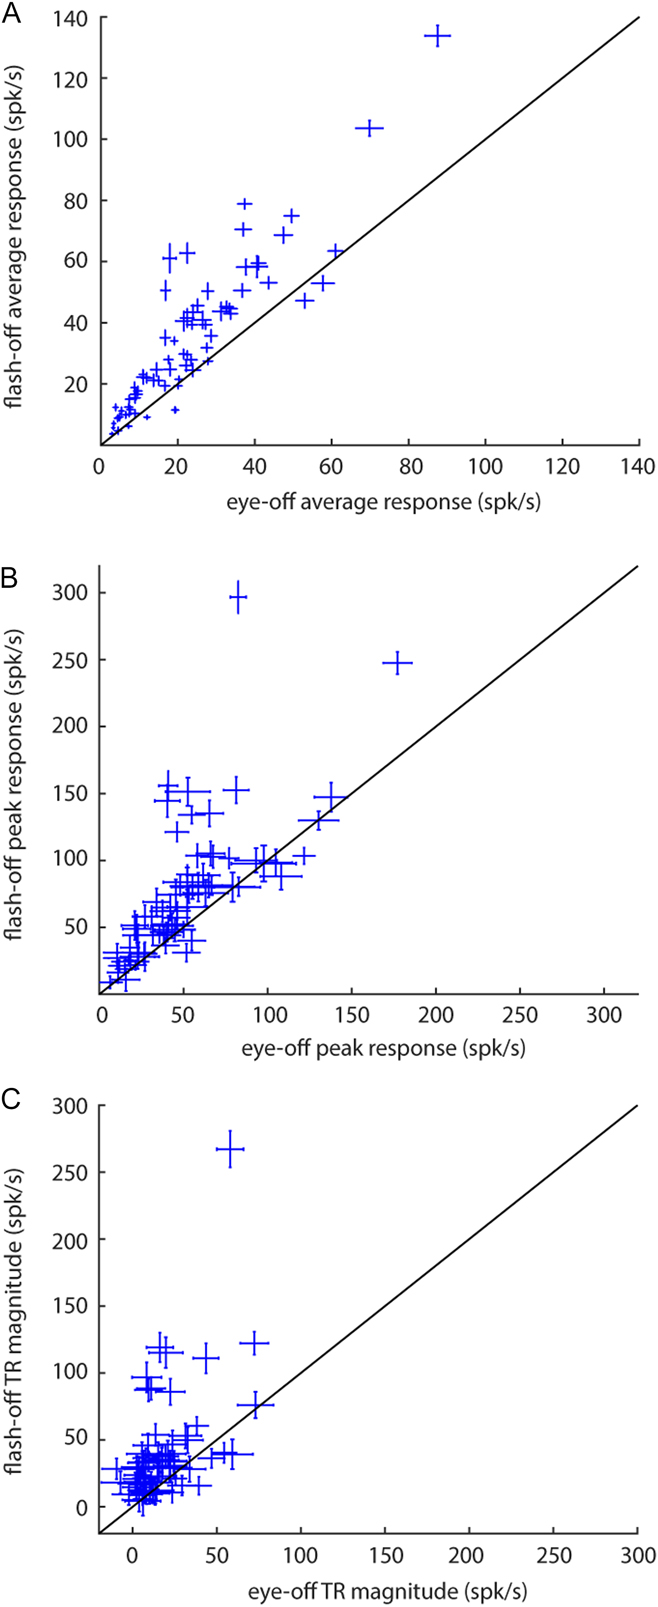
We compared responses of individual units in the flash-off and eye-off conditions by taking the average firing rate in a 100 ms window after the stimulus left the RF (Fig. 2A, data from the first 100 ms of the TR-peak period shown in Fig. 1C). The flash-off and eye-off firing rates were correlated, and of the 72 units tested, 64 gave a larger average response to stimulus termination in the flash-off condition than the eye-off condition; in 50 of the 72 units, the higher firing rate in the flash-off condition was statistically significant (P < 0.05). Thus, more than two-thirds of the V1 units show significantly reduced firing rates when a saccade brought its RF from a stimulus compared to when that stimulus was turned off during fixation.
Scatter plots of TRs in flash-off vs. eye-off conditions for all 72 units in the two animals. (A) Average responses were taken in 100 ms windows after stimulus termination and (B) peak responses were taken from 200 ms windows (TR-peak in Fig. 1C). (C) The magnitude of TRs was calculated as the difference between TR-peak activity and pre-TR activity. All error bars are ±SEM across trials; diagonal lines represent line of unity.

We also compared peak responses from 10 ms bins in a 200 ms TR-peak window and found that they followed a similar pattern: 61/72 units had a larger peak TR in the flash-off condition; in 39 of 72 units, the higher peak response in the flash-off condition was statistically significant (Fig. 2B). Across units, the average termination peak response was 73.97 spk/s (SEM = 0.06) in the flash-off condition, 50.69 spk/s (SEM = 0.04) in the eye-off condition, and 16.71 spk/s (SEM = 0.02) in the saccade-only condition. This difference between flash-off and eye-off peak responses (31%) was also significant at the population level when peak responses were compared between flash-off and eye-off conditions for all cells recorded (P = 0.0014).
To calculate the significance of a unit’s termination response, relative to a baseline, the peak firing rate (across trials) in the 200 ms TR-peak window was compared to the average rate in the 100 ms pre-TR window. We found that in the flash-off condition, 54/72 units (75%) had a peak TR that was at least one standard deviation above the average response in the pre-TR window. 24/72 (33%) units in the eye-off condition and 37/72 (66%) units in the saccade-only condition were significant by this criterion. This latter finding that many units showed significant peak responses following an eye movement on a gray background in the saccade-only condition is examined further below; here, we note that these response peaks were significant despite low firing rates without a Gabor stimulus.
Fig. 2C shows the relative magnitude of the TRs between the flash-off and eye-off conditions after subtracting the pre-TR response from the peak-TR response. Nonzero termination responses were observed in all units in the flash-off and most units in the eye-off conditions. Most units had larger TRs in the flash-off condition than in the eye-off condition, after subtracting pre-TR activity.
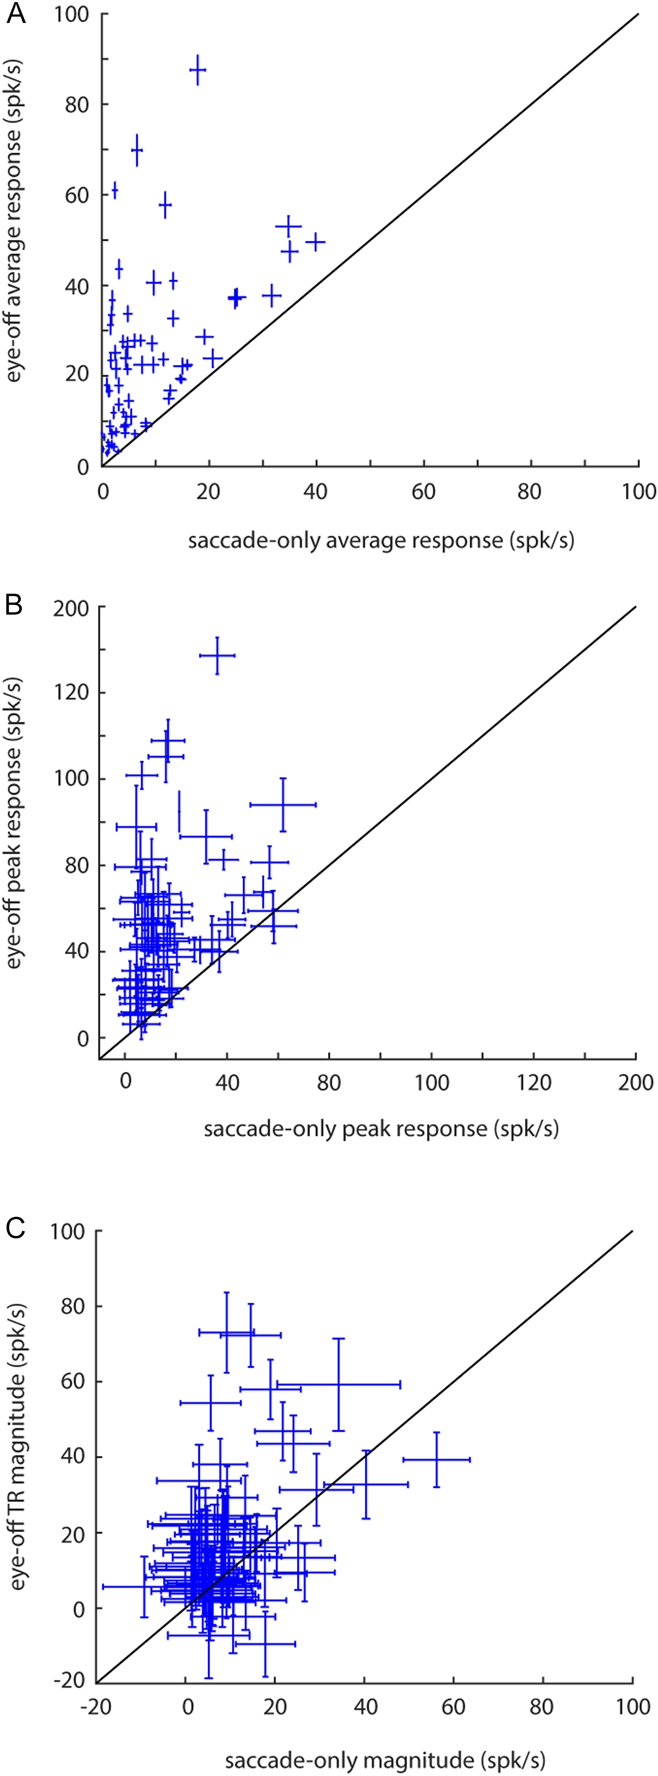
We next examined the responses from saccade-only trials (i.e., no visual stimulus). Fig. 3A and 3B show the average TR and average peak responses, respectively, from eye-off and saccade-only trials. In the saccade-only condition, the average TR in the 100 ms interval following saccade onset was 7.89 spk/s (SEM = 0.01), and the average TR-peak in the 200 ms TR-peak window was 16.71 spk/s (SEM = 0.02). Somewhat surprisingly, 66% of the units gave a peak TR that was significantly modulated by a saccade in the absence of visual stimulation, though these spiking responses were weak (16.71 spk/s) in comparison to the peak TRs observed in other conditions (73.97 spk/s in flash-off, and 50.69 spk/s in eye-off).
Scatter plots of TRs in eye-off vs. saccade-only conditions. (A) Average responses were taken in 100 ms windows after stimulus termination (or the equivalent time in the saccade-only condition) and (B) peak responses were taken from 200 ms windows (TR-peak in Fig. 1C). The magnitude (C) was calculated as in Fig. 2. All error bars are ±SEM across trials; diagonal lines represent line of unity. Note that one unit never responded in the saccade-only condition in any trial, leaving no error bar for that condition (A and B).

Two important conclusions can be drawn from the saccade-only responses. First, the TRs in the saccade-only condition suggest that there is a component of the TR that does not rely on visual stimulation in the RF. Second, most of the TR does depend on visual stimulation. Across the V1 units studied with all 3 conditions, 33% gave a significant TR in the eye-off condition and this response was not caused solely by the eye movement (i.e., the eye-off TR was significantly larger than the saccade-only TR). In natural vision, these saccade-related responses might provide a signal to the visual system that an eye movement is occurring.
Discussion
We report that V1 termination responses, which were previously studied almost exclusively with flashed stimuli in fixation paradigms, occur in a significant fraction of V1 cells in a more natural situation in which a stimulus leaves an RF via a saccade. As termination responses are known to influence perception (Macknik & Livingstone, Reference Macknik and Livingstone1998; Macknik & Martinez-Conde, Reference Macknik and Martinez-Conde2008), our results suggest that they play a role in natural visual perception and not just vision involving stimuli flashed during fixation. We also found that saccade-related termination responses are significantly lower than TRs recorded when stimuli flash off during fixation, a novel finding with implications for visual coding (see below). A comparison of TRs in the flash-off, eye-off, and saccade-only conditions indicates that TRs can occur even in the absence of visual stimulation but that termination of the visual stimulus is responsible for much of the TR.
In a truly natural visual situation, the magnitude of TRs may be somewhat different from what we report here using homogeneous gray backgrounds, as adaptation effects would likely come into play (Ruiz & Paradiso, Reference Ruiz and Paradiso2012; Niemeyer & Paradiso, Reference Niemeyer and Paradiso2016). Indeed, it has been reported in cats that the termination response amplitude is proportional to stimulus duration (Duysens et al., Reference Duysens, Schaafsma and Orban1996), perhaps because of adaptation. A possible complication in our study is that saccade refractoriness makes it more likely that a saccade occurred shortly before the stimulus went away in the flash-off than the saccade-off condition. If that were the case, adaptation might be lower in the flash-off condition. We attempted to address this question by looking for saccades just before the termination in flash-off conditions. We saw few saccades in this time interval, either because few occurred or because the video eye tracker did not reliably register very small eye movements. In any event, if adaptation was responsible for the duration effect reported by Duysens et al. (Reference Duysens, Schaafsma and Orban1996) and there were small saccades prior to flash-off (effectively resetting the stimulus duration), one would expect a lower termination response in the flash-off condition than the eye-off condition, the opposite of what we observed.
In addition to roles played by visual stimulation, eye movements, and adaptation, it is conceivable that motion influenced the results. Unlike the flash-off condition, in the eye-off condition, the Gabor stimulus slid out of the RF with the saccadic eye movement, creating a brief period of stimulus motion. Saccade speed accelerates rapidly after saccade onset; the Gabor would exit the 1-deg RF in a fraction of the 30 ms duration of the 7 deg saccade (Fig. 1E). However, we do not think this brief period of motion is a significant factor in the findings. Motion often enhances V1 responses (Tolhurst & Movshon, Reference Tolhurst and Movshon1975; Movshon et al., Reference Movshon, Thompson and Tolhurst1978), which would produce a larger response in the eye-off than the flash-off condition. Nevertheless, we instead observed a suppression of the saccade termination response relative to the flash-off condition. We are aware of at least one study that reported neurons in cat area 17 respond to rapid stimulus accelerations (Price et al., Reference Price, Crowder, Hietanen and Ibbotson2006). In this case too, the change in neural response associated with motion is opposite to what we observed in the eye-off condition. Our working hypothesis is that the brief period of motion at the start of the saccade (that ended Gabor stimulation of a neuron) had little effect on the termination responses; the response decrease relative to the flash-off condition appears inconsistent with the previous studies of motion effects on responses in primary visual cortex.
Over many years, it has been speculated that vision requires that an eye movement motor signal (an efference copy or corollary discharge) reaches visual cortex in the peri-saccadic timeframe; this has led to interest in the effects of eye movements on visual cortex (Jeannerod et al., Reference Jeannerod, Kennedy and Magnin1979; Wurtz, Reference Wurtz2008). Previous studies demonstrated that V1 activity is modulated by saccades (Ito et al., Reference Ito, Maldonado, Singer and Grun2011; Ruiz & Paradiso, Reference Ruiz and Paradiso2012; McFarland et al., Reference McFarland, Bondy, Saunders, Cumming and Butts2015; Niemeyer & Paradiso, Reference Niemeyer and Paradiso2016), and these effects are likely nonretinal in origin, presumably coming from a corollary discharge signal. Saccadic suppression, the phenomenon in which stimuli are less perceptible during and around the time of an eye movement (Dodge, Reference Dodge1900; Holt, Reference Holt1903; Volkmann, Reference Volkmann1986), may also involve an eye-movement signal. Saccadic suppression is a potential mechanism for why humans do not observe rapid stimulus motion during eye movements (Campbell & Wurtz, Reference Campbell and Wurtz1978) and likely arises from a combination of a corollary discharge signal and visual masking (Ross et al., Reference Ross, Morrone, Goldberg and Burr2001; Wurtz, Reference Wurtz2008).
The involvement of a corollary discharge in V1 responses is still being worked out, but the TR reduction in our eye-off condition may be a neural correlate of saccadic suppression as TRs are linked to visibility (Macknik & Livingstone, Reference Macknik and Livingstone1998). Support for the speculation that corollary discharge is involved in the TRs comes from data in the saccade-only condition in which there was a weak, but significant, termination response even when no stimulus was in the RF. Alternatively, it is conceivable that stimuli from beyond the classical RF contribute to the TRs that occur with a saccade. Stimuli outside the RF include the dim uniform gray visual display just beyond the RF (roughly 16 deg to each side and 13 deg above and below the RF) and more distant objects in the laboratory. However, though both contrast (Allman et al., Reference Allman, Miezin and McGuinness1985) and luminance (Rossi & Paradiso, Reference Rossi and Paradiso1999) just outside an RF can modulate responses to a stimulus in the RF, we know of no findings of significant response modulation to a high contrast stimulus in the RF by a dim uniform surround. Responses to more distant objects in the laboratory that have luminance contrast are also conceivable, but the spatial and temporal properties of our visual setup are unlike those known to elicit “periphery effects” (McIlwain, Reference McIlwain1964).
To conclude, we find that TRs occur in naturalistic conditions in about 33% of V1 neurons. Furthermore, we find that TRs caused by saccades are significantly reduced in amplitude compared to TRs that result when a stimulus is flashed off during fixation. Finally, our findings suggest that the TR resulting from a saccade is based on both the exit of the stimulus and a signal related to the eye movement itself. Having established that termination responses occur in a more natural visual paradigm suggests that the perceptual effects linked to TRs (Duysens et al., Reference Duysens, Orban, Cremieux and Maes1985; Macknik & Livingstone, Reference Macknik and Livingstone1998; Eriksson et al., Reference Eriksson, Tompa and Roland2008) may be constantly at play in natural vision.
Funding sources
NSF BCS-1261433; J.E.N was supported by NEI T32 EY018080 from NIH and the Fox Postdoctoral Research Fellowship from Brown University and an award from Brown’s Center for Vision Research.
Acknowledgment
We thank Aaron Gregoire for invaluable assistance with the experiments.