1. Introduction
Since the
 $2007-2009$
global financial crisis, it became apparent that central bank forward guidance is an essential monetary policy tool (as discussed in BIS (2019)). When short-term interest rates reached the zero lower bound (ZLB) in the aftermath of the
 $2007-2009$
global financial crisis, the US Federal Reserve responded providing guidance on the future course of interest rates. The Federal Open Market Committee (FOMC) in its December 2008 statement already was framing its policy that way indicating that: “the Committee anticipates that weak economic conditions are likely to warrant exceptionally low levels of the federal funds rate for some time.”
This type of lower-for-longer policy at the ZLB has been recognized as an important aspect of the monetary policymakers toolkit and has also been shown in theory to have beneficial effects on the economy, as explained through the lens of the New Keynesian model by Woodford (Reference Woodford2003) and Eggertsson and Woodford (Reference Eggertsson and Woodford2003). Moreover, when interest rates are away from the ZLB, forward guidance can be effective as well providing clarification and transparency about future monetary policy. As explained by Williams (Reference Williams2013) and Doehr and Martinez-Garcia (Reference Doehr and Martínez-García2015), greater clarity about the future policy path through forward guidance can help households and businesses make better investment decisions and boost the economy.
The effectiveness of forward guidance, in any event, rests on the perceived credibility of the central bank to follow through with its policy announcements. Standard macroeconomic models often consider the case of a fully credible monetary authority when investigating the impact that forward guidance can have on the economy. If the central bank is perceived as trustworthy, households and firms are likely to internalize the announcements about future policy in their decisions today (anticipation effects). If not, the effect on the economy from forward guidance may not be as strong. Indeed, Goodfriend and King (Reference Goodfriend and King2016) recognize this stating that “forecasts, and policy, should not be based solely on forecasts from a model that assumes full credibility in the stated policy path.” Thus, it is important to examine up close how the effectiveness of forward guidance depends on the credibility of the central bank.
This paper studies the effects of forward guidance with imperfect central bank credibility. A standard New Keynesian model augmented with standard macroeconomic persistence features (price stickiness, price indexation, habit formation, and interest rate inertia) is employed. The strategy by which the Federal Reserve has pursued forward guidance at the ZLB has evolved over time (as can be seen in Appendix C of Caldara et al. (Reference Caldara, Gagnon, Martínez-García and Neely2020)). Footnote 1 Some authors like Gersbach et al. (Reference Gersbach, Hahn and Liu2019) have cast forward guidance in a formal contractual framework. Instead, following Del Negro et al. (Reference Del Negro, Giannoni and Patterson2012) and LasÉen and Svensson (Reference Laséen and Svensson2011), we adopt a reduced-form representation of forward guidance which is implemented flexibly by adding anticipated forward guidance (news) shocks to the monetary policy rule. The model is then estimated using Bayesian methods with data on expectations—including interest rate expectations—from the Survey of Professional Forecasters (SPF).
Private agents, if they believe the central bank announcements about forward guidance, are assumed to follow the full-information rational expectations (FIRE) assumption typically employed in the literature. When private agents do not believe central bank announcements about forward guidance, instead, they form forecasts based on a data-driven VAR
 $\left( 1\right) $
in output, inflation, and interest rates which effectively disregards all forward guidance announcements and only responds to the policy announced if and when it materializes.
Footnote 2
A key parameter in our analysis is
 $0\leq \tau \leq 1$
, which defines the weight assigned by private agents to the belief that the monetary authority forward guidance commitments are credible and would be honored. If
 $\tau = 1$
, private agents believe the central bank to be perfectly credible and that all announcements about forward guidance are honored. Thus, in that limiting case where
 $\tau \rightarrow 1$
, aggregate expectations follow FIRE expectations and we are back in the standard setup in the literature (e.g. Del Negro et al. (Reference Del Negro, Giannoni and Patterson2012)). If
 $\tau \rightarrow 0$
, in the limit private agents do not perceive the monetary authority to be credible and ignore forward guidance statements altogether. Aggregate expectations then do not contain forward guidance information and private agents do not anticipate and react to it.
The results from our estimated model show a number of takeaways. First, a distinctive contribution of our paper regards our use of Bayesian estimation procedures and the SPF data set to tease out a measure of central bank credibility in relation to forward guidance announcements from the empirical evidence available. We utilize expectations of the interest rate and other macro aggregates from the SPF to help identify forward guidance shocks. The estimate of the credibility parameter (i.e.
 $\tau$
) in terms of forward guidance announcements hovers around
 $0.8$
. Since the U.S. central bank is perceived as less than fully credible in its forward guidance announcements, there exists less immediate and overall anticipation effects on the economy from forward guidance than under the perfectly credible case. The impulse response functions and variance decomposition results in this paper show that the responses of output and inflation to forward guidance shocks do not react as favorably relative to the scenario with a perfectly credible central bank.
Second, we also show that imperfect credibility is an important feature that contributes to the emergence of a so-called “forward guidance puzzle” in DSGE models. Del Negro et al. (Reference Del Negro, Giannoni and Patterson2012) explain that the forward guidance puzzle arises because standard New Keynesian models produce unusually large responses to forward guidance news when comparing model responses based on unconditional projections against projections conditional on setting the nominal interest rate near zero over an extended period of time (three years). Authors like McKay et al. (Reference McKay, Nakamura and Steinsson2016) argue that the anticipation effects on which forward guidance relies can be overstated in models where intertemporal consumption smoothing is largely unimpeded (under complete asset markets). We show that an economy that retains homogeneous FIRE expectations and perfect credibility of the forward guidance announcements will also overstate the power of forward guidance. The credibility estimate that we obtain in our model, indeed, is not too far away from the fully credible case but this suffices to dampen considerably the power of forward guidance. Our evidence suggests that the attenuation that results from a forward guidance policy that is imperfectly credible weakens the quantitatively large forward guidance effects noted by Del Negro et al. (Reference Del Negro, Giannoni and Patterson2012).
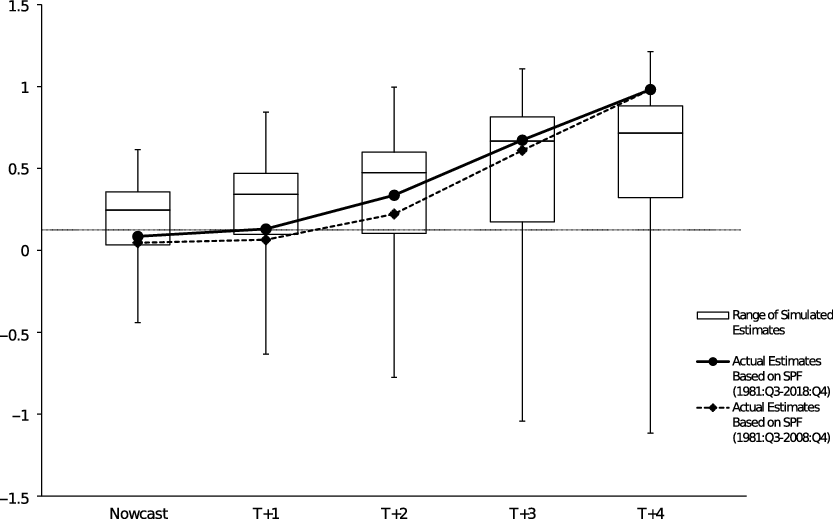
Third, we provide supplementary evidence that our model capturing central bank credibility in terms of forward guidance aligns well with the data. The model of imperfect central bank credibility and heterogeneous expectations is consistent with certain features of the SPF data that have been left largely unaccounted for in the existing literature—in particular, with the predictability of forecasting errors based on forecasting disagreements. In both simulated data from our model as well as in the SPF data, we compare the empirical relationship between forecast errors and forecast disagreements with a standard regression. Our model of imperfect credibility can display comovements between the previously mentioned variables at different horizons that are broadly consistent with the comovements implied by the SPF dataset. In contrast, the perfectly credible central bank scenario cannot capture those features of the SPF data.
Finally, we examine additional alternative estimation strategies and different structural assumptions as further robustness checks. First, the main results do not substantially change if the model is estimated over our full sample (
 $1981\,:\,Q3-2018\,:\, Q4$
), the non-ZLB subsample (
 $1981\,:\,Q3-2008\,:\,Q4$
), or the Great Moderation period (
 $1985\,:\, Q1-2007\,:\,Q3$
). In particular, the estimate of
 $\tau $
is high indicating a high level of trust in the central bank, but still below the fully credible case and similar to our baseline estimate for the full sample. Second, our results are largely robust to a more agnostic prior belief about
 $\tau$
. The prior distribution in the baseline exercise was centered around a high degree of central bank credibility. When a less informative prior belief is assumed, our estimate of
 $\tau $
does not noticeably change in relation to the benchmark case (although it erodes somewhat). Third, the estimate of the monetary authority credibility parameter
 $\tau$
is similar to the benchmark results when we consider alternative forecasting models for those private agents when they do not believe the central bank’s forward guidance statements. The estimate of
 $\tau$
does not noticeably change when habits in consumption or price indexation are turned off either. Fourth, the results are robust also if
 $t+1$
expectations correspond to the one-period ahead forecasts in the SPF instead of corresponding to the nowcast as in our benchmark mapping between the data and the model.
In summary, by using Bayesian estimation procedures and SPF expectations data, we provide an estimate of the U.S. Federal Reserve credibility in relation to forward guidance. While we obtain a high level of central bank credibility from our evidence, the Federal Reserve is perceived as less than fully credible with heterogeneous expectations. Thus, our paper shows that accounting for imperfect credibility is important to model the formation of expectations in the economy and particularly so to understand the transmission mechanism of forward guidance announcements.
1.1 Contribution to the literature
There exists a growing strand of the monetary policy literature focused on understanding the transmission mechanism through which forward guidance is thought to operate. This transmission channel relies on anticipation effects driven by a commitment to future policy that is made credibly. The evidence suggests that forward guidance moves expectations but only partially (Ferrero and Secchi (Reference Ferrero and Secchi2009, Reference Ferrero and Secchi2010); Hubert (Reference Hubert2014, Reference Hubert2015a, 2015b)). Mainstream theory also suggests that the anticipation effects are simply too strong within the standard class of New Keynesian equilibrium models (the so-called “forward guidance puzzle” noted by Del Negro et al. (Reference Del Negro, Giannoni and Patterson2012)). Footnote 3
Bundick and Smith (Reference Bundick and Smith2020) find that the substantial effects of forward guidance found through the lens of the New Keynesian model by Del Negro et al. (Reference Del Negro, Giannoni and Patterson2012) appear also in similarly constructed structural VAR models. Some authors like McKay et al. (Reference McKay, Nakamura and Steinsson2016) have argued, however, that capital market imperfections can be an important part of the story which can lead to overstating the macro effects of forward guidance. Hubert (Reference Hubert2015b) show that, under homogeneous rational expectations, forward guidance provides enhanced controllability and stabilizability and also limits the scope and incentives for time-inconsistent behavior. Other papers have analyzed the expectations formation process of agents. Gauss (Reference Gauss2015) and Andrade et al. (Reference Andrade, Gaballo, Mengus and Mojon2019) show that heterogeneous expectations in an economy can influence the power of forward guidance. Cole (Reference Cole2020a) and Cole (Reference Cole2020b) explain that the FIRE assumption can overstate the benefits of forward guidance relative to an adaptive learning rule used by agents subject to bounded rationality.
The effectiveness of forward guidance has also been analyzed via the communications channel. Campbell et al. (Reference Campbell, Ferroni, Fisher and Melosi2019) find that FOMC forward guidance information has limited power at long horizons. De Graeve et al. (Reference De Graeve, Ilbas and Wouters2014) argue that the effects of forward guidance on the economy can have more positive effects if its length is tied to the future condition of the economy (threshold-based forward guidance). Footnote 4
The present paper is also related to prior research exploring the conduct of monetary policy when agents have imperfect information about the economy. Under an adaptive learning framework in which agents are uncertain about the true structure of the economy, Eusepi and Preston (Reference Eusepi and Preston2010) analyze different monetary policy communication strategies to ensure stable macroeconomic dynamics. Honkapohja and Mitra (Reference Honkapohja and Mitra2020) study central bank credibility in an adaptive learning framework when the monetary authority implements a price-level targeting policy.
Ferrero and Secchi (Reference Ferrero and Secchi2009) and Ferrero and Secchi (Reference Ferrero and Secchi2010) show that if the central bank communicates to the public its projections of the output gap and inflation, more desirable and stable outcomes can occur in the economy. Orphanides and Williams (Reference Orphanides, Williams, Bernanke and Woodford2004), Orphanides and Williams (Reference Orphanides and Williams2007), Gaspar et al. (Reference Gaspar, Smets and Vestin2006), and Gaspar et al. (Reference Gaspar, Smets, Vestin, Friedman and Woodford2010) study central bank behavior when agents have imperfect information about the parameters in the central bank’s policy rule function or on optimal monetary policy under adaptive learning.
Our paper is closest to Haberis et al. (Reference Haberis, Harrison and Waldron2014), Goy et al. (Reference Goy, Hommes and Mavromatis2018), and Haberis et al. (Reference Haberis, Harrison and Waldron2019) which look at the role of monetary policy credibility. Footnote 5 The former shows that forward guidance can help escape the liquidity trap when central bank credibility is endogenous. The latter papers explains that interest rate pegs can produce more muted responses of the macroeconomic variables if agents in their model are allowed to perceive the central bank as not credible. Footnote 6
Altogether our paper adds to the literature along the following dimensions: (1) We introduce jointly the perceived credibility of the policy commitment and future policy news shocks, and relate both to the formation of heterogeneous private sector expectations. (2) We exploit SPF data on private sector expectations and Bayesian estimation techniques to analyze the effects of central bank credibility on the transmission of forward guidance shocks. Bayesian estimation procedures and survey data are employed to recover an estimate of central bank credibility in relation to forward guidance, which other studies have not estimated. To the best of our knowledge, none of the papers cited earlier explicitly estimates forward guidance shocks and credibility jointly in a structural model as we do in our study. (3) Our estimation results show a high but imperfectly credible central bank in the US. This evidence implies that imperfect credibility has dampened the effects of forward guidance on the economy relative to the perfectly credible central bank case. We also show that a model with imperfect credibility and heterogeneous expectations is consistent with the forecastability of SPF forecasting errors based on forecasting disagreements amongst the individual SPF forecasters.
In short, we argue that both macro data and expectations data are better described with a model that incorporates heterogeneous expectations with deviations from FIRE behavior as a result of imperfect credibility on forward guidance. We rely on a reduced-form representation where credibility captures the possibility that policy commitments about the future path of the interest rate can be reneged by the central bank (due to limited commitment). Therefore, from our estimation, we conclude that the anticipation effects of forward guidance in the US are attenuated—at least in part—because the central bank is perceived by private agents as unable to fully commit to honor the announced future path.
The remainder of the paper goes as follows: In Section 2 we discuss our baseline model with heterogeneous expectations and central bank credibility. In Section 3 we introduce our Bayesian estimation approach which is based on an expectations-augmented linearized version of the general equilibrium model. In Section 4 we present our main findings, while in Section 5 we provide additional robustness checks on our key estimate of central bank credibility. In Section 6 we conclude. We include in the Appendix an evolutionary game-theoretic motivation of our notion of central bank credibility and its connection to heterogeneous expectations.
2. Benchmark model
We employ a standard New Keynesian model consistent with the workhorse framework laid out by Woodford (Reference Woodford2003), Giannoni and Woodford (Reference Giannoni, Woodford, Bernanke and Woodford2004), Milani (Reference Milani2007), Martinez-Garcia and SØ ndergaard (2013), CÚrdia et al. (Reference CÚrdia, Ferrero, Ng and Tambalotti2015), and Cole and Milani (Reference Cole and Milani2017). The log-linear approximation that we bring to the data is derived from the optimizing behavior of households and firms. Our variant of the model includes four conventional sources of macroeconomic persistence—habit formation in consumption, price stickiness, price indexation, and interest rate inertia—to capture the dynamics of the macroeconomic data.
The model is completed with a Taylor (Reference Taylor1993) interest rate feedback rule with inertia which describes the response of monetary policy to domestic economic conditions. We augment the standard monetary policy rule in one important dimension by explicitly distinguishing between unanticipated (surprises) and anticipated (forward guidance) news shocks to monetary policy. This distinction allows us to investigate the central bank’s commitment to a future path of the nominal policy rate (forward guidance) through the lens of a general equilibrium New Keynesian model. We describe the monetary policy rule in greater detail in Subsection 2.2.
We, however, depart from the full-information rational expectations (FIRE), homogeneous-beliefs paradigm embedded in the standard workhorse New Keynesian model. Footnote 7 Private agents are modeled as heterogeneous-beliefs households-firms that assign odds to whether the central bank will honor its forward guidance commitments or not. If the central bank’s commitments are deemed credible, then rational expectations forecasts are used with full recognition of the credibility odds. If they are deemed not credible, then expectations are formed on the basis of standard VAR techniques used to fit the data. VAR techniques are fairly easy to implement, yet are immune to attempts to “manage expectations” on the part of the central bank through forward guidance announcements that can be reneged and never materialize (a form of monetary illusion). Footnote 8
2.1. Main structural relationships
As in CÚrdia et al. (2015), the workhorse New Keynesian model can be described by the following pair of log-linearized equations:
 \begin{align}\tilde{x}_{t} & = \mathbb{E}_{t}\tilde{x}_{t+1}-\left( 1-\beta \eta \right)\left( 1-\eta \right) \left( i_{t}-\mathbb{E}_{t}\pi _{t+1}-r_{t}^{n}\right), \end{align}
 \begin{align}\tilde{\pi}_{t} & = \beta \mathbb{E}_{t}\tilde{\pi}_{t+1}+\xi _{p}\left(\omega x_{t}+\left( \left( 1-\beta \eta \right) \left( 1-\eta \right)\right) ^{-1}\tilde{x}_{t}\right) +\mu _{t}, \end{align}
where
 \begin{align}\tilde{y}_{t} &\equiv y_{t}-\eta y_{t-1}-\beta \eta \mathbb{E}_{t}\left(y_{t+1}-\eta y_{t}\right) , \end{align}
 \begin{align}\tilde{y}_{t}^{n} &\equiv y_{t}^{n}-\eta y_{t-1}^{n}-\beta \eta \mathbb{E}_{t}\left( y_{t+1}^{n}-\eta y_{t}^{n}\right) , \end{align}
 \begin{align}\tilde{x}_{t} &\equiv \tilde{y}_{t}-\tilde{y}_{t}^{n}=x_{t}-\eta x_{t-1}-\beta \eta \mathbb{E}_{t}\left( x_{t+1}-\eta x_{t}\right) , \end{align}
 \begin{align}\tilde{\pi}_{t} &\equiv \pi _{t}-\iota _{p}\pi _{t-1}. \end{align}
Here, the one-period nominal interest rate (
 $i_{t}$
) is the policy rate, inflation (
 $\pi _{t}$
) is the first-difference on the consumption price level in logs, and the output gap (
 $x_{t}$
) is defined as
 $x_{t}\equiv y_{t}-y_{t}^{n}$
, that is, as the log-deviation of actual output (
 $y_{t}$
) from its potential level absent all nominal rigidities (
 $y_{t}^{n}$
).
Equation (1), often referred to as the dynamic Investment-Savings (IS) equation, describes the aggregate demand of the economy arising from the optimal decisions (the intertemporal Euler equation) of households. Equation (1) together with (3)--(5) implies that the current output gap (
 $x_{t}$
) depends on expected one-period and two-period ahead output gaps, the lagged output gap, the current nominal interest rate (
 $i_{t} $
), the expected one-period ahead inflation rate (
 $\mathbb{E}_{t}\left( \pi _{t+1}\right) $
), and the natural rate (
 $r_{t}^{n}$
) which is the real rate of interest that would prevail absent all nominal rigidities. Here, the intertemporal rate of substitution is set to one. There exists habit formation in consumption given by the parameter
 $0\leq \eta \leq 1$
, and households’ intertemporal discount rate is given by the parameter
 $0<\beta <1 $
.
Equation (2) denotes the New Keynesian Phillips Curve (NKPC) and follows from the optimizing decision of firms. These firms are owned by the households and are operated in a monopolistically competitive environment with Calvo (Reference Calvo1983) staggered price-setting behavior and Yun (Reference Yun1996) price indexation, similar to Christiano et al. (Reference Christiano, Eichenbaum and Evans2005). Consequently, equation (2) shows that inflation (
 $\pi _{t}$
) depends on lagged inflation, the expected one-period ahead inflation (
 $\mathbb{E}_{t}\left(\pi _{t+1}\right) $
), the current output gap (
 $x_{t}$
), the lagged output gap, the expected one-period ahead output gap, and a cost-push shock (
 $\mu_{t}$
).
A fraction of firms given by the parameter
 $0\leq \theta \leq 1$
are assumed to be unable to adjust their prices every period, while the remaining fraction
 $(1-\theta )$
of firms can. The non-reoptimizing firms index their prices to past inflation with the degree of indexation determined by the parameter
 $0\leq \iota _{p}\leq 1$
. Furthermore, the parameter
 $\omega >0$
is the inverse of the Frisch elasticity of labor supply, while the composite coefficient
 $\xi _{p}$
is defined as
 $\frac{\left( 1-\theta \beta \right)\left( 1-\theta \right) }{\theta }$
with
 $\beta $
being the household’s intertemporal discount factor and
 $\theta $
the constant fraction of non-reoptimizing firms per period.
We use (5) to re-express the system of equations given by (1)--(2) that describe the dynamics of the economy in terms of actual and potential output as follows:
 \begin{eqnarray}&&\left. \tilde{y}_{t}=\mathbb{E}_{t}\left( \tilde{y}_{t+1}\right) -\left(1-\beta \eta \right) \left( 1-\eta \right) \left( i_{t}-\mathbb{E}_{t}\pi_{t+1}-r_{t}^{n}\right) -\mathbb{E}_{t}\left( \Delta \tilde{y}_{t+1}^{n}\right) ,\right. \end{eqnarray}
 \begin{eqnarray}&&\left.\begin{array}{l}\tilde{\pi}_{t}=\xi _{p}\left( \omega y_{t}+\left( \left( 1-\beta \eta\right) \left( 1-\eta \right) \right) ^{-1}\tilde{y}_{t}\right) +\beta\mathbb{E}_{t}\tilde{\pi}_{t+1}+\mu _{t} \\\left. \left. \left. \left. \left. \left. {}\right. \right. \right. \right.\right. \right. -\xi _{p}\left( \omega y_{t}^{n}+\left( \left( 1-\beta \eta\right) \left( 1-\eta \right) \right) ^{-1}\tilde{y}_{t}^{n}\right) .\end{array}\right. \end{eqnarray}
Based on the output potential transformation in (4), we can further re-write the system of equations in (1)--(2) to obtain that:
 \begin{align}& \left.\begin{array}{l}\tilde{y}_{t}=\mathbb{E}_{t}\left( \tilde{y}_{t+1}\right) -\left( 1-\beta\eta \right) \left( 1-\eta \right) \left( i_{t}-\mathbb{E}_{t}\pi_{t+1}-r_{t}^{n}\right) \\\left. \left. \left. \left. \left. \left. {}\right. \right. \right. \right.\right. \right. -\left( \eta y_{t-1}^{n}-\left( 1+\eta +\beta \eta^{2}\right) y_{t}^{n}+\left( 1+\beta \eta +\beta \eta ^{2}\right) \mathbb{E}_{t}\left( y_{t+1}^{n}\right) -\beta \eta \mathbb{E}_{t}\left(y_{t+2}^{n}\right) \right) ,\end{array}\right. \end{align}
 \begin{align}& \left.\begin{array}{l}\tilde{\pi}_{t}=\xi _{p}\left( \omega y_{t}+((1-\beta \eta )\left( 1-\eta\right) )^{-1}\tilde{y}_{t}\right) +\beta \mathbb{E}_{t}\tilde{\pi}_{t+1}+\mu _{t}\\\left. \left. \left. \left. \left. \left. {}\right. \right. \right. \right.\right. \right. -\xi _{p}\left(\begin{array}{c}-\left( \left( 1-\beta \eta \right) \left( 1-\eta \right) \right) ^{-1}\eta y_{t-1}^{n}+\left( \omega +\left( \left( 1-\beta \eta \right) \left( 1-\eta\right) \right) ^{-1}\left( 1+\beta \eta ^{2}\right) \right) y_{t}^{n} \\[5pt]-\left( \left( 1-\beta \eta \right) \left( 1-\eta \right) \right) ^{-1}\beta\eta \mathbb{E}_{t}\left( y_{t+1}^{n}\right)\end{array}\right) ,\end{array}\right. \end{align}
with the same structural relationships as the system of equations given by (7)--(8). This showcases that the dynamic IS and NKPC equations can be expressed in terms of three observable macro variables: output (
 $y_{t}$
), inflation (
 $\pi _{t}$
), and the policy rate (
 $i_{t}$
), that is, in terms of the three-variable vector
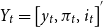 $Y_{t}=\left[ y_{t},\pi _{t},i_{t}\right] ^{^{\prime }}$
. Moreover, these equations also show that cost-push shocks (
 $\mu _{t}$
) as well as exogenously-driven shifts in the output potential (
 $y_{t}^{n}$
) and the natural rate of interest (
 $r_{t}^{n}$
) drive the dynamics of output (
 $y_{t}$
) and inflation (
 $\pi _{t}$
).
Frictionless allocation. The potential output allocation (
 $y_{t}^{n}$
) and the natural real rate (
 $r_{t}^{n}$
) are important constructs in our analysis and represent the levels of output and of the real interest rate that would prevail absent all nominal rigidities. In that counterfactual scenario, output potential (
 $y_{t}^{n}$
) evolves according to the following equation:
 \begin{align}\omega y_{t}^{n} & +\frac{1}{\left( 1-\beta \eta \right) \left( 1-\eta \right) }\left( y_{t}^{n}-\eta y_{t-1}^{n}\right) -\frac{\beta \eta }{\left( 1-\beta\eta \right) \left( 1-\eta \right) }\left( \mathbb{E}_{t}\left(y_{t+1}^{n}\right) -\eta y_{t}^{n}\right) \nonumber \\[5pt]& =\frac{\eta }{\left( 1-\beta \eta \right) \left( 1-\eta \right) }\left(\beta \mathbb{E}_{t}\left( \gamma _{t+1}\right) -\gamma _{t}\right) .\end{align}
The previous equation follows from CÚrdia et al. (2015). Equation (11) implies that output potential is a linear combination of current, lagged, and future expected values of output potential as well as current and future expected values of exogenous productivity growth,
 $\gamma _{t}\equiv \Delta \ln\left( A_{t}\right) $
where
 $A_{t}$
denotes total factor productivity (TFP). Given the efficient allocation of the output potential (
 $y_{t}^{n}$
) in (11), the household’s intertemporal Euler equation implies that the natural rate of interest (
 $r_{t}^{n}$
) can be expressed as:
 \begin{equation}r_{t}^{n}=\mathbb{E}_{t}\left( \gamma _{t+1}\right) -\omega \mathbb{E}_{t}\left( \Delta y_{t+1}^{n}\right) . \end{equation}
Equations (11) and (12) highlight the close connection between output potential and the natural rate of interest both of which respond to a common shock—the exogenous shock to productivity growth (
 $\gamma _{t}$
).
Here, we observe that the natural rate of interest depends: (a) positively on the forecastable components of next period’s exogenous productivity growth (
 $\gamma _{t}$
), and (b) negatively on the forecastable component of next period’s growth rate of output potential (
 $\Delta y_{t+1}^{n}$
) which itself depends on the exogenous productivity growth (
 $\gamma _{t}$
) through equation (11). Intuitively, point (b) captures the negative effect on the real interest rate of a higher expected growth rate of marginal utility which, under standard market clearing conditions, directly influences potential hours worked and in turn potential output as well.
Exogenous (Non-monetary) shock processes. The exogenous shock to productivity growth (
 $\gamma _{t}$
) and the cost-push shock (
 $\mu _{t}$
) are assumed to follow standard AR
 $\left( 1\right) $
processes:
 \begin{eqnarray}\gamma _{t} &=&\rho _{\gamma }\gamma _{t-1}+\varepsilon _{t}^{\gamma }, \end{eqnarray}
 \begin{eqnarray}\mu _{t} &=&\rho _{\mu }\mu _{t-1}+\varepsilon _{t}^{\mu },\end{eqnarray}
where
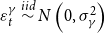 $\varepsilon _{t}^{\gamma }\overset{iid}{\sim }N\left( 0,\sigma_{\gamma }^{2}\right) $
and
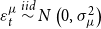 $\varepsilon _{t}^{\mu }\overset{iid}{\sim }N\left( 0,\sigma _{\mu }^{2}\right) $
.
Footnote 9
The persistence of the productivity growth and cost-push shocks is given by the parameters
 $0<\rho _{\gamma }<1$
and
 $0<\rho _{\mu }<1$
, respectively. Similarly, the volatility of the productivity growth and cost-push shocks is given by
 $\sigma _{\gamma }^{2}>0$
and
 $\sigma _{\mu }^{2}>0$
, respectively. We do not consider spillovers between productivity growth and cost-push shocks and assume that their respective innovations are uncorrelated at all leads and lags.
2.2 Monetary policy
The monetary policymaker relies on the short-term nominal interest rate (
 $i_{t}$
) as its policy instrument. A Taylor (Reference Taylor1993)-type monetary policy rule is generally viewed as a simple and practical guide for the conduct of monetary policy in the US.
Footnote 10
Henceforth, we assume that the central bank follows a variant of the Taylor (Reference Taylor1993) rule whereby the nominal interest rate responds to inflation deviations from its zero-inflation target (
 $\pi _{t}$
) and possibly also to fluctuations in the output gap (
 $x_{t}\equiv \left(y_{t}-y_{t}^{n}\right) $
), that is,
 \begin{equation}i_{t}=\rho i_{t-1}+\left( 1-\rho \right) \left( \chi _{\pi }\pi _{t}+\chi_{x}\left( y_{t}-y_{t}^{n}\right) \right) +\varepsilon _{t}^{MP}.\end{equation}
This policy rule ensures the determinacy of the equilibrium whenever the policy parameters satisfy the Taylor principle, that is, whenever
 $\chi_{\pi }>1$
and
 $\chi _{x}\geq 0$
. The rule also includes lagged interest rates with a smoothing parameter given by
 $0\leq \rho <1$
and an unanticipated monetary policy shock (
 $\varepsilon _{t}^{MP}$
).
We recognize that the strategy by which the Federal Reserve has pursued forward guidance has evolved over time, so we introduce contingent forward guidance in the Taylor (Reference Taylor1993) rule flexibly in the form of anticipated monetary policy shocks (news) following the approach of LasÉen and Svensson (Reference Laséen and Svensson2011) and Del Negro et al. (Reference Del Negro, Giannoni and Patterson2012). This approach has more recently been used in related work by Cole (Reference Cole2020a) and Cole (Reference Cole2020b). Specifically, the monetary policy rule in (15) is augmented as follows:
 \begin{equation}i_{t}=\rho i_{t-1}+\left( 1-\rho \right) \left[ \chi _{\pi }\pi _{t}+\chi_{x}\left( y_{t}-y_{t}^{n}\right) \right] +\varepsilon_{t}^{MP}+\sum\nolimits_{l=1}^{L}\varepsilon _{l,t-l}^{FG}, \end{equation}
where the unanticipated (surprise) monetary policy shocks (
 $\varepsilon_{t}^{MP}$
) are combined with forward guidance (news) shocks (
 $\varepsilon_{l,t-l}^{FG}$
for all
 $l=1,...,L$
).
Footnote 11
The length of the forward guidance horizon provided by the news shocks is defined by the horizon
 $1\leq L<+\infty $
implying that there is a finite number of L forward guidance shocks in the summation term in equation (16).
Monetary policy surprises and forward guidance shocks are assumed to be purely transitory or i.i.d., that is,
 \begin{eqnarray}&&\left. \varepsilon _{t}^{MP}\overset{iid}{\sim }N\left( 0,\sigma_{MP}^{2}\right) ,\right. \end{eqnarray}
 \begin{eqnarray}&&\left. \varepsilon _{l,t-l}^{FG}\overset{iid}{\sim }N\left( 0,\sigma_{l}^{2,FG}\right) ,\text{ }\forall l=1,...,L,\text{ and }1\leq L<+\infty.\right.\end{eqnarray}
Each
 $\varepsilon _{l,t-l}^{FG}$
in equation (16) represents anticipated or news shocks that private agents know about in period
 $t-l$
but do not affect the interest rate until l periods later, that is, until period t. The volatility of the unanticipated and anticipated monetary policy shocks is given by
 $\sigma _{MP}^{2}>0$
and
 $\sigma _{l}^{2,FG}>0$
for all
 $l=1,...,L$
, respectively. The innovations of anticipated and unanticipated monetary policy shocks are uncorrelated with each other and with the cost-push shock and productivity growth shock innovations at all leads and lags.
Following LasÉen and Svensson (Reference Laséen and Svensson2011) and Del Negro et al. (Reference Del Negro, Giannoni and Patterson2012), the following recursive representation is added to the model’s system of equations to describe the news shocks: Footnote 12
 \begin{align}v_{1,t} &= v_{2,t-1}+\varepsilon _{1,t}^{FG}, \end{align}
 \begin{align}v_{2,t} &= v_{3,t-1}+\varepsilon _{2,t}^{FG}, \end{align}
 \begin{align}&\vdots \notag \\v_{L,t} &= \varepsilon _{L,t}^{FG}. \end{align}
Each component of the vector
 $v_{t}=\left[ v_{1,t},v_{2,t},\dots ,v_{L,t}\right] ^{\prime }$
represents all past and present central bank announcements to change the interest rate
 $1,2,\dots ,L$
periods later that private agents know in period t. In addition, we define
 $\psi _{t}=\left[\varepsilon _{1,t}^{FG},\varepsilon _{2,t}^{FG},\dots ,\varepsilon_{L,t}^{FG}\right] ^{^{\prime }}$
as the vector containing all current-period forward guidance shocks known today that affect the monetary policy rule
 $1,2,\dots ,L$
periods later. Equations (19)--(21) can be simplified to show that
 $v_{1,t-1}$
corresponds to the last term in equation (16), that is, the summation of all anticipated monetary policy shocks realized at time t,
 $v_{1,t-1}=\sum\nolimits_{l=1}^{L}\varepsilon _{l,t-l}^{FG}$
.
Accordingly, the policy rule in (16) can be re-expressed more compactly as:
 \begin{equation}i_{t}=\rho i_{t-1}+\left( 1-\rho \right) \left[ \chi _{\pi }\pi _{t}+\chi_{x}\left( y_{t}-y_{t}^{n}\right) \right] +\varepsilon _{t}^{MP}+v_{1,t-1}.\end{equation}
The method of using equations (22) together with (17)--(21) provides a tractable way to incorporate anticipated monetary policy (forward guidance) news shocks as well as conventional unanticipated (surprise) monetary policy shocks into the monetary policy rule. Forward guidance shocks, therefore, can be interpreted as the means by which the central bank communicates (announces) the path of future policy rates.
We choose to model forward guidance shocks in this way for a number of conceptual and practical reasons. First, we model forward guidance here following in the footsteps of the prior literature starting with LasÉen and Svensson (Reference Laséen and Svensson2011) and Del Negro et al. (Reference Del Negro, Giannoni and Patterson2012). That provides a degree of comparability. Second, the Federal Reserve’s forward guidance strategy has evolved. In the aftermath of the
 $2007-2009$
global financial crisis, the U.S. central bank forward guidance communication was “Odyssean” in nature but moved from calendar-based into state-contingent commitments over time. By 2012, the Fed also started to issue its own fed funds rate projections on top of the macro projections already being released since 2008 through the Fed’s Summary of Economic Projections (SEP) (“Delphic” forward guidance).
Footnote 13
All of these types of forward guidance share the same theme of communicating about the future course of policy. And equation (16) captures this feature in a reduced but flexible form. We use this reduced-form representation as a simple and flexible way to encompass the different approaches of forward guidance followed by the Federal Reserve.
Expectations augmented vector of observable variables. The state equations that describe the dynamics of the economy in (19)--(10), together with (3)--(4) and (6), pin down the solution to the vector of three observable macro variables given by
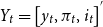 $Y_{t}=\left[ y_{t},\pi _{t},i_{t}\right] ^{^{\prime }}$
which includes actual output (
 $y_{t}$
), inflation (
 $\pi _{t}$
), and the policy rate (
 $i_{t}$
). However, with monetary policy shocks split into unanticipated (surprise) and anticipated (news) shocks, the vector of observable variables
 $Y_{t}$
lacks fundamentalness in the sense of Hansen and Sargent (Reference Hansen and Sargent1980) and Martinez-Garcia (2018). In other words, these three observable macro variables do not contain enough information to pin down the vector of unobserved structural shocks
 $\varepsilon _{t}=( \gamma _{t},\mu_{t},\varepsilon _{t}^{MP},\{ \varepsilon _{l,t-l}^{FG}\}_{l=1}^{L}) ^{\prime }$
. Without additional observable variables, we can only recover residuals that are linear combinations of the underlying structural shocks.
Given the monetary policy rule in equation (16), we can show that the expected future path of the policy rate at time t can be written as follows: Footnote 14
 \begin{equation}\mathbb{E}_{t}\left( i_{t+s}\right) =\left\{\begin{array}{l}\rho i_{t-1}+\left( 1-\rho \right) \left[ \chi _{\pi }\pi _{t}+\chi_{x}\left( y_{t}-y_{t}^{n}\right) \right] +\varepsilon _{t}^{MP}+v_{1,t-1},\text{ for }s=0, \\[4pt]\rho i_{t-1+s}+\left( 1-\rho \right) \left[ \chi _{\pi }\mathbb{E}_{t}\left(\pi _{t+s}\right) +\chi _{x}\mathbb{E}_{t}\left( y_{t+s}-y_{t+s}^{n}\right) \right]\\[4pt]\quad +v_{s+1,t-1}+\varepsilon _{s,t}^{FG},\text{ }\forall s\in \left\{1,2,...,L-1\right\} ,\text{ for } 0<s<L, \\[4pt]\rho i_{t-1+s}+\left( 1-\rho \right) \left[ \chi _{\pi }\mathbb{E}_{t}\left(\pi _{t+s}\right) +\chi _{x}\mathbb{E}_{t}\left( y_{t+s}-y_{t+s}^{n}\right) \right] +\varepsilon _{s,t}^{FG},\text{ for }s=L, \\[4pt]\rho i_{t-1+s}+\left( 1-\rho \right) \left[ \chi _{\pi }\mathbb{E}_{t}\left(\pi _{t+s}\right) +\chi _{x}\mathbb{E}_{t}\left( y_{t+s}-y_{t+s}^{n}\right) \right] ,\text{ }\forall s>L.\end{array}\right. \end{equation}
Hence, the expression in (23) shows that—consistent with expectations about inflation and economic activity—expectations on the future path of the interest rate should shift in response to announcements of anticipated (forward guidance) monetary policy shocks helping us tease them apart from unanticipated (surprise) monetary policy shocks. Given this, we adopt the survey-based identification strategy explored by Doehr and Martinez-Garcia (Reference Doehr and Martínez-García2015) in a VAR setting and employed by Cole and Milani (Reference Cole and Milani2017) within a DSGE model which consists in augmenting the vector of observables
 $Y_{t}=[ y_{t},\pi _{t},i_{t}] ^{\prime}$
with survey-based forecasts with which to disentangle anticipated from unanticipated monetary policy shocks.
Footnote 15
We expand the vector of observables
 $Y_{t}$
with expectations as follows:
 \begin{equation}\overline{Y}_{t}=\left[ y_{t},\pi _{t},i_{t},\mathbb{E}_{t}\left( \Delta y_{t+1}\right) ,\mathbb{E}_{t}\left( \Delta y_{t+2}\right) ,\mathbb{E}_{t}\left( \pi _{t+1}\right) ,\mathbb{E}_{t}\left( i_{t+1}\right) ,...,\mathbb{E}_{t}\left( i_{t+L}\right) \right] ^{^{\prime }}, \end{equation}
where
 $\Delta y_{t+j}=\Delta x_{t+j}+\Delta y_{t+j}^{n}$
denotes the growth rate of actual output at time
 $t+j$
(for
 $j=1,2$
) and, by analogy, we define
 $\Delta y_{t+j}^{n}=( y_{t+j}^{n}-y_{t+j-1}^{n}) $
to be the corresponding growth rate of output potential at time
 $t+j$
.
Footnote 16
Given the structure of the economy described by equations (9)--(10), the non-monetary shock processes in (11)--(14), the Taylor (Reference Taylor1993) rule in (22), and the unanticipated and anticipated monetary policy shocks given by (17)--(21), the vector of expectations-augmented observables
 $\overline{Y}_{t}$
in (24) suffices to ensure that we can identify all structural shocks
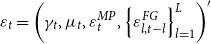 $\varepsilon_{t}=\left( \gamma _{t},\mu _{t},\varepsilon _{t}^{MP},\left\{ \varepsilon_{l,t-l}^{FG}\right\} _{l=1}^{L}\right) ^{\prime }$
.
2.3. Central bank credibility
Forward guidance opens up the possibility of central banks managing expectations but is also inherently prone to time-inconsistency problems (Kydland and Prescott (Reference Kydland and Prescott1977)). That is because, at the end of the day, forward guidance are promises about future monetary policy that the central bank may find beneficial to renege from unless future policymakers could be bound somehow to credibly honor those commitments when the time comes.
This is partly because, while the vector of observables
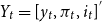 $Y_{t}=[y_{t},\pi_{t},i_{t}]^{^{\prime }}$
can be monitored with observable data, neither announcements about the expected future path of the policy rate (news shocks) nor the central bank’s own public forecasts—if used to communicate the forward guidance policy—can be monitored and validated in real-time with the current observed data
 $Y_{t}$
or with its lags at the time the announcement is made. It is also partly because central banks may have incentives to deviate from those commitments.
Simply put, private agents realize that there is neither a full-proof verification mechanism nor a way to enforce those promises to guarantee that the monetary policymakers deliver on the future policy path that has been promised and, therefore, private agents must form expectations accordingly. In other words, private agents have to factor the credibility of the central bank’s forward guidance future policy commitment in forming their own expectations about the future.
We assume that private agents believing the central bank’s commitments form their expectations under the FIRE paradigm recognizing the aggregate implications of imperfect credibility on those policy commitments. Private agents believing the central bank’s commitments not to be credible form their expectations about the observables using a standard VAR model and commit themselves to forecast the future path of the economy’s macro aggregates in that way (ignoring all announcements until they materialize—if they do—at a later time). That is, private agents forecast the observable vector
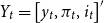 $Y_{t}=\left[ y_{t},\pi _{t},i_{t}\right] ^{\prime }$
with the following parsimonious structural VAR
 $\left( 1\right) $
process in mind:
 \begin{equation}Y_{t}=A+BY_{t-1}+u_{t}, \end{equation}
which captures well the historical dynamics of
 $Y_{t}$
in our sample. Here, A and B are reduced-form matrices of conforming dimensions, and
 $u_{t}$
is a vector of (non-structural) residuals.
Footnote 17
Following on the footsteps of the axiomatic approach to aggregate heterogeneous beliefs introduced by Branch and McGough (Reference Branch and McGough2009), aggregate expectations (
 $\mathbb{E}_{t}\left(Y_{t+1}\right) $
) are a weighted sum of expectations from private agents who believe the central bank to be credible and those who do not.
Footnote 18
Specifically, we define aggregate expectations as follows:
 \begin{equation}\mathbb{E}_{t}\left( {{Y}_{t+1}}\right) =\tau \mathbb{E}_{t}^{C}\left( {Y_{t+1}}\right) +\left( 1-\tau \right) \mathbb{E}_{t}^{D}\left( {Y_{t+1}}\right) {,} \end{equation}
where
 $\mathbb{E}_{t}^{C}\left( Y_{t+1}\right) $
represents the FIRE forecasts of macro variables of private agents that view the central bank’s commitments as fully credible and
 $\mathbb{E}_{t}^{D}\left( Y_{t+1}\right) $
denotes the expectations of private agents who believe the monetary authority’s commitment to be not credible. As stated above, the latter form expectations based on equation (25). Equation (26) also follows Haberis et al. (Reference Haberis, Harrison and Waldron2019) who model aggregate expectations as a weighted average of FIRE and VAR forecasts.
The parameter
 $0<\tau <1$
determines the odds placed on
 $\mathbb{E}_{t}^{C}\left( Y_{t+1}\right) $
or, alternatively, the share of private agents that forms FIRE expectations. We refer to
 $\tau $
as the credibility parameter of the model.
Footnote 19
In the limiting case where
 $\tau = 1$
, all private agents in the economy believe the central bank to be perfectly credible and expectations to be homogeneous and FIRE across all agents (i.e.
 $\mathbb{E}_{t}{Y}_{t+1}=\mathbb{E}_{t}\left( Y_{t+1}^{C}\right) $
). In the opposite polar case where
 $\tau \rightarrow 0$
, the monetary authority is considered not to be credible and aggregate beliefs imply that
 $\mathbb{E}_{t}\left( {{Y}_{t+1}}\right) \rightarrow \mathbb{E}_{t}^{D}\left( {Y_{t+1}}\right) $
.
Our specific choice of modeling credibility with equation (26) is partly motivated by prior research and comparability reasons. Bernanke et al. (Reference Bernanke, Kiley and Roberts2019) study imperfect credibility with FRB/US, the main simulation model of the Federal Reserve. Similar to our equation (26), aggregate expectations in the previous authors’ paper are assumed to be composed of model-consistent FIRE expectations and forecasts based on a VAR that ignores Federal Reserve announcements (as in our model with imperfectly credible guidance). The description of credibility in Yellen (Reference Yellen2006) also seems akin to our definition. Yellen (Reference Yellen2006) describes central bank credibility as agents correctly anticipating policy in response to economic shocks. Thus, lack of credibility could be understood as not incorporating Federal Reserve future policy announcements into forecasts, similar to what we do in equation (25). Blinder (Reference Blinder2018) also states that agents not incorporating monetary policy communication into their forecasts are effectively acting as if they do not believe the monetary authority.
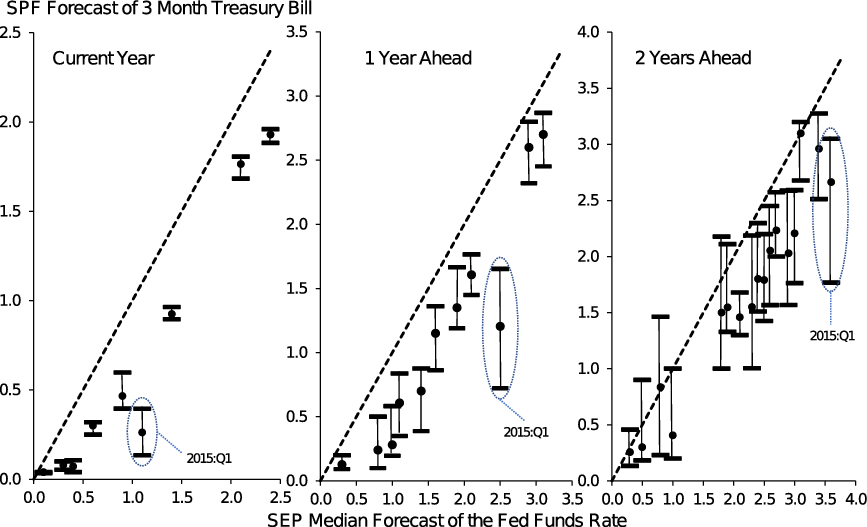
In addition, we argue that incorporating heterogeneous expectations is crucial to reconcile the model with the survey evidence. Survey evidence seems to run contrary to a model with homogeneous expectations where all agents are fully informed and rational, and their forecasts align with those of the central bank. As a way of illustrating this point, we look at how since 2012 the Federal Reserve has communicated its “Delphic” guidance via dot plots for the fed funds rate as part of the Fed’s SEP. Footnote 20 We compute the median SEP value of the fed funds rate from those dot plots for the current year and the following two years. We match each observation of the median SEP with the time-consistent individual forecast of the 3-month interest rate from the SPF for each forecasting horizon. We then calculate the pooled median and the 75th–25th percentile range of the individual SPF forecasts for each forecasting horizon and illustrate how those ranges relate with the SEP median in Figure 1.
Range of pooled 3-month interest rate projections from Survey of Professional Forecasters (SPF) vs. Federal reserve’s median Summary of Economic Projections (SEP) on the fed funds rate.
Note: Bars represent the 75th and 25th percentile while the dot indicates the median (50th percentile) of the pooled individual SPF forecasts conditional on each given value of the SEP median forecast over the sample period. Data covers from 2012 : Q1 till 2018 : Q4. The dashed line plots the 45 degree line for reference. 2015 : Q1 is the most significant outlier between the policy path indicated in the SEP and the SPF forecasts. This occurred as the Fed’s language shifted to prepare markets for liftoff from the ZLB. SOURCES: Federal Reserve’s Summary of Economic Projections (SEP); Survey of Professional Forecasters (SPF); authors’ calculations.

The results shown in this figure display notable discrepancies between the median SEP and median SPF forecasts and a sizeable dispersion of the individual SPF forecasts themselves. We argue that allowing for heterogeneous expectations would not be enough to match the evidence, as relying on the central bank’s communication about the interest rate path is the costless path to follow for everybody irrespective of whether or not agents are fully informed and rational, unless agents are also concerned about the credibility of those announcements (or for some other unmodeled reason choose to act sub-optimally relying on other likely worse forecasts of the policy rate). Even if forward guidance announcements are deemed perfectly credible, the forecasts of agents who are neither fully rational nor fully informed would tend to coalesce around the policy path announced by monetary authorities as this does not require any costly effort to either acquire or process the information. However, as shown in Figure 1, the empirical forecasts for private agents do not appear to coalesce around their SEP median counterparts.Footnote 21
We must recognize that, while heterogeneous beliefs can result from different causes, our structural model only allows heterogeneous expectations to arise as a result of imperfect credibility about the forward guidance announcements. How do we know this? Because the VAR representation accounted for in equation (25) is just a reduced-form representation of the solution of the structural model absent the forward guidance news shocks except at the point at which they materialize (see, e.g. Martinez-Garcia (2018)). In effect, the VAR solution representation in equation (25) is consistent with the structural solution that would characterize the equilibrium of such a model (when a unique solution exists).
Forward guidance credibility and the modeling structure. In general, aggregate expectations of private agents would be a convex combination weighed by a parameter
 $\tau $
that lies within the unit interval. This is the benchmark model we estimate in this paper and inevitably leads to an economy where forward guidance loses some of its power if
 $\tau $
is strictly less than one.
We choose to study forward guidance and central bank credibility with a relatively smaller scale New Keynesian model to avoid the danger of overparameterization. Using a larger scale model (e.g. Smets and Wouters (Reference Smets and Wouters2007)) would incorporate not only a richer set of equilibrium relationships but also would necessitate additional observables and shocks in the estimation to help identify a larger set of deep structural parameters. In that larger scale model, the number of structural parameters to estimate in equation (25) would expand. As discussed in Stock and Watson (Reference Stock and Watson2001), the potential issue with too many parameters is unreliable estimates. Thus, while it is indeed important to consider a larger-scale DSGE model that captures more of the equilibrium relationships between the variables, we limit the scope of our paper to examine the efficacy of forward guidance under imperfect credibility through the benchmark model presented earlier. We leave the exploration of a larger-scale DSGE model for future research. Footnote 22
3. Bayesian estimation methods
The workhorse New Keynesian model with forward guidance and central bank credibility that we have laid out here includes equations for aggregate demand (the dynamic IS curve), the New Keynesian Phillips curve (NKPC), potential output, the frictionless real interest rate (or natural rate), and the AR
 $\left( 1\right) $
processes for the productivity growth shock and for the cost-push shock. Moreover, the model is completed with a Taylor (Reference Taylor1993) monetary policy rule with inertia and surprise monetary policy shocks as well as forward guidance (news) shocks, and a recursive representation of the central bank’s promises regarding changes to future interest rates (announcements). The private agents’ expectations are based on a VAR if the central bank is not viewed as credible and based on FIRE expectations if credible, while heterogenous-beliefs aggregate expectations are weighted by a central bank’s credibility parameter. In other words, the benchmark model that we estimate includes equations (9), (10), (11), (12), (13), (14), (16), (19)–(21), (25), and (26). We implement our estimation strategy and approach using Dynare codes (Adjemian et al. (Reference Adjemian, Bastani, Juillard, Mihoubi, Perendia, Ratto and Villemot2011)).
3.1. Data sources
We utilize Bayesian estimation techniques with US macroeconomic time series variables at a quarterly frequency. Data for output, inflation, and interest rates correspond to US real GDP growth, the growth rate in the GDP deflator, and the fed funds rate. The relevant acronyms are GDPC1, GDPDEF, and FEDFUNDS with the data retrieved from the FRED database of the Federal Reserve Bank of St. Louis. We also employ observations for expectations of future macroeconomic variables. Specifically, we utilize expectations regarding one-quarter and two-quarters ahead output growth, one-quarter ahead inflation, and one-quarter to five-quarters ahead interest rates. These forecast series are retrieved from the SPF database of the Federal Reserve Bank of Philadelphia (FRB of Philadelphia (2019)).
Footnote 23
The relevant acronyms are RGDP, PGDP, and TBILL. In addition, our dataset spans the period from
 $1981\,:\,Q3$
through
 $2017\,:\,Q3$
with forecasts going up to
 $2018\,:\,Q4$
.
Footnote 24
3.2. Estimation strategy
3.2.1 Observation equations
The observation equations mapping the model variables into the data are given by the following system of equations:
 \begin{equation}\left[\begin{array}{c}g_{t}^{obs} \\[3pt]\pi _{t}^{obs} \\[3pt]i_{t}^{obs} \\[3pt]\mathbb{E}_{t}^{obs}\left( g_{t+1}\right) \\[3pt]\mathbb{E}_{t}^{obs}\left( g_{t+2}\right) \\[3pt]\mathbb{E}_{t}^{obs}\left( \pi _{t+1}\right) \\[3pt]\mathbb{E}_{t}^{obs}\left( i_{t+1}\right) \\[3pt]\mathbb{E}_{t}^{obs}\left( i_{t+2}\right) \\[3pt]\mathbb{E}_{t}^{obs}\left( i_{t+3}\right) \\[3pt]\mathbb{E}_{t}^{obs}\left( i_{t+4}\right) \\[3pt]\mathbb{E}_{t}^{obs}\left( i_{t+5}\right)\end{array}\right] =\left[\begin{array}{c}\Delta y_{t} \\[3pt]\pi _{t} \\[3pt]i_{t} \\[3pt]\mathbb{E}_{t}\left( \Delta y_{t+1}\right) \\[3pt]\mathbb{E}_{t}\left( \Delta y_{t+2}\right) \\[3pt]\mathbb{E}_{t}\left( \pi _{t+1}\right) \\[3pt]\mathbb{E}_{t}\left( i_{t+1}\right) \\[3pt]\mathbb{E}_{t}\left( i_{t+2}\right) \\[3pt]\mathbb{E}_{t}\left( i_{t+3}\right) \\[3pt]\mathbb{E}_{t}\left( i_{t+4}\right) \\[3pt]\mathbb{E}_{t}\left( i_{t+5}\right)\end{array}\right] +\left[\begin{array}{c}\bar{\gamma}^{g}+\gamma _{t} \\[3pt]\bar{\gamma}^{\pi } \\[3pt]\bar{\gamma}^{r} \\[3pt]\bar{\gamma}^{g^{1}}+\mathbb{E}_{t}\left( \gamma _{t+1}\right) \\[3pt]\bar{\gamma}^{g^{2}}+\mathbb{E}_{t}\left( \gamma _{t+2}\right) \\[3pt]\bar{\gamma}^{\pi } \\[3pt]\bar{\gamma}^{r^{1}} \\[3pt]\bar{\gamma}^{r^{2}} \\[3pt]\bar{\gamma}^{r^{3}} \\[3pt]\bar{\gamma}^{r^{4}} \\[3pt]\bar{\gamma}^{r^{5}}\end{array}\right] +\left[\begin{array}{c}\mathbf{0}_{3\times 8} \\[3pt]\mathbf{I}_{8\times 8}\end{array}\right] \left[\begin{array}{c}o_{t}^{g_{t+1}} \\[3pt]o_{t}^{g_{t+2}} \\[3pt]o_{t}^{\pi _{t+1}} \\[3pt]o_{t}^{i_{t+1}} \\[3pt]o_{t}^{i_{t+2}} \\[3pt]o_{t}^{i_{t+3}} \\[3pt]o_{t}^{i_{t+4}} \\[3pt]o_{t}^{i_{t+5}}\end{array}\right] , \end{equation}
where
 $g_{t}\equiv \Delta y_{t}$
represents the growth rate of output at time t. Observations for expectations include i.i.d. measurement error terms, that is,
 $o_{t}^{g_{t+1}}$
,
 $o_{t}^{g_{t+2}}$
,
 $o_{t}^{\pi _{t+1}}$
,
 $o_{t}^{i_{t+1}}$
,
 $o_{t}^{i_{t+2}}$
,
 $o_{t}^{i_{t+3}}$
,
 $o_{t}^{i_{t+4}}$
, and
 $o_{t}^{i_{t+5}}$
. This mapping is similar to that of Cole and Milani (Reference Cole and Milani2017) and consistent with the expectations-augmented approach to disentangle between news and surprises about monetary policy proposed by Doehr and Martinez-Garcia (Reference Doehr and Martínez-García2015).
It is important to clarify how the SPF expectations align with model implied expectations. From the SPF documentation (FRB of Philadelphia (2019)), the respondents of the SPF usually have to report their forecasts before the middle of the current quarter. For instance, in regard to forecasts for Q1, the deadline submission date is the second to third week of February. The nowcast is approximately a 2-month ahead forecast, while the one-quarter ahead is a 5-month ahead forecast and so on. For that reason, a number of papers in the literature most closely connected to ours map the nowcast of the forecasted variables of the SPF as the one-quarter ahead forecast in the model (e.g. that of Cole and Milani (Reference Cole and Milani2017)). In our baseline analysis, we also treat the SPF nowcast as corresponding to the one-quarter ahead forecasts in our benchmark model to ensure comparability. Footnote 25 However, in Subsection 5.2, we analyze the baseline results under a different (but still plausible) timing convention using instead one-quarter ahead SPF forecasts as the one-quarter expectations in the model.
3.2.2 Choice of priors
The choice of prior distributions on the structural parameters largely follows Smets and Wouters (Reference Smets and Wouters2007) and Cole and Milani (Reference Cole and Milani2017).
Footnote 26 The price indexation parameter
 $\iota _{p}$
is assumed to have a prior distribution of beta. We select a normal distribution centered over 1 for the prior distribution of the inverse of the Frisch elasticity of labor supply
 $\omega$
. We also assume persistence in the productivity growth and cost-push shocks as these both have beta prior distributions with mean of
 $0.50$
. To ensure positive values, the prior distributions on the standard deviations of the shocks are chosen to be inverse gamma.
The prior distribution of the policy parameters is also standard from prior studies. The priors on the
 $\chi _{\pi }$
and
 $\chi _{x}$
are both normal centered over
 $1.5$
and
 $0.125$
, respectively. We assume there exists a high degree of persistence a priori when the central bank adjusts the interest rate as
 $\rho$
follows a beta with mean
 $0.75$
. The prior assumptions on the previous three parameters follow from Smets and Wouters (Reference Smets and Wouters2007). In addition, the value of the forward guidance horizon is chosen to be 12 periods, that is,
 $L=12$
. This assumption is based on the FOMC statement utilizing time-contingent (calendar-based) forward guidance. Specifically, in September 2012, the FOMC stated “the Committee also anticipates that exceptionally low levels for the federal funds rate are likely to be warranted at least through mid-2015.” Thus, there are 12 quarters from September 2012 and “mid-2015” if the latter date is taken to be the end of quarter three of 2015.
The central parameter in our model is
 $\tau$
which measures the degree of central bank credibility in the economy. As described above, all agents in the economy believe central bank statements to be perfectly credible whenever
 $\tau = 1$
. If
 $\tau \rightarrow 0$
, the central bank is not perceived to be credible and agents do not factor forward guidance statements into their forecasts. In our benchmark estimation, we choose an informative prior distribution, a beta prior with mean
 $0.8$
based on ancillary evidence. To support this, we note that private forecasts tend to strongly and positively comove with the path indicated by the Fed even if the comovement is not perfect with the Fed’s own announcements across individual forecasters (as seen in Figure 1). However, as this parameter
 $\tau$
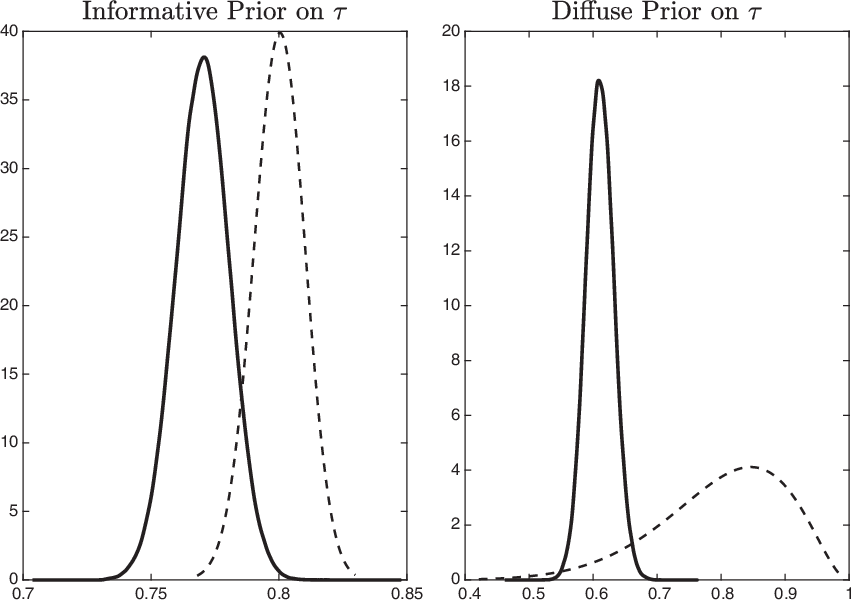
is central to our analysis, we will conduct some robustness checks in Subsection 4.2.2. Specifically, we compare the baseline results to the case if one is more agnostic about the true value of
 $\tau $
and adopts a less informative prior distribution.
3.2.3 Reduced-form forecasting model
The current paper assumes that expectations for the entire economy are composed of a weighted sum of FIRE expectations and VAR-based expectations. As stated in equation (25), the latter type of agents form expectations via a VAR
 $\left( 1\right) $
process. However, it is important to motivate the lag length of this forecasting model. To accomplish this task, we calculate the Bayes Information Criterion (BIC) for a VAR
 $\left(1\right) $
, a VAR
 $\left( 2\right) $
, and a VAR
 $\left(3\right) $
model on the vector of observables
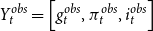 $Y_{t}^{obs}=\left[g_{t}^{obs},\pi _{t}^{obs},i_{t}^{obs}\right] $
.
Footnote 27
The BIC values for the three models are
 $-31.16$
,
 $-20.05$
, and
 $4.56$
, respectively. Thus, we utilize the VAR
 $\left( 1\right) $
as it has the lowest BIC.
4. Main results
4.1 Estimates of central bank credibility
We now proceed with our main empirical exercise to investigate the effects that central bank credibility has on the efficacy of forward guidance. When we estimate
 $\tau$
, we refer to this case as the not perfectly credible central bank scenario and denote the estimate as
 $\widehat{\tau }$
. When we do not estimate
 $\tau$
and assume private agents perceive the monetary authority to be perfectly credible, we simply set the credibility parameter to be
 $\tau =1$
in the estimation. The results are shown via three channels: posterior point estimates, variance decomposition, and impulse response functions under both perfectly credible and imperfectly credible central bank scenarios.
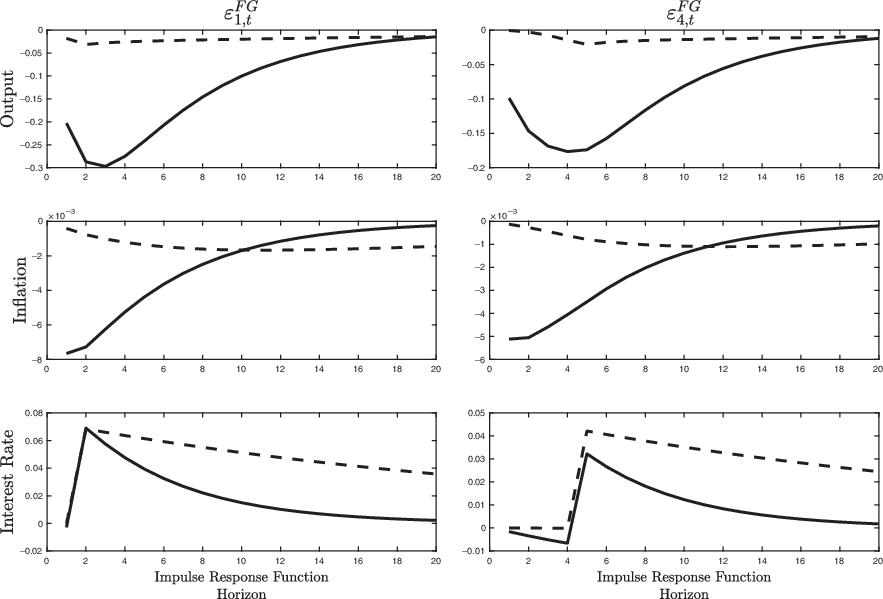
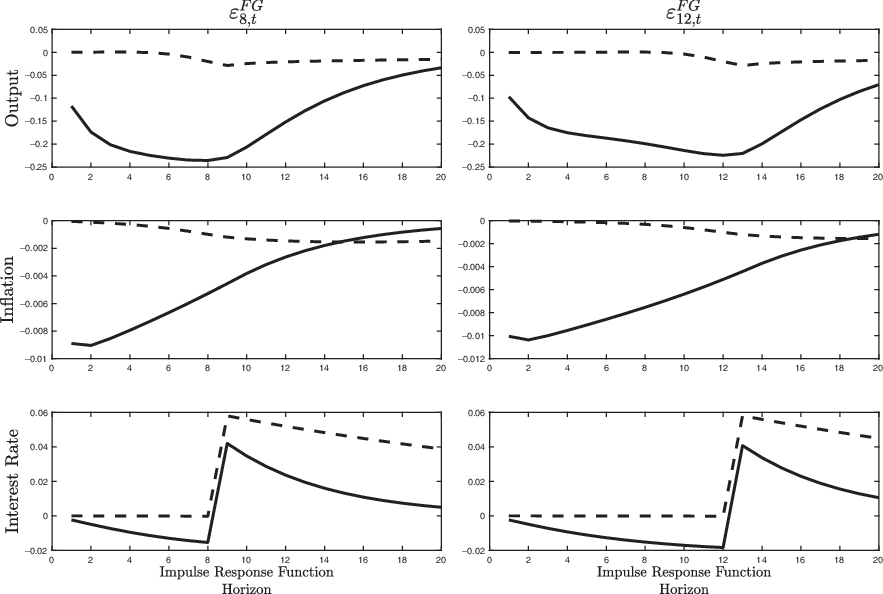
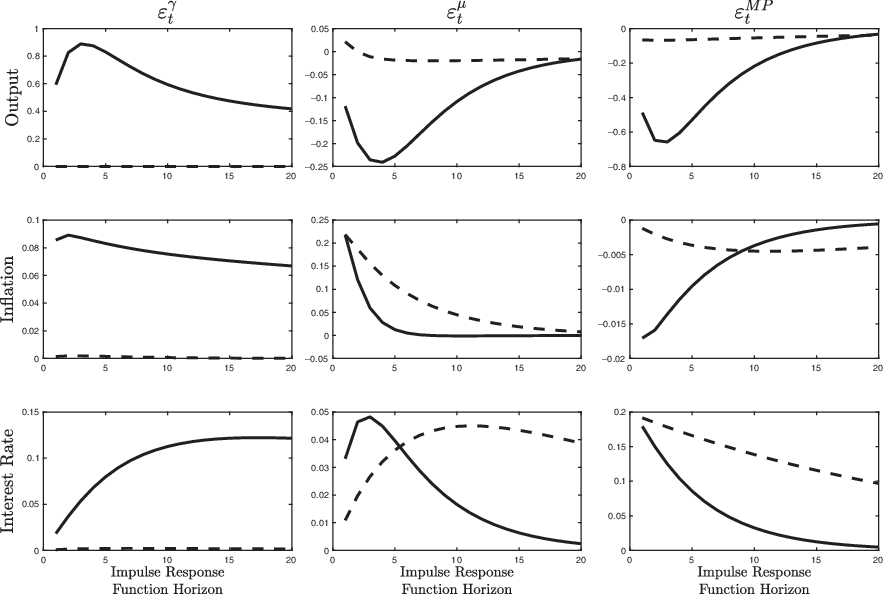
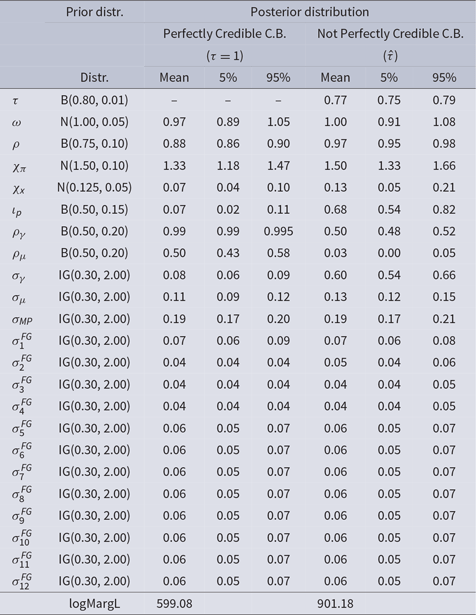
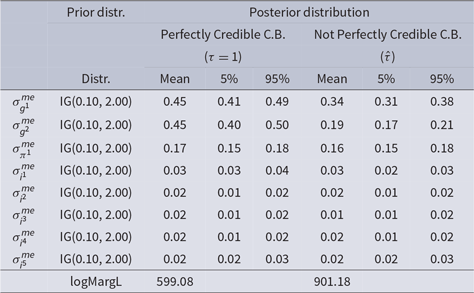
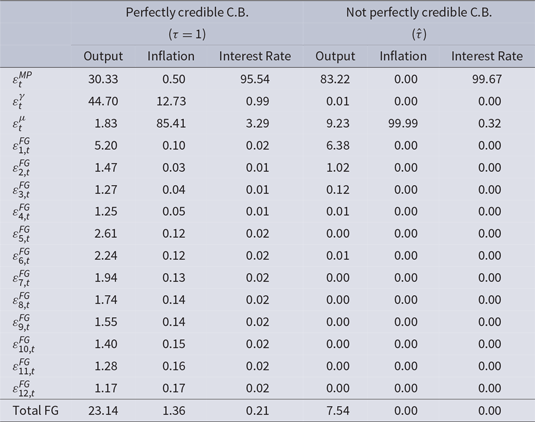
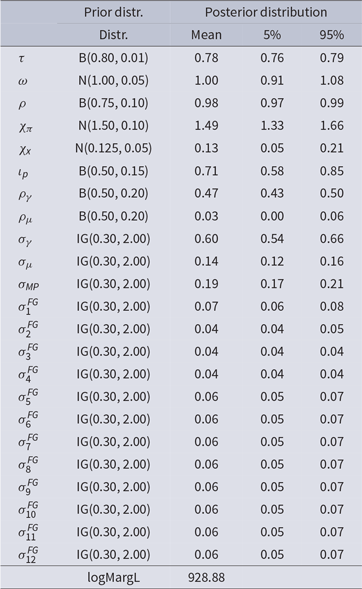
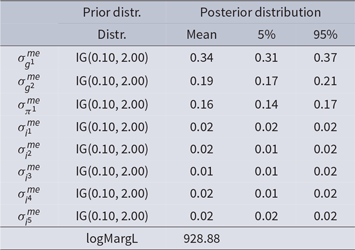
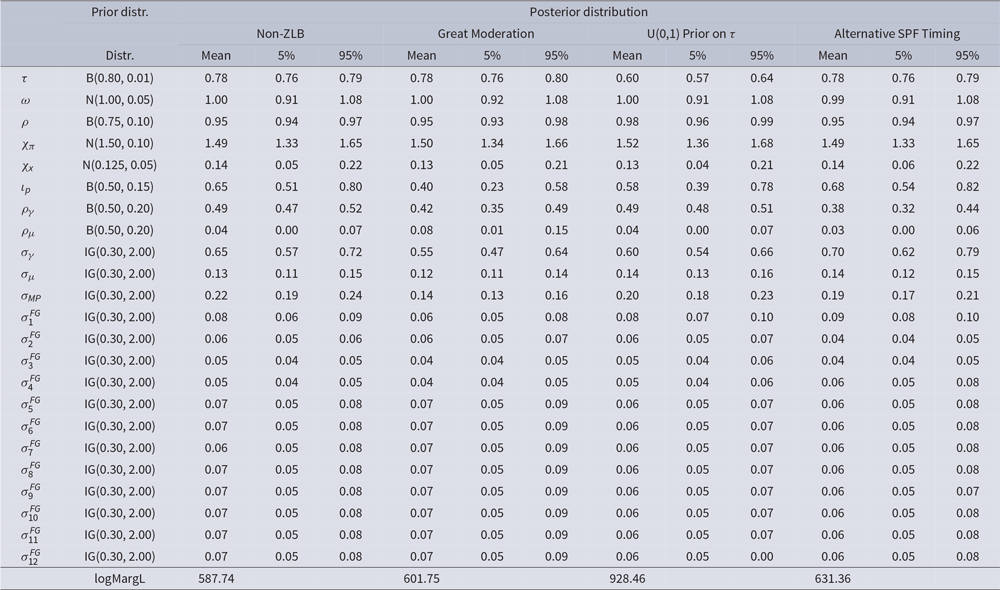
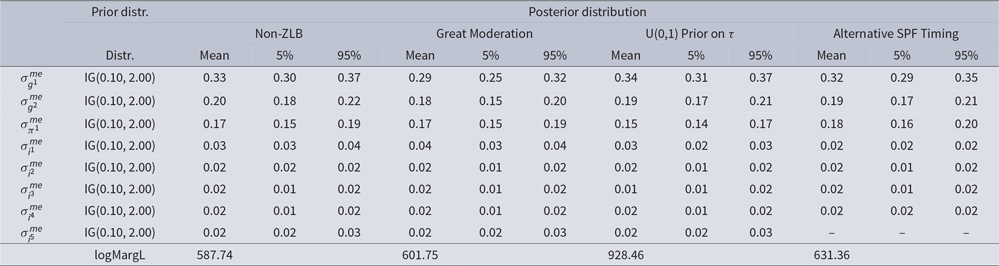
Tables 1 and 2 display the posterior mean and 90% highest posterior density interval estimates. Table 3 shows the conditional variance decomposition upon impact of the forward guidance and all other structural shocks with parameter values at their posterior mean. The last line calculates the sum of all the variation in the macroeconomic variable due to the forward guidance shocks. Figures 2 and 3 display the impulse response functions to forward guidance shocks at different horizons while Figure 4 displays the impulse response functions for the productivity growth, cost-push, and unanticipated monetary policy shocks. Each panel shows the mean response of the model-implied output and the other macro observables (inflation and interest rate). The solid line represents the scenario where
 $\tau =1$
, while the dashed line denotes
 $\widehat{\tau }$
.
Impulse response functions. Mean response of model-implied output and observables (inflation and interest rate) to one-period ahead forward guidance and four-period ahead forward guidance shocks. Solid Line: Perfectly Credible C.B. (i.e.
 $\tau=1$
). Dashed line: Not Perfectly Credible C.B. (i.e. Benchmark
 $\hat{\tau}$
). C.B.: Central Bank.

Impulse response functions. Mean response of model-implied output and observables (inflation and interest rate) to eight-period ahead forward guidance and twelve-period ahead forward guidance shocks. Solid Line: Perfectly Credible C.B. (i.e.
 $\tau=1$
). Dashed line: Not Perfectly Credible C.B. (i.e. Benchmark
 $\hat{\tau}$
). C.B.: Central Bank.

Impulse response functions. Mean response of model-implied output and observables (inflation and interest rate) to productivity growth, cost-push, and unanticipated monetary policy shocks. Solid Line: Perfectly Credible C.B. (i.e.
 $\tau=1$
). Dashed line: Not Perfectly Credible C.B. (i.e. Benchmark
 $\hat{\tau}$
). C.B.: Central Bank.

Prior & Posterior estimates of structural parameters

Note: C.B.: Central Bank, G: Gamma Distribution, N: Normal Distribution, B: Beta Distribution, U: Uniform Distribution, IG: Inverse-Gamma Distribution.
Prior & Posterior estimates of measurement errors
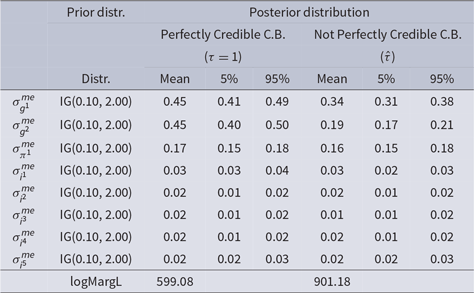
Note: C.B.: Central Bank, G: Gamma Distribution, N: Normal Distribution, B: Beta Distribution, U: Uniform Distribution, IG: Inverse-Gamma Distribution.
Variance decomposition upon impact

Note: This table computes the conditional variance decomposition upon impact of the structural and forward guidance shocks with parameter values at their posterior mean. Each column displays the percentage contribution of each shock to model-implied output and observables (inflation and interest rates). Total FG denotes the sum of all of the forward guidance shocks. The measurement errors are not shown as their contribution concerns expected values of observables.
We first examine the case in which the monetary authority is perceived to be perfectly credible. In Tables 1 and 2 the first three columns under “Posterior Distribution” show that the estimates of the main structural parameters largely align with prior literature. The estimated value of the inverse of the Frisch elasticity of labor supply
 $\omega=0.97 $
follows closely that of CÚrdia et al. (2015). The interest rate smoothing parameter is estimated to be high at
 $0.88$
which closely aligns with the value found in Milani (Reference Milani2007) using a model with FIRE expectations. The estimates for the degree of productivity growth inertia (
 $\rho _{\gamma }$
) and inflation indexation (
 $\iota _{p}$
) roughly follow the results found in CÚrdia et al. (2015) under their “W” rule.
Footnote 28
The solid lines in Figures 2 and 3 show the mean impulse response whenever
 $\tau =1$
to a one standard deviation increase in a shock. Specifically, given that agents are forward looking, news that the interest rate will increase 1, 4, 8, or 12 periods ahead affects agents’ intertemporal decisions by (noticeably) lowering output and inflation on impact. When the shock is realized on the economy, output (roughly) reaches its trough. Since those who perceive the monetary authority to be perfectly credible form their expectations under FIRE, these agents completely understand the shock has already materialized, and thus, output, inflation, and interest rates proceed to return back to steady state.
Footnote 29
What are the predicted effects if the central bank is not assumed to be perfectly credible? To answer this question, we first analyze the posterior estimates in the last three columns in Tables 1 and 2. Overall, the values of the main structural parameters do not drastically differ from the perfectly credible case, but do display a few slight differences. For instance, in the last three columns under “Not Perfectly Credible C.B.,” the estimated value of the autoregressive parameter on the cost-push shock is relatively lower than in the
 $\tau =1$
scenario. However, this lower persistence could instead be picked up by the higher estimates for the inflation indexation parameter relative to the perfectly credible central bank case.
Footnote 30
More importantly, when allowing private agents the option of not fully believing forward guidance statements about the path of interest rates, the estimate of the credibility parameter
 $\tau $
is
 $0.77$
. This value indicates a certain level of trust in the Federal Reserve implying some effectiveness of forward guidance on the economy.
Footnote 31
However, the fact that this estimated value is not close to
 $\tau =1$
suggests that private agents do not believe the monetary authority to be perfectly credible (or at least act in forming their expectations as if monetary policy announcements were not fully credible).
The ramifications of this result are a dampening of the power of forward guidance on the economy. Figures 2 and 3 display this outcome. The impulse responses under
 $\widehat{\tau }$
(dashed line) follow similar paths as under
 $\tau =1$
(solid line). However, the dashed line is not as reactive to central bank forward guidance as the solid line. Specifically, the initial impact of output and inflation to forward guidance news is larger under the perfectly credible case than under the imperfectly credible scenario. When the forward guidance shock is realized on the economy l periods later, the responses of output and inflation are also overall larger under
 $\tau =1$
than
 $\widehat{\tau }$
. The reason for the discrepancies is that private agents believe central bank statements about future interest rates under the
 $\tau =1$
scenario, and thus, fully internalize the effects of forward guidance. In contrast, agents who do not fully believe forward guidance commitments do not incorporate the full effects of forward guidance, and thus, macroeconomic variables are not as responsive.
Variance decomposition results also display the diminished effects of forward guidance on the economy under an imperfectly credible monetary authority. In Table 3 we compute the conditional variance decomposition upon impact of the shocks with parameter values at their posterior mean. The combined contribution of the forward guidance shocks to output and inflation is less under
 $\widehat{\tau }$
than
 $\tau =1$
. Under a central bank that is perceived as imperfectly credible, the total contribution of
 $\varepsilon _{1,t}^{FG}$
,
 $\varepsilon _{2,t}^{FG}$
,…,
 $\varepsilon _{12,t}^{FG}$
to output and inflation is
 $7.53\%$
and
 $0.00\%$
, respectively.
Footnote 32
Under a monetary authority perceived as perfectly credible, the combined contribution is
 $23.14\%$
and
 $1.36\%$
. Thus, if a central bank is perceived as more credible, there exist greater effects on the real economy from forward guidance but little effect on inflation. To put it another way, if the central bank is less credible, the effects on output are not as great relative to the perfectly credible scenario.
The results show that modeling forward guidance credibility contributes to dampen the large effects that led Del Negro et al. (Reference Del Negro, Giannoni and Patterson2012) to question the magnitudes of the anticipation impact in the New Keynesian model (which these authors termed the “forward guidance puzzle”). In their paper, Del Negro et al. (Reference Del Negro, Giannoni and Patterson2012) explain that a standard New Keynesian model similar to the one presented in Section 2 produces surprisingly large responses of the macroeconomic variables to forward guidance shocks. In contrast, our paper allows for private agents to not perceive the monetary authority as perfectly credible. As discussed in the previous paragraphs, the results show that the reaction of macroeconomic variables to forward guidance shocks is dampened and therefore is not as sizeable under
 $\widehat{\tau }$
relative to
 $\tau =1$
.
The prior literature has offered different views on the “forward guidance puzzle”. For instance, Del Negro et al. (Reference Del Negro, Giannoni and Patterson2012) show unusually large responses of the macroeconomic variables to forward guidance via a constant interest rate scenario. Bundick and Smith (Reference Bundick and Smith2020) and Kiley (Reference Kiley2016) utilize elasticities of output relative to a change in future interest rates when comparing model- and data-implied forward guidance effects. Footnote 33 McKay et al. (Reference McKay, Nakamura and Steinsson2016) present the puzzle via a one-period anticipated interest rate shock occurring at time T in the future. However, they analyze the effects of forward guidance under complete and incomplete asset markets, whereas in our paper we focus on the role of central bank forward guidance credibility (or lack thereof).
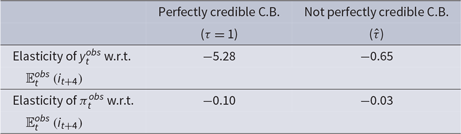
In all of these cases, the point of reference is somewhat different and the quantification and interpretation are also a bit different as a result. In all papers cited, the results are model-dependent and, to our knowledge, none of the related papers have explored the potential role of credibility and heterogeneous expectations as we do. Hence, it is hard to make an apples-to-apples comparison across the different contributions to the literature to neatly show how our results compare. Nevertheless, we compute elasticities of output and inflation to a change in expected interests rates four-periods ahead which is a similar conceptual exercise to what Bundick and Smith (Reference Bundick and Smith2020) do. Specifically, we divide the trough response of output (inflation) to the four-period ahead forward guidance shock seen in Figure 2 by the response of (observed) expected interest rates four-periods ahead. We compute these statistics across both the
 $\tau=1$
and
 $\hat{\tau}$
cases.
Table 4 shows that the elasticities of output are
 $-5.28$
and
 $-0.65$
under the
 $\tau=1$
and
 $\hat{\tau}$
scenarios, respectively. In other words, under perfect credibility, a one percentage point increase in expected four-quarter ahead interest rates is associated with a
 $5.28$
percentage point drop in output at its trough point. Under imperfect credibility, the maximum decrease in output is
 $0.65$
, confirming our benchmark results that show the assumption of a perfectly credible central bank can overstate the predicted effects of forward guidance on the economy. The elasticities of inflation are
 $-0.10$
and
 $-0.03$
under the
 $\tau=1$
and
 $\hat{\tau}$
scenarios, respectively. We also should note that the elasticity numbers for the
 $\hat{\tau}$
scenario are less than the values found in Bundick and Smith (Reference Bundick and Smith2020). We attribute the difference, at least in part, to the fact that their analysis implicitly assumes fully credible forward guidance commitments. In our paper, we have argued and shown that the credibility assumption greatly affects the efficacy of forward guidance on the economy as shown in Table 4 as well as in Figures 2 and 3.
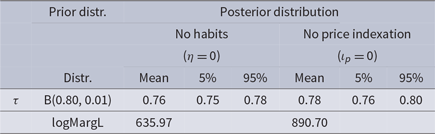
Posterior estimates of structural parameters without frictions

Note: B: Beta Distribution.
Estimated elasticity of output and inflation with respect to 1-year ahead expected interest rates

Overall, the results of our main exercise suggest a number of takeaways. Our estimate of the Federal Reserve’s credibility is high at
 $\widehat{\tau }=0.77$
. However, this estimated value is below the fully credible case which leads to a substantial attenuation of the power of forward guidance. If the central bank is perceived as less credible, there exist less immediate and overall effects on the economy from forward guidance. Hence, the integration of imperfect central bank credibility with heterogeneous expectations into a standard macroeconomic model can be another feature of the economy that contributes to mute the effects of forward guidance. Thus, accounting for imperfect credibility is important to model the formation of expectations in the economy and the transmission mechanism of forward guidance announcements.
4.2. Evidence that
 $\tau$
reflects central bank credibility

Our paper models aggregate expectations as a weighted average of those who take central bank forward guidance statements as fully credible and those that do not. The former group forecasts macroeconomic variables under the FIRE assumption, while the latter uses a data-driven VAR
 $\left( 1\right) $
model. In equation (26), the parameter
 $\tau$
measures the degree of central bank credibility in terms of forward guidance. This parameter was taken to be constant and exogenous for simplicity, similar to what the prior literature does (e.g. Haberis et al. (Reference Haberis, Harrison and Waldron2014)). However, a perennial question is to what extent
 $\tau$
reflects central bank credibility? To try to explore this question further, we perform three exercises that give us additional confidence that
 $\tau$
is capturing a measure of monetary authority credibility. Specifically, we examine the influence of frictions on the estimate of
 $\tau$
, the influence of the reduced-form forecasting model on
 $\tau$
, and the comovements between forecast errors and forecast disagreements in the SPF dataset relative to those implied by our benchmark model with imperfect credibility.
4.2.1 Alternative macro persistence features
The VAR
 $\left( 1\right) $
framework that private agents who do not believe the monetary authority to be credible utilize to construct forecasts involves inherent persistence in the macroeconomic variables. Because our benchmark model incorporates a number of standard macro persistence features (such as habit formation and price indexation) to get at the persistence of the macro variables, it is of interest to investigate if the estimated credibility parameter is sensitive to those features. Intuitively, the hypothesis here is that perhaps the inclusion of macro inertia features may affect the fit of the model at the expense of biasing our estimates of
 $\tau$
. Thus, we analyze the results when habits in consumption (
 $\eta $
) and price indexation (
 $\iota _{p}$
) are turned off and compare them to the baseline outcomes.
First, when habits in consumption are shut off (i.e.
 $\eta =0$
), the results do not noticeably change. Under the “
 $\eta =0$
” column, Table 3 displays that the estimate for
 $\tau $
is
 $0.76$
, which is virtually identical to our benchmark estimate of
 $0.77$
. The posterior mean estimates of the other parameters are largely the same as under the benchmark
 $\hat{\tau}$
scenario in Table 1 and Table 2. Second, when the degree of price indexation is turned off (i.e.
 $\iota_{p}=0$
), the posterior estimates of the parameters are largely unchanged. In particular, the “
 $\iota _{p}=0$
” column in Table 3 displays that the estimate of
 $\tau $
at
 $0.78$
is about the same as the benchmark case with price indexation.
Thus, the results shown in Table 3 provide further evidence that our estimate of
 $\tau $
is quite robust to alternative macro persistence features. In other words,
 $\tau $
does not seem to be reflecting a bias from lagged consumption or inflation. This does not say that
 $\tau $
is necessarily a good measure of central bank credibility on forward guidance, but it suggests that
 $\tau $
is not making up for the persistence in the data from unmodeled features in our benchmark.
4.2.2 Alternative reduced-form forecasting model
We also examine the estimation of the central bank credibility parameter
 $\tau$
under alternative specifications of the forecasting models used by the private sector. The benchmark case in Section 4 assumed private sector agents who do not believe the monetary authority to be credible would form expectations from a VAR
 $\left( 1\right) $
based on (25). In turn, private agents who believe the central bank follow FIRE expectations. However, a natural question arises regarding whether the estimated value of
 $\tau $
is sensitive to the information set in the forecasting model of private sector agents?
Here, we examine the case when private agents that do not believe the central bank know more about the true structure of the economy. That is, we explore the case when not credible expectations (
 $\mathbb{E}_{t}\left(Y_{t+1}^{D}\right) $
) become better informed than under equation (25). Private agents are assumed to know now the productivity and cost-push shock realizations, that is,
 $w_{t}=\left[\gamma _{t},\mu _{t}\right] ^{^{\prime }}$
, when formulating their expectations of future macroeconomic variables. Thus, equation (25) is replaced with:
 \begin{equation}Y_{t}=A+BY_{t-1}+Cw_{t}+e_{t},\end{equation}
where A, B, and C are coefficient matrices of appropriate dimensions, and
 $e_{t}$
is a vector of white noise (nonstructural) residual terms.
Tables 6 and 7 produce two main takeaways. First, additional knowledge (or information) about the true structure of the economy seems to have minimal effect on the posterior estimates of the parameters. In Table 6, the estimate of our central bank credibility parameter is
 $0.78$
. This value is approximately the same as our baseline estimate of
 $0.77$
.
Footnote 34
Thus, even if private agents utilize a forecasting model with more information, the results do not substantially change. In particular, there still are noticeable effects of forward guidance on the economy as private agents are estimated to believe the Fed to be highly credible, although below the fully credible case of
 $\tau =1$
.
Prior & Posterior estimates of structural parameters with alternative non-credible expectations

Note: G: Gamma Distribution, N: Normal Distribution, B: Beta Distribution, U: Uniform Distribution, IG: Inverse-Gamma Distribution.
Prior & Posterior estimates of measurement errors with alternative non-credible expectations

Note: G: Gamma Distribution, N: Normal Distribution, B: Beta Distribution, U: Uniform Distribution, IG: Inverse-Gamma Distribution.
The second takeaway is that, since the estimate of
 $\tau $
does not significantly change when private agents are more informed,
 $\tau $
does not seem to be capturing private agents’ lack of knowledge about the true structure of the economy. In other words, it does not seem biased due to not knowing productivity growth and cost-push shocks. Thus, because the value of
 $\tau $
does not seem to depend on these other non-forward guidance elements, this latter result suggests once more that what ultimately underpins
 $\tau $
must be something else like central bank credibility on forward guidance.
4.2.3 Predictability of forecasting errors
Our benchmark model assumes that expectations in the economy are a weighted sum of private agents who believe the central bank to be perfectly credible and private agents who believe the monetary authority not to be credible. The former forecasts macroeconomic variables under the assumption of FIRE expectations, while the latter uses a data-driven VAR
 $\left( 1\right) $
model. However, a question naturally arises as to whether heterogeneous expectations (with a non-FIRE component) aggregated by
 $\tau $
or the perfectly credible, homogeneous and FIRE expectations case is the more plausible way to describe the observed SPF expectations?
Standard macroeconomic models often consider only the
 $\tau =1$
case, that is, homogeneous FIRE expectations. In this scenario, if we take the model to be the true data-generating process, forecast errors will be random and on average equal to zero (see, e.g. Sims (Reference Sims2002) and Cole and Milani (Reference Cole and Milani2017)). Moreover, in this case expectations are by construction homogeneous, there are no model-implied forecasting disagreements and thus forecasting errors would not be dependent or correlated with forecasting disagreements among private agents. However, do the forecast errors from the data agree with those implications of the
 $\tau =1$
scenario? Or does the imperfect credibility scenario with
 $\widehat{\tau }$
capturing the estimated central bank credibility fit the SPF data better? To explore these questions further, we compare the forecast errors from our model with imperfect central bank credibility to what is found in the observed SPF forecasting data.
Footnote 35
We proceed in the following manner. We define forecasting errors of the interest rate at the one-quarter ahead horizon as
 $FE_{t}^{1}=\mathbb{E}_{t-1}\left( i_{t}\right) -i_{t}$
where the expectations
 $\mathbb{E}_{t-1}\left( i_{t}\right)$
are being matched to the mean SPF forecast. The remaining forecast errors are defined as
 $FE_{t}^{2}=\mathbb{E}_{t-2}\left( i_{t}\right) -i_{t}$
,
 $FE_{t}^{3}=\mathbb{E}_{t-3}\left( i_{t}\right) -i_{t}$
,
 $FE_{t}^{4}=\mathbb{E}_{t-4}\left( i_{t}\right) -i_{t}$
, and
 $FE_{t}^{5}=\mathbb{E}_{t-5}\left(i_{t}\right) -i_{t}$
at the two, three, four, and five-quarters ahead horizons, respectively. Forecasting disagreement (
 $DEV_{t}^{1}$
) at the one-quarter ahead horizon is specified as the difference between the 75th and 25th percentile (i.e., the interquartile range of the SPF data). The remaining forecasting disagreements are given by
 $DEV_{t}^{2}$
,
 $DEV_{t}^{3}$
,
 $DEV_{t}^{4}$
, and
 $DEV_{t}^{5}$
at the two, three, four, and five-quarters ahead horizons, respectively.
We collect data from the US economy. Forecasting errors are computed with respect to the mean forecast with SPF data. The relevant acronym is TBILL. Forecasting disagreements are measured with the interquartile range of the cross-sectional distribution of individual forecasts to make the empirical results less sensitive to outliers.
Footnote 36
The data span
 $1981\,:\,Q3-2018\,:\,Q4$
for the baseline case implying 150 observations. We run separate regressions of
 $FE_{t}^{h}$
on
 $DEV_{t}^{h}$
at the one, two, three, four, and five-quarters ahead horizons (
 $h=1,2,3,4,5$
):
 \begin{align}FE_{t}^{1} &= \delta _{0}^{1}+\delta _{1}^{1}DEV_{t}^{1}+e_{t}^{1}, \end{align}
 \begin{align}FE_{t}^{2} &= \delta _{0}^{2}+\delta _{1}^{2}DEV_{t}^{2}+e_{t}^{2}, \end{align}
 \begin{align}FE_{t}^{3} &= \delta _{0}^{3}+\delta _{1}^{3}DEV_{t}^{3}+e_{t}^{3}, \end{align}
 \begin{align}FE_{t}^{4} &= \delta _{0}^{4}+\delta _{1}^{4}DEV_{t}^{4}+e_{t}^{4}, \end{align}
 \begin{align}FE_{t}^{5} &= \delta _{0}^{5}+\delta _{1}^{5}DEV_{t}^{5}+e_{t}^{5}.\end{align}
The regression error terms are described by
 $e_{t}^{1}$
,
 $e_{t}^{2}$
,
 $e_{t}^{3}$
,
 $e_{t}^{4}$
, and
 $e_{t}^{5}$
at the one, two, three, four, and five-quarters ahead horizons, respectively.
We perform the same exercise using the simulated counterparts from our benchmark model with imperfect central bank credibility and heterogeneous expectations. Specifically, we simulate the model at the posterior mean for a time period of 2,000 observations discarding the first 100 simulated observations. We then perform the same regressions given by equations (29)-(33) on a random window of 150 observations. Footnote 37 We compute our results on 10,000 different draws of the simulated data.
The full range of estimates are represented in Figure 5, which shows a box-and-whisker plot that displays their min, max, median, and interquartile range. The point estimates obtained from the SPF data are also shown in Figure 5. The solid line with circle markers denote estimates of
 $\delta _{1}^{1}$
,
 $\delta _{1}^{2}$
,
 $\delta _{1}^{3}$
,
 $\delta _{1}^{4}$
, and
 $\delta _{1}^{5}$
over the full sample (i.e.
 $1981\,:\,Q3-2018\,:\,Q4$
). The dashed line with diamond markers represent estimates from the non-ZLB period of our dataset, that is, from the
 $1981\,:\,Q3-2008\,:\, Q4$
subsample.
Estimates of forecasting errors response to forecasting disagreement, Survey of Professional Forecasters (SPF) vs. Simulated Data. Note: Forecasting errors are computed with respect to the mean forecast with SPF data from 1981 : Q3 until 2018 : Q4 (150 observations). Forecasting disagreements are measured with the interquartile range of the cross-sectional distribution of individual forecasts in order to make the empirical results less sensitive to outliers. We regress forecasting errors on an intercept and this measure of forecasting disagreement for all available time horizons. We perform the same exercise on a random window of 150 observations from a simulated sample data of 2000 observations under
 $\hat{\tau}$
. We represent the full range of estimates over 10000 draws with box-and-whisker plots that show their min, max, median, and interquartile range. SOURCES: Survey of Professional Forecasters (SPF), simulated data, authors’ calculations.

We first examine what the US data would postulate regarding the relationship between forecasting errors and forecasting disagreements. By using SPF data, estimates of
 $\delta _{1}^{1}$
,
 $\delta _{1}^{2}$
,
 $\delta _{1}^{3}$
,
 $ \delta _{1}^{4}$
, and
 $\delta _{1}^{5}$
show that forecasting errors are positively correlated with forecasting disagreement. The circle and diamond markers in Figure 5 are positive and notably display an upward trajectory as the forecast horizon increases. This challenges the assumption that forecasting errors ought to be unpredictable under the perfect credibility case with FIRE expectations whenever
 $\tau =1$
.
Another implication of the SPF results in Figure 5 is that the mean SPF forecast tends to overestimate the expected path of the US short-term interest rate more whenever disagreement among forecasters exists, and this tends to be more apparent at longer horizons. What occurs when private agents perceive the central bank as not perfectly credible in the model? The simple answer is that the model under
 $\widehat{\tau }$
seems to match the SPF data fairly well on that account too.
In Figure 5, the estimates
 $\delta _{1}^{1}$
,
 $\delta _{1}^{2}$
,
 $\delta _{1}^{3}$
,
 $\delta _{1}^{4}$
, and
 $\delta _{1}^{5}$
using SPF data lie toward the median of their respective box-and-whisker plots under
 $\widehat{\tau }$
. The median of the box-and-whisker plots is also in positive territory which matches their counterparts in the data. In addition, under both SPF and simulated data, estimates of
 $\delta _{1}^{1}$
,
 $\delta _{1}^{2}$
,
 $\delta _{1}^{3}$
,
 $\delta _{1}^{4}$
, and
 $\delta _{1}^{5}$
display an upward trend the longer the forecasting horizon. This finding suggests that a model of imperfect credibility and heterogeneous expectations is better suited to capture forecasting disagreements and the predictability of forecasting errors based on disagreement that we observe in the SPF data.
In short, as noted before, our model of central bank credibility and heterogeneous expectations offers a way to account for the imperfect comovement between the Fed’s forward guidance and the individual projections of private forecasters in the SPF. We hinted at that in Figure 1 for the Fed’s most recent phase of “Delphic” forward guidance. Our imperfectly credible central bank model extends that idea in a flexible manner to explore the full sample since the onset of the Great Moderation in the 1980s and tease out a common measure of credibility across different strategies (or phases) in the Fed’s use of forward guidance. What we find in Figure 5 is that this theoretical framework matches well key facts of the SPF data. In the SPF data, there exists indeed notable disagreements among forecasters which the fully credible central bank model (i.e. the
 $\tau =1$
scenario) cannot capture. Furthermore, the fully credible central bank model cannot account for the robust evidence found in the SPF that forecasting errors are predictable on the basis of forecasting disagreements either.
This is not to say that monetary policy credibility explains all forecasting disagreements, but it shows that imperfect credibility is a plausible reason for forecasting heterogeneity that can bring the workhorse New Keynesian model closer to the empirical evidence that we observe in the SPF data.
5. Robustness
A main result of our paper is that the higher the value of the central bank credibility parameter,
 $\tau $
, the greater the effects of forward guidance on the economy. In particular,
 $\tau$
is estimated to be
 $0.77$
for the US economy. This high value implies a higher degree of Federal Reserve credibility as perceived by private agents in the economy, and thus, it implies that the Fed retains a degree of effectiveness from forward guidance. However, the estimated value of
 $\tau $
is below the fully credible case (i.e. below
 $\tau =1$
).
In the previous section, we showed already that the finding is robust in the presence of macroeconomic persistence features and to an alternative forecasting model used by private sector agents. In the following subsections, we analyze in further detail the robustness of the result. Specifically, we examine the sensitivity of the benchmark outcomes to the time period used in the estimation, the prior beliefs about
 $\tau $
, and the timing assumption matching SPF forecasts to our model’s expectations.
5.1 Subsamples
5.1.1 Non-ZLB
Monetary policy was instrumented with the fed funds rate until hitting the ZLB in the aftermath of the
 $2007-2009$
global financial crisis. It is important to compare the effect of central bank credibility on forward guidance during the non-ZLB and ZLB periods to assess whether our findings are sensitive across subsamples. Thus, in this subsection, we re-estimate the model over the subsample
 $1981\,:\,Q3-2008\,:\,Q4$
and compare the results to our benchmark outcomes.
The “Non-ZLB” column in Tables 8 and 9 displays the results. Even during an era where the interest rate does not bind at zero, our baseline result still holds. Specifically, the value of
 $\tau$
is estimated to be
 $0.78$
, which is about the same as our benchmark estimate of
 $0.77$
. The values of the other parameters do not considerably change either. Therefore, noticeable effects of forward guidance on the economy exist during the non-ZLB period when a high degree of Federal Reserve credibility is estimated to exist. However, the estimate of
 $\tau$
remains below the fully credible central bank scenario.
Prior & Posterior estimates of structural parameters under robustness checks

Note: G: Gamma Distribution, N: Normal Distribution, B: Beta Distribution, U: Uniform Distribution, IG: Inverse-Gamma Distribution.
Prior & Posterior estimates of measurement errors under robustness checks

Note: G: Gamma Distribution, N: Normal Distribution, B: Beta Distribution, U: Uniform Distribution, IG: Inverse-Gamma Distribution.
5.1.2 Great moderation
Our full sample includes periods of relatively high volatility in the macroeconomic variables (i.e. pre-1985) and to some extent from the
 $2007-2009$
global financial crisis onward. Hence, it is also important to examine whether the effect of central bank credibility on forward guidance is the same or not during a more stable time period. Thus, this subsection compares the benchmark estimation to the case in which we re-estimate the model over the subsample
 $1985\,:\,Q1-2007\,:\,Q3$
. This period has been called the “Great Moderation” in which the volatility in macroeconomic variables was relatively low (see, e.g. Clark (Reference Clark2009) and Martinez-Garcia (2018)).
The estimates of the structural and measurement error parameters of this exercise are displayed in the “Great Moderation” column of Tables 8 and 9. The results show that the main takeaway from Section 4 does not change. The estimate of our central bank credibility parameter is
 $0.78$
, which is very similar to our baseline value. Thus, there exists a high degree of central bank credibility in the US during its most stable economic period within the full sample, which provides further evidence that the effect of forward guidance appears largely unchanged over time in the US. And, once again confirms that
 $\widehat{\tau }$
is below the fully credible central bank case.
5.2 Alternative priors on the credibility parameter
Our baseline prior assumption for
 $\tau $
assumed a high degree of central bank credibility. This value seems reasonable and fits well with the Federal Reserve’s strong reputation and the related results in Park (Reference Park2018) who reports high values for Federal Reserve credibility as well. We have also alluded previously to the evidence in Figure 1. This evidence shows that while private forecasts do not seem to perfectly coalesce around the Fed’s own projections as we would expect them under the assumption of perfect credibility, there is nonetheless evidence of robust comovement that suggests that the Fed indeed has the ability to influence the expectations of private forecasters to a significant degree. Our prior for
 $\tau $
recognizes that.
However, it is also important to examine our results under a different light, that is, if we were to adopt a more agnostic view about the prior distribution of
 $\tau $
. In Tables 8 and 9, we examine the results when the prior distribution for
 $\tau $
changes to an uninformative uniform distribution on the unit interval. The results show that the estimate for
 $\tau $
in this case is
 $0.60$
, which is somewhat smaller than our benchmark of
 $0.77$
.
Footnote 38
Therefore, if one is agnostic about the true value of
 $\tau $
and adopts a U(0,1) prior distribution, similar to the benchmark results in Subsection 4.1, the estimated value of
 $\tau $
is still below the fully credible case (i.e.
 $\tau =1$
). Moreover, there continues to exist effects of forward guidance on the US economy as the public still believes the US central bank to be credible, albeit both the credibility and the magnitude of those effects would be weakened.
Footnote 39
Furthermore, the posterior distributions seem to be similar in shape regardless of the diffuseness of the prior density even when adopt a less informative (more disperse) beta prior instead of the uniform distribution. The right panel of Figure 6 displays the posterior (solid line) and prior (dashed line) distributions with a
 $B(0.80, 0.1)$
density assumed a priori. The left panel displays the baseline that we use in our estimation, that is,
 $B(0.80, 0.01)$
for
 $\tau$
. While the mean estimates differ somewhat, the posterior distributions between the more informative and more diffuse priors do not appear to overwhelm the posterior distribution on
 $\tau$
. A plot similar to the one for the diffuse prior beta arises also under the uninformative uniform prior.
Posterior and prior distributions under alternative priors on
 $\tau$
. Left Panel:
 $B(0.80,0.01)$
Prior, Right Panel:
 $B(0.80, 0.1)$
Prior. Solid Line: Posterior Distribution, Dashed Line: Prior Distribution.

While there is a concern that the parameter
 $\tau $
might be weakly identified, we believe there are valid reasons to defend our benchmark prior—reasons to which we have appealed again at the beginning of this subsection—suggesting the prior should put more mass on higher values of
 $\tau $
. In any event, we interpret the results discussed here as suggesting that the power of forward guidance is overstated under perfect credibility and, if anything, that our baseline estimate of the effects of forward guidance should be viewed as rather conservative given that we favor a prior that places more mass on higher values of the credibility parameter. Our conservative benchmark estimate of
 $\tau $
already suggests that the power of forward guidance can be significantly dampened under imperfect credibility as seen in Table 5. From our perspective, then, the main takeaway from this is not so much whether the benchmark estimate of
 $\tau $
is overstated or not. The main takeaway is that even though we favor the more conservative estimate with somewhat higher estimated credibility which is what we report as our benchmark, we still find that the higher degree of credibility that we recover from the data (i.e.
 $0.77$
) is not high enough to produce an impact on economic activity within range of what we would estimate under full credibility.
5.3 Alternative mapping of SPF forecasts
Section 3 described the data and observables that we included for the estimation of our model. In our benchmark analysis, we utilized the SPF nowcast for our model’s one-quarter ahead expectations and so on. As explained in Subsection 3.2.1, we believe this assumption made sense given the actual submission dates and timing of SPF forecasts. However, we recognize that questions can emerge regarding this mapping. Specifically, what if SPF one-quarter ahead forecasts were used to correspond with our model’s one-quarter ahead expectations instead of the nowcasts?
This section performs a robustness check to analyze the results when such possibility is taken into account. The model’s observation equations are modified as follows:
 \begin{equation}\left[\begin{array}{c}g_{t}^{obs} \\[3pt]\pi _{t}^{obs} \\[3pt]i_{t}^{obs} \\[3pt]\mathbb{E}_{t}^{obs}\left( g_{t+1}\right) \\[3pt]\mathbb{E}_{t}^{obs}\left( g_{t+2}\right) \\[3pt]\mathbb{E}_{t}^{obs}\left( \pi _{t+1}\right) \\[3pt]\mathbb{E}_{t}^{obs}\left( i_{t+1}\right) \\[3pt]\mathbb{E}_{t}^{obs}\left( i_{t+2}\right) \\[3pt]\mathbb{E}_{t}^{obs}\left( i_{t+3}\right) \\[3pt]\mathbb{E}_{t}^{obs}\left( i_{t+4}\right)\end{array}\right] =\left[\begin{array}{c}\Delta y_{t} \\[3pt]\pi _{t} \\[3pt]i_{t} \\[3pt]\mathbb{E}_{t}\left( \Delta y_{t+1}\right) \\[3pt]\mathbb{E}_{t}\left( \Delta y_{t+2}\right) \\[3pt]\mathbb{E}_{t}\left( \pi _{t+1}\right) \\[3pt]\mathbb{E}_{t}\left( i_{t+1}\right) \\[3pt]\mathbb{E}_{t}\left( i_{t+2}\right) \\[3pt]\mathbb{E}_{t}\left( i_{t+3}\right) \\[3pt]\mathbb{E}_{t}\left( i_{t+4}\right)\end{array}\right] +\left[\begin{array}{c}\bar{\gamma}^{g}+\gamma _{t} \\[3pt]\bar{\gamma}^{\pi } \\[3pt]\bar{\gamma}^{r} \\[3pt]\bar{\gamma}^{g^{1}}+\mathbb{E}_{t}\left( \gamma _{t+1}\right) \\[3pt]\bar{\gamma}^{g^{2}}+\mathbb{E}_{t}\left( \gamma _{t+2}\right) \\[3pt]\bar{\gamma}^{\pi } \\[3pt]\bar{\gamma}^{r^{1}} \\[3pt]\bar{\gamma}^{r^{2}} \\[3pt]\bar{\gamma}^{r^{3}} \\[3pt]\bar{\gamma}^{r^{4}}\end{array}\right] +\left[\begin{array}{c}\mathbf{0}_{3\times 7} \\[3pt]\mathbf{I}_{7\times 7}\end{array}\right] \left[\begin{array}{c}o_{t}^{g_{t+1}} \\[3pt]o_{t}^{g_{t+2}} \\[3pt]o_{t}^{\pi _{t+1}} \\[3pt]o_{t}^{i_{t+1}} \\[3pt]o_{t}^{i_{t+2}} \\[3pt]o_{t}^{i_{t+3}} \\[3pt]o_{t}^{i_{t+4}}\end{array}\right] . \end{equation}
Two differences are apparent between the observation equations in this section (i.e. equation (34) and the baseline observation equations (i.e. equation (27). First, the
 $t+1$
timing in our model now corresponds to one-period ahead expectations in the SPF dataset. Second
 $\mathbb{E}_{t}^{obs}\left(i_{t+5}\right) $
is not in equation (34). Since this exercise utilizes one-quarter ahead SPF expectations (and not the nowcast) for
 $t+1$
expectations in our model, we only have data up to four-quarters ahead from the SPF under this alternative mapping of survey-based forecasts and model-based expectations. Tables 8 and 9 display the estimated values of the structural and measurement error parameters for this exercise.
The main takeaway is that the benchmark results are robust to the timing assumption matching SPF forecasts to our model’s expectations. The estimated value of our parameter of interest,
 $\tau$
, is
 $0.78$
, which does not notably change relative to the benchmark value reported in Section 4. In addition, the estimates of the other parameters do not considerably change either. However, the value of the marginal likelihood is lower at
 $631.36$
compared to
 $901.18$
from the baseline case. Since the marginal likelihood depends on the data, the discrepancy could be due to this implementation using one less observable than that of Section 4 as described in the previous paragraph.
6. Conclusion
The aftermath of the
 $2007-2009$
global financial crisis caused central banks around the world to more explicitly utilize monetary policy forward guidance as a policy tool. However, as we show in this paper, its effectiveness rests on the credibility of the central bank. We jointly model forward guidance (news) shocks, heterogeneous expectations, and central bank credibility, exploiting interest rate expectations and other macro forecasts from the SPF dataset and Bayesian techniques to estimate the credibility of the Federal Reserve’s forward guidance over the
 $1981\,:\,Q3-2018\,:\,Q4$
period.
The results show a number of important takeaways. First, the estimate of central bank credibility in terms of forward guidance announcements is high for the Federal Reserve indicating a degree of effectiveness of forward guidance on the US economy (particularly for output and much less so for inflation). However, the estimated value is still below the fully credible case. Consequently, when the central bank is perceived to be less than perfectly credible, forward guidance on the economy does less on impact and less overall. Output and inflation do not respond as favorably to forward guidance relative to the fully credible case. Hence, we show that imperfect credibility is an important modeling feature that contributes—at least to some extent—to weaken the strength of the anticipation effects of forward guidance in the workhorse New Keynesian model.
Second, we provide evidence that our model’s expectations framework reflects central bank credibility and aligns well with the SPF data. In particular, our model of imperfect central bank credibility is consistent with the evidence that forecasting errors for the policy path are predictable on the basis of forecasting disagreements among individual forecasters in the SPF. Furthermore, the results on the efficacy of forward guidance on the US economy do not noticeably change when examining the following robustness scenarios: different sample periods, different assumptions on macro persistence, different forecasting models for private sector agents, different priors on the credibility parameter
 $\tau$
. Overall, we conclude that accounting for imperfect credibility is important to model the formation of expectations in the economy and the transmission mechanism of forward guidance announcements.
Acknowldgements
This document has greatly benefited from valuable feedback provided by Nathan S. Balke, Florin Bilbiie, Carol Binder, Claudio Borio, Andrea Civelli, Andrew Filardo, Marc P. Giannoni, Robert S. Kaplan, Evan Koenig, Mara Teresa Martínez-García, Karel Mertens, and the many participants at the
 $89^{th}$
Annual Meetings of the Southern Economic Association. We acknowledge the excellent research assistance provided by Jarod Coulter and Valerie Grossman. The data and codes to replicate the results of the paper can be found here: https://bit.ly/34zxmvQ. All remaining errors are ours alone. The views expressed here do not necessarily reflect those of the Federal Reserve Bank of Dallas or the Federal Reserve System.
Appendix
A. An Evolutionary Game of Central Bank Credibility
The private sector chooses between two different pure-strategies that affect how they form their expectations about the future—either they believe the central bank will honor its forward guidance commitments (C) or they disregard the promises that come from announcements about the future path of monetary policy and make forecasts solely on the basis of observable data (D). Similarly, the central bank concerns itself with two pure strategies—either to honor its commitments and deliver on the announced policy path (C) or to renege from the existing commitments (D).
Conventionally, the literature on forward guidance has assumed the strategy pair (C,C) holds accepting that such an outcome could be sustained in equilibrium. Indeed, there are conditions on the payoffs of each player that would support such an outcome as an evolutionarily stable strategy (ESS). However, without a payoff-based disciplining mechanism to sustain the strategy pair (C,C) in equilibrium, we must consider the broad range of plausible strategic implications of the non-cooperative (evolutionary) game that can arise between the central bank and the private sector. Footnote 40
The general form of the central bank credibility game. We proceed by first describing the credibility game between the central bank and private agents in general terms. The (evolutionary) game between the central bank and private agents consists of:
1. Two players referred as the central bank (cb) and the private sector (pa), i.e.,
 $M=\left\{ cb,pa\right\} $
.
2. A strategy set
 $S_{i}$
for each player
 $i\in M$
with two pure strategies which are to comply (C) or to deviate (D), that is,
 $S_{i}=\left\{ C,D\right\} $
for each
 $i\in M$
.
3. A linear payoff function
 $u_{i}\,:\,S_{i}\rightarrow \mathbb{R}$
, assigned to each player
 $i\in M$
, which can be written in matrix form as
 $u_{i}\left( s_{i}\right) =Z_{i}s_{i}\in \mathbb{R}$
for any payoff matrix
 $Z_{i}$
and strategy
 $s_{i}\in S_{i}$
, for each player
 $i\in M$
.
We define the strategy space of the game as
 $S=\Pi _{i\in M}S_{i}$
where each strategy pair is pin down as
 $s=\left( s_{pa},s_{cb}\right) \in S$
. Denoting
 $s_{i}\in S_{i}$
the strategy of player
 $i\in M\ $
and the strategy of the other player as
 $s_{-i}\,:\!=\,\left( s_{j}\right) \in S_{-i}=\Pi _{j\in M,j\neq i}S_{j}$
where
 $j\neq i$
and
 $i,j\in M$
, it follows that the strategy pair can be rewritten as
 $s\,:\!=\,\left( s_{i},s_{-i}\right) \in S_{i}\times S_{-i}=S=\Pi _{i\in M}S_{i}$
for all
 $i\in M$
. From here, we define a best response for a given player in the following general terms:
Definition 1 A strategy
 $\widehat{s}_{i}\in S_{i}$
is called a best response to strategy
 $s_{-i}\in S_{-i}$
if and only if
 $u_{i}\left( \widehat{s}_{i},s_{-i}\right) \geq u_{i}\left( s_{i},s_{-i}\right) $
,
 $\forall i\in M$
,
 $\forall s_{i}\in S_{i}$
.
If every player chooses its best response, then no other strategy can increase the player’s payoff. Hence, all players following their best response strategies constitutes a Nash equilibrium defined as follows:
Definition 2 A pair of strategies
 $s^{\ast }\in S$
is called a Nash equilibrium if and only if
 $u_{i}\left( s^{\ast }\right) =u_{i}\left( s_{i}^{\ast },s_{-i}^{\ast}\right) \geq u_{i}\left( s_{i},s_{-i}^{\ast }\right) $
,
 $\forall i\in M$
,
 $\forall s_{i}\in S_{i}$
.
A Nash equilibrium is a strategy pair in the game that is a best response for both players simultaneously so no player can benefit from switching to play another alternative strategy. In other words, if player
 $i\in M$
were to choose the alternative strategy
 $s_{i}\neq s_{i}^{\ast }$
where
 $s_{i}\in S_{i}$
instead of the strategy
 $s_{i}^{\ast }$
receiving a payoff
 $u_{i}\left( s_{i},s_{-i}^{\ast }\right) \leq u_{i}\left( s_{i}^{\ast},s_{-i}^{\ast }\right) $
, that is,
 $s_{i}^{\ast }$
does just as good or better than with any other alternative strategy. However, a Nash equilibrium allows for the possibility that some alternative strategy may achieve the same payoff, that is, there may be some
 $s_{i}\in S_{i}$
for which
 $u_{i}\left(s_{i},s_{-i}^{\ast }\right) =u_{i}\left( s_{i}^{\ast },s_{-i}^{\ast }\right)$
. In turn, an evolutionary stable strategy (ESS) is a strategy that supports a stable solution that has the stronger property that, if the strategy is followed, no player who adopts a novel strategy can hope to successfully displace the ESS strategy. More precisely, an ESS strategy can be defined in the following terms:
Definition 3 A strategy
 $s_{i}^{ESS}\in S_{i}$
for each
 $i\in M$
is an evolutionary stable strategy (ESS) if: either (a)
 $u_{i}\left(s_{i}^{ESS},s_{-i}^{ESS}\right) >u_{i}\left( s_{i},s_{-i}^{ESS}\right) $
,
 $\forall s_{i}\in S_{i}$
and
 $s_{i}\neq s_{i}^{ESS}$
; or (b)
 $u_{i}\left(s_{i}^{ESS},s_{-i}^{ESS}\right) =u_{i}\left( s_{i},s_{-i}^{ESS}\right) $
and
 $u_{i}\left( s_{i}^{ESS},s_{-i}\right) >u_{i}\left( s_{i},s_{-i}\right) $
,
 $\forall \left( s_{i},s_{-i}\right) \in S$
and
 $s_{i}\neq s_{i}^{ESS}$
and
 $s_{-i}\neq s_{-i}^{ESS}$
.
The ESS concept is an equilibrium refinement to the Nash equilibrium. What this means is that a strategy pair
 $\left( s_{i}^{ESS},s_{-i}^{ESS}\right) $
describes an ESS strategy for each player if: (a) the ESS strategy does strictly better than any alternative would do while playing against ESS; or (b) some alternative strategy does as well as ESS playing against ESS but ESS still does strictly better playing against the alternative strategy than it would do playing the alternative strategy against itself.
The linear payoff function
 $u_{i}\,:\,\left\{ C,D\right\} \times \left\{C,D\right\} \rightarrow \mathbb{R}$
for both players (the central bank and the private sector) and the two strategies (Comply or Deviate) can be described in normal form with the following payoff matrix:
 To comply (C) means to commit to honor the policy announcements on the part of the central bank and to accept the credibility of such commitments on the part of the private agents, while to deviate (D) means to renege on the policy announcements and to rely on a forecasting model not influenced by those policy announcements (e.g. equation (25) to negate any credibility to such announcements, respectively.
We assume that the payoff for the private sector and the central bank is tied to the social welfare achieved. R refers to the reward or social welfare that both players achieve jointly by each choosing C. If the two players deviate, then each receives P which is the punishment payoff (the sub-optimal social welfare) that they achieve jointly by each choosing D. In our context, the social welfare that can be achieved when both players deviate is assumed to be lower than if both comply, that is,
 $P_{i}<R_{i}$
,
 $\forall i\in M$
.
When one player complies and the other deviates, T is the temptation payoff that the player that deviates (D) receives while L is the loser payoff received by the player that complies (C). In our context, the player that deviates (or cheats) benefits at the expense of the player that complies, that is, the social welfare perceived by the player that is cheated against is lower than that of the cheater such that
 $L_{i}<T_{i}$
,
 $\forall i\in M$
.
For expositional tractability, we assume that the temptation and loser payoffs are symmetric for both players, that is,
 $L_{i}=L$
and
 $T_{i}=T$
,
 $\forall i\in M$
. Similarly, the reward and punishment values are also symmetric for both players, that is,
 $R_{i}=R$
and
 $P_{i}=P$
,
 $\forall i\in M$
. Given the symmetric payoff matrix that we describe here, the linear payoff function can be written in matrix form as
 $u_{i}\left( s_{i}\right)=Z_{i}s_{i}\in \mathbb{R}$
for any strategy
 $s_{i}\in S_{i}$
and for each player
 $i\in M$
with
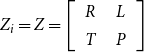 $Z_{i}=Z=\left[\begin{array}{ll}R & L \\T & P\end{array}\right]$
.
Now, depending on the ordering of R, T, L, and P, we can have significantly different games with different equilibrium outcomes. A well-known game, the Prisoner’s Dilemma, requires the ordering to be
 $T>R>P>L $
. We consider however two other orderings that stand out as most relevant for the interaction between the central bank and the private sector: the Game of Chicken which requires
 $T>R>L>P$
and the Trust Dilemma that requires instead that
 $R>T>L>P$
.
Replicator dynamics. Let us consider
 $p_{j}\left( t\right) $
the frequency with which pure strategy
 $j=\left\{ C,D\right\} $
is played and
 $p\left( t\right) =\left(p_{C}\left( t\right) ,p_{D}\left( t\right) \right) ^{T}$
the corresponding state vector, where t denotes the t-th replication of the same game. We postulate a law of motion for
 $p\left( t\right) $
that describes how the dynamics of the game evolve as players consider future generations (or replications) of the game at play. If players engage in a symmetric game with the payoff matrix Z, then
 $\left( Zp\left( t\right) \right) _{j}$
is the expected payoff for strategy
 $j=\left\{ C,D\right\} $
and
 $\left(p\left( t\right) ^{T}Zp\left( t\right) \right) $
is the average payoff. Thus, the relative performance of the frequency vector
 $p_{j}\left( t\right)$
for each strategy
 $j=\left\{ C,D\right\} $
is given by
 $\frac{\left(Zp\left( t\right) \right) _{j}}{p\left( t\right) ^{T}Zp\left( t\right) }$
if
 $p\left( t\right) ^{T}Zp\left( t\right) \neq 0$
.
We assume that the frequency
 $p_{j}\left( t\right) $
for each strategy
 $j=\left\{ C,D\right\} $
is iteratively updated proportionally to its relative performance, that is,
 \begin{equation}\frac{p_{j}\left( t+\Delta t\right) }{p_{j}\left( t\right) }=\frac{\left(Zp\left( t\right) \right) _{j}}{p\left( t\right) ^{T}Zp\left( t\right) }\Delta t,\end{equation}
for
 $\Delta t>0$
and for all
 $j=\left\{ C,D\right\} $
. Hence,
 $p_{j}\left(t+\Delta t\right) -p_{j}\left( t\right) =p_{j}\left( t\right) \frac{\left(Zp\left( t\right) \right) _{j}-p\left( t\right) ^{T}Zp\left( t\right) }{p\left( t\right) ^{T}Zp\left( t\right) }\Delta t$
. This, in turn, yields the following differential equation as
 $\Delta t\rightarrow 0$
:
 \begin{equation}\overset{\cdot }{p}_{j}=p_{j}\frac{\left( Zp\right) _{j}-p^{T}Zp}{p^{T}Zp},\end{equation}
for all
 $j=\left\{ C,D\right\} $
with
 $\overset{\cdot }{p}_{j}$
denoting the derivative of
 $p_{j}\left( t\right) $
with respect to t.
A solution
 $q_{j}\left( t\right) $
to the simplified differential equation:
 \begin{equation}\overset{\cdot }{q}_{j}=q_{j}\left[ \left( Zq\right) _{j}-q^{T}Zq\right] ,\end{equation}
suffices to describe the replicator dynamics of the game as (36) has the same trajectories as (37). That is because, according to the transformation of t given by
 $t\left(s\right) =\int_{s_{0}}^{s}p\left( t\right) ^{T}Zp\left( t\right) $
with
 $s_{0}$
being the initial iteration, every solution
 $p_{j}\left( t\right) $
of (36) delivers a solution
 $q_{j}\left( s\right)\,:\!=\,p_{j}\left( t\left( s\right) \right) $
of the simplified differential equation (37).
Evolutionary stable strategies. Let us denote the frequency of strategy D with the parameter q and the frequency of strategy C as
 $1-q$
with
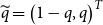 $\widetilde{q}=\left( 1-q,q\right)^{T}$
. The replicator equation in (37) has two terms that depend on the payoff matrix Z. The first term depends on
 $Z\widetilde{q}$
which gives us that
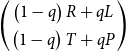 $\left(\begin{array}{c}\left( 1-q\right) R+qL \\\left( 1-q\right) T+qP\end{array}\right) $
. Since strategy D is ordered after C in the layout of the normal form of the game, we use the second component of
 $Z\widetilde{q}$
to describe
 $\left( Z\widetilde{q}\right) _{j}$
when
 $j=D$
. The second term
 $\widetilde{q}^{T}Z\widetilde{q}$
can be expressed as
 $\left( 1-q\right)^{2}R+\left( 1-q\right) q\left( L+T\right) +q^{2}P$
. Thus, the replicator equation in (37) for strategy D is given by:
 \begin{equation}\overset{\cdot }{q}=q\left[ \left( 1-q\right) T+qP-\left( 1-q\right)^{2}R-\left( 1-q\right) q\left( L+T\right) -q^{2}P\right] .\end{equation}
By setting
 $\overset{\cdot }{q}=0$
, that is, by solving the equation:
 \begin{equation}q\left[ T-R-\left( L-P+2\left( T-R\right) \right) q+\left( L-P+T-R\right)q^{2}\right] =0,\end{equation}
we obtain the evolutionary states of the model. This holds trivially true for
 $q^{ES}=0$
and for
 $q^{ES}=1$
. The mixed strategy solution can be pin down by factoring the roots from the quadratic function
 $q^{2}-\left( \frac{L-P+2\left( T-R\right) }{L-P+T-R}\right) q+\left( \frac{T-R}{L-P+T-R}\right)=0$
where we already know that one of the roots is
 $q^{ES}=1$
. From that, we obtain that the mixed strategy state of the model is
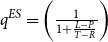 $q^{ES}=\left(\frac{1}{1+\frac{L-P}{T-R}}\right) $
.
To sum up:
Lemma 1 The central bank credibility game has generically three states. Two states are in pure strategies where
 $q^{ES}=0$
implies playing C and
 $q^{ES}=1$
implies playing D. The mixed strategy state, if one exists, involves playing strategy D with a frequency of
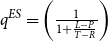 $q^{ES}=\left( \frac{1}{1+\frac{L-P}{T-R}}\right) $
and strategy C with a frequency of
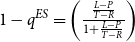 $1-q^{ES}=\left( \frac{\frac{L-P}{T-R}}{1+\frac{L-P}{T-R}}\right) $
.
The mixed strategy state is well-defined and satisfies
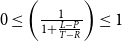 $0\leq \left( \frac{1}{1+\frac{L-P}{T-R}}\right) \leq 1$
whenever
 $\left( L-P\right) +\left(T-R\right) \geq 0$
and
 $\frac{L-P}{T-R}\geq 0$
. The Prisoner’s Dilemma, as indicated before, requires the ordering to be
 $T>R>P>L$
. Therefore,
 $T-R>0$
and
 $L-P<0$
violates the condition that
 $\frac{L-P}{T-R}\geq 0$
and for this case there are only two states, those based on pure strategies. Similarly, the Trust Dilemma which imposes instead that
 $R>T>L>P$
implies that
 $L-P>0$
and
 $T-R<0$
. Therefore, for the Trust Dilemma, it also follows that there are only two states in pure strategies. In turn, the Game of Chicken which requires
 $T>R>L>P$
implies that
 $L-P>0$
and
 $T-R>0$
and satisfies the conditions that insure a well-defined mixed strategy state exists.
Definition 4 A strategy pair
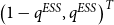 $\left( 1-q^{ESS},q^{ESS}\right) ^{T}$
is said to be an evolutionary stable strategy (ESS) if it is a locally convergent evolutionary state which is dynamically restored after a disturbance via the replicator equation in (37), provided the disturbance is not too large. That is,
 $q^{ES}=0$
is an ESS if
 $\overset{\cdot }{q}<0$
for
 $q^{0}\left( >0\right) \rightarrow 0$
from the right and
 $q^{ES}=1$
is an ESS if
 $\overset{\cdot }{q}>0$
for
 $q^{0}\left( <1\right) \rightarrow 1$
from the left. In turn,
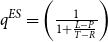 $q^{ES}=\left( \frac{1}{1+\frac{L-P}{T-R}}\right) $
is an ESS if
 $\overset{\cdot }{q}<0$
for
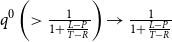 $q^{0}\left( >\frac{1}{1+\frac{L-P}{T-R}}\right) \rightarrow \frac{1}{1+\frac{L-P}{T-R}}$
from the right and
 $\overset{\cdot }{q}>0$
for
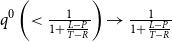 $q^{0}\left( <\frac{1}{1+\frac{L-P}{T-R}}\right)\rightarrow \frac{1}{1+\frac{L-P}{T-R}}$
from the left.
When we explore the dynamics implied by the replicator equation in (37), it follows that given the orderings of the payoffs R, T, L, and P:
Proposition 1 The Prisoner’s Dilemma game has one ESS only, that is the state
 $q^{ESS}=q^{ES}=1$
(which implies the players follow the pure strategy D). Similarly, the Trust Dilemma has one ESS only that corresponds to the other pure strategy
 $q^{ESS}=q^{ES}=0$
(the players follow the pure strategy C). In turn, the only ESS of the Game of Chicken between the central bank and the private sector is the mixed strategy implied by
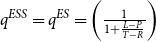 $q^{ESS}=q^{ES}=\left( \frac{1}{1+\frac{L-P}{T-R}}\right) $
.
When we estimate our model with central bank credibility and forward guidance in Section 4, the data favor a mixed strategy equilibrium. Thus, Proposition 1 suggests that the Game of Chicken is better suited than the Prisoner’s Dilemma or the Trust Dilemma to describe the central bank credibility game. In other words, the Game of Chicken where a mixed strategy equilibrium exists and is evolutionarily stable can support the type of imperfect central bank credibility that we detect in the US data.
We leave for future research the tasks of relaxing the symmetry of the payoff matrix used here for exposition and of incorporating those payoffs and dynamic learning via the replicator dynamics in our model estimation. Doing that would help us endogenize the equilibrium credibility parameter and even introduce a novel form of dynamic learning in our framework.