Introduction
Pale, soft and exudative (PSE) meat characterizes meat which has a pale color, a soft texture and a poor water-holding capacity. In swine, an inherited impaired gene that causes animal sensitize to stress (porcine stress syndrome, PSS) is involved in PSE meat (Fujii et al., Reference Fujii, Otsu, Zorzato, de Leon, Khanna, Weiler, O’Brien and Mac Lennan1991; Mullen et al., Reference Mullen, Stapleton, Corcoran, Hamill and White2006). Since PSE was considered as a key problem in the industry, many researches have been conducted in pork (for review see, Rosenvold and Andersen, Reference Rosenvold and Andersen2003). More recently, it has also been mentioned in turkey and chicken (Barbut et al., Reference Barbut, Zhang and Marcone2005). In North America, over 5% to 30% of turkey breast muscles are detected as PSE-like meat (Barbut, Reference Barbut1993) and its incidence seems to increase (Chiang et al., Reference Chiang, Allison, Linz and Strasburg2004). However, in most of the studies carried out on poultry, PSE-like meats often showed lower ultimate pH than normal meat (Barbut, Reference Barbut1993; McKee and Sams, Reference McKee and Sams1997). Even if the alterations of PSE turkey meat are very similar to those observed in pork, the environmental and/or genetic origin has not yet been proven in poultry (Chiang et al., Reference Chiang, Allison, Linz and Strasburg2004).
In the literature, PSE meat quality alterations are described to be mainly caused by the rapid rate of glycolysis in the early post mortem period, leading to the combination of a high temperature and a low pH value in muscles during the beginning of the rigor mortis onset (Choi et al., Reference Choi, Ryu and Kim2007). Such conditions are known to reduce protein functionality. Indeed, reduced sarcoplamic and myofibrillar protein solubilities in PSE meat have already been reported in both pork and turkey (pork: Boles et al., Reference Boles, Parrish, Huiatt and Robson1992; turkey: Rathgeber et al., Reference Rathgeber, Boles and Shand1999a; Molette et al., 2005).
Moreover, several studies focused on glycolytic enzymes to better understand why some pig muscles are more susceptible to an increased rate of post mortem pH (for review, see Bowker et al., Reference Bowker, Grant, Forrest and Gerrard2000). In turkey, knowledge of glycolytic enzymes alteration in PSE-like meat is still lacking. Molette et al. (Reference Molette, Rémignon and Babilé2005) recently found differences in SDS-PAGE patterns of glyceraldehyde-3-phosphate dehydrogenase (GAPDH) and aldolase A between fast glycolyzing and normal glycolyzing turkey breast muscles at 24 h post mortem. However, the authors could not conclude in the implication of these two enzymes in the increased rate of post mortem pH fall. The aim of the present study is to study the kinetic parameters of GAPDH and aldolase A in samples collected early post mortem from turkey breast muscles with different rates of glycolysis to finally determine whether these two glycolytic enzymes could really be used as markers to identify PSE-like turkey.
Material and methods
Animals
A flock of tom turkeys (Meleagris gallopovo), from a commercial grower (line B.U.T.9; BUT Ltd, Chester, UK), was bred until 19 weeks of age (average live weight = 15 kg). All the birds were fasten 24 h before slaughtering and then conventionally processed (Gastronome SA, Moncoutant, France). For each turkey, at the end of the slaughtering process, the pH value of breast muscle (Pectoralis major, Pm) was measured (pH20 min) following the method of Jeacocke (Reference Jeacocke1977). Two grams of breast muscle was homogenized in 18 ml of 5 mM Iodoacetate using Ultra Turrax (IKA-WERKE, Staufen, Germany). The pH20 min was then measured by using a portable pH-meter combined with a glass electrode. Twenty grams of muscle was also collected at 20 min post mortem and immediately frozen in liquid nitrogen.
From this flock, two groups of animals were selected according to their pH20 min values: the first one (normal glycolysis, NG, n = 20) was made up with animals with a ‘normal’ pH20 min value (6.21 ± 0.01) and the second one (rapid glycolysis, RG, n = 20) of birds with a low pH20 min (5.80 ± 0.07). The inside temperature of the muscle was also measured at 20 min post mortem. Following a 4°C overnight storage, the ultimate pH-value (pHu) was directly measured by inserting a glass pH-probe into the Pm muscle. Samples were then collected as described above and kept at −80°C until analyzed.
Assays of aldolase A activity and its kinetic parameters
One hundred milligrams of samples collected at 20 min post mortem were homogenized with 20 ml of 100 mM phosphate buffer using Ultra Turrax. The homogenized sample was then sonicated for 2 × 1 min. The enzyme extract was obtained from centrifugation at 7500 × g, 4°C for 10 min.
Aldolase A activity was spectrophotometrically measured following the method of Koeck et al. (Reference Koeck, Levison, Hazen, Crabb, STuehr and Aulak2004) by using 12 M d-fructose-1,6-bisphosphate (Biochemika, Duisburg, Germany) as a substrate and 3.5 M hydrazine sulfate/1 mM EDTA, pH 7.5 as a detector of glyceraldehyde-3-phosphate formation. The reaction mixture contained 2 ml substrate, 1 ml detector and 0.1 ml of five times diluted enzyme extract. The activity was assayed over 15 min by a spectrophotometer (Lambda 20; Perkin-Elmer, Connecticut, USA) at 240 nm, 25°C. One unit is expressed as a change in absorbance of 1.00 per minute (unit/mg = (ΔA 240 sample−ΔA 240 blank)/mg enzyme per ml reaction mixture). Maximum speed (V m) and affinity to substrate (K m) of aldolase A were determined by performing activity assays with various substrate, concentrations ranging from 3 mM up to 60 mM. According to Michaelis–Menten kinetics, plots of Lineweaver–Burk were made. V m and K m values were then calculated (Koeck et al., Reference Koeck, Levison, Hazen, Crabb, STuehr and Aulak2004).
Assays of GAPDH activity and its kinetic parameters
The preparation of enzyme extract for GAPDH activity was performed as described above except that 125 mM of triethanolamine (TEA) was used as a buffer. This extract containing the enzyme was also used for western blot assays.
GAPDH activity was measured following the method described by Crow and Wittenberger (Reference Crow and Wittenberger1979). The reaction mixture contained 125 mM TEA buffer, 1 mM sodium arsenate, 5 mM Cysteine-HCl, 1 mM NAD+ and 4 mM glyceraldehyde-3-phosphate (Sigma, Seelze, Germany). The activity was assayed over 5 min at 340 nm, 30°C. Activity assays with different substrate’s concentrations from 1 mM up to 20 mM were then performed to determine V m and K m values as previously described.
Protein extractability
Muscular proteins of P m samples collected at 20 min and 24 h post mortem were extracted following Rathgeber and Boles’ methods (Boles et al., Reference Boles, Parrish, Huiatt and Robson1992; Rathgeber et al., Reference Rathgeber, Boles and Shand1999a). One gram of sample was homogenized in 20 ml of a low ionic strength (LIS) buffer, containing 0.05 M potassium phosphate buffer, 1 mM NaN3 and 2 mM EDTA/pH 7.3 at 2°C for 10 s. The homogenized sample was then agitated for 30 min at 4°C and centrifuged at 17 500 × g, 2°C for 15 min. Ten milliliters of the supernatant (LIS fraction) was collected at 2 cm above the bottom of the tube while the remaining supernatant was discarded. A supplemental 20 ml LIS buffer was added to resuspend the pellet, which was then homogenized, agitated and centrifuged as previously described. The supernatant was discarded and the procedure was repeated with high ionic strength (HIS) buffer, containing 0.55 M KCl, 0.05 M potassium phosphate buffer, 1 mM NaN3 and 2 mM EDTA/pH 7.3, at 2°C. Following centrifugation, 10 ml of supernatant (HIS fraction) was collected as described above. The excess supernatant was removed. The pellet was resuspended in 40 ml of potassium phosphate buffer containing 75 mM KCl, 10 mM KH2PO4, 2 mM MgCl2 and 2 mM EGTA/pH 7 and sonicated (Sonificateur®; Bioblock Scientific, Illkirch, France) for 1 min to solubilize the fraction (pellet fraction). Protein content in LIS, HIS and pellet fractions were determined by the BCA™ protein assay kit (PIERCE, Rockford, IL, USA). Results are expressed as a percentage of the total protein.
Sodium dodecyl sulfate-polyacrylamide gel electrophoresis (SDS-PAGE)
SDS-PAGE was performed in order to separate proteins in each buffer – extracted fraction from samples collected at 20 min and 24 h post mortem. It was also performed for enzyme extract from samples collected at 20 min post mortem.
Samples containing 2% (w/v) SDS, 5% β-mercaptoethanol, 10% glycerol and 62 mM Tris–HCl, pH 6.8 in a ratio 1 : 1 v/v (Laemmli, Reference Laemmli1970) were heated at 95°C for 5 min. SDS-PAGE was performed following the method described by Laemmli (Reference Laemmli1970) using a Mini-Protean II electrophoresis unit or a Protean Xi Unit (Bio-Rad Laboratories Inc., Hercules, CA, USA). Samples were loaded at 40 μg protein per lane for LIS, HIS and pellet fractions, 1, 5 and 10 μg for western blots of GAPDH, actin and myosin heavy chain (MHC), respectively. Resolving gel of 12% polyacrylamide was used for LIS fraction and GAPDH enzyme extract and 8% polyacrylamide was applied for HIS and pellet fractions and western blots of actin and MHC. Gels were run at 17 mA or 35 mA/gel (for Mini-Protean II and Protean Xi Units, respectively), constant current, until the dye front reached the bottom of the gel. Gels were stained overnight in Coomassie brilliant blue R-250 containing 5% (v/v) glacial acetic acid, and 45% (v/v) ethanol. Gels were then destained twice in the same solution excluding Coomassie blue.
Mass spectrometry
Proteins of interest were excised from Coomassie blue stained gels. Proteins were characterized after trypsin in-gel digestion, by peptide mass fingerprinting using a MALDI-TOF mass spectrometer (Voyager-DE™ STR; Perseptive Biosystems, Framingham, MA, USA), as previously described (Borderies et al., Reference Borderies, Jamet, Lafite, Rossignol, Jauneau, Boudart, Montsarrat, Esquerré-Tugayé, Boudet and Pont-Lezica2003). Peptide mass fingerprints were compared to the database of all species and Gallus gallus from National Center for Biotechnology (NCBI) non-redundant database using MS-FIT (Protein Prospector; http://prospector.ucsf.edu). The searches were done with a tolerance of 20 p.p.m., considered oxidation of methionine and partial cleavage, leaving a maximum of one internal site uncleaved by trypsin. Identification was considered positive when the difference in the MOWSE score between the first and second ranked proteins was more than one order of magnitude.
Western blots of GAPDH, actin and myosin heavy chain
HIS fraction was used to perform western blots of actin and MHC. Enzyme extract was used to perform western blot of GAPDH.
Following performing SDS-PAGE, the gel was steeped into transfer buffer containing 25 mM Tris, 192 mM glycine and 20% v/v methanol (Towbin et al., Reference Towbin, Staehelin and Gordon1979) for 20 min. The proteins were transferred to nitrocellulose membrane (Hybond ECL; Amersham, Munich, Germany) at 30 V overnight using a transfer cell (EBU 4000; CBS scientific, California, USA). Membrane was blocked with milk buffer containing 3% w/v milk powder in phosphate buffer saline (PBS, pH 7.5) at room temperature (RT) for 1 h. Following blocking, the membrane was probed for specific proteins using primary antibody (mouse anti-GAPDH, MAB 374, chemicon, California, USA; mouse anti-actin, MAB 1501, chemicon; mouse anti-myosin, F59, DSHB, Iowa, USA) at RT for 2 h. The primary antibody-to-milk buffer ratio was 1 : 1000 for GAPDH and actin and 1 : 25 for MHC. Then, the membrane was washed three times with PBS and incubated in secondary antibody (goat anti-mouse IgG, AP 127, chemicon, California, USA) at RT for 1.5 h. The secondary antibody to milk buffer ratio was 1 : 50 000 for GAPDH and actin and 1 : 25 000 for MHC. Following this incubation, the membrane was washed three times and the chemiluminescent substrate (Super Signal® West Pico; PIERCE) was then used to detect the reactivity of the primary antibody with its antigen.
The photo of western blot was taken by making a contact between the membrane and a photo film (Amersham Hyperfilm™MP; GE Healthcare, Munich, Germany). The film was then developed by steep in 10% revelation solution (AL4; Kodak, New York, USA), distilled water and 10% fixation solution (LX24; Kodak) for 1 min each, respectively. The amount of 0.5 μg purified GAPDH was used as a reference amount for GAPDH while 2 and 5 μg proteins of chicken breast muscle were used as reference amounts for actin and MHC, respectively. The Band intensity of samples was then measured by using Image Analysis (ImageMaster 2D Platinum 6.0; GE Healthcare, New Jersey, USA). It was expressed as a percentage of reference protein (purified GAPDH, actin and MHC of chicken breast muscle).
Statistical analysis
All analyses were performed in duplicate. Results are expressed as the mean ± standard deviation (s.d.). Linear regression analysis was used to calculate V m and K m values. Only individual effect of group and effect of time were tested. Analyses of variance were performed using the GLM procedure of the Statistical Analysis Systems Institute (1989). Values showing P < 0.05 were considered significant.
Results
Animals and pH values
The pH20 min value of the RG group was lower than that of the NG group. A difference of 0.5 pH unit was found as a result of the criterion used to select the animals. The inside temperature of muscle at 20 min post mortem were 42.1 ± 1.4 and 41.8 ± 0.7°C for RG and NG, respectively (P > 0.05). However, their pHu values were not different (5.80 ± 0.08 and 5.77 ± 0.09 for RG and NG, respectively; P > 0.05).
Specific activities of aldolase A and GAPDH and their kinetic parameters
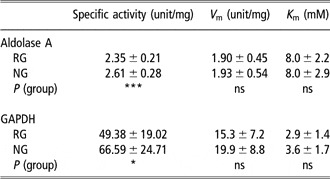
The specific enzymatic activities of aldolase A and GAPDH and their kinetic parameters at 20 min post mortem are shown in Table 1. Both aldolase A- and GAPDH-specific activities of NG muscles were higher than those of RG ones. However, their V m and K m values for both enzymes were not different between the two groups.
Effect of rates of glycolysis on specific activities and V m and K m values of aldolase A and GAPDH in turkey breast muscle collected at 20 min post mortem

Values are given as mean ± s.d., n = 20.
RG = rapid glycolysis; NG = normal glycolysis.
P > 0.05 (ns); *P < 0.05; ***P < 0.001.
Protein extractability
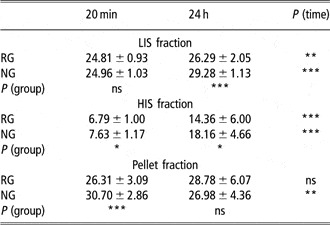
The muscular protein extractabilities of RG and NG samples at 20 min and 24 h post mortem are presented in Table 2. NG muscles had higher protein extractabilities in HIS and pellet fractions than RG ones at 20 min post mortem. NG muscles also had higher protein extractabilities in LIS and HIS fractions at 24 h post mortem.
Effect of rate of glycolysis and post mortem time on the muscular protein extractability in turkey breast muscle samples (expressed in percentage of total protein)

Values are given as mean ± s.d., n = 19 and 18 for RG and NG, respectively.
RG = rapid glycolysis; NG = normal glycolysis; LIS = low ionic strength; HIS = high ionic strength. P > 0.05 (ns); *P < 0.05; **P < 0.01; ***P < 0.001.
At 20 min post mortem, protein extractabilities in LIS and HIS fractions, in both RG and NG muscles, were lower than those at 24 h post mortem. Moreover, the increase in protein extractability is higher for HIS (122% and 270% for RG and NG, respectively) than for LIS (6% and 17% for RG and NG, respectively) fractions. Protein extractability in pellet fraction of the RG group was not different between 20 min and 24 h post mortem. On the contrary, at 20 min post mortem, this fraction in the NG group had higher protein extractability than at 24 h post mortem.
SDS-PAGE and mass spectrometry
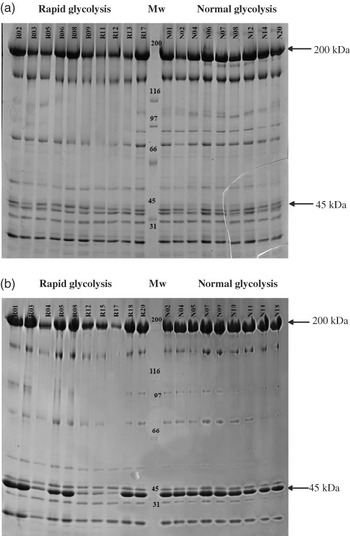
There were no detectable quantitative and qualitative differences in the banding pattern for protein in LIS fraction in relation to the rate of glycolysis and post mortem time (data not shown). Figure 1 shows the banding patterns of HIS fractions from RG and NG samples collected at 20 min and 24 h post mortem. Although the banding pattern at 20 min post mortem was similar between the two groups (Figure 1a), differences in band intensity were reported at 24 h post mortem. These differences were particularly noticeable at 45 and 200 kDa for four animals belonging to the RG group (Figure 1b). The general SDS-PAGE pattern of myofibrillar proteins is well known (Rathgeber et al., Reference Rathgeber, Pato, Boles and Shand1999b) and the main bands (200 and 45 kDa) would likely correspond to MHC and actin. By mass spectrometry analysis, the identity of the proteins within these two bands was confirmed. Moreover, these four animals (group RG2) exhibited similar muscle pH at 20 min post mortem (pH20 min 5.78 ± 0.12 and 5.81 ± 0.69 for RG2 and RG groups, respectively, P > 0.05) and muscular temperature (43.1 ± 2.2°C and 41.7 ± 0.9°C for RG2 and RG, respectively, P > 0.05). However, drip loss was lower in the RG2 group than in the RG group (6.2 ± 1.5% and 3.7 ± 1.1%, respectively, P < 0.05).
Gel electrophoresis patterns of HIS fraction from turkey breast muscles collected at 20 min (a) and 24 h (b) post mortem. Each lane contained 40 μg proteins and 8% polyacrylamide were used to prepare resolving gels. Gels were stained by Coomassie blue R-250. Mw = molecular weight in kDa.

The amount of actin, MHC and GAPDH quantified by western blot
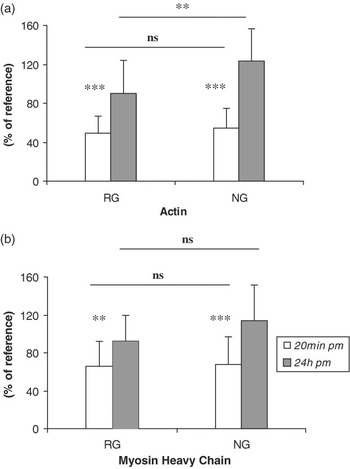
The image of western blotting of actin and MHC from RG and NG samples collected at 20 min and 24 h post mortem is shown in Figure 2. Amounts of actin and MHC increased with regard to post mortem time. At 20 min post mortem, amounts of actin and MHC were not different between the two groups. However, at 24 h post mortem, NG muscles had higher amount of actin than RG ones while no difference in the amount of MHC was reported (Figure 2b). Moreover, the four birds previously mentioned (RG2), exhibited a lower amount of MHC (64.4 ± 24.3% compared to 100.8 ± 21.2% for the other birds from RG group) and actin (54.4 ± 25.6% compared to 98.6 ± 30.4% for the other birds from the RG group).
Relative amounts of actin (a) and myosin heavy chain (b) obtained using western blots from turkey breast muscles collected at 20 min and 24 h post mortem (mean ± s.d., n = 19 and 18 for RG and NG, respectively). Two and 5 μg proteins of chicken breast muscle were used as reference amounts for actin and MHC, respectively. RG = rapid glycolysis; NG = normal glycolysis. P > 0.05 (ns); **P < 0.01; ***P < 0.001.

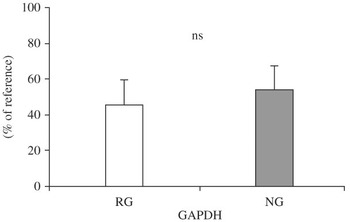
Figure 3 shows the results of the amount of GAPDH quantified by western blot in samples collected at 20 min post mortem. The amount of GAPDH was not different between RG and NG groups.
Relative amount of GAPDH obtained by using western blot from turkey breast muscle1 collected at 20 min post mortem (mean ± s.d., n = 20). RG = rapid glycolysis; NG = normal glycolysis. P > 0.05 (ns).

Discussion
As already shown, breast meat from fast glycolysing turkeys is characterized by a pale color, a low water-holding capacity and cooking yield (Pietrzak et al., Reference Pietrzak, Greaser and Sosnicki1997; Owens et al., Reference Owens, Hirschler, McKee, Martinez-Dawson and Sams2000). In the present study, the average value of pH20 min of the RG group is similar to that of the low pH group studied in Pietrzak et al. (Reference Pietrzak, Greaser and Sosnicki1997). In our study, birds in the RG group also had higher drip loss (4.2 ± 1.5% and 3.2 ± 0.8% for RG and NG, respectively, P < 0.05) and lower brine and cook yield than in NG ones (94.8 ± 4.4% and 98.3 ± 3.5% for RG and NG, respectively, P < 0.001). Hereby, birds in the RG group met all these characteristics, and consequently can be defined as PSE-like meat while NG birds can be considered as normal or reference ones.
It is generally admitted that reduced post mortem pH values is caused by the rapid production and accumulation of lactic acid subsequent to the activation of the glycolysis pathway (Livisay et al., Reference Livisay, Xiong and Moody1996; Lyon and Buhr, Reference Lyon and Buhr1999) with no evacuation from muscle due to the lack of blood circulation. Therefore to better understand why different rates of pH fall down could exist within same muscle, interest was taken into glycolytic enzyme activities. Several researches have been conducted on glycolytic enzymes properties, which could lead to PSE development (for review, see Scheffler and Gerrard, Reference Scheffler and Gerrard2007). Among glycolytic enzymes, which account for about 70% of the sarcoplasmic protein content, GAPDH and aldolase A are found in large quantities (Kijowski, Reference Kijowski2001). Moreover, qualitative differences were recently mentioned between PSE-like and normal turkey meat (Molette et al., Reference Molette, Rémignon and Babilé2005). The specific activities of both aldolase A and GAPDH were higher in RG muscles than in NG ones. The findings were unexpected because RG muscles represented samples with a rapid rate of glycolysis (due to a rapid rate of pH decline), and consequently glycolytic enzyme activities or/and quantities could be supposed to be higher than in NG ones. However, we cannot exclude the fact that these enzymes might be altered by the combination of low pH and high muscle temperature values. Even if measured temperatures at 20 min post mortem were not different between RG and NG groups, the duration of unfavorable muscle conditions could be longer in RG muscles, leading to a higher protein denaturation (Offer, Reference Offer1991). Therefore, such conditions could lead to a loss in protein functionalities and/or enzyme-specific activity. Several studies reported that most glycolytic enzymes bind together with muscle actin and MHC to provide glycolytic multi-enzyme complexes (GMEC). These GMEC have particular kinetic properties and high abilities to interact with other enzymes or the actin structure as well (MacGregor et al., Reference MacGregor, Singh, Davoust, Melloni, Pontremoli and Horecker1980; O’Reilly and Clarke, Reference O’Reilly and Clarke1993; Rakus et al., Reference Rakus, Mamczur, Gizak, Dus and Dzugaj2003; Dziewulska-Szwajkowska et al., Reference Dziewulska-Szwajkowska, Zmojdzian, Dobryszycki, Kochman and Dzugaj2004). Therefore, the different specific activities of aldolase A and GAPDH between RG and NG could be a result of a different complex formation in the muscle.
Kinetic parameters (i.e. K m and V m) were determined and no significant differences were pointed out between the two groups. To our knowledge, it is the first time that these parameters are evaluated in turkey muscle. The Michealis–Menten constant (K m) reflects enzyme affinity for a given substrate and is specific, for a given enzyme, in a tissue and a species but vary within a wide range for different species or tissues (http://www.brenda-enzymes.info). However, within a species or a tissue, different K m values can be found according to the primary sequence of the enzyme (Maurady et al., Reference Maurady, Zdanov, de Moissac, Beaudry and Sygusch2002). In our study, one of the hypothesis was that the increased rate of post mortem pH fall might be explained by a different enzyme structure and consequently, different kinetic parameters. Unfortunately, this possibility was infirm.
Muscular protein characteristics were also studied with regard to their extractabilities at 20 min and 24 h post mortem. RG birds presented lower protein extractabilities than NG ones both at 20 min (in HIS and pellet fractions) and at 24 h post mortem (in LIS and HIS fractions). Reduced protein extractability in RG could be issued from a combination of a low muscle pH and a high carcass temperature values, which changed protein structure, leading to a modification of solubility (Gil et al., Reference Gil, Hortos and Sarraga1998). Nevertheless, Ma and Addis (Reference Ma and Addis1973) could not notice any different extractabilities of sarcoplasmic and myofibrillar fractions in turkey breast muscle with various rates of post mortem glycolysis. On the contrary, Rathgeber et al. (Reference Rathgeber, Boles and Shand1999a) found lower extractabilities of LIS and HIS fractions in PSE turkey muscle at 15 min post mortem. The present results reported at 24 h post mortem were also in agreement with those of Rathgeber et al. (Reference Rathgeber, Boles and Shand1999a). Boles et al. (Reference Boles, Parrish, Huiatt and Robson1992), Warner et al. (Reference Warner, Kauffman and Greaser1997) and Joo et al. (Reference Joo, Kauffman, Kim and Park1999) also found similar results in PSE meat in pork.
In the present study, besides pellet fraction, muscular proteins at 24 h post mortem showed higher extractability than at 20 min post mortem. These higher extractabilities at 24 h post mortem could result from meat aging when endogenous enzymes, particularly proteinases, caused alterations of muscle fibers (Kijowski, Reference Kijowski2001). Indeed, Gil et al. (Reference Gil, Hortos and Sarraga1998) observed a large increase in myofibrillar protein extractability after 14 days of post mortem storage in pork. On the contrary, in pork, Ryu et al. (Reference Ryu, Choi and Kim2005) found a reduction of sarcoplasmic and myofibrillar protein extractabilities during post mortem storage. In the present study, higher extractabilities at 24 h post mortem could be the result of degradations of actin and MHC during the post mortem period (Lametsch et al., Reference Lametsch, Karisson, Rosenvold, Andersen, Roepstorff and Bendixen2003), which consequently showed higher band intensities from SDS-PAGE and higher relative amount from western blot assays.
Because extractability measurements are only representative of the protein content in each fraction, the qualitative pattern of proteins in both RG and NG at 20 min and 24 h post mortem was better distinguished by performing SDS-PAGE. At 20 min post mortem, from SDS-PAGE, no differences in protein patterns were noticeable. On the contrary, at 24 h post mortem, heterogeneity in band intensity in the HIS fraction for RG birds is clearly noticeable. These lower SDS-PAGE band intensities of actin and MHC in RG at 24 h post mortem could imply that, among this group, the response of muscle protein to the increased rate of post mortem pH decline could differ. Our findings were in agreement with those of Rathgeber et al. (Reference Rathgeber, Pato, Boles and Shand1999b) who indicated that among sarcoplasmic and myofibrillar proteins, myosin is the major protein influenced by different rates of glycolysis. Pietrzak et al. (Reference Pietrzak, Greaser and Sosnicki1997) also found less MHC solubility in PSE turkey breast muscle than that in normal muscle. Lovell et al. (Reference Lovell, Knight and Harrington1981) and Offer (Reference Offer1991) suggested that lower extractability is a result of a tighter combination of actin and MHC in PSE pork muscle than in normal one. It could be also applied to turkey breast muscle in this study because results obtained from western blot assays showed that RG muscles had a lower amount of actin at 24 h post mortem.
Conclusion
Results of this study indicate that the rate of glycolysis and post mortem time affect turkey breast muscle, leading to changes in protein extractability. At 20 min post mortem, no particular differences in protein band patterns and amounts of actin and MHC between samples from different rates of glycolysis were found, which implies that it might be too early to investigate protein alteration at that time. Findings also indicate that actin and MHC are degraded with regard to post mortem period and that actin is the major protein affected by rate of glycolysis at 24 h post mortem. The results of the enzymatic kinetic parameters of aldolase A and GAPDH at 20 min post mortem imply that considering only these two enzymes are not sufficient to classify PSE meat from normal one. Their activities were also modified by the lower pH20 min probably due to the enzyme alteration caused by the combination of low pH and high muscle temperature early post mortem.
Acknowledgements
The turkey breast muscles used in this study were generously provided by Gastronome S.A. Company (Moncoutant, France). The advice of N. Lindley for measurement of GAPDH activity is gratefully appreciated. Colleagues who kindly helped in turkey sampling are also acknowledged.