I. INTRODUCTION
For energy conservation, the goal of a power plant with steam conditions of 700 °C will be imperative. However, when the steam temperature reaches 700 °C, the 18Cr–8Ni austenitic stainless steel currently used cannot meet the requirements.Reference Blum, Vanstone and Strang1–Reference Viswanathan, Henry, Tanzosh, Stanko, Shingledecker, Vitalis and Purgert3 The Ni–25Cr–20Co alloy (also known as alloy 740H) is a newly developed alternative material based on Alloy 740. By increasing Al content and limiting the contents of Nb, Ti, and B, the formation and growth of the G phase ((Nb,Ti)6(Ni,Co)16Si7) are restrained in the Ni–25Cr–20Co alloy. Moreover, the alloy obtains the high creep strength mainly due to the γ′ precipitation strengthening.Reference Zhao, Xie, Smith and Patel4–Reference Bechetti, DuPont, De Barbadillo, Baker and Watanabe9 The γ′ precipitation is an intermetallic compound with an L12 ordered face-centered cubic structure.
It is generally recognized that the mechanical properties of the Ni-based alloys are closely related to the composition, volume fraction, size, morphology, and distribution characteristics of the γ′ precipitation. In addition, the lattice parameter misfit between the γ′ precipitation and the matrix, together with the factors previously, affects the mechanical properties of the alloys.Reference Sims, Stoloff and Hagel10–Reference Wagner14 Overall coarsening of the γ′ precipitation with aging and its influence on the mechanical properties are significant themes in previous decades. The coarsening kinetics proposed by Lifshitz and SlyozovReference Lifshitz and Slyozov13 and WagnerzReference Wagner14 (known as the LSW theory) predicts that the average radius of the γ′ precipitation growing with aging time follows the asymptotic equation, r 3 = kt, where k is the coarsening rate constant, which depends on the volume fraction and size distributions of the particles. The LSW theory has its basic assumptions: (i) the particles shall be spherical existing in liquid in a liquid matrix; (ii) the spatial position of the particles is fixed; (iii) the average spacing between particles is far larger than particle radius so that the particle is free. However, the transformation of solute diffusion field and the precipitate–precipitate interaction cannot be ignored for most multicomponent Ni-based superalloys.
While other presumption was put forward to revise the LSW theory,Reference Voorhees and Glicksman15–Reference Muralidharan and Chen17 ArdellReference Ardell and Ozolins18 has recently proposed a new theory, the trans-interface diffusion-controlled (TIDC) coarsening model, based on diffusive transport through the disorder–order γ/γ′ interface. Unlike the LSW theory, ArdellReference Ardell and Ozolins18 has point out that the TIDC theory is the only one coarsening kinetics independent of the volume fraction of γ′. Furthermore, discussions on a number of binary alloys and ternary alloys indicated a coarsening mechanism in accordance with this interface diffusion model.Reference Mishin19–Reference Ardell27 However, the applications of the TIDC model on multicomponent superalloys are relatively little. Tiley et al.Reference Tiley, Viswanathan, Srinivasan, Banerjee, Dimiduk and Fraser28 have proved that the TIDC model can describe the coarsening behavior of γ′ in Rene’ 88 DT while Meher et al.Reference Meher, Nag, Tiley, Goel and Banerjee29 considered that the LSW model is the dominant coarsening mechanism based on the experimental data of γ′ in Co-based alloys.
In this study, we examine the coarsening behavior of the γ′ precipitation in Ni–25Cr–20Co alloys aging at both 700 and 750 °C for different times. The main contents of this study are listed as follows:
(i) Observation of the carbides and γ′ precipitation and evolution during aging, especially the particle sizes and morphology.
(ii) Research on the practicability of both models explaining the coarsening behavior of the γ′ precipitation.
(iii) Exploring the mechanical properties at different test temperatures after aging and explaining the properties based on the theory argumentation.
II. MATERIALS AND METHODS
The chemical composition of the Ni–25Cr–20Co experimental tube (Φ51 × 10 mm) is analyzed to be 53.01Ni–24.84Cr–17.64Co–1.60Al–1.23Ti–1.41Nb–0.23W–0.05Zr–0.018C wt%. The manufacturing process of the experimental tube is hot extrusion following by cold rolling. Then, the tube was solution treated at 1200 °C for 1 h following by water cooling. Moreover, the aging samples (8 × 10 × 170 mm) were derived from the experimental tube by wire-electrode cutting. Finally, the samples were aged for 1000, 3000, and 5000 h at both 700 and 750 °C in a vacuum furnace and air quenched.
After aging, the samples were divided into two groups, one for microscopic observation and the other for mechanical properties. Standard metallographic methods were used to ground and polish the samples. Following polishing, the samples were etched with dilute aqua regia of HCl, HNO3, and H2O volume fraction of 3:1:10 for 10 min. SEM studies were carried out using an APOLLO300 microscope (CamScan, Cambridge, United Kingdom) operated at 10 and 15 kV. The composition of the precipitates was determined by using a BRUKER Quantax EDS detector (Bruker Corporation, Karlsrube, Germany). The TEM samples were cut by using a wire-electrode from the aged samples, polished to 50 μm thickness, and then electropolished in a solution of 10% HClO4 + 90% C2H5OH at a temperature of −15 °C and a voltage of 16 V. The TEM analysis was conducted on a JEM-2100 microscope (JEOL Ltd., Tokyo, Japan) operated at 200 kV. The TEM micrographs were processed using Adobe Photoshop (Adobe Systems Incorporated, San Jose, California),30 Fovea Pro (Reindeer Graphics, Asheville, North Carolina),31 and published image stereology analysisReference Russ and Dehoff32 to determine the area fraction from the image pixels. The radius values and the volume fraction of the γ′ precipitates were converted by the area fraction.Reference Tiley, Viswanathan, Srinivasan, Banerjee, Dimiduk and Fraser28 Each data was a statistical result of at least five micrographs. The errors in the sample data sets were determined by the following equationReference Parratt33:
 $${S_{\rm{E}}} = {{{S_{\rm{D}}}} / {{{\left( N \right)}^{0.5}}}}\quad ,$$
where S E is the standard error, S D is the standard deviation over all measured values in a sample, and N is the number of γ′ precipitates measured.
Specimens for tensile tests with a gauge diameter of 5 mm and a gauge length of 80 mm were machined from aged samples. Mechanical property tests were carried out using a DW100 electronic tensile testing machine (Changchun keda testing machine manufacturing co., LTD, Changchun, China) at the temperatures of room temperature (RT) and 700 °C. The test temperature deviations were controlled with ±3 °C. The strain rate for the tensile test was 1 mm/min.
III. RESULTS
A. Microstructure characterization
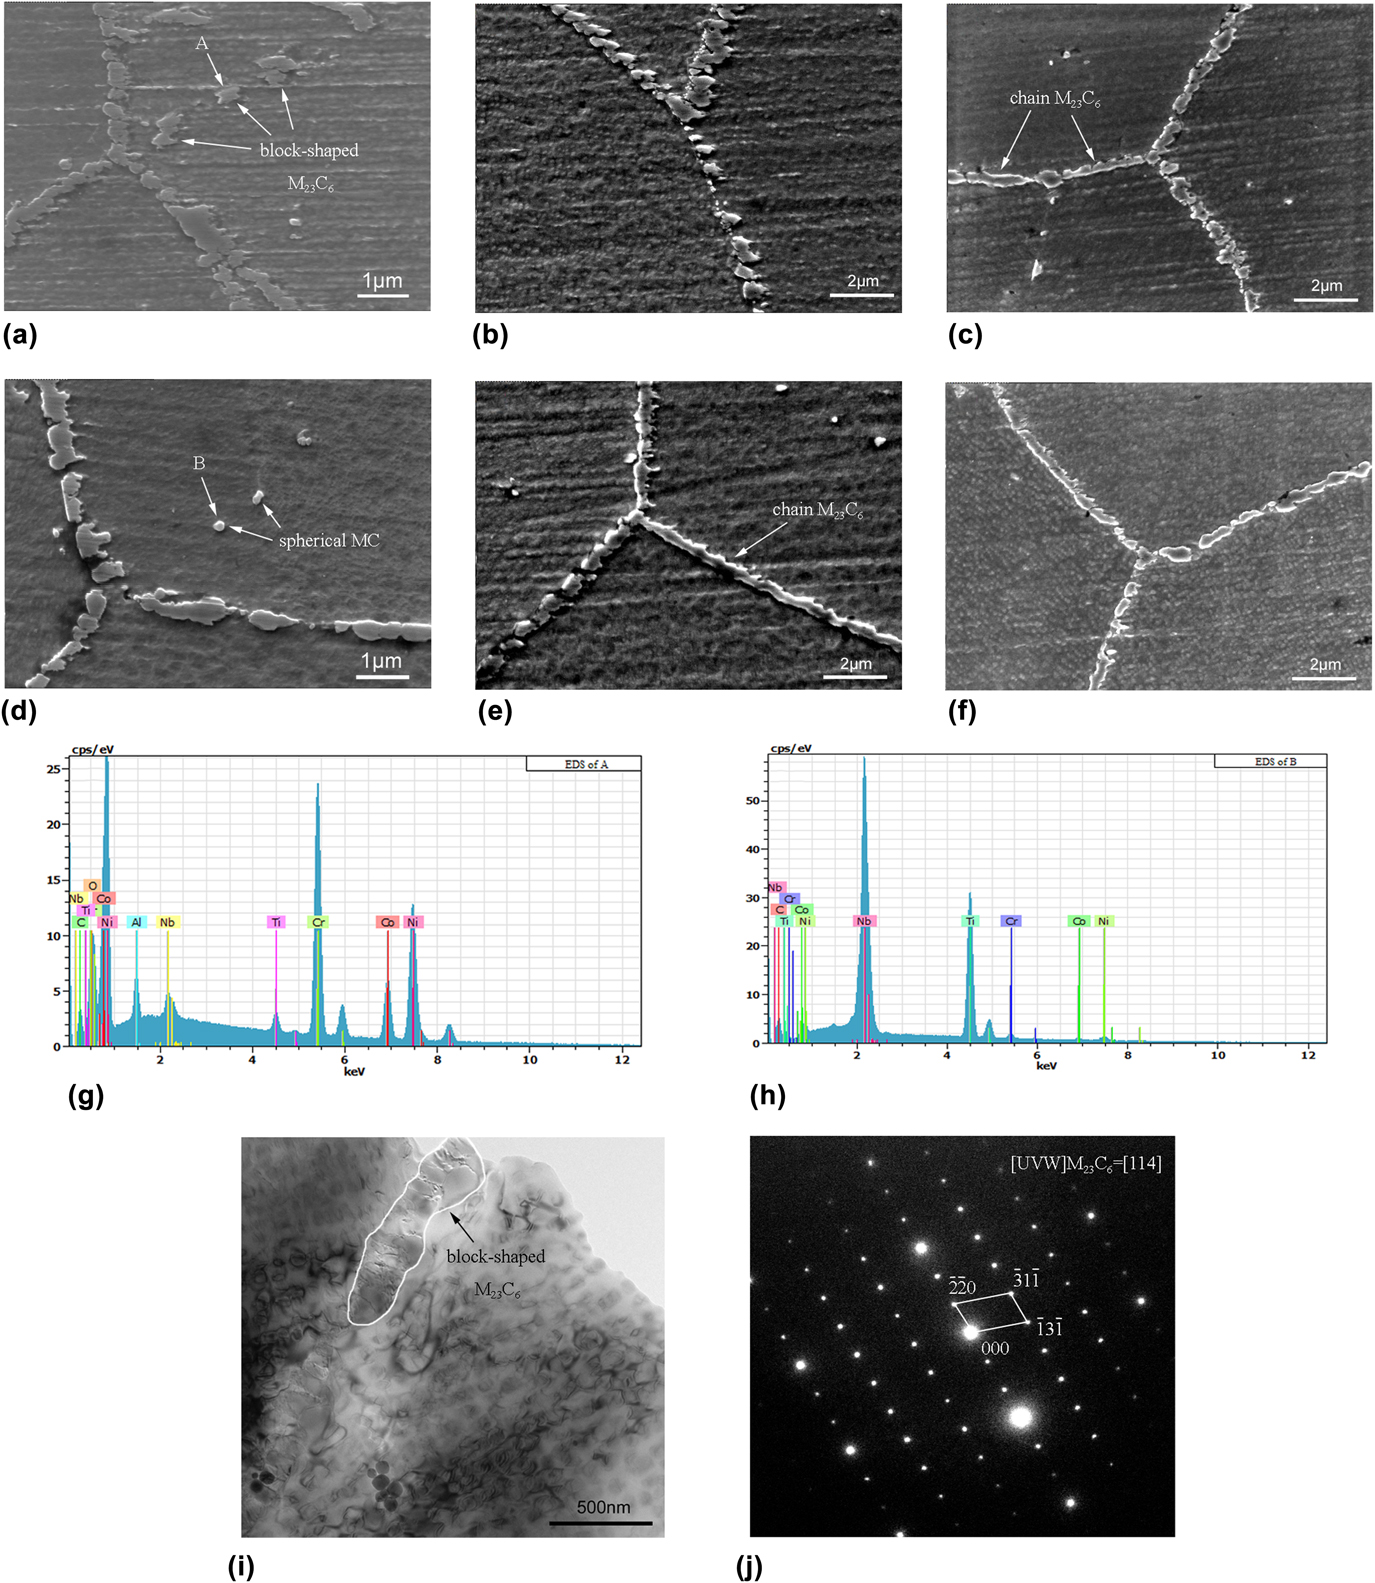
The microstructures obtained in the alloys after different aging treatments are compared in Fig. 1. In Figs. 1(a) and 1(d), two phases with different shapes are found in the matrix after aging at 700 and 750 °C for 1000 h, where block-shaped precipitates discontinuously at the grain boundary and spherical inside the grains. According to energy dispersive spectrometer [Fig. 1(g)] measurements and selected area diffraction pattern [Fig. 1(j)] analyses, the block-shaped phase, of 1–2 μm mean size, is identified to be Cr-rich M23C6 which can be described as  ${\left\{ {001} \right\}_\gamma }{\rm{//}}{\left\{ {001} \right\}_{{{\rm{M}}_{{\rm{23}}}}{{\rm{C}}_{\rm{6}}}}}{\left\langle {001} \right\rangle _\gamma }{\rm{//}}{\left\langle {001} \right\rangle _{{{\rm{M}}_{{\rm{23}}}}{{\rm{C}}_6}}}$. Similarly, EDS [Fig. 1(h)] reveals the spherical precipitates to be rich in Nb, Ti, and C, thus being MC-type carbide (Nb, Ti)C.·As the aging time prolong to 3000 h, the shape of M23C6 transforms from block-like to chain at 750 °C aging, compared to block-like still for 700 °C aging, as shown in Figs. 1(b) and 1(e). From Figs. 1(c) and 1(f), the chain M23C6 is observed at both aging temperatures. Additionally, it is found that the width of M23C6 has little changing ranges (∼0.3–0.4 μm) during the whole aging at both aging temperatures. Therefore, it demonstrates that M23C6 continually precipitated in long-term exposure, whereas coarsening was not obviously. Moreover, compared to M23C6, (Nb, Ti)C has neither growing nor coarsening during the aging.
Series of SEM micrographs depicting temporal evolution of precipitates during aging at 700 and 750 °C: (a) 1000 h at 700 °C; (b) 3000 h at 700 °C; (c) 5000 h at 700 °C; (d) 1000 h at 750 °C; (e) 3000 h at 750 °C; (f) 1000 h at 750 °C; (g) EDS of A; (h) EDS of B; (i) TEM images of block-shaped M23C6; (j) SAED patterns of block-shaped M23C6.

B. γ′ sizes, volume fraction, and morphology
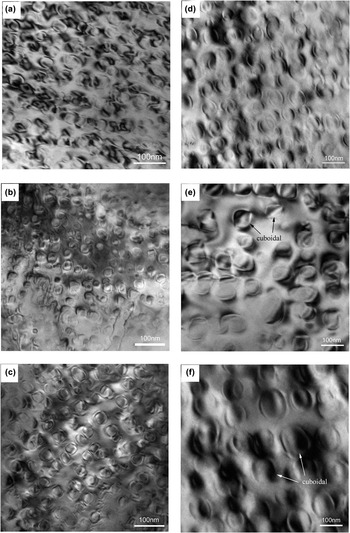
The presence and distribution of the γ′ precipitates in the alloys after 1000, 3000, and 5000 h of aging heat treatment are compared in Fig. 2. It is immediately apparent that the γ′ precipitates’ sizes are increasing with increasing aging time which is in agreement with those reported in previous studies on similar alloys.Reference Yan, Zheng dong, Godfrey, Wei and Yu qing8,Reference Tiley, Viswanathan, Srinivasan, Banerjee, Dimiduk and Fraser28,Reference Meher, Nag, Tiley, Goel and Banerjee29,Reference Qiu34,Reference Khan, Singh and Verma35 In Figs. 2(e) and 2(f), it can be seen that a few of γ′ precipitates’ shape changed from spherical to cuboidal during the aging treatment. Generally, the coarsening behavior and morphology changing of the γ′ precipitates were closely related to coherent strain, γ/γ′ interfacial energy, solute concentration, and solute atom diffusion,Reference Yoo, Yoon and Henry36,Reference Vaithyanathan and Chen37 among which the strain energy and interfacial energy were mainly resistance factors for γ′ growth.Reference Grosdidier, Hazotte and Simon38 From the view of energy minimization, the magnitude of that two decided the morphology of γ′ precipitates. In the initial time, the γ′ precipitates’ sizes were small, the interfacial energy played the major role, and the shape of γ′ precipitates was spherical. Nevertheless, when aged up to 3000 h at 750 °C, the strain energy predominated with γ′ precipitates’ growth, and the morphology of γ′ precipitates changed from spherical to cuboidal.
Series of electron micrographs depicting temporal evolution of γ′ precipitates during aging at 700 and 750 °C. (a)–(c) aging at 700 °C; (d)–(f) aging at 750 °C.

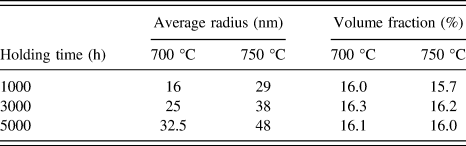
To accurately determine the γ′ precipitates’ sizes, quantification of the size distributions of γ′ precipitates was carried out in similar TEM images. During aging, the γ′ particles grew continuously from a mean precipitate radius increase of 16–48 nm (Table I).
Comparison of the average γ′ precipitate sizes and volume fraction with holding time for isothermal aging at both 700 and 750 °C.

C. Mechanical properties
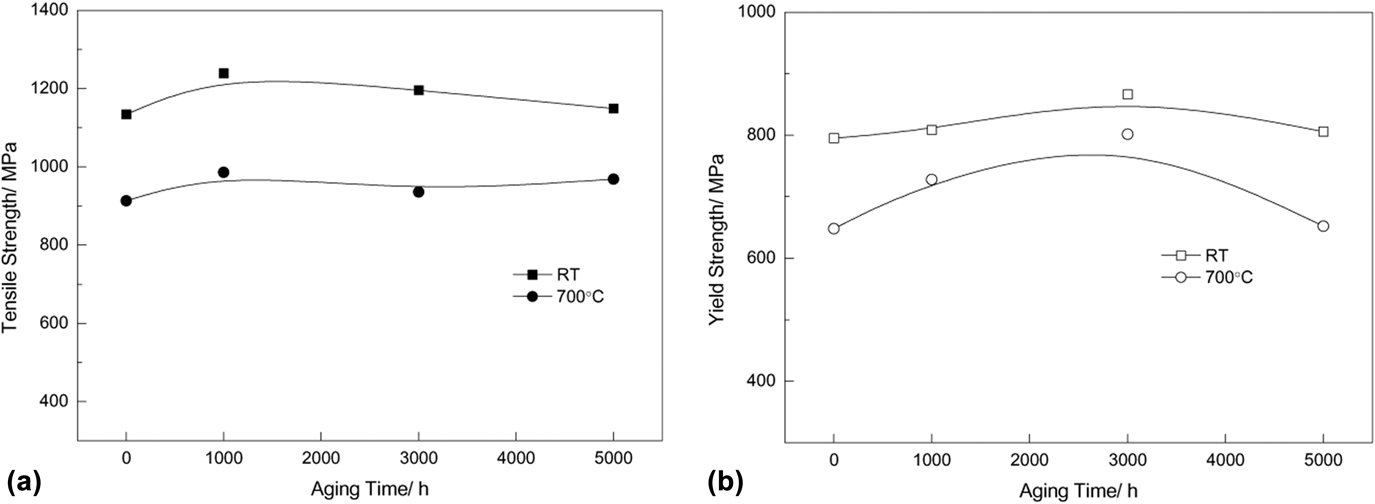
The tensile properties of the Ni–25Cr–20Co alloys tested at different temperatures after thermal exposure at 700 °C are shown in Fig. 3. In general, the curves of the tensile strength at both temperatures and the yield strength at RT demonstrate a stability situation. However, the yield strength at 700 °C increased first and decreased afterwards with aging. Moreover, the maximum value of yield strength occurred at aging for 3000 h.
Mechanical prosperities of the specimens test at different temperatures after aging at 700 °C: (a) tensile strength versus aging time; (b) yield strength versus aging time.

IV. DISCUSSION
A. Evolution of the carbide
The microstructure of the Ni–25Cr–20Co alloy, subjected to isothermal aging at 700 and 750 °C, was characterized. The main carbides precipitated at the grain boundary were identified to be Cr-rich M23C6, while other carbides within the austenitic grains were detected to be MC-type carbide (Nb, Ti)C. Moreover, the morphology of M23C6 was observed to transform from block-like to chain during aging. Generally, the formation and growth of M23C6 is a process of element redistribution and reduction of the strain energy reduction.Reference Trillo and Murr39 In the initial aging, short-range diffusion is the dominant mechanism for the solute element in the matrix, such as Cr and C.Reference Kaneko, Fukunaga, Yamada, Nakada, Kikuchi, Saghi, Barnard Jon and Midgley40 Moreover, the grain boundary regarded as a local perturbation of the fcc lattice provides a convenient path for the solute diffusion. Therefore, the nucleus of M23C6 forms on the grain boundary with block-like morphology. As the aging time prolong, the M23C6 is coarsening gradually with the morphology changing from block-like to chain. The transformation of morphology is based on the short-range diffusion and bulk diffusion. However, the MC carbide showed a good thermal stability in size and morphology due to the high (Nb + Ti)/Mo and Nb/Ti.Reference Qin, Guo, Yuan, Hou, Zhou and Ye41
B. Modeling the coarsening kinetics of γ′ precipitates
It is accepted wisdom that coarsening of γ′ precipitates in Ni-based alloys occurs via Ostwald ripening, and this theory has been widely developed in the past decades. The classical LSW modelReference Lifshitz and Slyozov13,Reference Wagner14 calculated that the average radius, r, of γ′ precipitates and aging time, t, by r 3 ≈ kt. However, particle–particle interactions and solute diffusion field changing were ignored by the LSW theory. While other modifications have been proposed to account for some of the assumptions based on the LSW model, recently, a second coarsening model, the TIDC model, was proposed by Ardell and Ozolins.Reference Ardell and Ozolins18 The TIDC model is based on diffusion across the γ/γ′ interface and there is no effect of volume fraction on kinetics and the scaled particle-size distributions in this model. The TIDC theory predicted that the average radius, r, of γ′ precipitates and aging time, t, by r n ≈ kt, where n varying over the range 2 ≤ n ≤ 3.Reference Ardell and Ozolins18 To determine the coarsening kinetics of γ′ precipitates in the Ni–25Cr–20Co alloy, an attempt has been made to study the applicability of both models for coarsening of the γ′ precipitates in the alloys.
C. LSW coarsening model
As mentioned above, such a matrix diffusion-limited coarsening process is described according to the LSW model by the following law:
 $$r_t^3 - r_0^3 = {k^{\rm{v}}}t\quad ,$$
where r t is the mean particle size at a time t, r 0 is the mean particle size at aging time, t = 0, and k v is the coarsening rate constant, which depends on the volume fraction and size distributions of γ′ precipitates.
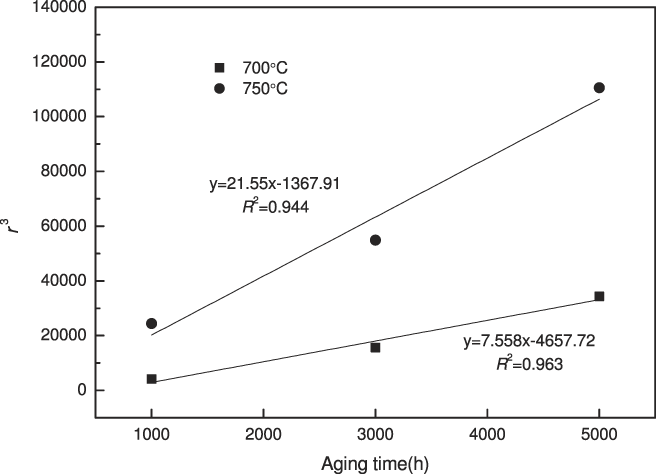
The average particle sizes for different aging times at both temperatures have been drawn on a graph of particle size  $\left( {r_t^3} \right)$ versus aging time (t), as shown in Fig. 4. To obtain the rate constants, the data points for samples at initial aging (t = 0) have not been considered. As shown in Fig. 4, the coarsening constants have been obtained from the slopes of these fitting curves, k v = 5.98 × 10⁻³⁰ m3/s and 2.10 × 10⁻³⁰ m3/s for 750 and 700 °C, respectively. Thus with the aging temperature rising for 50 °C, the coarsening constant increases nearly 3 times.
Plot of particle size (r 3) versus aging time (t) during aging at 700 and 750 °C.

Generally, in the LSW coarsening theory, the coarsening rate constant, k v, depends on a multitude of parameters, such as the γ/γ′ interfacial energy, the solute equilibrium coefficient, the diffusion coefficient of the solute, etc. The coarsening rate constant k v can be described as followsReference Voorhees and Glicksman15–Reference Muralidharan and Chen17,Reference Tiley, Viswanathan, Srinivasan, Banerjee, Dimiduk and Fraser28,Reference Meher, Nag, Tiley, Goel and Banerjee29 :
 $${k^{\rm{v}}} = {{8D{C_{\rm{e}}}(1 - {C_{\rm{e}}})\sigma V} \over {9RT(C_{\rm{e}}^{{\rm{\gamma '}}} - {C_{\rm{e}}})}}\quad ,$$
where D is the solute diffusion coefficient in the matrix, C e is the atomic fraction of solute in equilibrium with the precipitate, σ is the γ/γ′ interfacial energy, V is the molar volume of the γ′ precipitate,  $C_{\rm{e}}^{{\rm{\gamma '}}}$ is the equilibrium solubility of the solute in the γ′ precipitate, R is the universal gas constant, and T is the absolute temperature. For the multicomponent Ni-based alloys, the values of C e, V, and
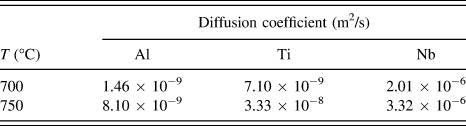
 $C_{\rm{e}}^{{\rm{\gamma '}}}$ are constant at a specified temperature. In addition, the γ/γ′ interfacial energy σ is 60–90 mJ/m2 which had little effect on the value of k v.Reference Li, Saunders and Miodownik42 Overall, for the Ni-based alloys aging at a temperature, the coarsening rate constant k v is mainly affected by the solute diffusion coefficient in the matrix D. As a (Ni, Co)3(Al, Ti, Nb)-type precipitate,Reference Zhao, Xie, Smith and Patel4,Reference Evans, Maziasz, Swindeman and Smith6–Reference Bechetti, DuPont, De Barbadillo, Baker and Watanabe9 the coarsening rate constant of γ′ precipitates and the diffusion coefficients of Al, Ti, and Nb should be interrelated. Furthermore, the D values of Al, Ti,Reference Minamino, Jung, Yamane and Hirao43 and NbReference Sparke, James and Leak44 are listed in Table II, and it shows that the diffusion coefficient of Nb is higher than that of Al and Ti. Therefore, in the classical LSW coarsening theory, the coarsening rate of γ′ precipitates in Ni–25Cr–20Co alloys is dominated by the diffusion coefficients of Nb.
Diffusion coefficients of Al, Ti, and Nb in the γ matrix.

D. TIDC coarsening model
From the above discussion, it indicates that coarsening of the γ′ precipitates in the alloys could conform to the LSW coarsening model, while an attempt has been made to study the suitability of coarsening of the γ′ precipitates and TIDC model. Initially, the TIDC model was presented based on the particle size distributions in binary alloys.Reference Mishin19–Reference Ardell, Kim and Ozolins25 Then, as the theories of matrix diffusion-limited coarsening changing for the ternary alloys, the TIDC-T theory was put forward for the coarsening in ternary alloys.Reference Ardell26,Reference Ardell27
In such a scenario, the temporal evolution of the γ′ precipitates follows the following law:
 $$r_t^n - r_0^n = {k^i}t\quad ,$$
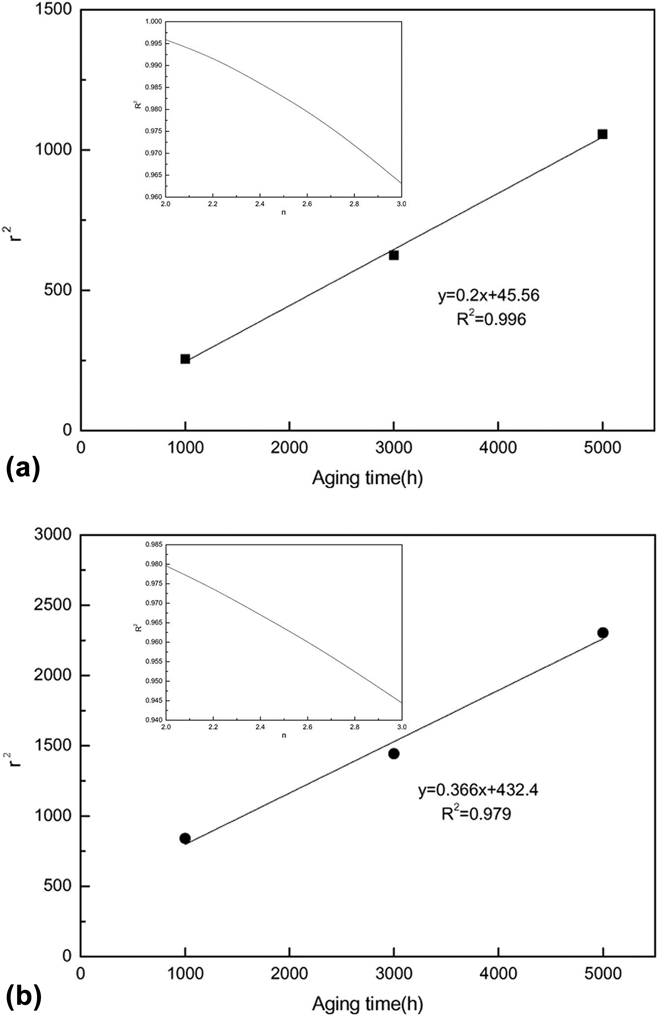
where k i is a rate constant related to the thermophysical parameters of the alloy system. The best fits of n to date were sought by fitting to plots of particle size (r n) versus aging time (t) for n varying over the range 2 ≤ n ≤ 3, determined from the values of the correlation coefficients (R 2). The results are shown in Fig. 5. It is indicated that the plot of correlation coefficients (R 2), inset in Fig. 5, decreases monotonically with increasing n. Therefore, it shows that n = 2 is a sensible value for the temporal exponent. Compared with R 2 for the LSW model, the values of R 2 are larger for the TIDC model. Here, the main point is to indicate that both temporal exponents yield reliable results, not to indicate that the TIDC model is better fitting than the LSW model.
Plot of particle size (r 2) versus aging time (t) during aging at 700 and 750 °C. The curve insets in each figure are plots of R 2 versus n. (a) aging at 700 °C; (b) aging at 750 °C.

In the TIDC model, the rate constant k i can be described by the following expressionReference Ardell and Ozolins18:
 $${k^i} = {{64\tilde{D}{V_\sigma }} \over {81\Delta X_{\rm{e}}^2\delta {{G''}_{{\rm{m\gamma }}}}}}\quad ,$$
where  $\tilde{D}$ is the chemical trans-interface diffusion coefficient, V is the partial molar volume in the γ′ precipitates, σ is the interfacial free energy, ΔX e is the difference in solute concentration between the equilibrium compositions of the γ′ precipitates and matrix, δ is the interface width, and
 ${G''_{{\rm{m\gamma }}}}$ is the curvature of the molar Gibbs free energy of mixing of the matrix. In the TIDC theory, the most obvious choice is
 $\tilde{D}$, which is a weighted average chemical trans-interface diffusion coefficient. As mentioned in the previously published literature,Reference Ardell45
 $\tilde{D}$ is defined by the following equation:
 $$\tilde{D} = {X_i}{D_{{\rm{Ni}}}} + (1 - {X_i}){D_i}\quad ,$$
where X i is the average concentration of solute in the matrix, and D Ni and D i are the intrinsic diffusion coefficients of Ni and solute in the γ′ precipitates. The calculations of D Al were done by Ardell,Reference Ardell45 Hoshino,Reference Hoshino, Rothman and Averback46 and ShiReference Shi, Frohberg and Wever47 while the dates of the other two elements, Ti and Nb, are not available in the published literature. Therefore, in the TIDC theory, the dominating element of the γ′ coarsening rate merits further study.
E. Discussions on the LSW and TIDC coarsening models
Figure 6 shows the γ′ precipitates’ size distributions together with the plots from the LSWReference Lifshitz and Slyozov13 and the TIDCReference Ardell and Ozolins18 coarsening models. Essentially, either model is in full accordance with the radius distributions of the γ′ precipitates. Besides the discrete points, the particle size distributions are in accordance with the LSW model somewhat better at relatively small sizes (ρ < 0.87). For the larger size particles (ρ ≥ 0.87), the size distributions are fitting the TIDC model much better. As mentioned earlier, the LSW model is based on the matrix diffusion with various basic assumptions. In the initial aging stage, the solute atoms sufficiently dispersed in the matrix and the precipitate–precipitate interaction was relatively small, which was satisfying the assumptions of the LSW model. Meanwhile, the rate-limiting step mentioned in the TIDC model can be ignored in this stage. Thus, the particle size distributions were in accordance with the LSW model. With the coarsening of the γ′ precipitates, the solute atoms in the matrix were becoming rarer, especially in the order–disorder γ/γ′ interface nearby. The effect of the transformation of solute diffusion field and the precipitate–precipitate interaction was gradually important. Thus, the TIDC model, containing both the relative factors, was somewhat more suitable in this stage.
Radius distributions of the γ′ precipitates for aging at 700 and 750 °C, compared with the predictions of the LSW and TIDC models: (a) aging at 700 °C; (b) aging at 750 °C. The variable ρ is a dimensionless particle radius defined by  $\rho = {r / {\bar{r}}}$, where r is the measured value of the particle at aging time and
 $\bar{r}$ is the average radius.

Overall, from the above discussion, both the LSW and TIDC models can explain coarsening kinetics of the γ′ precipitates in the alloys. However, there are still a few imperfect aspects need to be resolved and it is rather difficult to establish unequivocally which one is more suitable. Additionally, unlike the binary Ni–X alloys and the ternary Ni–X1–X2 alloys discussed in the published literature,Reference Mishin19–Reference Ardell27 the Ni–15Cr–20Co alloy has a multitude of solute elements, such as Cr, Ti, Nb, W, etc., which influence the coarsening of the γ′ precipitates.Reference Campbell48,Reference Semiatin, Kramb, Turner, Zhang and Antony49 So far the determination of the trans-interface diffusion coefficient of such elements and their interaction are not available. Moreover, the interface width, δ, which plays an important role on the rate constant in the TIDC model, is proved to be not constant in the recent research.Reference Qiu34,Reference Hwang, Banerjee, Tiley, Srinivasan, Viswanathan and Fraser50 It is actually dominated by aging time, solution treatment, γ′ coarsening, and other factors. Moreover, such element content, capillary length, and aging temperature may be important in interface-controlled diffusion in the coarsening process.
F. Effect of the γ′ precipitates on mechanical properties
It was widely claimed that the γ′ precipitates act as strong obstacles to the dislocation motion in the plastic deformation of Ni-based alloys. Brown and HamReference Brown, Ham, Kelly and Nicholson51 had proposed four mechanisms: cutting mechanism, Orowan mechanism, climbing mechanism, and dragging mechanism, for the dislocation overcoming the precipitate obstacles based on the interaction between dislocation and precipitates. In general, for the Ni–25Cr–20Co alloys, the cutting mechanism and the Orowan mechanism are the typical models of the dislocation motion.Reference Yan, Zheng dong, Godfrey, Wei and Yu qing8,Reference Oh, Choi, Kim, Yoo and Jang52 In accordance with the aging time, there are four states of a sample: under aged, peak aged, slightly over aged, and highly over aged. Additionally, in the first three states, the mechanism of dislocation overcoming the precipitate obstacles is cutting mechanism. However, for the highly over aged samples, the mechanism is transformed from the cutting mechanism to the Orowan mechanism. The four different dislocation processes in γ′ hardened materials can be described by the following expressionsReference Nembach and Neite53:
(i) Particle cutting in under aged samples:
 $$\Delta {\tau _{{\rm{p1}}}} = {1 \over 2}{\left( {{{{\gamma _{{\rm{APB}}}}} \over b}} \right)^{{3 / 2}}}{\left( {{{bdV} \over T}} \right)^{{1 / 2}}}m - {1 \over 2}\left( {{{{\gamma _{{\rm{APB}}}}} \over b}} \right)V\quad ,$$
where ∆τ is the critical resolved shear stress (CRSS), γAPB is antiphase boundary energy of the γ′ precipitates in the {111} plane, b is the Burgers vector of edge dislocation in the γ matrix, d is the diameter of the γ′ precipitates, V is the volume fraction of the γ′ precipitates, T is the line tension of the dislocation, and m is the numerical factor associated with the morphology of the precipitates.
(ii) Particle cutting in peak aged samples:
 $$\Delta {\tau _{{\rm{p2}}}} = {{{\gamma _{{\rm{APB}}}}} \over {2b}}[{(1.09V)^{1/2}} - V]\quad .$$
(iii) Particle cutting in slightly over aged samples:
 $$\Delta {\tau _{{\rm{p3}}}} = \left( {{{\sqrt 3 } \over 2}} \right){{T{V^{1/2}}w} \over {bd}}{\left( {1.28{{d{\gamma _{{\rm{APB}}}}} \over {wT}} - 1} \right)^{{1 / 2}}}\quad ,$$
where w is a content which accounts for the elastic repulsion between the strongly coupled dislocations. In addition, the line tension of the dislocation, T, follows the following law:
 $$T = {{G{b^2}} \over 2}\quad ,$$
 $$G = {{E(1 + \nu )} \over 2}\quad ,$$
where G is the elastic shear modulus, E is the elastic modulus, and ν is the Poisson’s ratio.
(iv) Orowan process in highly over aged samples:
 $$\Delta {\tau _{{\rm{p4}}}} = {{0.4Eb} \over {\pi \lambda \sqrt {1 - \nu } }}\ln \left( {{{2{r_{\rm{s}}}} \over b}} \right)\quad ,$$
 $${r_{\rm{s}}} = \sqrt {2/3} r\quad ,$$
 $$\lambda = \left( {\sqrt {(\pi /V)} - 2} \right){r_{\rm{s}}}\quad .$$
For evaluating the relationship between the CRSS and the γ′ precipitates’ radius, the value of variables in Eqs. (7)–(14) should be known. In the present study, the values of γAPB, b, w, and ν are taken as 0.28 J/mol, 0.254 nm, 1, and 0.35, respectively.Reference Reppich54,Reference Pretorius and Nembach55 The elastic modulus is taken to be 178 GPa. For the spherical γ′ precipitates, m = 0.72.Reference Pretorius and Nembach55
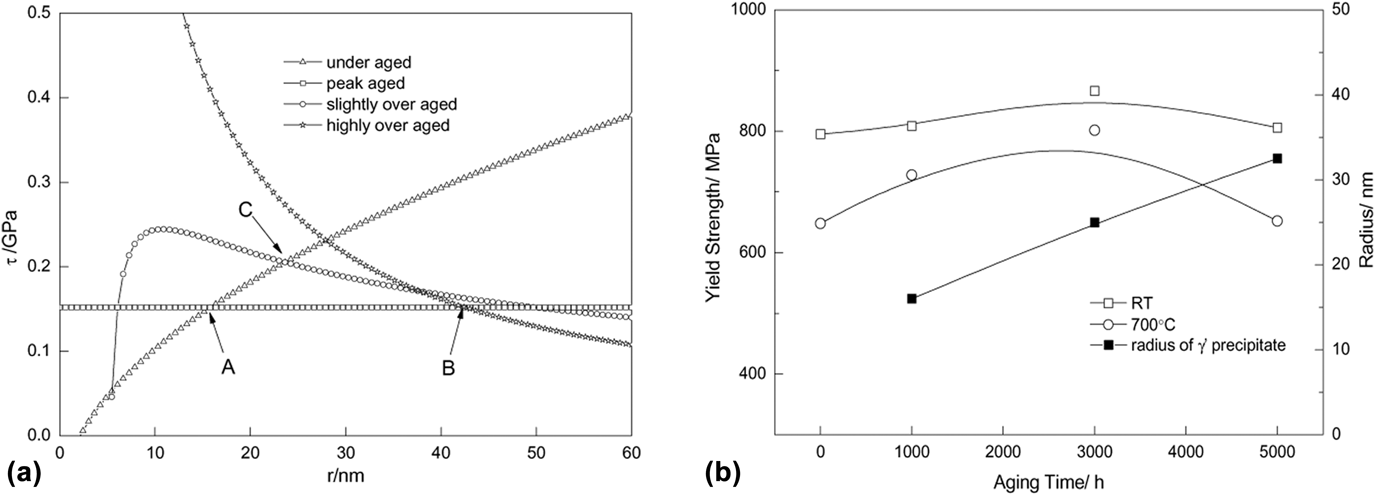
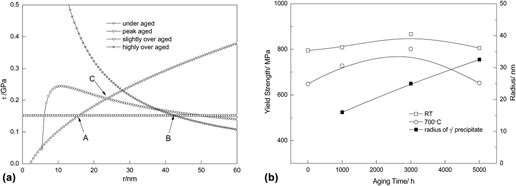
Although the four models are known to be typical models for the precipitation strengthening in Ni-based alloys, it is noteworthy that small coherent stress accompanying the γ′ precipitates is a prerequisite for the equations. In our work, with a lower volume fraction of the γ′ precipitates, the coherent stress is relatively small which can be ignored in CRSS calculation. Figure 7(a) shows a plot of γ′ precipitates’ radius (r) versus CRSS (τ) for the models. It can be seen that the dominant mechanism changed with the γ′ precipitates coarsening which can be divided into three stages. Initially, before A point, the sample is in under aged condition, and the CRSS can be calculated with Eq. (7). Additionally, between A and B points, the sample is in peak aged condition. Then, after B point, the sample is in over aged condition. There exists a dimensional range of r between A and B points that gives the highest flow stress. For Ni–25Cr–20Co alloys, the dimensional range of r was calculated to be about 15.7–42.3 nm, which is in good agreement with the result of yield strength at RT, as shown in Fig. 7(b). However, the yield strength at 700 °C increased first and decreased afterwards with aging. Nembach et al. concluded that the dislocations may shear or bypass γ′ precipitates and both mechanisms may occur concurrently in the peak and over aged samples.Reference Nembach and Neite53 There is possibility that the mechanisms which Eqs.(7) and (9) represented are the dominant mechanisms in the tensile testing at 700 °C. Therefore, there exists a critical dimension of r at C point calculated to be about 24.5 nm, which coincides well with the result of yield strength at 700 °C [Fig. 7(b)].
Analysis of precipitation strengthening for the Ni–25Cr–20Co alloy: (a) analytical calculations of CRSS versus γʹ precipitate size; (b) yield strength versus γʹ precipitate size.

V. CONCLUSIONS
Based on the experimental analysis of the Ni–25Cr–20Co alloys aged at 700 and 750 °C, the following conclusions can be made:
(1) Cr-rich M23C6 was precipitated at the grain boundary with morphology transforming from block-like to chain during aging. After aging, the MC phase was precipitated in the grain interior without changing in size and morphology.
(2) The sizes of γ′ particles increased with aging time while the volume fraction remained content, approximately 16%. The γ′ precipitates had a spherical morphology in the alloys aged at 700 °C. Since the predominated resistance factor was changed from strain energy to interfacial energy, the γ′ precipitates morphology transformed from spherical to cuboidal after aging at 750 °C for 3000 h.
(3) An attempt had been made to study the applicability of the LSW model and TIDC model for coarsening of the γ′ precipitates in the alloys. The results show that both the models can explain coarsening kinetics of the γ′ precipitates. The coarsening of the γ′ precipitates in the Ni–25Cr–20Co alloys is dominated by the diffusion coefficients of Nb based on the classical LSW model. However, due to the critical data of D i not available in the present research, the dominating element of the γ′ coarsening is not clear yet based on the TIDC model. Furthermore, the particle size distributions are fitting the LSW distribution better when the particle sizes are relatively small, while the TIDC model better for large sizes.
(4) The yield strength of the alloys aged at 700 °C showed different trends at both test temperatures. There exists a dimensional range of r that gives the highest flow stress. Additionally, the dimensional range of r was calculated to be about 15.7–42.3 nm, which is in good agreement with the result of yield strength at RT. The trend of yield strength at 700 °C is related to the mechanisms which Eqs. (6) and (8) represented.