Water resources are affected significantly by pollution because many industrial sectors consume large amounts of fresh water (Pavan et al., Reference Pavan, Gushikem, Mazzocato, Dias and Lima2007; Sarma et al., Reference Sarma, Gupta and Bhattacharyya2019; Yaseen et al., Reference Yaseen and Scholz2019). In particular, the textile, paper, printing, leather, food and cosmetics industries generate substantial amounts of residual water charged with various kinds of organic pollutants. Among the most common pollutants are synthetic dyes, representing a significant hazard to both human health and the environment. Removal of these compounds from wastewater is essential because of the complex nature of aromatic structures that renders them highly stable in aqueous environments (Mobarak et al., Reference Mobarak, Selim, Mohammed and Seliem2018; Mouni et al., Reference Mouni, Belkhiri, Bollinger, Bouzaza, Assadi and Tirri2018). Their refractory nature, even at low concentrations, is the source of many problems such as blocking sunlight and oxygen penetration into aquatic systems, thus harming the aquatic flora by inhibiting photosynthesis. Furthermore, they represent a potential hazard to human health due to their aromatic structures, which render them mutagenic and carcinogenic (Li et al., Reference Li, Yang, Li and Liu2017; Benhabiles et al., Reference Benhabiles and Rida2021).
Crystal violet (CV) is a cationic dye, and it is one of the most common dyes used in the textile, paper, printing and paint industries. In addition, it is used widely as a biological stain and dermatological agent in human and veterinary medicine (Monash et al., Reference Monash, Niwas and Pugazhenthi2011; Puri et al., Reference Puri and Sumana2018; Sarabadan et al., Reference Sarabadan, Bashiri and Mousavi2019a). Considered a carcinogen, mutagen and toxic, CV can also cause some other harmful effects at higher concentrations, such as blindness, digestive system issues, skin irritation and respiratory and kidney failure. Therefore, it represents a significant hazard to human health; wastewater containing this dye must be treated effectively before its reuse or discharge into the aquatic medium (Puri et al., Reference Puri and Sumana2018; Abbasi et al., Reference Abbasi, Yaraki, Farrokhnia and Bamdad2020; Rezazadeh et al., Reference Rezazadeh, Baghdadi, Mehrdadi and Abdoli2021).
Many techniques have been developed to eliminate dyes from wastewater, including biological processes (Varjani et al., Reference Varjani, Rakholiya, Ng, You and Teixeira2020; Srinivasan et al., Reference Srinivasan and Sadavisam2021), advanced oxidation processes (Miklos et al., Reference Miklos, Remy, Jekel, Linden, Drewes and Hübner2018), photochemical degradation (Dargahzadeh et al., Reference Dargahzadeh, Molaei and Karimipour2018), electrochemical degradation (Belal et al., Reference Belal, Zayed, El-Sherif and Abdel Ghani2021), chemical coagulation–flocculation (Gadekar et al., Reference Gadekar and Ahammed2016), nanofiltration with membranes (Askari et al., Reference Askari, Farhadian, Razmjou and Hashtroodi2016), reverse osmosis (Al-Bastaki, Reference Al-Bastaki2004) and adsorption (Sharma et al., Reference Sharma, Kaur, Sharma and Sahore2011; Yagub et al., Reference Yagub, Sen, Afroze and Ang2014). The latter method has attracted great attention because of its high efficiency, low cost, simple and clean operation and low energy input required for treating dye wastewaters effectively (Nadaroglu et al., Reference Nadaroglu, Kalkan, Celebi and Tasgin2015; Khairy et al., Reference Khairy, Ayoub, Rashwan and Abdel-Hafez2018; Boukhemkhem et al., Reference Boukhemkhem, Pizarro and Molina2020). Activated carbon is the most widely used industrial-scale commercial adsorbent due to its effectiveness and versatility, large specific surface area and diversity of functional groups (Giannakoudakis et al., Reference Giannakoudakis, Kyzas, Avranas and Lazaridis2016). However, it has some disadvantages, such as its high cost and difficulties regarding regeneration and separation. Thus, its use is uneconomical for industrial applications, and researchers seek lower-cost, naturally available, reusable and environmentally friendly alternative materials (Nandi et al., Reference Nandi, Goswami, Das, Mondal and Purkait2008; Liew et al., Reference Liew, Wang, Fang, Mwamulima, Song and Peng2018).
Alternative adsorbents have been used, such as biomass wastes (Ali et al., Reference Ali and Muhammad2008; Kumar et al., Reference Kumar and Ahmed2011; Kulkarni et al., Reference Kulkarni, Revanth, Acharya and Bhat2017; Abbasi et al., Reference Abbasi, Yaraki, Farrokhnia and Bamdad2020), fly ash (Liew et al., Reference Liew, Wang, Fang, Mwamulima, Song and Peng2018), natural and synthetic zeolites (Rida et al., Reference Rida, Bouraoui and Hadnine2013; Sarabadan et al., Reference Sarabadan, Bashiri and Mousavi2019b), alumina (Banerjee et al., Reference Banerjee, Dubey, Guatam, Chattopadhyaya and Sharma2019) and mesoporous and microporous silica (Jiang et al., Reference Jiang, Zhang, Yue, Zhang, Li and Xu2019; Hachemaoui et al., Reference Hachemaoui, Boukoussa, Mokhtar, Mekki, Beldjilali and Benaissa2020). Clay minerals have attracted the attention of researchers due to their natural origin, low cost, high availability and good adsorbent properties. Various clay minerals have been used for the removal of dyes from wastewater, such as pyrophyllite (Miyah et al., Reference Miyah, Lahrichi, Idrissi, Boujraf, Taouda and Zerrouq2017), smectite (Rytwo et al., Reference Rytwo, Nir and Margulies1993; Hamza et al., Reference Hamza, Dammak, Bel, Eloussaief and Mourad2018; Puri et al., Reference Puri and Sumana2018; Sarabadan et al., Reference Sarabadan, Bashiri and Mousavi2019a; Intachai et al., Reference Intachai, Suppaso and Khaorapapong2021), ball clay (Monash et al., Reference Monash, Niwas and Pugazhenthi2011), clinoptilolite (Nadaroglu et al., Reference Nadaroglu, Kalkan, Celebi and Tasgin2015), kaolinite (Sargin et al., Reference Sargin and Unlu2013), sepiolite (Eren et al., Reference Eren and Afsin2007; Karatas et al., Reference Karatas, Senol-Arslan and Ozdemir2018) and palygorskite (Al-Futaisi et al., Reference Al-Futaisi, Jamrah and Al-Hanai2007). Kaolinite clay (KT) is one of the cheapest, most naturally available and non-toxic of such materials. However, its small specific surface area (<20 m2 g–1) and low cation-exchange capacity (CEC; ~12 meq 100 g–1) make it less attractive than other clays for adsorption processes (Nandi et al., Reference Nandi, Goswami, Das, Mondal and Purkait2008; Jiang et al., Reference Jiang, Wang, Jin and Chen2009; Boukhemkhem et al., Reference Boukhemkhem and Rida2017). The literature reports few cases of the use of KT as an adsorbent for the removal of only methylene blue (MB) dye as a cationic dye, and the most attractive clays were natural or modified montmorillonites due to their large CEC and swelling properties, which make them suitable for intercalation by some surfactants (Rytwo et al., Reference Rytwo, Nir and Margulies1993; Sarabadan et al., Reference Sarabadan, Bashiri and Mousavi2019a, Reference Sarabadan, Bashiri and Mousavi2021). In previous research on KT, Rida et al. (Reference Rida, Bouraoui and Hadnine2013) evaluated the adsorption performance of MB removal in comparison with 4A zeolite. Boukhemkhem et al. (Reference Boukhemkhem and Rida2017) tested several treatments to improve the adsorption capacity of KT for MB. Recently, Mouni et al. (Reference Mouni, Belkhiri, Bollinger, Bouzaza, Assadi and Tirri2018) also studied the adsorption of MB on KT.
There are no studies in the literature focusing on the use of Tamazert KT as an adsorbent for the removal of other cationic dyes such as CV. Therefore, we studied the efficiency of KT for absorbing other cationic dyes. Furthermore, previous work has used linear models to study the kinetic parameters and equilibrium of adsorption of such processes, but one could criticize the use of the linear forms of such models, especially for the pseudo-second order (PSO) kinetic model, because when the linear form of the PSO model is considered it always gives good linearity with a high determination coefficient (Bujdak, Reference Bujdák2020). Therefore, the present work analyses the removal efficiency of KT for the cationic dye CV by studying the effects of various parameters, including contact time, initial dye concentration, initial pH, adsorbent dose and temperature. The kinetic mechanism was evaluated using the non-linear forms of the pseudo-first order (PFO) and PSO models. The equilibrium of adsorption was also studied using the non-linear forms of the Langmuir, Freundlich, Langmuir–Freundlich and Redlich–Peterson models.
Materials and methods
Chemical reagents
The Tamazert KT was provided by the National Society of Ceramics, located in the province of Jijel (western Algeria), and it was used as received. All chemicals used in this study, including concentrated hydrochloric acid (HCl, 37 wt.%), sodium hydroxide (NaOH), sodium chloride (NaCl) and CV (C25H30ClN3), were of analytical grade and were purchased from Sigma-Aldrich (MO, USA). The initial pH values of all of the solutions were adjusted with a 0.1 M solution of HCl or NaOH. Solutions with the desired concentrations were obtained by appropriate dilution of the initial solution (200 mg L–1) of CV dye. All solutions were prepared with deionized water.
Characterization techniques
Chemical composition. The chemical composition was determined using inductively coupled plasma spectroscopy with an ICP 5000 DV spectrometer (PG Instruments, UK).
X-ray diffraction. The powder X-ray diffraction (XRD) trace of the sample was recorded on a Philips (The Netherlands) X'pert diffractometer using Cu-Kα radiation in the range of 5–90°2θ at a scanning speed of 0.02°2θ s–1.
Fourier-transform infrared spectroscopy. The Fourier-transform infrared (FTIR) spectrum was recorded using a Shimadzu (Japan) IRAffinity-1 spectrometer in the range of 400–4000 cm–1. The samples were prepared using the KBr technique by mixing 200 mg of KBr with 1 mg of powdered clay using a pelletizer.
Thermal analysis. Thermal gravimetric analysis (TGA) and differential thermal analysis (DTA) were conducted in the temperature range of 298–1223 K using PerkinElmer (MA, USA) TGA7 and DTA7 devices.
Scanning electron microscopy. The morphological features of the KT were identified using scanning electron microscopy (SEM) with a Philips XL20 scanning electron microscope at an accelerating voltage of 20 kV. Samples were coated previously using an Edwards (UK) Auto 306 vacuum coater with carbon adhesive tabs and silver as the coating agent.
Textural properties
Textural properties were determined using N2 adsorption–desorption at 77 K with a Micromeritics (GA, USA) Tristar 3020 instrument. Before the analysis, samples were outgassed overnight at 150°C and 5.10–3 Torr. The specific surface area was calculated from the Brunauer–Emmett–Teller (BET) equation in the linear portion at 0.05–0.35 relative pressure. The micropore volume was determined using the t-plot method. The pore-size distribution was calculated from desorption data using the Barret–Joyner–Halenda (BJH) method (Li et al., Reference Li, Li, Xu, Wang, Pang and Gao2010).
The point of zero charge (pHpzc) was calculated using the pH drift method in which 0.2 g of sample was added to 0.04 L of 0.1 M NaCl solution with pH varying from 2 to 12 and then stirred for 24 h. The values of pHf – pHi against pHi were plotted (whereby pHf is the final pH and pHi is the initial pH), with the pHpzc being the pH at which pHf ‒ pHi = 0 (Feng et al., Reference Feng, Li and Shan2009). Solution pH measurements were carried out using a HI 223 pH meter (Hanna Instruments, Hungary).
Cation-exchange capacity
The CEC of the KT clay was determined using the MB spot method: 1 g of sample was added to 0.015 L of water under vigorous stirring until the sample had dispersed. Then, 0.015 L of H2O2 (3%) with 12 drops of H2SO4 (2.5 M) were added to the previous suspension. The resulting suspension was boiled for 10 min and diluted with 0.02 L of water. Next, an MB solution (3.2 g L–1) was added in 0.001 L increments. After each addition, the solution was stirred vigorously for at least 20 s using a magnetic stirrer hotplate MS7-H550-Pro (Scilogex, CT, USA). Then, a drop of the sample was removed from the end of the stirring rod. The approximate end point was obtained when a blue ring spread out from the blue spot on the filter paper. Equation 1 was used for the calculation of the CEC (meq 100 g–1; Boukhemkhem et al., Reference Boukhemkhem and Rida2017):

where V MB is the added volume of MB dye (mL) and W is the weight of the sample (g).
Acidity and basicity
The acidity and basicity of the KT were evaluated using standard Boehm titration as follows: 0.25 g of each sample was mixed with 0.05 L of aqueous reactant solution (0.01 mol L−1 HCl or NaOH). The mixtures were stirred for 24 h at a constant speed and at room temperature. Then, the suspensions were submitted to filtration and centrifugation to obtain a clean supernatant that was titrated in the presence of phenolphthalein indicator (Issa et al., Reference Issa, Al-Degs, Al-Ghouti and Olimat2014).
Adsorption experiments
Batch adsorption experiments were performed using 0.05 L dye solution for the kinetic study and by adding the KT to the CV solution (40 mg L–1) for 2 h to reach equilibrium for the parameter effect and equilibrium studies. After each experiment, the solid was recovered using centrifugation and the residual dye concentration was determined using ultraviolet–visible spectroscopy (Optizen 2120 equipment; Mecasys, Republic of Korea) fixing the λmax at 590 nm. The decolourization efficiency was calculated using Equation 2:

where C 0 (mg L–1) is the initial dye concentration and C e (mg L–1) is the dye concentration at equilibrium. The adsorption capacity at any time (t) and at equilibrium were calculated using Equations 3 and 4, respectively:


where q t (mg g–1) is the adsorption capacity at any time, q e (mg g–1) is the adsorption capacity at equilibrium, V is the solution volume (L) and m is the adsorbent dose (g L–1).
The effect of the adsorbent dosage was studied by varying the amount of KT added from 0.2 to 8.0 g L–1. The stirring speed was varied from 25 to 600 rpm, setting the CV and KT concentrations at 40 mg L–1 and 1 g L–1, respectively. The effect of the initial pH was tested in the pH range of 3–9 using an adsorbent dose of 1 g L–1. The kinetic study was performed using a KT load of 1 g L–1 with various initial concentrations (10, 20, 30 and 40 mg L–1) using 0.2 L of dye solution. The adsorption isotherms were constructed at 290, 303 and 313 K.
Results and discussion
Adsorbent characterization
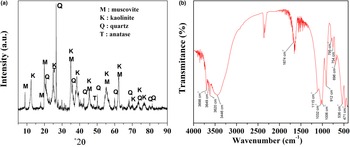
The KT is composed of mainly Si and Al (Table 1) with the presence of minor K, Fe, Na, Ti and Mg ranging between 0.2 and 1.9 wt.%. This composition agrees with the composition of kaolins (Feng et al., Reference Feng, Li and Shan2009; Konan et al., Reference Konan, Peyratout, Smith, Bonnet, Rossignol and Oyetola2009; San Cristobal et al., Reference San Cristóbal, Castelló, Martín Luengo and Vizcayno2010). Figure 1a shows the XRD trace of the KT. According to the Joint Committee on Powder Diffraction Standards (JCPDS) database, the presence of kaolinite as the main phase is observed with its characteristic peak at 12.4°2θ. Impurities such as muscovite (8.8°2θ), anatase (25.2°2θ) and quartz (26.5°2θ) were also detected. The mineralogical composition of this KT and the approximate particle-size range (both supplied by the manufacturer) are also included in Table 1. The clay consists of mostly kaolinite (76 wt.%) and minor quartz (10 wt.%) and muscovite (8 wt.%).
(a) XRD trace and (b) FTIR spectrum of the KT.

Chemical composition and textural and surface properties of the KT.

S BET = BET-specific surface area; S EXT = external specific surface area; S mic = micropore-specific surface area; V mic = micropore volume; V p = total pore volume.
Figure 1b shows the FTIR spectrum of the KT, which is characterized by the presence of bands assigned to hydroxyl groups at 3446 (OH stretching in adsorbed water), 3620, 3649 and 3698 cm‒1 (OH stretching in kaolinite). The water bending band was observed at 1674 cm–1 (Boukhemkhem et al., Reference Boukhemkhem and Rida2017). The band at 912 cm–1 is attributed to Al–OH bending in kaolinite. Bands located at 1115, 1032, 1006 and 740 cm–1 correspond to the Si–O–Si bonds characteristic of the kaolinite structure. The presence of Si–O–Al bonds is observed at 795, 754, 696, 671, 536 and 471 cm–1 (Volzone et al., Reference Volzone and Ortiga2006; San Cristóbal et al., Reference San Cristóbal, Castelló, Martín Luengo and Vizcayno2010; Hassen et al., Reference Hassen and Hameed2011; Boukhemkhem et al., Reference Boukhemkhem and Rida2017).
The TGA-DTA curves exhibit two endothermic events (Fig. 2). The first one, at 393 K, is attributed to the evaporation of hydration water with a small weight loss of ~4.0%. The second event at 793 K, which is of greater intensity, is attributed to the dehydroxylation and conversion of kaolinite into metakaolinite, with a weight loss of ~10.5%. The theoretical weight loss for pure kaolinite is 13.8% according to the following reaction: Si2Al2O5(OH)4 → Si2Al2O7 + 2H2O. This difference between these two weight-loss values is attributed to the presence of impurities, mainly quartz and muscovite (Volzone et al., Reference Volzone and Ortiga2006; Muayad et al., Reference Muayad, Hubert, Ahmed, Hani, Mohammed and Jan2015).
TGA and DTA curves for the KT.

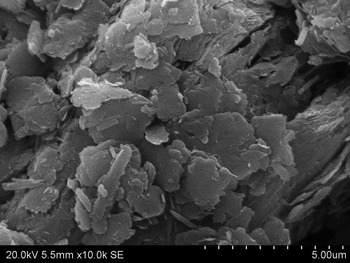
The SEM images revealed the presence of kaolinite layers forming stacked sheets of variable thickness (Fig. 3). In addition, kaolinite aggregates are also present (Boukhemkhem et al., Reference Boukhemkhem and Rida2017; Sarma et al., Reference Sarma, Gupta and Bhattacharyya2019).
SEM image of the KT.

The textural properties were determined using N2 adsorption–desorption (Fig. 4a). The isotherm belonged to type IV with a H3 hysteresis loop, which is characteristic of predominantly mesoporous materials (Thommes et al., Reference Thommes, Kaneko, Neimark, Olivier, Rodriguez-Reinoso, Rouquerol and Sing2015). This type of isotherm is typical of aggregates of plate-like particles such as clay minerals (Abraham et al., Reference Abraham, Lam, Xu, Zhang, Whadhawan and Kim2019). Moreover, the pore-size distribution is characterized by a unimodal distribution centred at 3.59 nm (Fig. 4b) belonging to the mesoporosity interval (Boukhemkhem et al., Reference Boukhemkhem, Rida, Pizarro, Molina and Rodriguez2019).
(a) N2 adsorption–desorption isotherm and (b) pore-size distribution of the KT. STP = standard temperature and pressure.

The BET surface area of the KT is 14 m2 g–1 (Table 1), which is in good agreement with previous studies on KTs (Nandi et al., Reference Nandi, Goswami, Das, Mondal and Purkait2008; Fabbri et al., Reference Fabbri, Gualtieri and Leonardi2013; Sarma et al., Reference Sarma, Gupta and Bhattacharyya2019). Furthermore, the CEC of the KT is 12 meq 100 g–1 (Table 1). This low value is mainly due to the absence of a layer charge and exchangeable cations in the interlayer space, as the KT has only external ions generated by silanol (Si–OH) and aluminol (Al–OH) groups (de Lima et al., Reference de Lima, Murad, Moyn and Stemmelen2010). The acidic–basic properties of the KT indicate its high acidity (1.70 mmol g–1), which is due to the presence of Si–OH and Al–OH groups capable of accepting or releasing protons. This acidic character was relevant as the protons can be released easily due to the high electronegativity of the oxygen atoms in comparison with the hydrogen atoms. The pHpzc of the KT was 3.1; hence, the KT holds a positive charge at pHi values lower than 3.1 and a negative charge at pHi values greater than this figure.
Adsorption study
Effects of experimental parameters. The effect of adsorbent dose on dye removal is shown in Fig. 5a. The increase of the adsorbent dose from 0.2 to 1.0 g L–1 affected CV removal significantly; it increased from 11% to 90%. This is due to increases in the number of adsorption active sites and the available surface area with increasing adsorbent dose. Doses >1 g L–1 did not affect CV adsorption, which remained almost constant, as most of CV molecules were adsorbed and very few remained in the solution (Kulkarni et al., Reference Kulkarni, Revanth, Acharya and Bhat2017). For this reason, an adsorbent dose of 1 g L–1 was used in the subsequent tests.
Effect on the decolourization efficiency of (a) the adsorbent dose (C 0 = 40 mg L–1, pHi = 5.6, stirring speed = 400 rpm, t = 290 K, V = 0.05 L, contact time = 2 h) and (b) temperature (C 0 = 40 mg L–1, adsorbent dose = 1 g L–1, pHi = 5.6, stirring speed = 400 rpm, V = 0.05 L, contact time = 2 h).

Increasing the temperature (290–313 K) had a negative effect on the adsorption of CV, which decreased from 89% to 85% (Fig. 5b). Thus, the adsorption of CV on the KT may be exothermic in nature due to the weakness of the physical bonds between the CV cations and the outer hydroxyl groups (Nandi et al., Reference Nandi, Goswami, Das, Mondal and Purkait2008).
The effect of stirring speed on CV removal is illustrated in Fig. 6a. Dye removal increased from 66% to 90% when the stirring speed increased from 25 to 400 rpm. This is due to a reduction in the film boundary layer surrounding the KT particles, leading to a significant improvement in the external film transfer and consequently in the percentage of dye removal (Geethakarthi et al., Reference Geethakarthi and Phanikumar2011). Further increases in stirring speed did not affect dye removal. Thus, 400 rpm was selected as the optimal stirring speed for the rest of the study.
Effect on the decolourization efficiency of (a) stirring speed (C 0 = 40 mg L–1, adsorbent dose = 1 g L–1 pHi = 5.6, t = 290 K, V = 0.05 L, contact time = 2 h) and (b) pHi(C 0 = 40 mg L–1, adsorbent dose = 1 g L–1, stirring speed = 400 rpm, t = 290 K, V = 0.05 L, contact time = 2 h).

The initial pH of the dye solution is very important for adsorption as it influences the dye-removal efficiency of clays, affecting the charges of both the dye molecule and the clay surface. The increase of the initial pH from 2.4 to 9.0 and especially above the pHpzc increased significantly the dye-removal efficiency from 78% to 96% (Fig. 6b). This is mainly due to an increase in the electrostatic forces between the negatively charged clay surface and the positively charged dye molecule. However, at pHi values lower than the pHpzc the dye-removal percentage decreased due to repulsive forces between the dye molecules holding a positive charge and the positively charged clay surface. Furthermore, some competition for the active sites might exist between dye molecules and protons (Hamza et al., Reference Hamza, Dammak, Bel, Eloussaief and Mourad2018). Thus, a pHi value of 9.0 was selected for the subsequent studies.
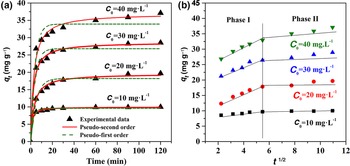
Kinetic study. The kinetic study was performed using the optimum values of the parameters studied previously. Curves representing the evolution of the adsorbed CV quantity as a function of time are illustrated in Fig. 7a.
(a) Adsorption on the KT at various initial concentrations of CV and fitting to PFO and PSO models. (b) Non-linear fitting for the adsorption of CV on the KT at various initial dye concentrations using the intra-particle diffusion model (adsorbent dose = 1 g L–1, pHi = 9.0, t = 290 K, V = 0.2 L, stirring speed = 400 rpm).

CV adsorption increased from 10 to 37 mg g–1 with increasing initial dye concentration from 10 to 40 mg L–1. The increase in the amount adsorbed at greater dye concentrations can be explained by the greater number of dye molecules in the liquid phase, which increases adsorbent–adsorbate interactions, resulting in greater adsorption. Furthermore, the adsorption is rapid during the first 5 min of the process for all concentration values due to the high level of availability of free adsorption sites at the beginning of the process. However, the progressive saturation of vacant sites decreased the adsorption rate gradually until equilibrium was reached. The experimental data shown in Fig. 7a were fitted to three well-known kinetic models: the PFO model, the PSO model (both shown in Fig. 7a) and the intra-particle diffusion model (Fig. 7b). The non-linear forms of the PFO and PSO models were chosen as the use of their linear forms has been criticized in the literature (Lin et al., Reference Lin and Wang2009; Xia et al., Reference Xia, Azaiez and Hill2018; Bujdak, Reference Bujdák2020). The equations for these three models are as follows:

where qt and q e (mg g–1) are the adsorption capacities at time t (min) and at equilibrium, respectively, and k1 (min–1) is the PFO rate constant;

where qt and q e (mg g–1) are the adsorption capacities at time t (min) and at equilibrium, respectively, and k2 (g mg–1 min–1) is the PSO rate constant; and

where qt (mg g–1) is the adsorption capacity at time t (min), kint (mg g–1 min–0.5) is the intra-particle diffusion model constant and I (mg g–1) is the intercept.
The PFO model did not describe adequately the kinetics of CV adsorption, whereas the PSO model was best able to describe the uptake of CV on the KT, as the corresponding coefficients of determination were closer to unity in comparison with those obtained from the other models (Fig. 7a & Table 2). Furthermore, a decrease in k2 values with increasing initial CV concentration was observed (Table 2). This reveals that at low initial CV concentrations the adsorption rate was important due to the high level of accessibility of the free adsorption sites for all of the dye molecules and there being no competition between the molecules (Nandi et al., Reference Nandi, Goswami, Das, Mondal and Purkait2008; Nasuha et al., Reference Nasuha and Hameed2011; Auta et al., Reference Auta and Hameed2012). Moreover, adsorption occurred on active sites located on the adsorbent surface, which could be reached easily by the adsorbate molecules. However, increasing the initial adsorbate concentration increased the competition between dye molecules, and when the most accessible adsorption sites on the adsorbent surface were occupied, the molecules diffused to the vacant sites in the pores and consequently the adsorption rate slowed down (Vishwakarma et al., Reference Vishwakarma, Tiwari, Joshi, Sharma and Bhandari2018).
Kinetic parameters of CV adsorption on the KT following various kinetic models.

The graphical representation of the intra-particle diffusion model indicates the presence of two linear regions (Fig. 7b). The first one is attributed to intra-particle diffusion and the second one is attributed to the establishment of equilibrium. The first linear trend did not pass through the origin for all of the concentrations. These results suggest that once the active sites located on the surface are saturated, dye molecules reach the active sites within the mesopores until all are saturated and equilibrium is reached.
Moreover, kint increased from 0.365 to 1.874 mg g–1 min–0.5 with the CV concentration increasing initial from 10 to 40 mg g–1. This may be ascribed to an increase in the concentration gradient, making the diffusion within pores more important. This result was also confirmed by the I values, which increased from 7.739 to 23.086 mg g–1, suggesting that the number of CV molecules increased on the boundary layer (Hamdaoui et al., Reference Hamdaoui and Naffrechoux2007). However, intra-particle diffusion was not the only limiting step in terms of the control of the rate of adsorption because external diffusion through the boundary layer also interfered with this control.
Equilibrium study. Four models were used to describe the equilibrium data obtained from the adsorption isotherm of CV on the KT: the Langmuir (Equation 8), Freundlich (Equation 9), Redlich–Peterson (Equation 10) and Langmuir–Freundlich models (Equation 11) (Amari et al., Reference Amari, Chlendi, Gannouni and Bellagi2010; Sarabadan et al., Reference Sarabadan, Bashiri and Mousavi2019b). They are used in their non-linear forms to avoid linearization errors in the determination of the regression coefficient (R 2):


where C e is the dye concentration at equilibrium (mg L–1), q e is the adsorbed quantity of CV at equilibrium (mg g–1), q m is the monolayer adsorption capacity (mg g–1), KL is the Langmuir equilibrium constant (L mg–1), KF is the Freundlich equilibrium constant ((mg g–1)⋅(mg L–1)–1/n) and n is the adsorption strength. Finally, KRP (L g–1) and αRP (L mg–1)β are the Redlich–Peterson constants, β is the Redlich–Peterson exponent (β ≤ 1), q mLF is the Langmuir–Freundlich maximum adsorption capacity (mg g–1), KLF (L mg–1) is the Langmuir–Freundlich equilibrium constant and m LF is the heterogeneity factor.
The equilibrium isotherm of CV on the KT belongs to type L, subgroup 1 (Fig. 8). The adsorption capacity at equilibrium increased with increasing initial CV concentration and reached a plateau gradually due to the high values of the initial CV concentration, possibly saturating the KT surface. The parameters of the four models used in this study are listed in Table 3.
Adsorption isotherm of CV on the KT and non-linear fitting to various models (adsorbent dose = 1 g L–1, pHi = 9.0, t = 290 K, V = 0.05 L, stirring speed = 400 rpm).

Fitting parameters using various adsorption isotherm models.

The Freundlich model showed the lowest coefficient of determination (R 2 = 0.936); hence, multilayer adsorption on a heterogeneous surface is less plausible. The Langmuir model provided the best fit for the experimental data, with the highest coefficient of determination (R 2 = 0.971) being for the monolayer adsorption capacity (q m = 44.2 mg g–1), which is very close to the experimental value obtained (q e = 41.9 mg g–1). This result was also confirmed in the Redlich–Peterson model, because the Redlich–Peterson exponent was close to unity (β = 0.941). Therefore, this model was reduced in practical terms to the Langmuir model in the range of initial CV concentrations tested. The same result was also confirmed by the Langmuir–Freundlich model, in which the heterogeneity factor was also close to unity (m LF = 1.037). Consequently, adsorption limited to a monolayer on a homogeneous surface without interactions between adsorbed molecules at the neighbouring sites can be proposed.
Thermodynamic study. To evaluate the thermodynamic parameters in terms of the adsorption of CV on the KT, various tests were carried out at three different temperatures (290, 303 and 313 K). Equations 12 and 13 were used to calculate the thermodynamic parameters (Puri et al., Reference Puri and Sumana2018):


where Kd is the distribution coefficient, which is equal to q e/C e, ΔH° is the standard enthalpy of adsorption (kJ mol–1), ΔS° is the standard entropy (J mol–1⋅ K–1), ΔG° is the Gibbs free energy of adsorption (kJ mol–1), T is the absolute temperature (K) and R is the universal ideal gas constant (J K–1 mol–1).
The calculated values of these parameters are reported in Table 4. The negative value of ΔH° indicates that the adsorption was exothermic due to the electrostatic forces between the electronic pairs on the silanol and aluminol groups and the positively charged molecules of the CV dye. In addition, the negative value of ΔG° suggests that the adsorption is spontaneous at the three temperatures tested. However, an increase in temperature led to an increase in ΔG° values, indicating that the adsorption was less favourable at greater temperatures. This suggests that weak forces govern the bond between the dye molecules and the electronic pairs of the hydroxyl groups, as was also confirmed by the low ΔH° value (<80 kJ mol–1) and the ΔG° values ranging from 0 to –20 kJ mol–1 (Auta et al., Reference Auta and Hameed2012).
Thermodynamic parameters for the adsorption of CV onto the KT.

Comparison with other adsorbents
The maximum adsorption capacity values of CV onto various adsorbents are listed in Table 5. The adsorption capacity of the KT was greater than those obtained from other raw and modified clay minerals reported in the literature (e.g. Monsah et al., Reference Monash, Niwas and Pugazhenthi2011; Sargin et al., Reference Sargin and Unlu2013; Miyah et al., Reference Miyah, Lahrichi, Idrissi, Boujraf, Taouda and Zerrouq2017). This can be attributed not only to the textural and structural properties of the KT, but also to its mineralogical composition. However, the efficiency of the KT remains lower than that reached by an undefined smectite (Hamza et al., Reference Hamza, Dammak, Bel, Eloussaief and Mourad2018) and montmorillonite (Sharma et al., Reference Sharma, Borah, Das and Das2015) due to the lower CEC of the KT in comparison with those clay minerals. Therefore, the KT can be considered suitable for CV dye removal due to its low cost and great availability.
Maximum monolayer adsorption capacities of CV onto various adsorbents.

Conclusions
We used a natural KT as an adsorbent for the removal of CV dye from aqueous solutions. This clay is characterized by a small specific surface area and low CEC. Nevertheless, it showed significant adsorption capacity due to its acidic and basic properties, which can be attributed to the presence of aluminol groups. Increasing the adsorbent dose, the initial pH and the stirring speed led to increases in the amount of adsorbed CV. However, increasing the temperature led to a decrease in the adsorption capacity, indicating the exothermic nature of this process. The adsorption was well described by the PSO model and the adsorption rate is controlled by external and intra-particle diffusion. Furthermore, the equilibrium study confirmed that adsorption was limited to a monolayer, as the adsorption isotherm is best described by the Langmuir model. The thermodynamic study confirmed the exothermic and the physical nature of the CV adsorption, which was favoured at lower temperatures. Weak forces bonded the dye molecules to the electronic pairs of the hydroxyl groups, low ΔH° values (<80 kJ mol–1) were obtained and the ΔG° values ranged from 0 to –20 kJ mol–1. This study highlighted that this KT can be used as a low-cost and efficient adsorbent for the removal of CV dye. Additional research using other cationic dyes should be performed to evaluate the efficiency of this KT as an adsorbent. Furthermore, it would be interesting to test the efficiency of the adsorbent in a multicomponent system containing two or more dyes. Moreover, it is recommended that this study is cross-validated using non-linear equations to avoid systematic errors due to linearization.
Financial support
The authors were supported by the Spanish State Research Agency through the project PID2019-106186RBI00/AEI/10.13039/50110001103 and by the Ministère Algérien de l'Enseignement Supérieur et de la Recherche Scientifique.