I. INTRODUCTION
Metals and metal alloys are commonly used as biomaterials. It has been shown that it is important to control their surface properties, such as corrosion resistance, biocompatibility, mechanical resistance, and fatigue resistance. The most commonly used metals for orthopedic applications are titanium and titanium alloys such as Ti6Al4V since they have high mechanical resistance, high corrosion resistance, and good biocompatibility. Reference Huang, Hsu and Yu1 In biomedical applications, surface treatment processes and texturing, Reference Van, Rodriguez, Low, Elmouelhi, Lowenhaupt, Natarajan, Lim, Prajapati, Vyakarnam and Cooper2 such as electropolishing Reference Nazneen, Galvin, Arrigan, Thompson, Benvenuto and Herzog3–Reference Drensler, Neelakantan, Somsen, Eggeler and Hassel6 or anodisation, Reference Hao, Li, Han, Hao and Ai7–Reference Xie and Luan11 have been proposed to control the roughness and wettability with the aim of enhancing the bone–implant osseointegration process.
The use of nanostructured biomaterials in bone regeneration is inspired by the native bone architecture, Reference Landis and Silver12 and nanostructure has been suggested to further increase the biomimicry and bioactivity of materials. Reference Tomsia, Lee, Wegst and Saiz13,Reference Gao, Zhuang, Li, Shuai and Peng14 Many studies have shown that nanostructured biomaterials promote the process of bone regeneration by supporting cell adhesion, spreading, proliferation, and differentiation. Reference Martinez, Engel, Planell and Samitier15,Reference Lord, Foss and Besenbacher16 The interactions between stem cells and nanostructured materials are of utmost importance in designing and fabricating novel biomaterials that can guide cell behaviors in a desirable way. Stem cells can have strong interactions with nanostructured biomaterials, and nanostructures can be tailored to guide and enhance cell function. Reference Wang, Zhao, Liu, Weir, Zhou and Xu17
A previous study reported that nanostructured surfaces of titanium had significant effects on cell differentiation. Reference Zhao, Liu, Wu, Zhang and Chu18 In addition, nanotopography can stimulate mesenchymal stem cell differentiation in the absence of osteogenic supplements. Reference Liao, Nguyen, Ngiam, Wang, Cheng, Chan and Ramakrishna19–Reference Polini, Pisignano, Parodi, Quarto and Scaglione21 The large surface area and nanostructure of the material can provide more binding sites for cell receptors and aid the adsorption and retention of circulating osteogenic factors, which contribute to osteogenesis. Reference Koegler, Clayton, Thissen, Santos and Kingshott22,Reference Fricain, Schlaubitz, Le Visage, Arnault, Derkaoui, Siadous, Catros, Lalande, Bareille, Renard, Fabre, Cornet, Durand, Léonard, Sahraoui, Letourneur and Amédéd23 Properties such as nanoscale roughness and nanotopography can induce changes in cell membrane receptors and activate specific mechanotransduction pathways that direct the cell fate in favor of osteogenesis. Reference Nikukar, Reid, Tsimbouri, Riehle, Curtis and Dalby24,Reference Mendonca, Mendonca, Simoes, Araújo, Leite, Duarte, Aragão and Cooper25
Marini et al. (2015) Reference Marini, Luzi, Fabbri, Ciuffi, Sorace, Tognarini, Galli, Zonefrati, Sbaiz and Brandi26 studied the ability of nanostructured surfaces of Ti6Al4V and Ti13Nb13Zr to favor the growth and adhesion of human amniotic mesenchymal stem cells (hAMSCs) as well as maintaining their osteogenic differentiation. The results showed that the nanostructured surfaces of both Ti6Al4V and Ti13Nb13Zr demonstrated better osteoconductive properties than surfaces without nanostructures.
Tognarini et al. (2008) Reference Tognarini, Sorace, Zonefrati, Galli, Gozzini, Carbonell, Thyrion, Carossino, Tanini, Mavilia, Azzari, Sbaiz, Facchini, Capanna and Brandi27 demonstrated that adipose-derived mesenchymal stem cells (AMSCs) possess the same ability to differentiate into the osteoblastic lineage and to produce bone matrix as bone-marrow-derived stem cells (BMDSCs) and that smooth Ti6Al4V surfaces exhibit an osteoconductive action toward AMSCs, allowing their differentiation into functional osteoblasts and sustaining bone matrix synthesis and calcification. Gittens et al. (2012) Reference Gittens, Olivares-Navarrete, McLachlan, Cai, Hyzy, Schneider, Schwartz, Sandhage and Boyn28 showed that the osteogenic properties of nanostructured Ti6Al4V are strongly associated with the different stages of osteogenic differentiation, with human primary osteoblasts being able to recognise the nanostructured surface and respond to it with active osteoblast functionality, even in the absence of osteogenic factors within the medium. However, osteoblast differentiation of preosteoblastic mesenchymal stem cells (MSCs) was not induced solely by the presence of nanostructures.
Electrochemical treatments have been developed to form a micro-nano-porous titania layer. Cells on the nano-network-and micro/nano-network-structured surfaces displayed more filopodia extensions, indicating much better adhesion and spreading compared with cells on a blank surface of a titanium sample. Reference Jiang, Liang and Lin29 A study of human bone marrow osteoblasts on a titanium alloy (Ti6Al4V) polished with different particle sizes suggested that osteogenic cells can sense changes in roughness of around 0.60 μm. Reference Deligianni, Katsala, Ladas, Sotiropoulou, Amedee and Missirlis30 Zhu et al. (2004) Reference Zhu, Chen, Scheideler, Altebaeumer, Geis-Gerstorfer and Kern31 observed that osteoblast growth on titanium surfaces with micrometric roughness presented more cytoplasmic extensions compared with surfaces with sub-micrometric roughness. Under certain physiological or experimental conditions, they can be induced to become tissue- or organ-specific cells with special functions. Based on where in the body or what stage of development they are derived from, stem cells are classified as embryonic, fetal, or adult stem cells. Reference Takahashi and Yamanaka32 Progenitor cells specific to certain germ line lineages can be derived from embryonic stem cells such as mesenchymal progenitors. Chou et al. (1995) Reference Chou, Firth, Uitto and Brunette33 discovered that on a rougher micrometric-scaled surface, the cells acquired a more elongated and polarised morphology; this kind of cell behavior normally favors protein synthesis, adhesion, proliferation, and differentiation.
Based on the knowledge that bone-forming cells derive from stem cells residing in the bone marrow, Reference Bab, Passi-Even, Gazit, Sekeles, Ashton, Peylan-Ramu, Ziv and Uimansky34 human MSCs (hMSCs) have historically been the main source of cells for bone engineering applications. hMSCs are multipotent stem cells which not only have the potential to differentiate toward the mesodermal lineages, including the adipogenic, chondrogenic, and osteogenic lineages, but can also trans-differentiate toward tissues representative of other embryonic germ layers. Reference Pittenger, Mackay, Beck, Jaiswal, Douglas, Mosca, Moorman, Simonetti, Craiq and Marshak35
Mamalis et al. (2013) Reference Mamalis and Silvestros36 showed that hMSCs were sensitive to titanium surface modifications, and cell attachment and proliferation were key determinants of biocompatibility as they dictated cell survival and growth prior to matrix deposition during bone healing. Peri-implant bone formation depends on the ability of stem cells to colonise the implant surface and differentiate it into osteoblasts. hMSCs undergo osteoblastic differentiation on microstructured titanium surfaces in the absence of exogenous factors, but the mechanisms are unknown. Olivares-Navarrete et al. (2011) Reference Olivares-Navarrete, Hyzy, Park, Dunn, Haithcock, Wasilewski, Boyan and Schwartz37 indicated that surface properties regulate the stem cell fate and induce osteoblast differentiation.
In addition, studies using osteoblast cell culture have shown that these cells exhibit a more differentiated phenotype when grown on titanium substrates in comparison with tissue culture polystyrene, reflecting differences in surface properties. Reference Zhao, Raines, Wieland, Schwartz and Boyan38,Reference Yang, Tian, Deng and Ong39
This study aims to investigate the effect of surface treatments of Ti6Al4V on the cell differentiation of human embryonic stem cell-derived mesenchymal progenitors (hESC-MPs) (Y10090/MPC-301-VIAL, Cellartis® hES-MP 002.5) in osteogenic media.
II. MATERIALS AND METHODS
A. Electropolishing procedure
Titanium alloy (Ti6Al4V) disks with an exposed area of approximately 1.77 cm2 and a thickness of 2 mm were used as a substrate. The evaluated samples were either only manually polished or electropolished for either 4 or 12 min. All samples were initially manually polished by abrading the samples using silicon carbide sandpapers down to grit size 4000. Samples for electropolishing were washed in water using an ultrasonic bath and dried with cold air. They were then electropolished in a concentrated acidic solution electrolyte consisting of sulfuric acid, hydrofluoric acid, and glycerine in a 6:3:1 (v/v) ratio using a power source (MPC-303DI, Minipa São Paulo, Brazil) with platinum as the cathode and the sample as the anode. Electropolishing was carried out for either 4 or 12 min at 25 V and at 7 ± 0.5 °C with mechanical stirring at 100 rpm. The choice of electropolishing parameters was based on a study of titanium surfaces by Antonini (2012), Reference Antonini40 which showed that longer electropolishing times favor oxide formation while shorter ones and an electrolyte temperature of around 7 °C favor nanostructured oxide formation. Sulka et al. (2006) Reference Sulka and Parkola41 studied the influence of the anodising potential on well-ordered nanostructures of aluminum in sulfuric acid and observed that an anodising potential of 25 V resulted in an excellent nanopore structure with a regular interpore distance and pore diameter.
After the electrochemical process, the electropolished samples were washed again in an ultrasonic bath for 10 min.
B. Roughness and wettability analysis
The nanometric morphology and roughness were assessed by atomic force microscopy (AFM) Reference Kutes, Vyas and Huey42 using a Shimadzu SPM-9500J3 microscope (Shimadzu Corp., Kyoto, Japan), while the micrometric roughness was evaluated using a GT-K profilometer (Bruker, Billerica, Massachusetts). The nanometric and micrometric roughnesses were determined by measuring R a (average surface roughness) and R z (the vertical distance between the highest peak and the deepest valley within a sampling length).
The surface wettability was determined by the sessile drop method using an apparatus developed by the Corrosion Research Laboratory at the Federal University of Rio Grande do Sul (UFRGS). With this equipment, it was possible to determine the contact angle between a drop of Dulbecco’s Modified Eagle Medium (DMEM; Sigma-Aldrich Co. LLC, São Paulo, Brazil) and the analyzed substrate. The contact angle was determined by image analyses using SURFTENS 4.5 software (OEG, Frankfurt, Germany).
C. X-ray photoelectron spectrometry (XPS)
XPS analyses were performed to investigate the presence of oxides on the surface of electropolished samples using an XPS AXIS Ultra (Kratos, Kanagawa, Japan). The measurement was carried out using Al Kα radiation (1486.6 eV). The emitted photoelectrons were detected using a hemispherical analyser and a spatial resolution of 15 µm. The vacuum system was maintained at approximately 10−7 Pa during all the experiments. Survey scans were collected from 0 to 1200 eV with a pass energy of 160 eV and step size of 1 eV; the specific element’s pass energy was fixed at 40 eV. The angle of incidence of the beam was 45° and the take-off angle was 90°, orthogonal to the plane of the samples. The element’s energy position was corrected using Ag energy as a reference, obtained using a pure Ag sample. The deconvolution of the XPS spectra was done using Casa XPS software considering a nonlinear least squares fitting. Before deconvolution, a Shirley-type background subtraction was carried out.
D. Cell culture
Human embryonic stem cell-derived mesenchymal progenitors (hES-MPs; Cellartis, Gothenburg, Sweden), were used for all cell culture experiments. Cells were cultured at 37 °C with 5% CO2 in basal media (BM) containing minimum essential alpha medium, 10% fetal bovine serum, 2 mM L-glutamine, and 100 mg/mL penicillin/streptomycin in gelatine-coated T75 flasks. During passage, BM was supplemented with a 4 ng/mL human fibroblastic growth factor (Life Technologies, Carlsbad, California). To induce osteoblastic differentiation, the osteogenesis induction media (OIM) consisting of BM supplemented with ascorbic acid (50 µg/mL), beta-glycerolphosphate (5 mM), and dexamethasone (100 nM) was added 24 h after seeding.
Prior to cell culture, all samples were sterilised by immersion in 70% ethanol and orbital shaking at 200 rpm for 3 h. After sterilisation, the samples were washed three times with Phosphate-buffered saline (PBS), with orbital shaking at 200 rpm for 20 min for each wash. Samples were seeded at 15,000 cells per sample at a density of 250,000 cells/mL and were allowed to attach onto the surface for 45 min before the disc was submerged in 2 mL of BM and incubated overnight. On day 1, samples were transferred to a new well plate, and 2 mL of OIM was added to the selected samples. The medium was changed every 2–3 days.
To assess the suitability of the Ti6Al4V samples for cell culture, resazurin reduction (RR) assays were performed. The fluorescence is measured using a microplate reader and is correlated with cell viability. Reference O’Brien, Wilson, Orton and Pognan43 One millimole of resazurin sodium salt in distilled water (dH2O) was diluted in BM (10 vol%) to create an RR solution. The medium was removed from the samples and was replaced with 2 mL of RR solution. Well plates were wrapped in foil and incubated for 4 h at 37 °C. Then, 200 µL of the reduced solution was added to a 96-well plate in triplicate and measured using a spectrofluorometer at λex: 540 nm, λem: 590 nm in a spectrophotometer (Infinite F200 Pro, TESCAN, Männedorf, Switzerland).
E. Alkaline phosphatase activity
Alkaline phosphatase (ALP) activity is considered to reflect osteoblastic differentiation and plays a major role in bone formation and mineralisation. Reference Laitinen, Halttunen, Jortikka, Teronen, Sorsa and Lindholm44–Reference Hoemann, El-Gabalawy and McKee46 Culture medium was removed from the samples, and they were washed twice in PBS. Discs were then transferred to 50 mL tubes and submerged in 2 mL of a cell digestion buffer {10 v/v% cell assay buffer [1.5 M Tris-HCl, 1 mM ZnCl2, 1 mM MgCl2 in deionised water (diH2O), and 1% Triton-X100 in diH2O]} and were incubated for 30 min. Samples were then vortexed briefly and stored overnight at 4 °C. The lysates then underwent a freeze–thaw cycle three times (−80 °C for 10 min, 37 °C for 15 min) before being vortexed for 15 s per sample.
Twenty microlitres of the lysate was combined with 180 µL of the pNPP phosphatase substrate (Thermo Scientific, Waltham, Massachusetts), added to a 96-well plate, and then incubated at 37 °C until a slight color change from colourless to yellow was observed. The absorbance was then measured using a plate reader at a wave length of 405 nm every minute for 30 min. The ALP activity is expressed as nanomoles of p-nitrophenol per minute (nmol pNP/min), assuming that one absorbance value equals 19.75 nmol of the product. This activity is normalised to the amount of DNA in the lysate and is expressed as nanomoles of para-nitrophenol/minutes/fluorescence unit (nmol pNP/min/FU). DNA was quantified using a Quant-iT high-sensitivity double-stranded DNA (dsDNA) assay kit according to the manufacturer’s instructions (ThermoFischer, Waltham, Massachusetts). Briefly, the Quant-iT® reagent was diluted to 1:200 in the Quant-iT® assay buffer to create a working solution. Next, 90 µL of the working solution was added in triplicate to a black 96-well plate, and 10 µL of the lysate was then added. The well plate was then shaken for 15 s with a linear amplitude of 1 mm, left for 10 min at room temperature to allow the DNA and reagent to conjugate, and shaken again before the fluorescence was measured (λex: 485 nm, λem: 535 nm). Shaking and fluorescence were measured using a plate reader (Tecan Infinite 200 Pro, TECAN, Männedorf, Switzerland).
F. Cell spreading and morphology
To examine the effects of the Ti6Al4V surface on cell spreading and morphology, cells attached on the samples that had been mechanically polished and electropolished for 4 or 12 min were observed using scanning electron microscopy (SEM; MIRA3, TESCAN, Brno, Czech Republic, operating at 10 and 15 kV). The samples were routinely prepared, dehydrated, and finally dried in a critical-point dryer.
G. Statistical analysis
All statistical analysis was undertaken in GraphPad Prism (version 7.00; GraphPad Software, Inc., San Diego, California). One sample per system was used for structural characterization, and three samples per system were used for morphologic characterization and wettability. The cell growth and cell differentiation were evaluated using six samples per system. Depending on whether a response was affected by one or two factors, either one-way or two-way ANOVA with a Tukey’s post-test was used to evaluate significant differences. Differences were considered significant at P < 0.05. All graphs are presented as a mean ± standard deviation, and notable significant differences are indicated on the graphs or in the legends.
III. RESULTS AND DISCUSSION
A. Structural characterisation of the samples
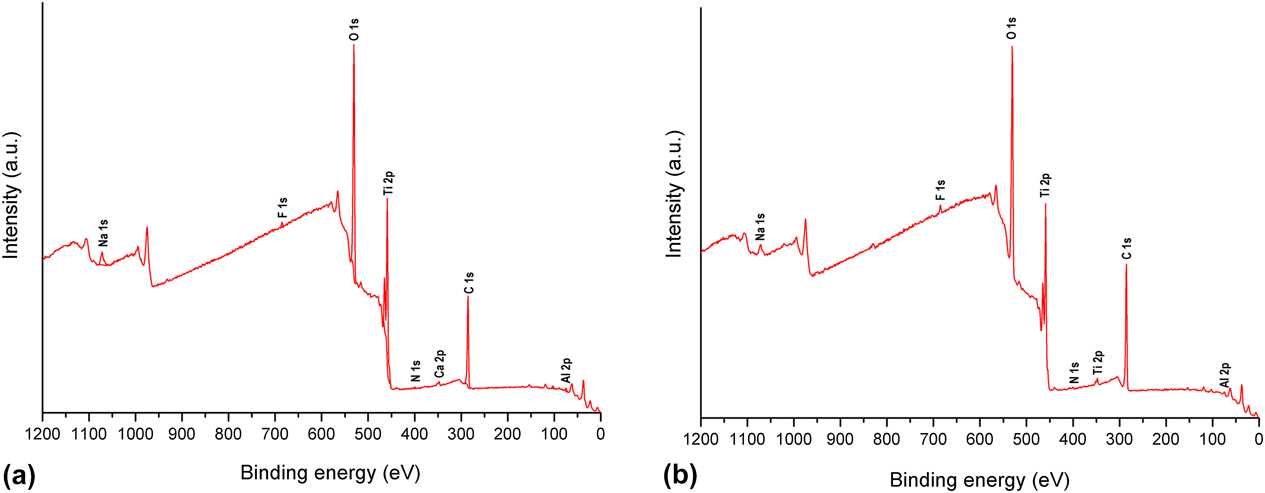
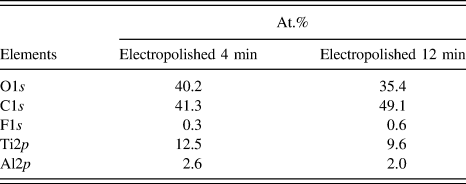
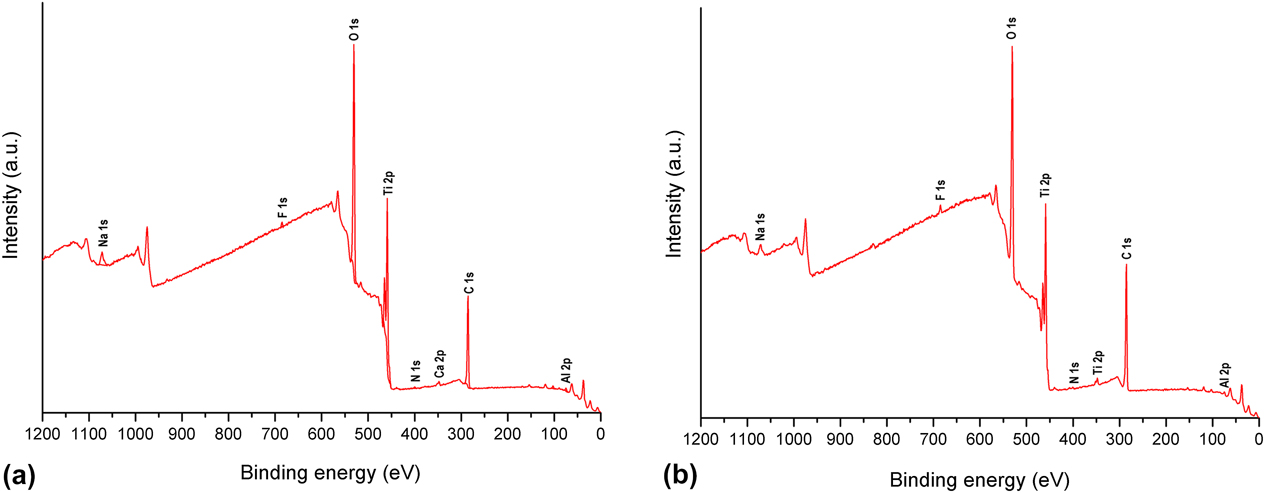
From the XPS results, it was possible to identify the oxygen elements (O1s) on the surface of the samples that had been electropolished for 4 min [Fig. 1(a)] and 12 min [Fig. 1(b)]. This indicates that oxide formation occurs during electrochemical treatment for both electropolishing times. There was a greater percentage of atomic oxygen on samples electropolished for 4 min than on those electropolished for 12 min (Table I). This can be directly attributed to the greater content of atomic titanium available on the surface, which means that more titanium can react with oxygen.
XPS survey using Al Kα photoelectron spectra of the samples electropolished for (a) 4 min and (b) 12 min at 25 V and 7 °C. Data are given from n = 1 and statistical significant differences at P < 0.05.
Atomic percentage of elements from XPS results.

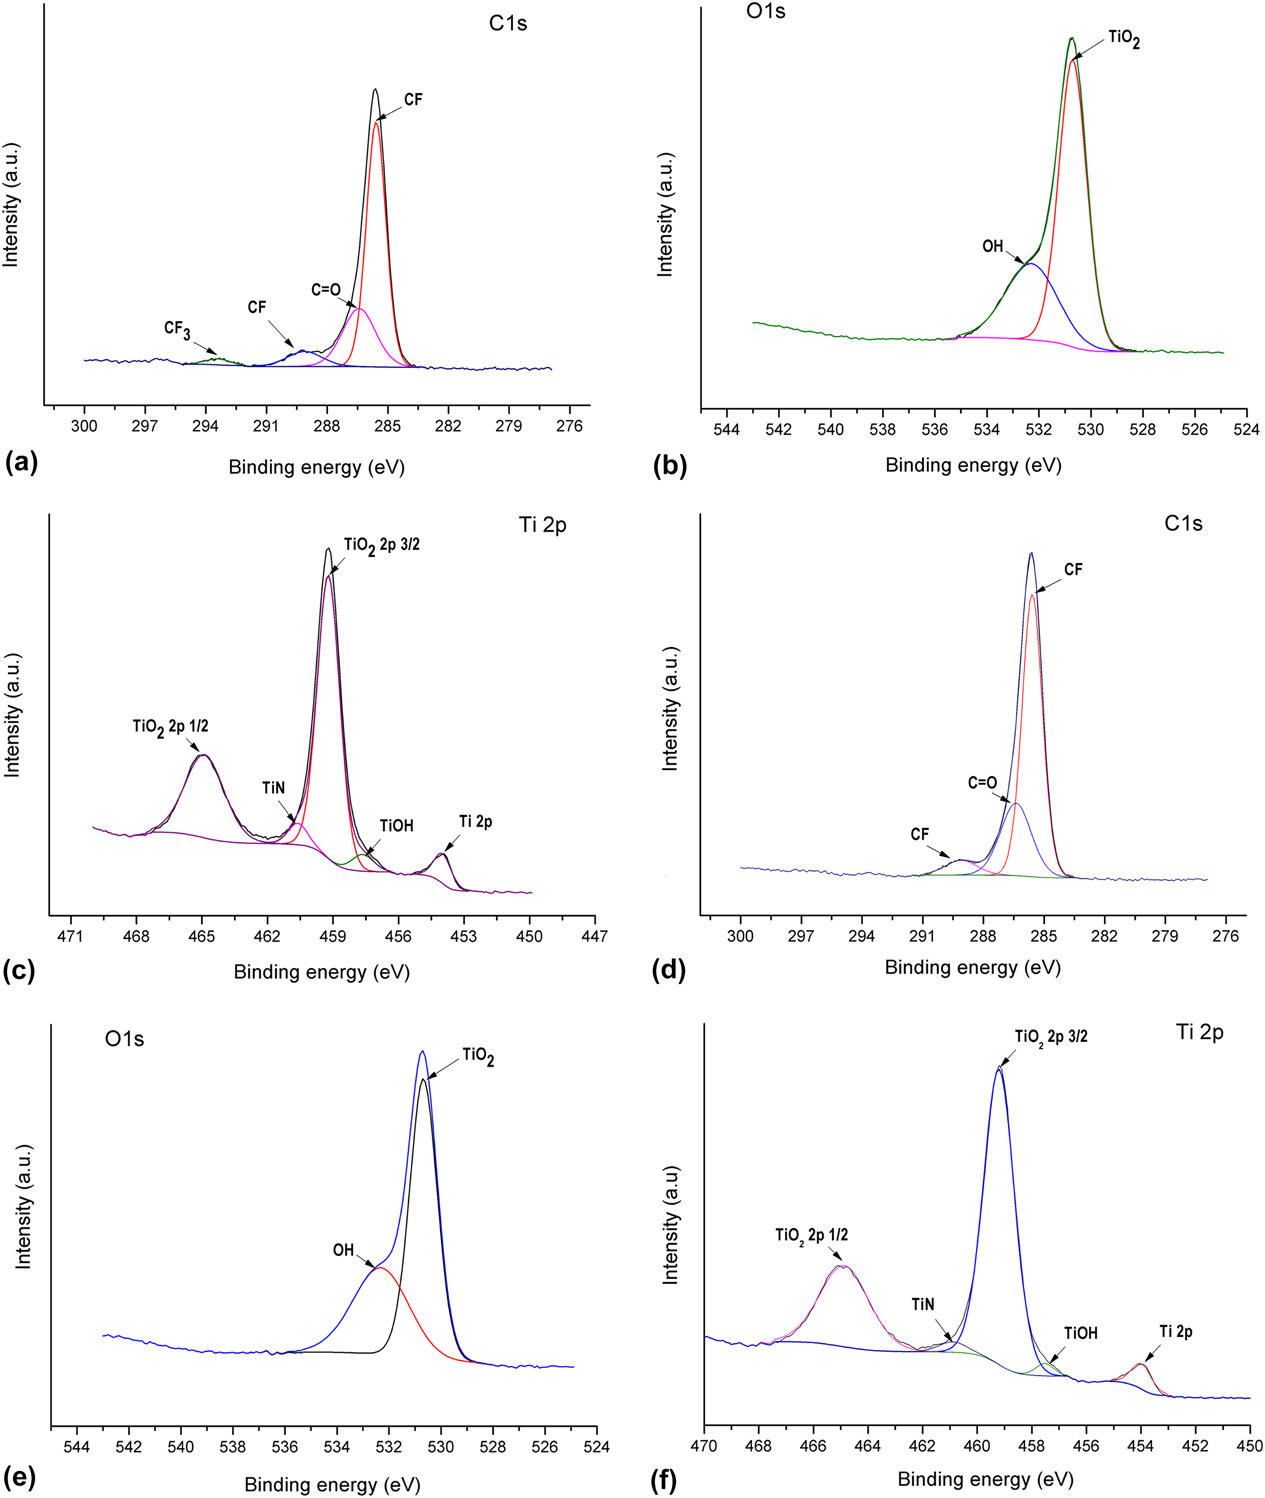
The samples electropolished for 12 min showed a greater atomic percentage of carbon C1s (Table I). The greater content of carbon can be attributed to the greater content of fluoride (F1s). The direct relationship between the amounts of carbon and fluoride is associated with C–F bonds, as seen in Fig. 2(d). C1s and F1s were identified in the XPS spectra of both electropolished samples; the presence of these elements can be associated with the electrolyte used for the electrochemical treatment, which included glycerine and hydrofluoric acid.
High-resolution XPS spectra of the C1s, O1s, and Ti2p peaks of the samples electropolished for 4 min: (a) C1s, (b) O1s, (c) Ti2p peaks; and electropolished for 12 min: (d) C1s, (e) O1s, and (f) Ti2p peaks, at 25 V and 7 °C. Data are given from n = 1 and statistical significant differences at P < 0.05.
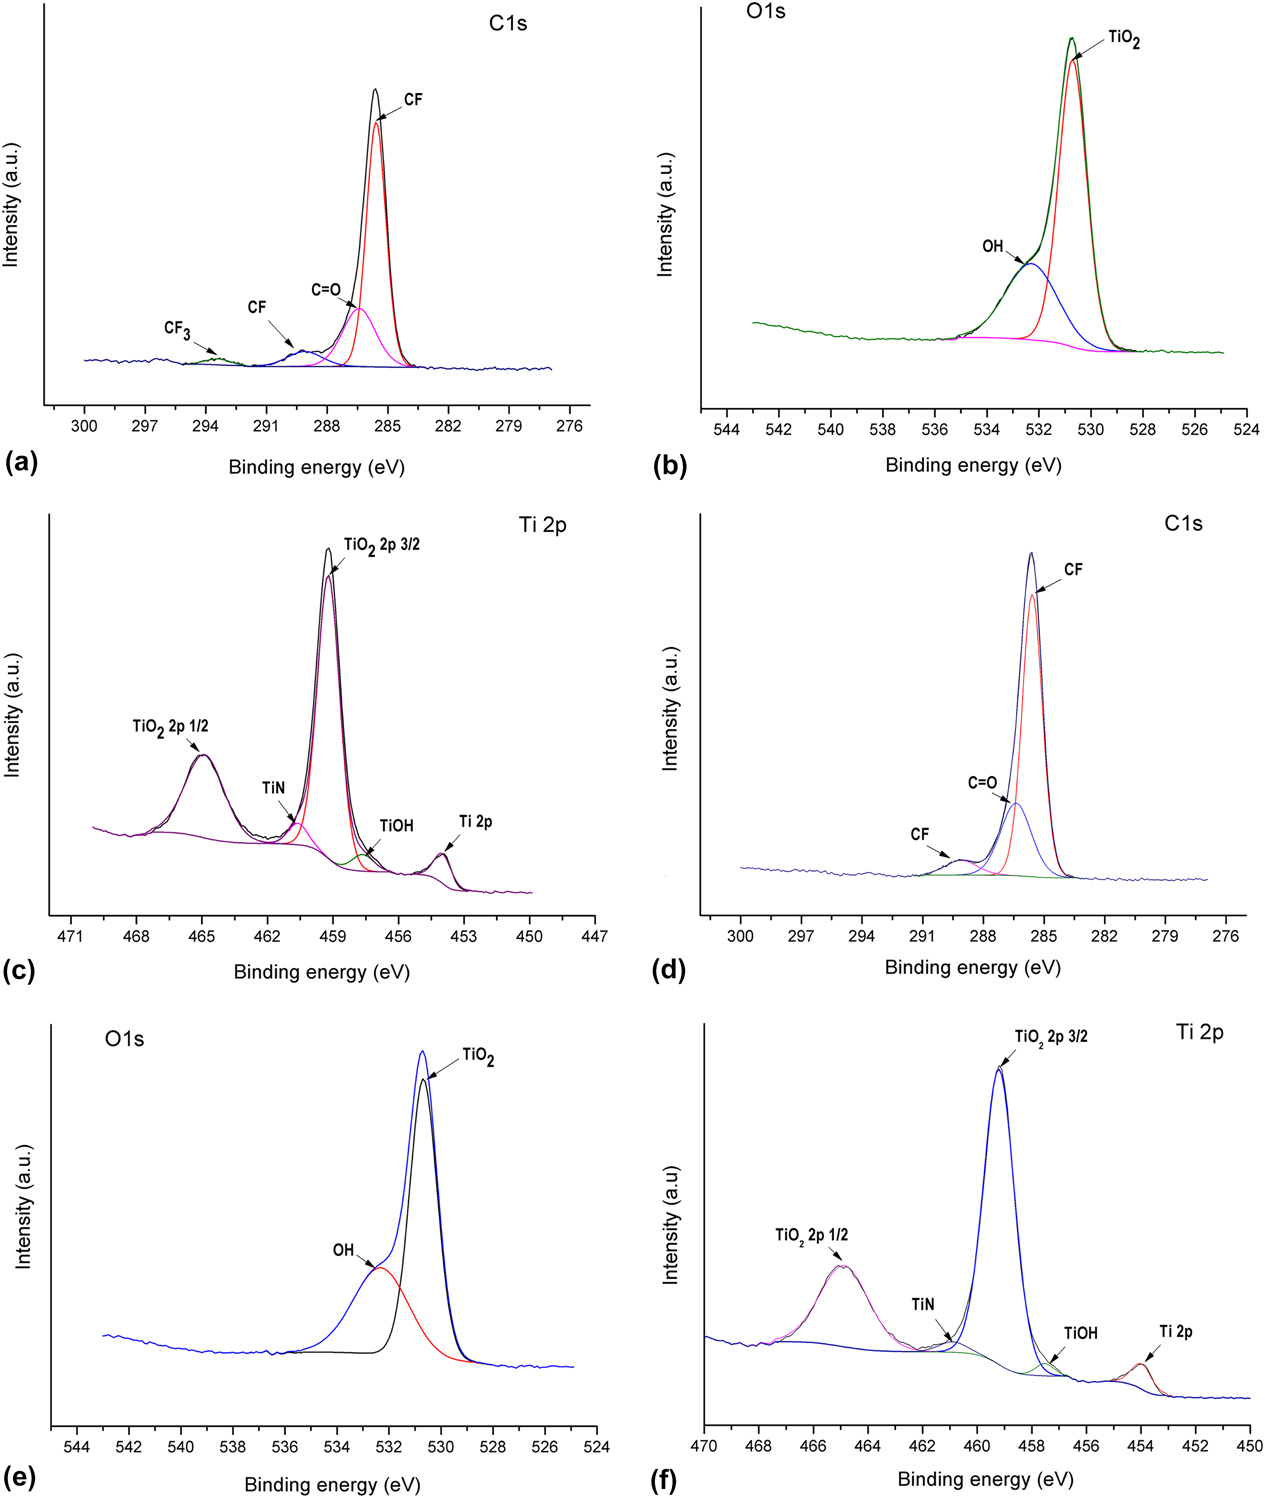
There was a CF3 peak at 292.8 eV for samples electropolished for 4 min, while this peak did not appear in samples electropolished for 12 min [Fig. 2(d)]. This can be attributed to the anodic dissolution process that prevailed on the sample electropolished for 4 min. As a consequence, more Ti2p was available on the surface to complex with F− ions, producing [TiF6]−, which is very soluble in water, as shown by Albu et al. (2008). Reference Albu, Ghicov, Aldabergenova, Drechsel, LeClere, Thompson, Macak and Schmuki47 The titanium ion, which is more electropositive than fluorine, reacts with the oxygen of glycerine, leaving free fluoride to make a bond with carbon, which forms CF3. Bismarck et al. (1997) Reference Bismarck, Tahhan, Springer, Schulz, Klapötke, Zell and Michaeli48 undertook a study of HF in contact with carbon and, through XPS analysis, identified a CF peak in the C1s spectrum at 285.5 eV and another peak as CF3 at 292.8 eV.
Cai et al. (2006) Reference Cai, Bossert and Jandt49 identified Ti2p 1 and Ti2p 3 peaks between 400 and 500 eV and titanium oxide near 531 eV in the XPS spectrum of Ti2p. Peaks of carbon as carbonate (C=O) were also identified at 288.9 eV. Winkelmann et al. (2003) Reference Winkelmann, Gold, Hauert, Kasemo, Spencer, Brunette and Textor50 suggest that contamination of the surface with carbon can be associated with exposure to air. Besides, as shown by Rouxhet et al. (2011), Reference Rouxhet and Genet51 the presence of traces of carbon on the surface can be connected with the decomposition of organic compounds. They associated a peak at 289 eV with the presence of O–C=O, C–(C,H), or C=O groups. In this way, the presence of carbon traces on the electropolished Ti6Al4V surface could also be associated with the glycerine decomposition.
Cui et al. (2012) Reference Cui, Park, Lee, Jung, Lee, Lee, Kim, Chung and Kim52 evaluated the effect of the surface characteristics of the Ti–8Ta–3Nb alloy compared with Ti–S and Ti–6Al–4V alloys on the osteoblastic response, and XPS analysis was undertaken on all samples, identifying TiO2 on the surface. The titanium dioxide surfaces had two hydroxide groups: an acidic hydroxide group (531.1 eV, TiOH) and a basic hydroxide group (532.4 eV, TiOH); similar TiOH groups can be seen on the surface of samples electropolished for 4 min [Fig. 2(c)] and 12 min [Fig. 2(f)].
B. Morphology and wettability
In the electropolishing mechanisms, reactions called anodic leveling occur at the anode surface. The dissolution rate at valleys and peaks during electropolishing is dependent on the current distribution or on the mass transport conditions, leading to anodic leveling of the surface. During the longer electropolishing treatment, dense oxide formation prevailed in relation to the anodic dissolution process. Reference Lin and Hu53 From the XPS results, it was possible to observe that oxide formation occurs during the electrochemical treatment for both electropolishing times [Figs. 1(a) and 1(b)].
Mechanical polishing is the smoothing of a surface using mechanical tools and abrasives. Mechanical polishing is performed in steps with progressively finer abrasives until the desired smoothness is achieved. The polishing process removes material and plastical deforms in the surface while altering the macroscopic and microscopic surface texture.
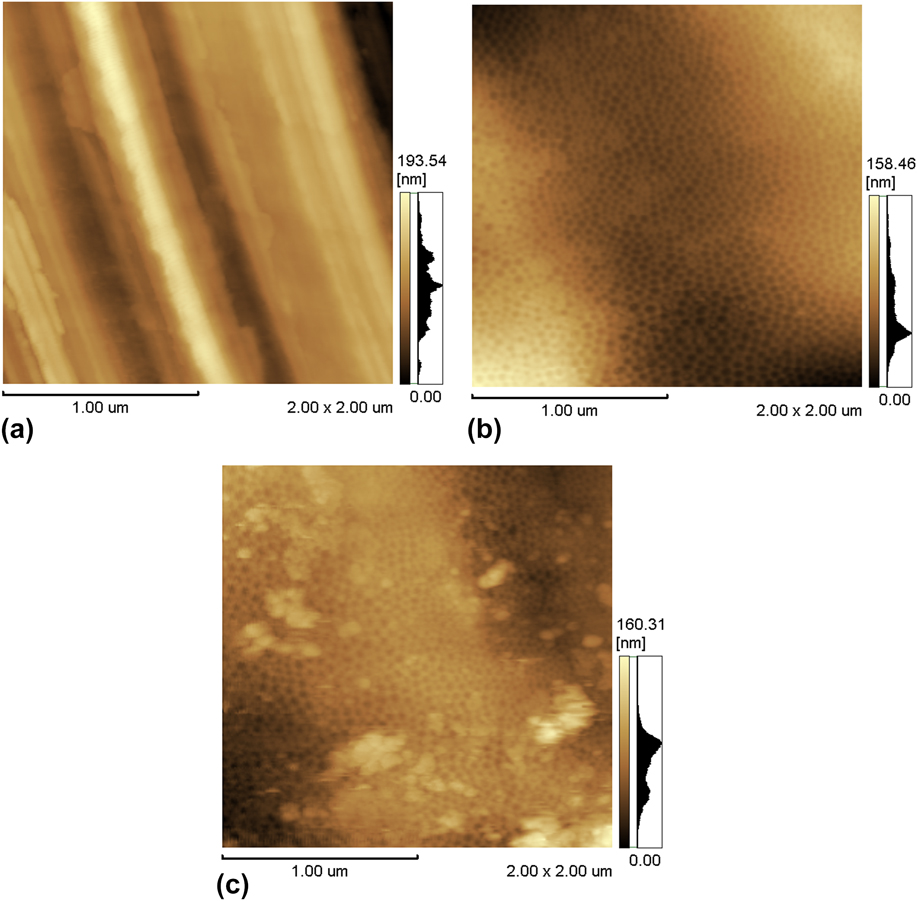
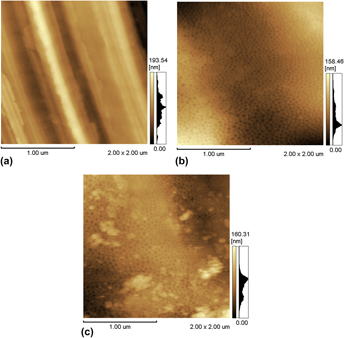
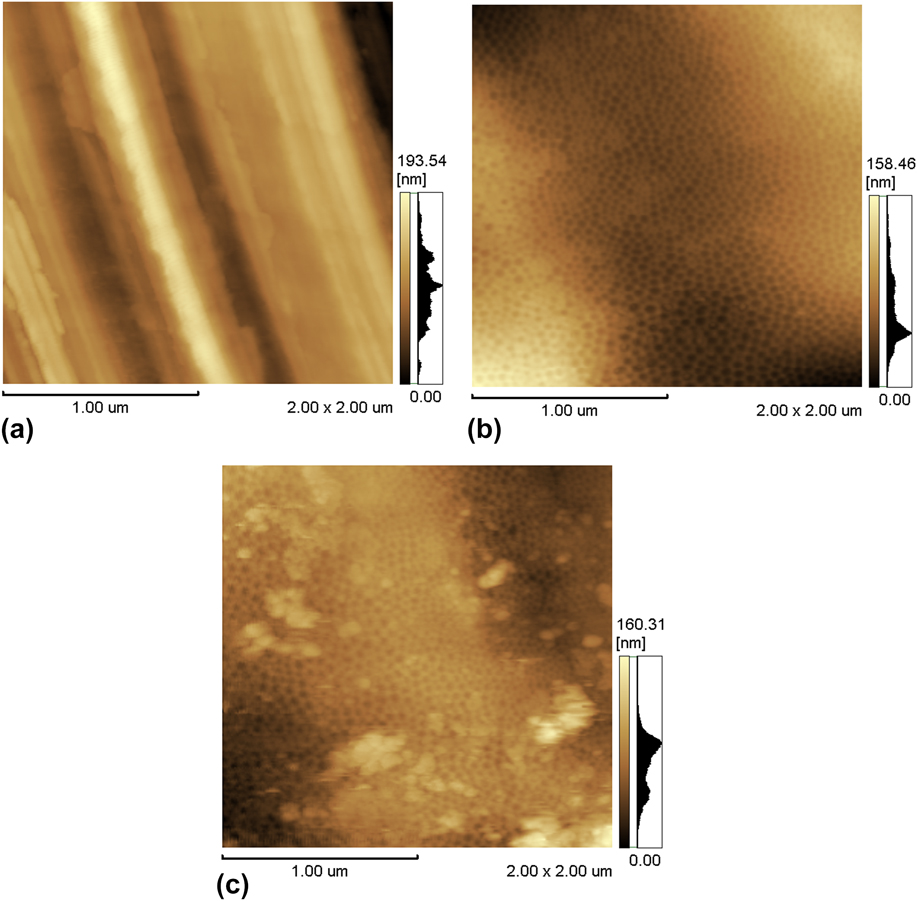
The samples electropolished for 4 or 12 min exhibited the formation of a nanostructured surface [Figs. 3(b) and 3(c)]. However, on the samples electropolished for 12 min, it was also possible to observe a nanostructured surface covered in some regions by a thick, discontinuous, and disordered oxide layer [Fig. 3(c)]. The nanostructured surface observed on both samples was formed because the anodic dissolution (typical of electropolishing processes) was more intense than the dense oxide formation.
2D AFM images of the samples used for the growth of hES-MPs in the osteogenic media, representative of triplicate samples: (a) mechanically polished sample, (b) sample electropolished for 4 min, and (c) sample electropolished for 12 min. Data are given from n = 3 and statistical significant differences at P < 0.05.
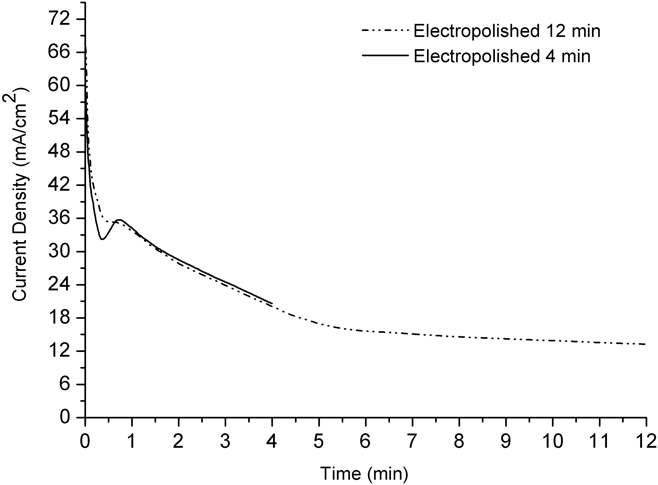
The transient of the current density (Fig. 4) for the sample electropolished for 12 min reaches a plateau after 6 min of electrochemical treatment, indicating that oxide formation or a greater atomic percentage of C1s (Table I) on the surface contributes to a decrease in current density as a consequence of increased resistance on the surface.
Transients of current density of the Ti6Al4V electropolished for 4 and 12 min. Data are given from n = 3 and statistical significant differences at P < 0.05.

Table II shows the nanometric and micrometric roughness values of the studied samples. No important difference between the micrometric roughness values of the samples electropolished for 4 min (0.4 ± 0.001 µm) or 12 min (0.5 ± 0.01 µm) and the mechanically polished samples (0.5 ± 0.02 µm) was observed.
Measurements of nanometric roughness, micrometric roughness, and contact angle in DMEM.

In relation to the nanometric roughness values (Table II), greater nanometric roughness was observed after 12 min of electropolishing, which can be attributed to the regions with intense oxide formation [Fig. 3(c)]. With regard to the mechanically polished sample, the greater values of nanometric roughness can be attributed to the mechanical sanding. Meanwhile, the nanometric roughness (R a and R z) values of the sample electropolished for 4 min decreased (compared to the mechanically polished sample) due to anodic dissolution and the formation of a nanostructured surface [Fig. 3(b)].
Lower contact angle values were measured for the samples electropolished for 4 min (58° ± 1°) compared to the samples treated for 12 min (75° ± 4°) and the mechanically polished (83° ± 0.3°) samples (Table II). Compared to the samples treated for 12 min or mechanically polished, the samples electropolished for 4 min presented a nanostructured surface and lower nanometric roughness values, which may contribute to the decrease in the contact angle, promoting a hydrophilic behavior. A study performed by Kim et al. (2016) Reference Kim, Kim, Jang and Park54 showed a lower water contact angle on the nanostructured titanium surface.
C. Evaluation of the growth of human embryonic stem cells (hESCs) in osteogenic media and cell differentiation
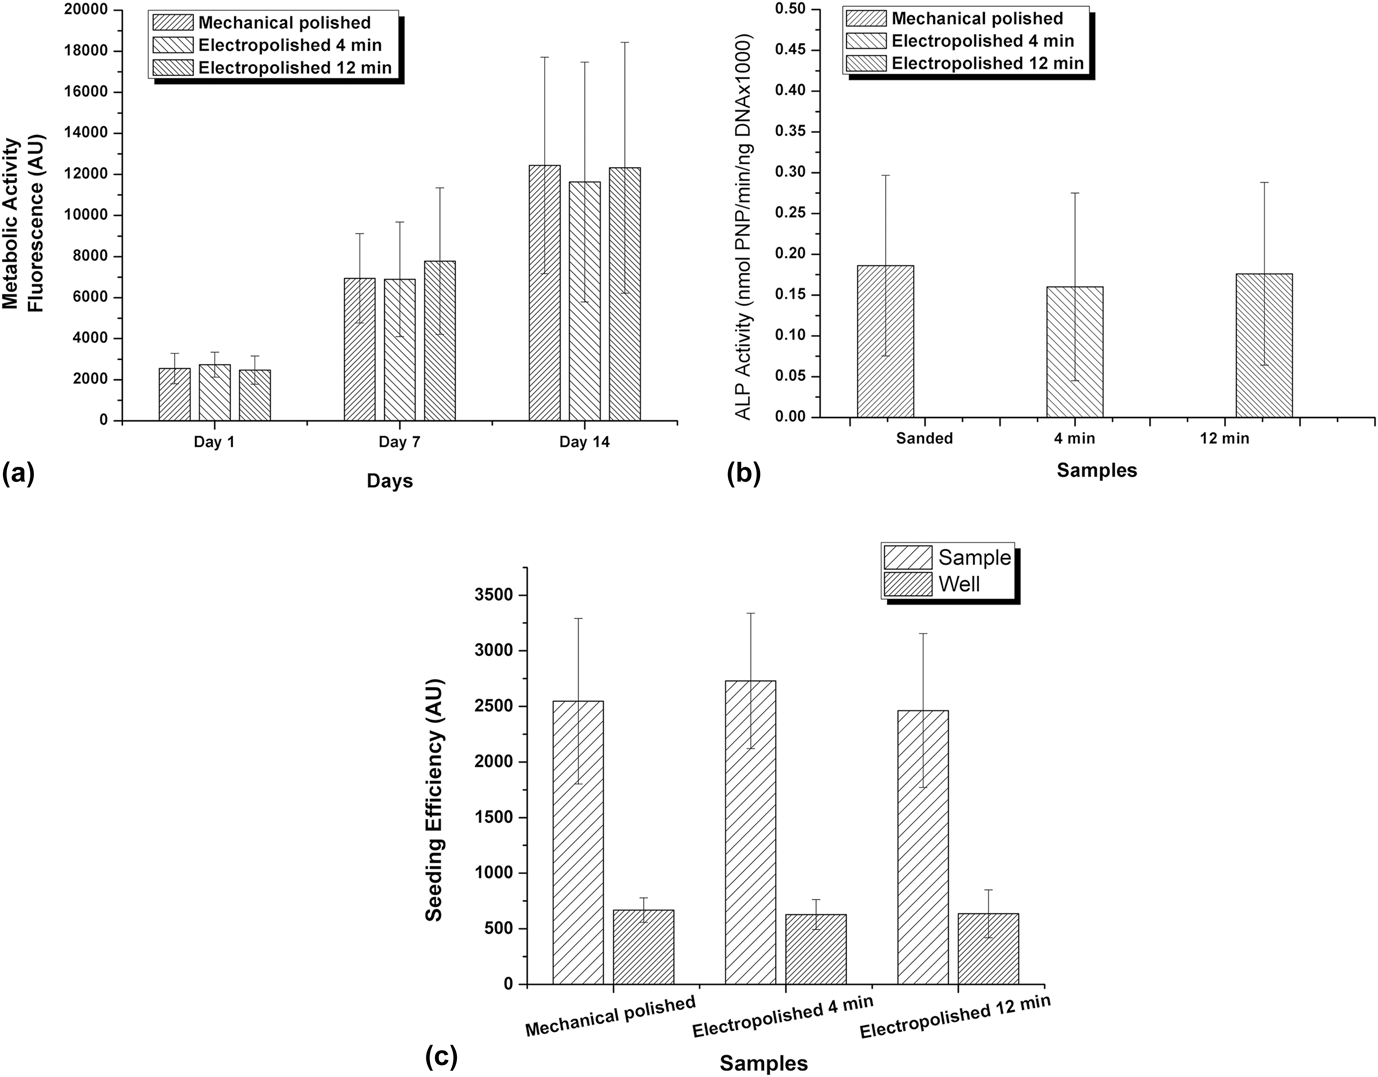
The relative cell number (measured as metabolic activity in resazurin fluorescence units) was similar on all samples independent of the surface treatment. Although there was high sample-to-sample variability, resazurin fluorescence increased over time, indicating a net increase in the viable cell number [Fig. 5(a)]. These results indicate that the studied surface treatments are nontoxic and support good cell growth.
Resazurin fluorescence units (cell metabolic activity): mean ± SD. Average number of cells per samples after cell growth in the osteogenic media (a), ALP activity measurements on day 14 of culture after cell growth in the osteogenic media (b), and seeding efficiency results per system (c). Data are given from n = 6 and statistical significant differences at P < 0.05.

The results obtained from the ALP activity measurements after cell growth in the osteogenic media [Fig. 5(b)] show that the differentiation capacity of the hESCs was maintained on all of the evaluated samples. Therefore, the electropolishing surface treatments influenced the nanometric morphology and wettability compared to mechanical polishing but did not affect cell differentiation. Cell differentiation has been shown to be strongly influenced by microroughness, which was not changed by the treatment of the studied samples (Table II). The micrometric roughness values found in this work were similar to the results obtained by Li et al. (2012), Reference Li, Wang, Zheng and Lin55 Mendonça et al. (2011), Reference Mendonça, Miguez, Mendonça, Yamauchi, Aragão and Cooper56 and Olivares-Navarrete et al. (2014), Reference Olivares-Navarrete, Hyzy, Berg, Schneider, Hotchkiss, Schwartz and Boyan57 who reported that microrough surfaces can promote cell proliferation and differentiation. Li et al. (2012) found micrometric roughness values of 0.1 ± 0.004 µm for mechanically polished titanium and 0.7 ± 0.02 µm after sandblasting treatment, while Mendonça et al. (2011) observed a roughness of 0.4 µm on the polished surfaces.
Figure 5(c) shows the seeding efficiency results, which indicate that for all of the systems evaluated, the number of cells adhering on samples was similar to the cell number measured after 1 day of cell growth [Fig. 5(a)].
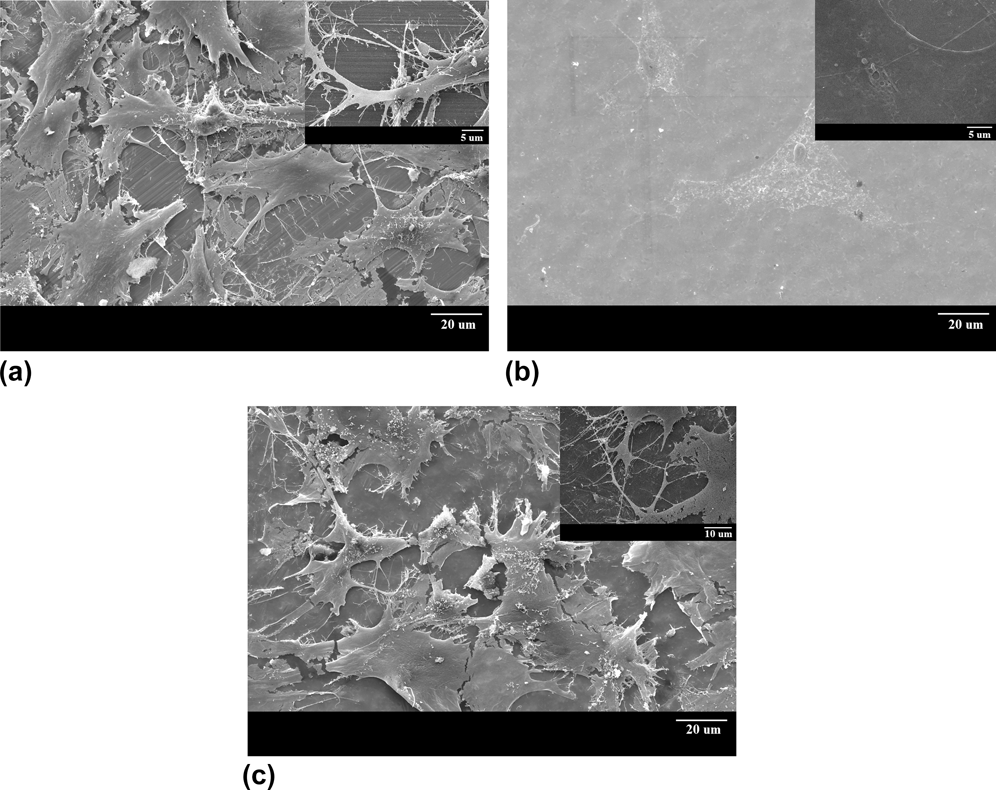
The SEM images of the embryonic stem cell growth on the mechanically polished samples [Fig. 6(a)] and samples electropolished for 12 min [Fig. 6(c)] indicate cells with polygonal geometry and fragmented extracellular matrix. From samples electropolished for 4 min [Fig. 6(c)], it was possible to identify cells without regions of fragmentation and without disruption of the cytoplasmic extensions.
Scanning electron micrographs of (a) mechanically polished sample, (b) sample electropolished for 4 min, and (c) sample electropolished for 12 min. Samples were cultured for 14 days. Data are given from n = 6 and statistical significant differences at P < 0.05.

The samples electropolished for 4 min contributed significantly to the obtainment of less fragmented cells [Fig. 6(b)]. Vandrovocová et al. (2011) Reference Vandrovcová and Bačáková58 indicated that nanorough surfaces promote cell proliferation and differentiation. In addition, Yang et al. (2010) Reference Yang and Huang59 and Liu et al. (2016) Reference Liu, Li, Zhu, Yeung, Chu and Wu60 showed that nanotopography can lead to better cell adhesion as a consequence of the interaction between cells and nanomaterials by mechanotransduction mechanisms, which control the differentiation and proliferation process.
However, although an effect of nanostructured surfaces on the cell morphology was observed for samples electropolished for 4 min, no effect on cell growth or cell differentiation results was evidenced since the results for the systems were similar and were more dependent on the micrometric roughness of the surface.
In this study, the nanostructures evidenced on samples electropolished for 4 min had less effect on cell growth and osteogenic differentiation than the micrometric roughness.
IV. CONCLUSIONS
From the XPS results, the presence of the oxygen element was identified on the surface of the samples electropolished for 4 and 12 min, which evidenced that during the electrochemical treatment, oxide formation occurs for both electropolishing times. In addition, from the AFM images, it was observed that samples electropolished for 4 min had a nanostructured surface while those electropolished for 12 min presented a nanostructured surface covered in some regions by a thick, discontinuous, and disordered oxide layer.
The electropolishing surface treatments influenced the nanometric morphology and wettability compared with the mechanical polishing treatment. However, the electropolishing contributed to growth and osteogenic differentiation of hESC-MPs in the osteogenic media in the same way as the mechanical polishing treatment. This indicates that differentiation was strongly influenced by microroughness, which was similar in the different treatments used in the present work (mechanically polished and electropolished for 4 and 12 min).
Further in vivo research will identify whether the bone matrix deposition is controlled by these nanotopographic structures.
ACKNOWLEDGMENTS
The present work was carried out with the support of CAPES and CNPq, Brazilian Government entities focused on the formation of human resources. We thank Julie Marshall from the University of Sheffield for technical services relating to the cell culture work. The authors also thank INPE for the XPS analysis.