1. Introduction
We investigate the dynamics of a hydrofoil that is placed in the wake of a cylinder whose rotation can be controlled. By controlling the cylinder's rotation, the vortices that are shed in its wake can be controlled and as a result the response of the downstream hydrofoil can be altered. This work is a part of a long-term project that aims at creating assistive dynamics on the lower limbs of a patient while walking on an underwater treadmill during physical therapy, without direct contact with the patient. This goal will be achieved by placing a cylinder upstream and controlling the vortices that are shed in the wake of the cylinder by forcing it to rotate following a desired pattern. This will control the frequency and strength of the shed vortices in the wake of the cylinder. These vortices then will exert forces on the hydrofoils that are attached to the patient's lower limb, and transfer the desired power to the patient, thus providing the necessary assistance. This is a novel approach for collaborative robots (cobots) that enables them to interact with a person without directly coming into contact with them. Here, we focus on the fundamental understanding that is needed of flow-induced vibrations of a hydrofoil in the wake of a cylinder being forced to rotate, towards the long-term goal of designing a system that provides a desired motion of the downstream object.
Wake-induced vibration occurs when a flexibly mounted structure is placed in the wake of a bluff body and oscillates due to the interactions with the wake of the upstream body. Wake-induced vibration studies have mainly focused on cases where the upstream body is either fixed or can undergo self-excited flow-induced oscillations (Assi, Bearman & Meneghini Reference Assi, Bearman and Meneghini2010; Bearman Reference Bearman2011; Huera-Huarte & Gharib Reference Huera-Huarte and Gharib2011; Assi et al. Reference Assi, Bearman, Carmo, Meneghini, Sherwin and Willden2013), but not on cases where the upstream body is forced to rotate. Recently, the concept of wake stiffness has been introduced in the literature of wake-induced vibration by observing the characteristics of the response of a structure placed in the wake of another (Assi et al. Reference Assi, Bearman, Carmo, Meneghini, Sherwin and Willden2013; Mysa, Kaboudian & Jaiman Reference Mysa, Kaboudian and Jaiman2016). Even with no structural stiffness, a cylinder placed in the wake of another has been observed to oscillate as if the wake gives the cylinder a stiffness. One can think of the wake stiffness together with the added mass (due to the forces needed to accelerate the fluid in contact with the structure) and flow-induced damping (due to the drag forces) as the wake impedance. Wang, Alam & Zhou (Reference Wang, Alam and Zhou2018) have shown how when two objects are placed in tandem, their relative sizes and the distance between them affect the response of the downstream object. They have pinpointed the ranges of these two parameters for which the effects of the upstream object on the downstream object are significant. Structures placed in tandem in flow have been used for energy extraction as well. For example, Ma et al. (Reference Ma, Wang, Xie, Han, Sun and Zhang2019) examined energy extraction from tandem hydrofoils with crossflow and rotational degrees of freedom, and Derakhshandeh et al. (Reference Derakhshandeh, Arjomandi, Dally and Cazzolato2016) have studied the efficiency of flow-induced vibrations of a hydrofoil free to oscillate in two directions and placed in the wake of a rigid cylinder for energy extraction applications.
When a free vortex interacts with a rigid or flexibly mounted body (a cylinder, a hydrofoil/airfoil or bodies with other geometries), the incoming vortex can be distorted, and it can interact with the vortex that is shed from the body. Rockwell (Reference Rockwell1998) has categorized the vortex–body interaction studies as parallel vortex, streamwise vortex and normal vortex cases. In the parallel vortex case, the vorticity is perpendicular to the plane of the body's cross-section, similar to the case that we discuss in the present work. According to Rockwell, the main parameters that influence the response of a flexibly mounted body to an incoming vortex are circulation, offset of the incoming vortex relative to the body and the phase difference between the incoming vortex and the oscillations of the flexibly mounted body. The oscillations of a body that interacts with an incoming vortex influence both the distortion of the incoming vortex and the formation of the vortex from the oscillating body. Recent studies of interactions between an incoming vortex and a flexibly mounted airfoil have been conducted with a focus on noise suppression (Manela Reference Manela2013; Manela & Huang Reference Manela and Huang2013) and on modelling the dynamic coupling between the vortex and the structure (Riso, Riccardi & Mastroddi Reference Riso, Riccardi and Mastroddi2016; Chen & Jaworski Reference Chen and Jaworski2020).
In the case of a single body placed in flow, controlling the wake of the body (e.g. a cylindrical structure or a hydrofoil) has been an active area of research for several years (Gad-el Hak Reference Gad-el Hak2007; Lachmann Reference Lachmann2014). These flow control strategies have been used mainly for (i) reducing drag forces that act on the body (Choi, Moin & Kim Reference Choi, Moin and Kim1994; Igarashi Reference Igarashi1997; Seifert et al. Reference Seifert, Stalnov, Sperber, Arwatz, Palei, David, Dayan and Fono2009; Seifert, Shtendel & Dolgopyat Reference Seifert, Shtendel and Dolgopyat2015), (ii) increasing efficiency in extracting energy from flow-induced oscillations (Gopalkrishnan et al. Reference Gopalkrishnan, Triantafyllou, Triantafyllou and Barrett1994; Zhu Reference Zhu2011) or (iii) modelling fish propulsion using simplified models (Triantafyllou, Techet & Hover Reference Triantafyllou, Techet and Hover2004; Schouveiler, Hover & Triantafyllou Reference Schouveiler, Hover and Triantafyllou2005). One of the several strategies to control the wake, and one that is widely used, is to impose an external rotation to the structure, e.g. a cylinder. By imposing an external rotation, the wake of the cylinder is influenced and therefore the flow forces that act on the structure itself, or a second structure that could be placed in its wake, will change.
There are several studies of control of the wake of a cylinder by forcing it to rotate in one direction only, or in two directions periodically. In cases where the cylinder is forced to rotate in one direction only (e.g. Mittal & Kumar Reference Mittal and Kumar2003; Seyed-Aghazadeh & Modarres-Sadeghi Reference Seyed-Aghazadeh and Modarres-Sadeghi2015), at low rotation rates, shedding of alternating vortices from the two sides of the cylinder is observed such that the shedding exerts a symmetric fluctuating force on the cylinder (Mittal & Kumar Reference Mittal and Kumar2003). At higher rates, the imposed rotation of the cylinder introduces asymmetry in the vortex shedding pattern (Kumar, Cantu & Gonzalez Reference Kumar, Cantu and Gonzalez2011), and at even higher rotation rates, the vortex shedding is suppressed, and no shedding is observed in the wake. This wake pattern and vortex shedding suppression have been observed in different studies for the same range of rotation rates (Diaz et al. Reference Diaz, Gavaldà, Kawall, Keffer and Giralt1983; Badr et al. Reference Badr, Coutanceau, Dennis and Menard1990; Mittal & Kumar Reference Mittal and Kumar2003; Kumar et al. Reference Kumar, Cantu and Gonzalez2011; Seyed-Aghazadeh & Modarres-Sadeghi Reference Seyed-Aghazadeh and Modarres-Sadeghi2015). The flow becomes unstable again as the rotation rate is increased even further, and relatively large vortex shedding is observed where the vortex is shed from one side of the cylinder only. Such a one-sided vortex shedding pattern was first observed in the two-dimensional numerical solutions of Mittal & Kumar (Reference Mittal and Kumar2003). The one-sided vortex shedding again disappears at higher rotation rates. These wake patterns have been extensively observed in various numerical and experimental studies at different Reynolds numbers (Mittal & Kumar Reference Mittal and Kumar2003; Kumar et al. Reference Kumar, Cantu and Gonzalez2011; Rao et al. Reference Rao, Radi, Leontini, Thompson, Sheridan and Hourigan2015).
In the case where a cylinder is forced to rotate periodically, Tokumaru & Dimotakis (Reference Tokumaru and Dimotakis1991, Reference Tokumaru and Dimotakis1993) observed four different modes in the wake as the rotation frequency was increased. They showed that at lower forcing frequencies, the forcing and the shedding frequencies are synchronized, and at higher frequencies the wake resembles the wake of a fixed cylinder, because the effect of periodic rotation is observed in the shear layers separating from the cylinder and not in the wake. The effects of synchronizations between the forcing frequency and vortex shedding frequency in such systems have been studied as well (Chou Reference Chou1997; Fujisawa, Ikemoto & Nagaya Reference Fujisawa, Ikemoto and Nagaya1998), and the possibility of reducing drag by enforcing periodic rotation on a cylinder has been studied both experimentally and numerically (Shiels & Leonard Reference Shiels and Leonard2001; Du & Dalton Reference Du and Dalton2013). In all these studies, the focus has been on the wake of the cylinder as it rotates periodically and on how this periodic rotation influences the wake behaviour of the system. One can imagine that if a second object were placed in the wake of the rotating cylinder, then by changing the frequency and amplitude of the cylinder's rotation, one can influence the motion of the object in the wake.
In the present study, we extend the ideas of wake control based on forced rotation (constant or periodic) of a cylinder to the case where an object (a hydrofoil in our specific experiment) is placed in the wake, and the goal is to influence the motion of the object by controlling the wake of the cylinder. We do this by conducting three series of experiments. First, we consider the passive interaction of the hydrofoil with the vortices shed in the wake of a fixed cylinder. Second, we apply constant rotation at different rotation rates to the cylinder and study the response of the hydrofoil in its wake. Third, we apply periodic forced rotations to the cylinder and observe how changing the frequency of this forced rotation influences the response of the hydrofoil.
2. Experimental set-up and method
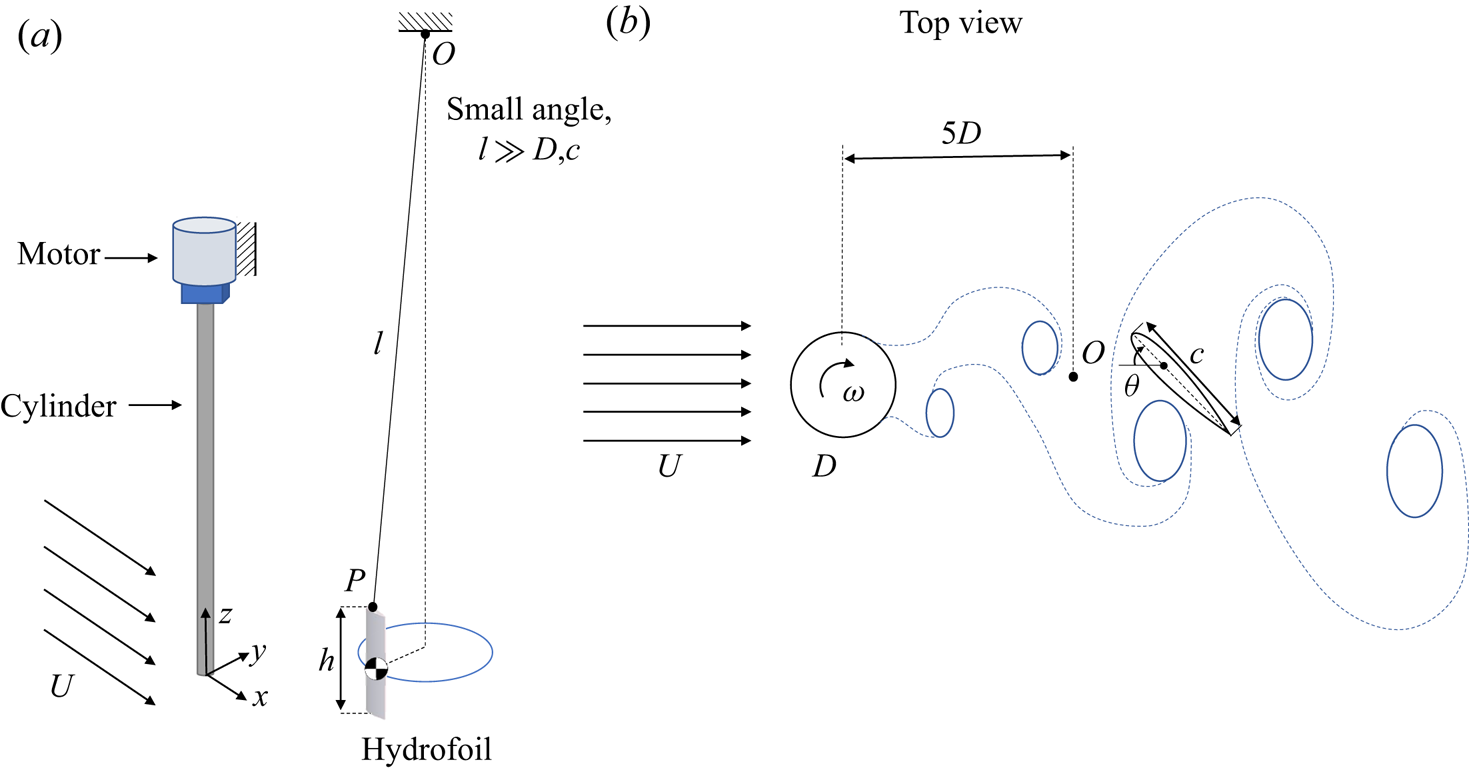
A cylinder made of aluminium with a length of  $L=460$ mm and a diameter of
 $D=19$ mm was fixed to a Velmex PK245 stepper motor through a Vex VersaPlanetary 5:1 reduction gearbox and suspended vertically in the test section of a water tunnel, with a test section of
 $0.5\ \textrm {m} \times 0.38\ \textrm {m}\times 1.27\ \textrm {m}$ and a turbulence intensity of less than 2 %. The quality of the flow profile within the test section of this water tunnel has been documented in the past (Seyed-Aghazadeh, Carlson & Modarres-Sadeghi Reference Seyed-Aghazadeh, Carlson and Modarres-Sadeghi2017). A NACA 0024 hydrofoil with a chord of
 $c = 26$ mm and span of
 $h = 126$ mm was hung by a string from a point at a height of
 $l=1.6$ m, and was placed downstream of the cylinder, as depicted in figure 1. A relatively large value was selected for
 $l/c = 61.5$, and a slender cylindrical mass,
 $m= 16$ g, was added to the lower end of the hydrofoil to ensure mainly two-dimensional oscillations of the hydrofoil in a horizontal plane. The natural frequency of the hydrofoil in air was measured using decay tests to be
 $f_n=0.4$ Hz.
(a) An overview of the experimental set-up and (b) the relative location of the hydrofoil with respect to the upstream cylinder.

In still fluid, the hydrofoil was located 5 $D$ downstream of the cylinder, so that the vortices that are shed from the upstream cylinder are fully developed when they interact with the hydrofoil. The upstream cylinder could rotate at various angular velocities,
 $\omega$, in either direction. The rotation of the motor, and in turn the cylinder, was controlled by a Velmex VXM two-phase unipolar stepper motor controller. The cylinder position was measured with a US Digital h6-2500 encoder, with a resolution of 2500 steps per revolution. The hydrofoil's trajectories were captured using a Canon EOS Rebel T3i recording at 60 fps. These measurements were conducted with a minimum frequency resolution of approximately 0.0025 Hz for the results discussed in §§ 3 and 4 and 0.015 Hz for the results discussed in § 5. The hydrofoil's displacements were subsequently acquired using the object tracking feature in Adobe After Effects and the collected data were processed in MATLAB. The displacement measurements were conducted from the centre of the cylinder to the hydrofoil's elastic axis located at its quarter chord. The calibration of displacements was conducted based on the known diameter of the cylinder. Hydrogen bubble visualization was conducted through electrolysis using a platinum–iridium wire with a diameter of 0.005 mm to create a sheet of bubbles in the flow. The flow field was quantified using image velocimetry with the hydrogen bubbles as tracing elements. This process is described in Currier & Modarres-Sadeghi (Reference Currier and Modarres-Sadeghi2019).
Three series of experiments were conducted to characterize the behaviour of the downstream hydrofoil. In the first series of experiments (discussed in § 3), the upstream cylinder was fixed as the flow velocity was increased from zero in small steps to the maximum desired flow velocity. As a result, in this series of experiments, the flow that interacted with the hydrofoil was the wake of a fixed cylinder placed in flow. In the second series of experiments (discussed in § 4), the incoming flow velocity was held constant, and the upstream cylinder was forced to rotate in one direction at various rotation rates. The flow that interacted with the hydrofoil in this series of experiments was the wake of the cylinder that was altered and deflected to one side, due to the cylinder's constant rotation. In the third series of experiments (discussed in § 5), again the incoming flow velocity was held constant, but this time the upstream cylinder was forced to rotate periodically at various frequencies. In this series of experiments, the hydrofoil interacted with vortices that were shed from the upstream cylinder at the frequency of the cylinder's periodic rotation. The Reynolds number, calculated based on the cylinder's diameter, was in the range  $Re=215 - 760$ for the first series of experiments, and a constant
 $Re=540$ for the second and the third series.
3. The response of the hydrofoil in the wake of a fixed cylinder
In the first series of experiments, we studied the dynamics of the hydrofoil in the wake of a fixed rigid cylinder. The flow velocity was increased in small steps and the response of the hydrofoil was measured.
3.1. The overall behaviour of the hydrofoil
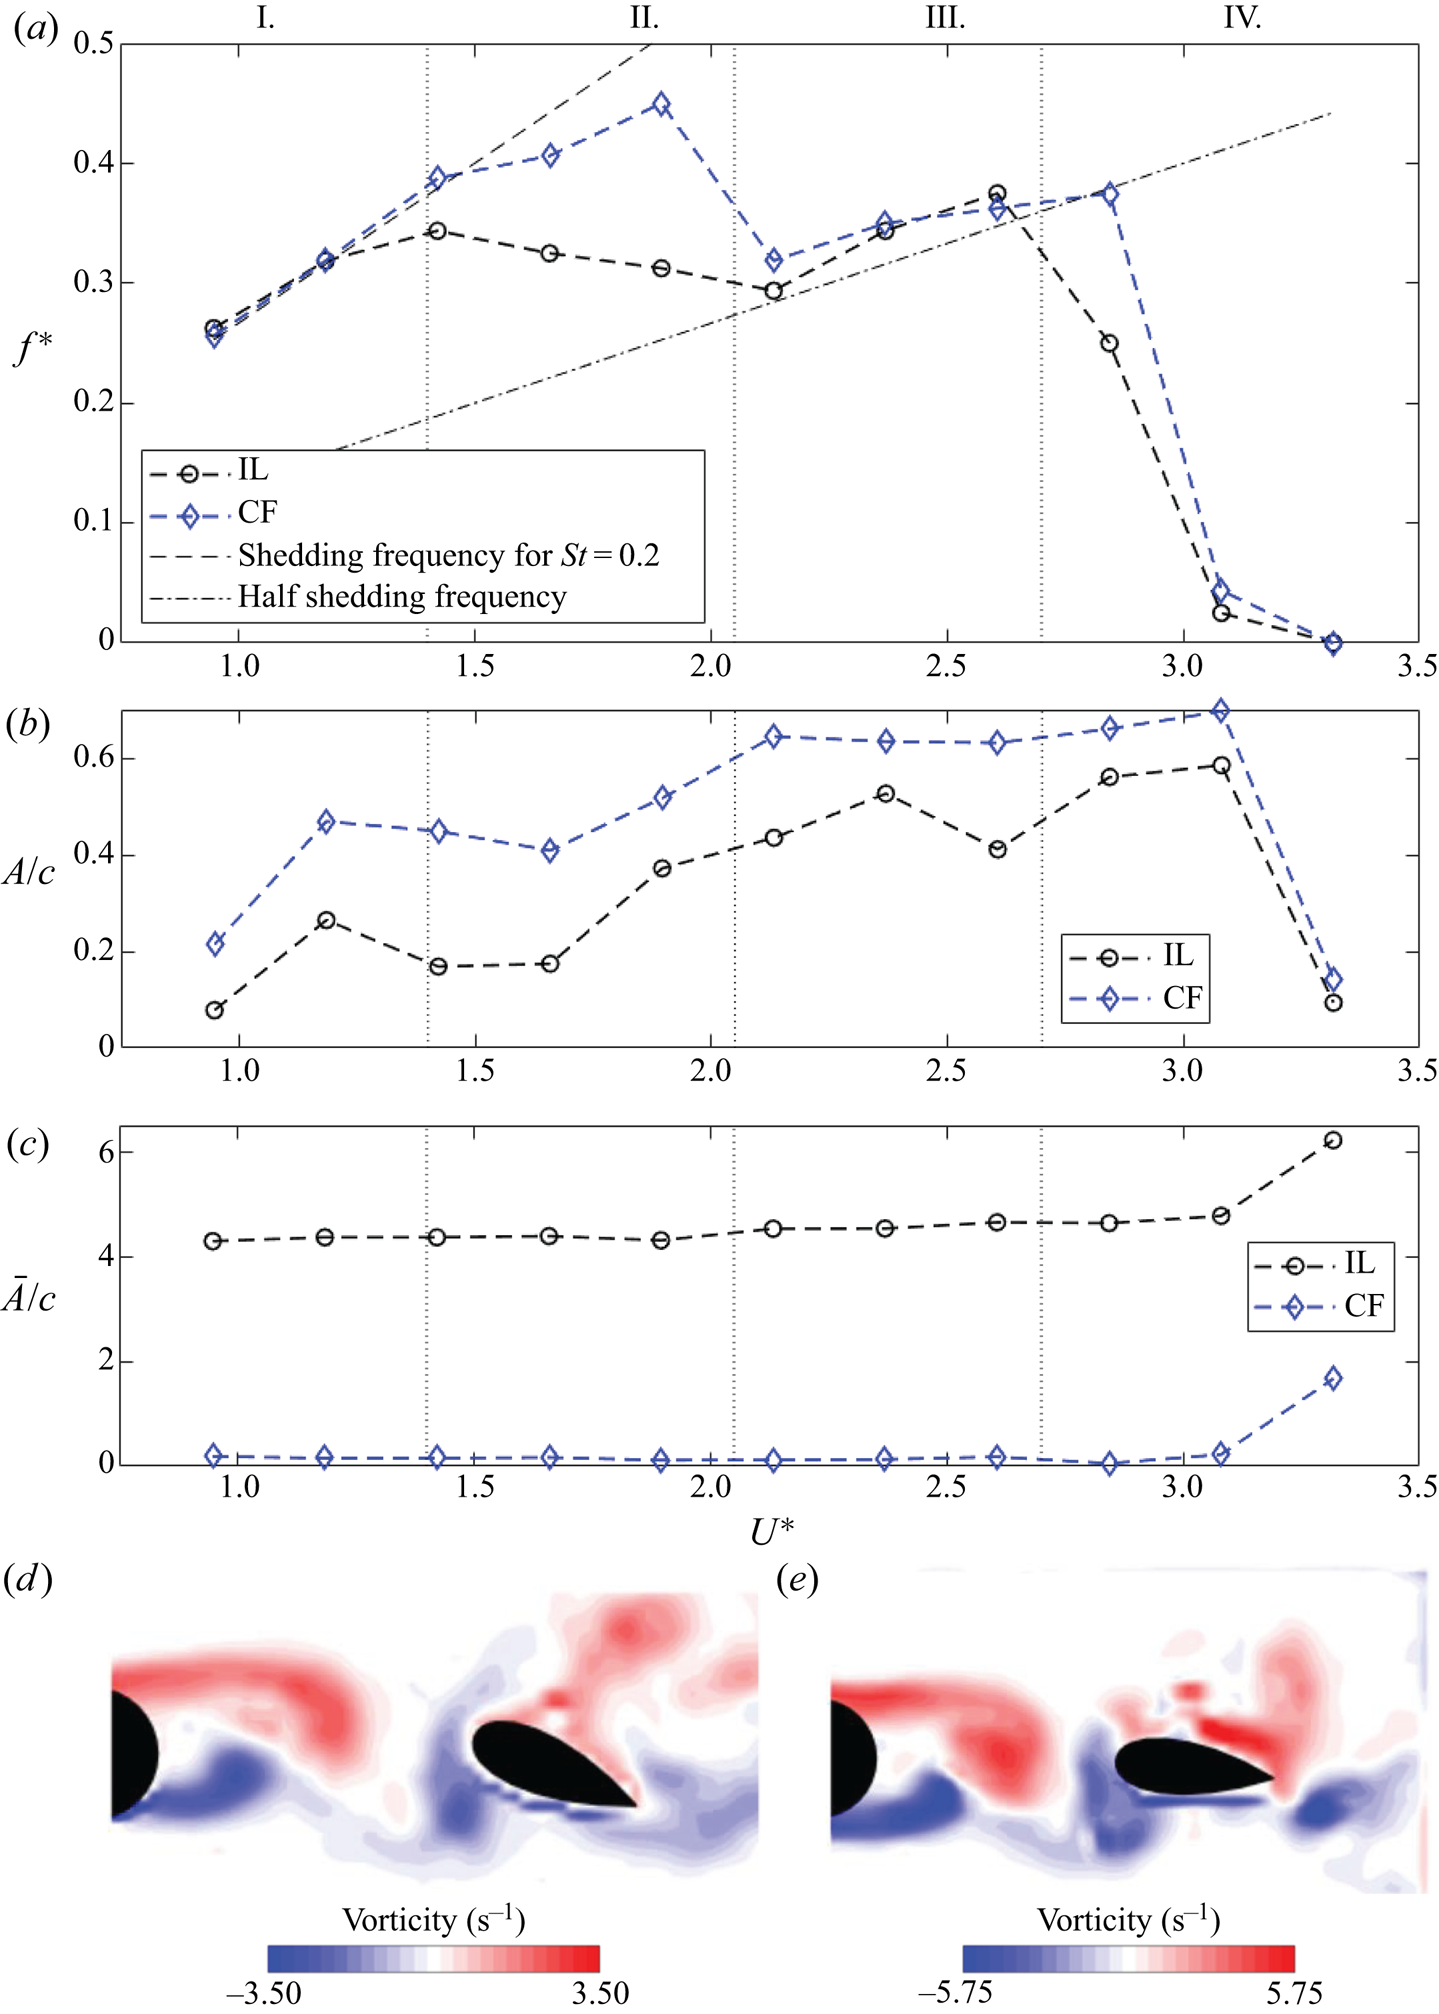
Figure 2 shows how the dominant frequency of the hydrofoil's oscillations as well as its amplitudes and mean values of displacements in the crossflow (CF) and inline (IL) directions change with increasing reduced velocity. The frequency ratio and the reduced velocity are defined as  $f^*=f/f_n$ and
 $U^*=U/f_n c$, respectively, where
 $U$ is the incoming flow velocity and
 $f_n$ is the hydrofoil's natural frequency in air. We use the natural frequency in air in these definitions because the free decay response of the hydrofoil in water was overdamped. Two lines are superimposed on the data corresponding to the expected frequency of vortex shedding from the upstream cylinder,
 $f_s$, and half of that,
 $f_s/2$, assuming a constant Strouhal number of
 $St=0.2$. Four distinct regions of behaviour are identified and are depicted in figure 2 separated by vertical dotted lines. Sample snapshots of flow visualization are also presented in figure 2 to give an overall view of the flow around the hydrofoil. We discuss these visualizations with details later in this section.
Summary of the hydrofoil's response in the wake of a fixed cylinder. (a) Peak frequencies of the hydrofoil's oscillations in the CF and IL directions versus reduced velocity. Dashed lines indicate the shedding frequency and half shedding frequency calculated using  $St=0.2$. Frequencies are normalized by the natural frequency in air,
 $f^*=f/f_n$. (b) Normalized amplitude of oscillations,
 $A/c$, in the CF and IL directions, together with (c) the normalized mean values of the CF and IL displacements,
 $\bar {A}/c$. The displacements are measured at a point located at 0.25
 $c$ from the leading edge of the hydrofoil. Sample snapshots of flow visualizations are shown for cases in (d) region I and (e) region III.

For  $U^*<1.4$ (region I) the oscillation frequencies in both the IL and CF directions closely follow the shedding frequency, implying a synchronization between the IL and CF oscillation frequencies and the shedding frequency. For
 $1.4< U^*<2.1$ (region II), the oscillation frequencies deviate from the Strouhal line and eventually reach the half-Strouhal line at the end of this region. This region can be considered a transition region, where the IL frequency moves directly to the half-Strouhal frequency, while the CF frequency initially deviates from the Strouhal frequency slightly, and then moves quickly to the half-Strouhal frequency towards the end of this region. In regions I and II, the amplitudes of oscillations in both the CF and IL directions initially increase for increasing
 $U^*$, then decrease and again increase, reaching the maximum amplitudes in each direction at the end of region II. At the end of the transition region, the oscillation frequencies in the CF and IL directions become equal and follow the half-Strouhal line for a reduced velocity range of
 $2.1< U^*<2.7$ (region III). In this region, both the CF and IL amplitudes stay more or less constant. Finally, for
 $U^*>2.7$, the frequencies approach zero (region IV), and small-amplitude oscillations are observed as the hydrofoil is moved to the side. The mean values of the CF and IL oscillations stay close to 0 and 4.5
 $D$, respectively, for all reduced velocities for which oscillations are observed (figure 2c). At the highest reduced velocity, the mean values increase in both directions. Visual inspection of the wake based on bubble visualizations indicates that the hydrofoil has moved to a side at this reduced velocity and does not interact with the vortices that are shed in the wake of the cylinder.
3.2. Sample time histories
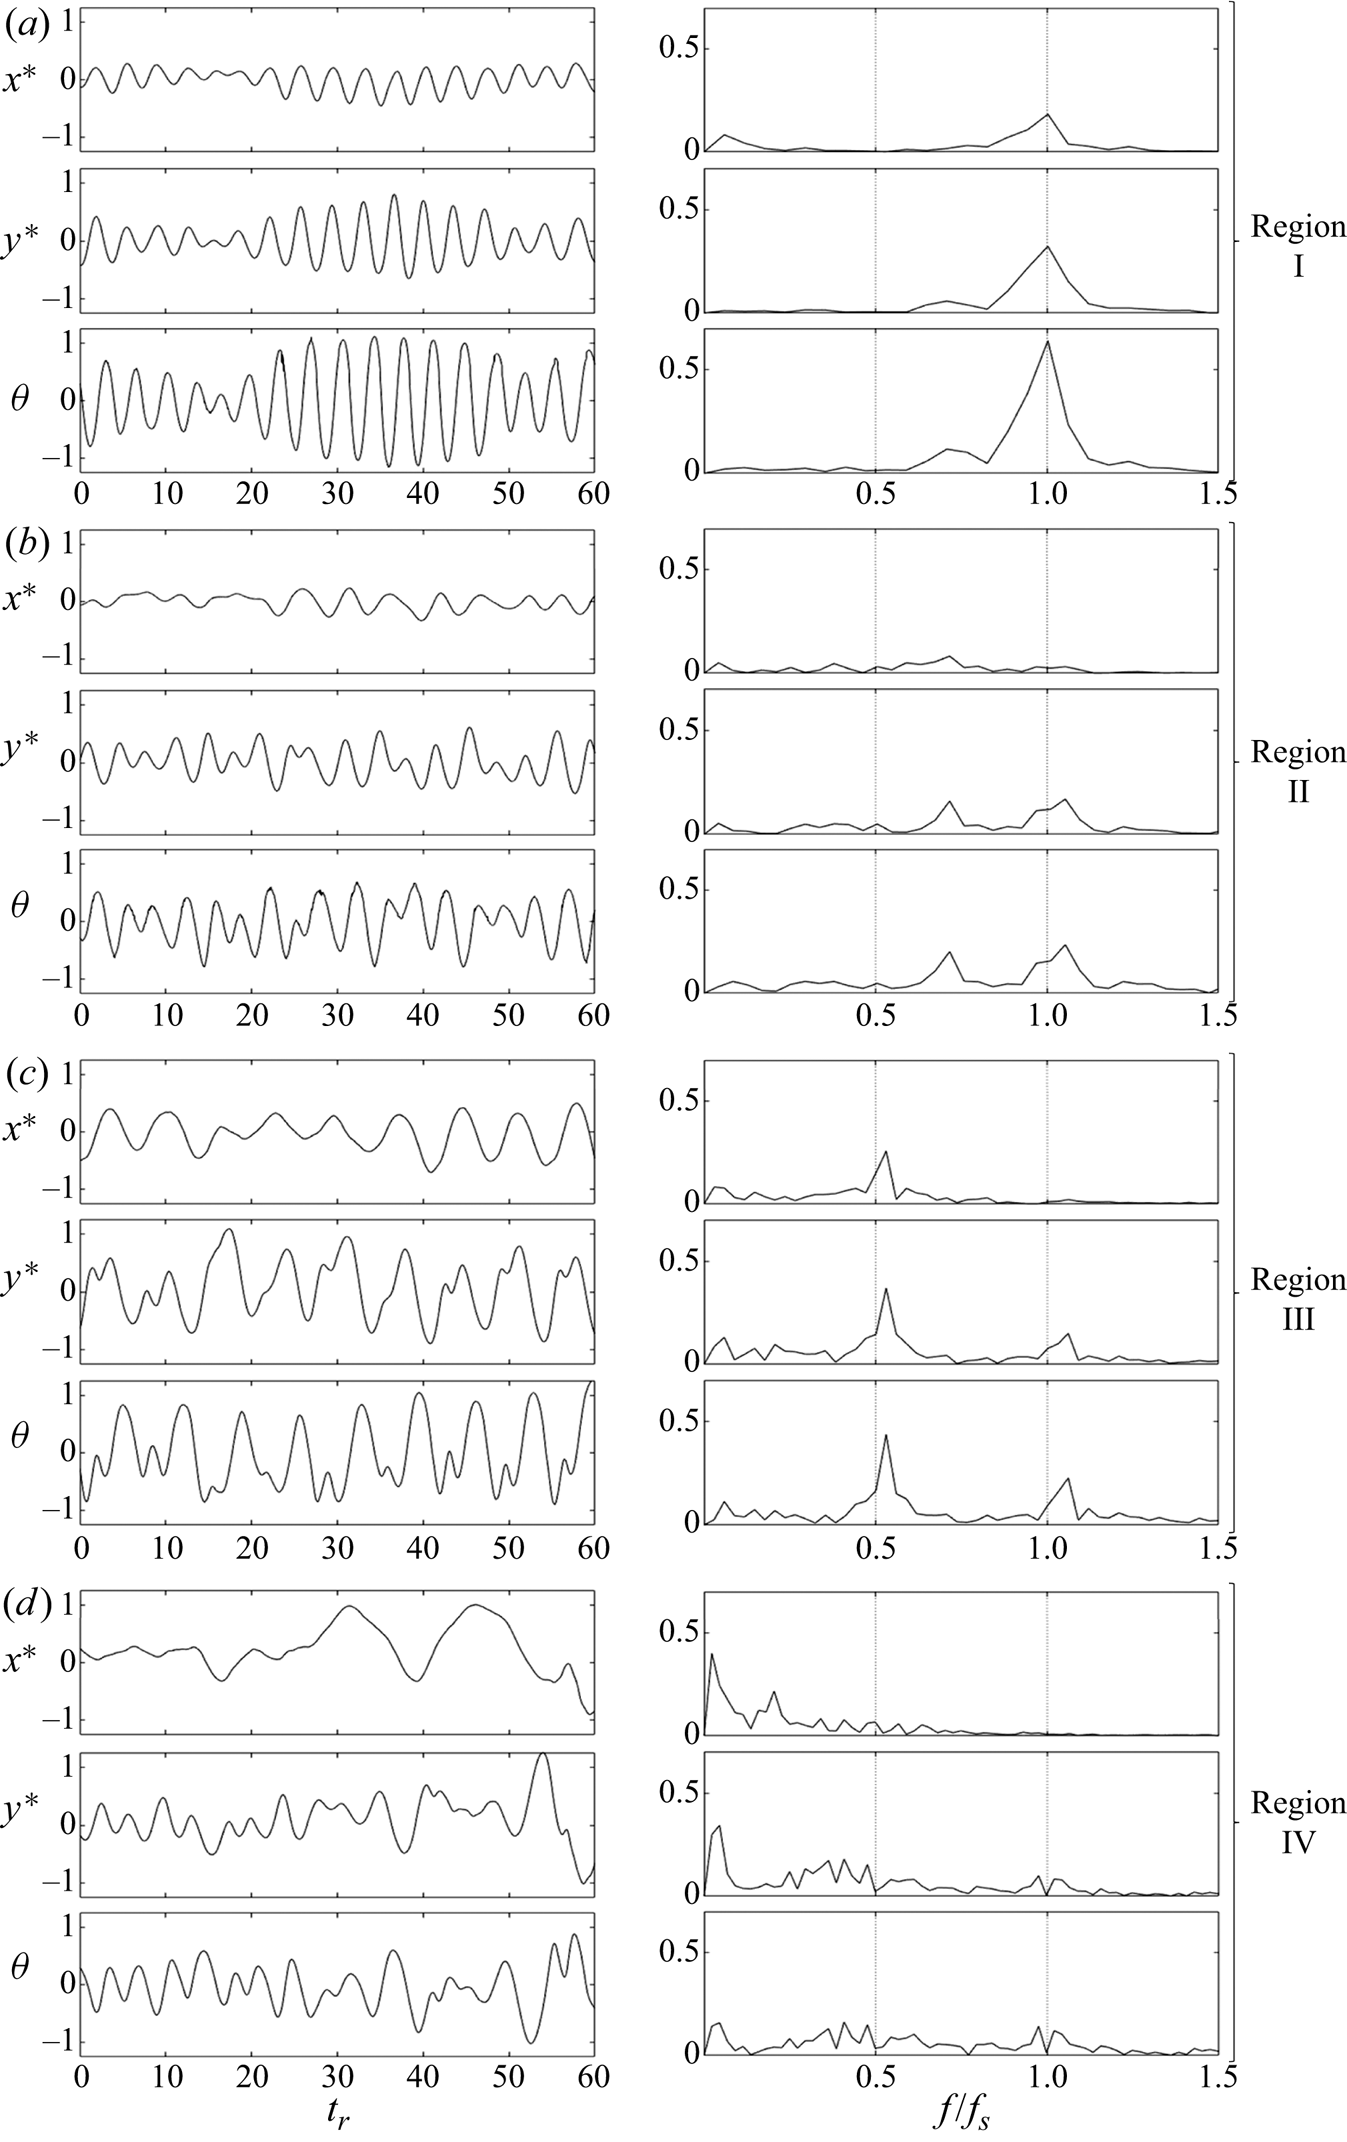
Sample time histories of these four regions together with their corresponding fast Fourier transform (FFT) plots are shown in figure 3. As was observed in figure 2(a), a transition from a 1:1 ratio between the CF and IL oscillation frequencies in region I to another 1:1 ratio in region III is clear in the FFT plots of figure 3. The 1:1 ratio in region I is synchronized at the Strouhal frequency. Then in region II, the frequency contents have contributions at the Strouhal frequency and frequencies lower than the Strouhal frequency, and in region III the main contribution is switched to the half-Strouhal frequency, with small but present contributions from the frequencies at the Strouhal frequency mainly in the CF direction. In region IV, the oscillations are clearly at a very low frequency compared with the previous cases.
Sample cases of the hydrofoil's response in the wake of a fixed cylinder. Time histories and FFT plots of the IL,  $x^*=x/c$, CF,
 $y^*=y/c$, and torsional,
 $\theta$, directions for (a)
 $U^*=1.2$, (b)
 $U^*=1.7$, (c)
 $U^*=2.4$ and (d)
 $U^*=3.1$. The time histories are plotted against reduced time
 $t_r = t U / c$.

In region I, the amplitudes of oscillations in both directions fluctuate synchronously. In region II, the IL amplitude is considerably smaller than the CF amplitude, and clear signs of a frequency lower than the shedding frequency are observed in the CF displacement time history. In the sample time histories of region III, oscillations with half of the shedding frequency are the main observed oscillations, with frequencies equal to the shedding frequency also observed in the CF direction. In region IV, oscillations of very low frequency are observed in both directions. Within this region, the hydrofoil moves to the side and remains mainly static.
3.3. The observed trajectories
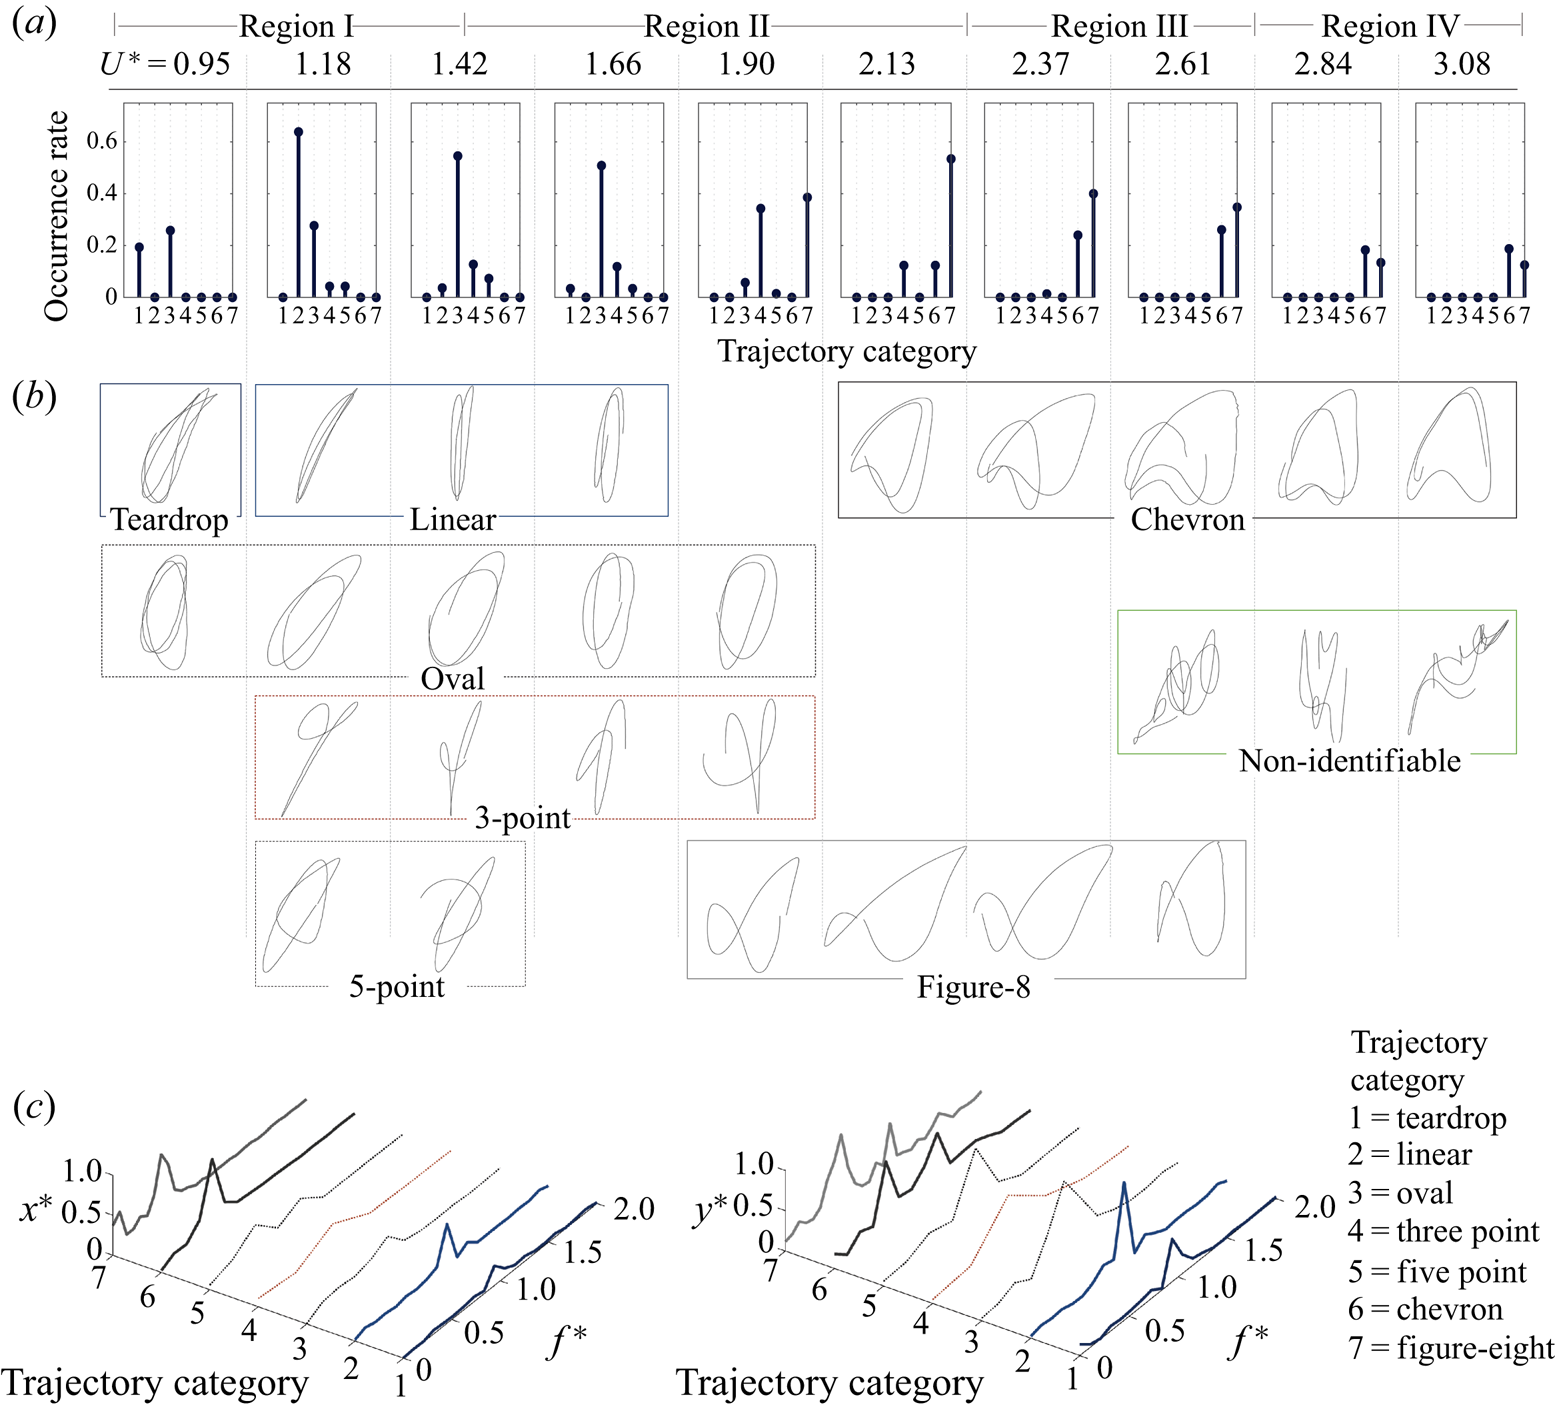
By visually inspecting the hydrofoil's trajectory in each cycle of its oscillations, we have identified seven distinct types of trajectories that the hydrofoil follows at different reduced velocities. In some cases the hydrofoil follows the same trajectory over several cycles of oscillations, and in some cases the trajectories are changed after only a few cycles. Figure 4 shows the histograms of occurrence of these trajectories, together with samples of the trajectories and the frequency contents observed for each type of trajectory.
Different trajectories that are observed in the response of the hydrofoil in the wake of a fixed cylinder. (a) The rate of their occurrence, (b) the trajectory's shapes and (c) FFTs of their displacements in the IL,  $x$, and CF,
 $y$, directions.

From these plots, it becomes clear that in region I, where the frequencies of the IL and CF displacements are equal and follow the Strouhal frequency, teardrop, linear and oval trajectories are the main trajectories that are observed. In the transition region (region II), the three-point and figure-eight trajectories appear in the time histories. The figure-eight trajectories become the dominant ones towards the end of the transition region, which corresponds to the range where a 2:1 ratio between the frequencies in the CF and IL oscillations is observed in the frequency plots of figure 2. The figure-eight trajectories continue to occur in region III, due to the small contribution of the frequency at the Strouhal value in the CF displacements, and together with the chevron trajectories are the most commonly occurring trajectories in this region.
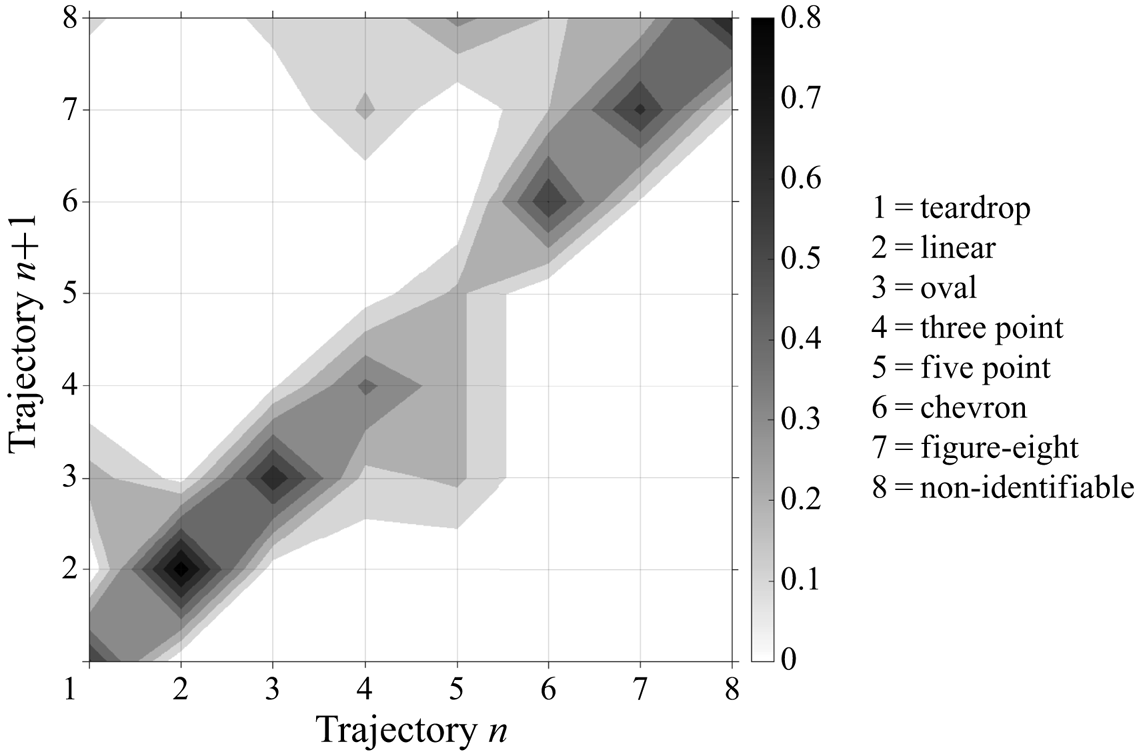
A map of the observed trajectories in each cycle of oscillations versus the trajectory in the preceding cycle is given in figure 5 for trajectories observed in all reduced velocities tested here. The magnitude shows the likelihood of observing the trajectory that is observed in any cycle in the cycle that follows. A larger value on the  $45^{\circ }$ angle line corresponds to a higher likelihood of a repeated trajectory. It is clear from this plot that linear, oval, chevron and figure-eight trajectories occur over longer periods of oscillations, and once the system starts following one of them, it follows the same trajectory over several cycles, while teardrop, three-point and five-point trajectories occur more during transition from one type of trajectory to another one, and do not last long. Clearly, the exact trajectories that the hydrofoil follows can change if the relative size of the hydrofoil and the cylinder changes. In our experiments, the cylinder diameter was slightly smaller than the hydrofoil's chord. A larger cylinder would have resulted in shedding of larger vortices in the wake, which could have influenced the hydrofoil differently.
A map of the observed trajectory in each cycle versus the trajectory observed in the preceding cycle in the response of the hydrofoil in the wake of a fixed cylinder.

3.4. Flow visualizations
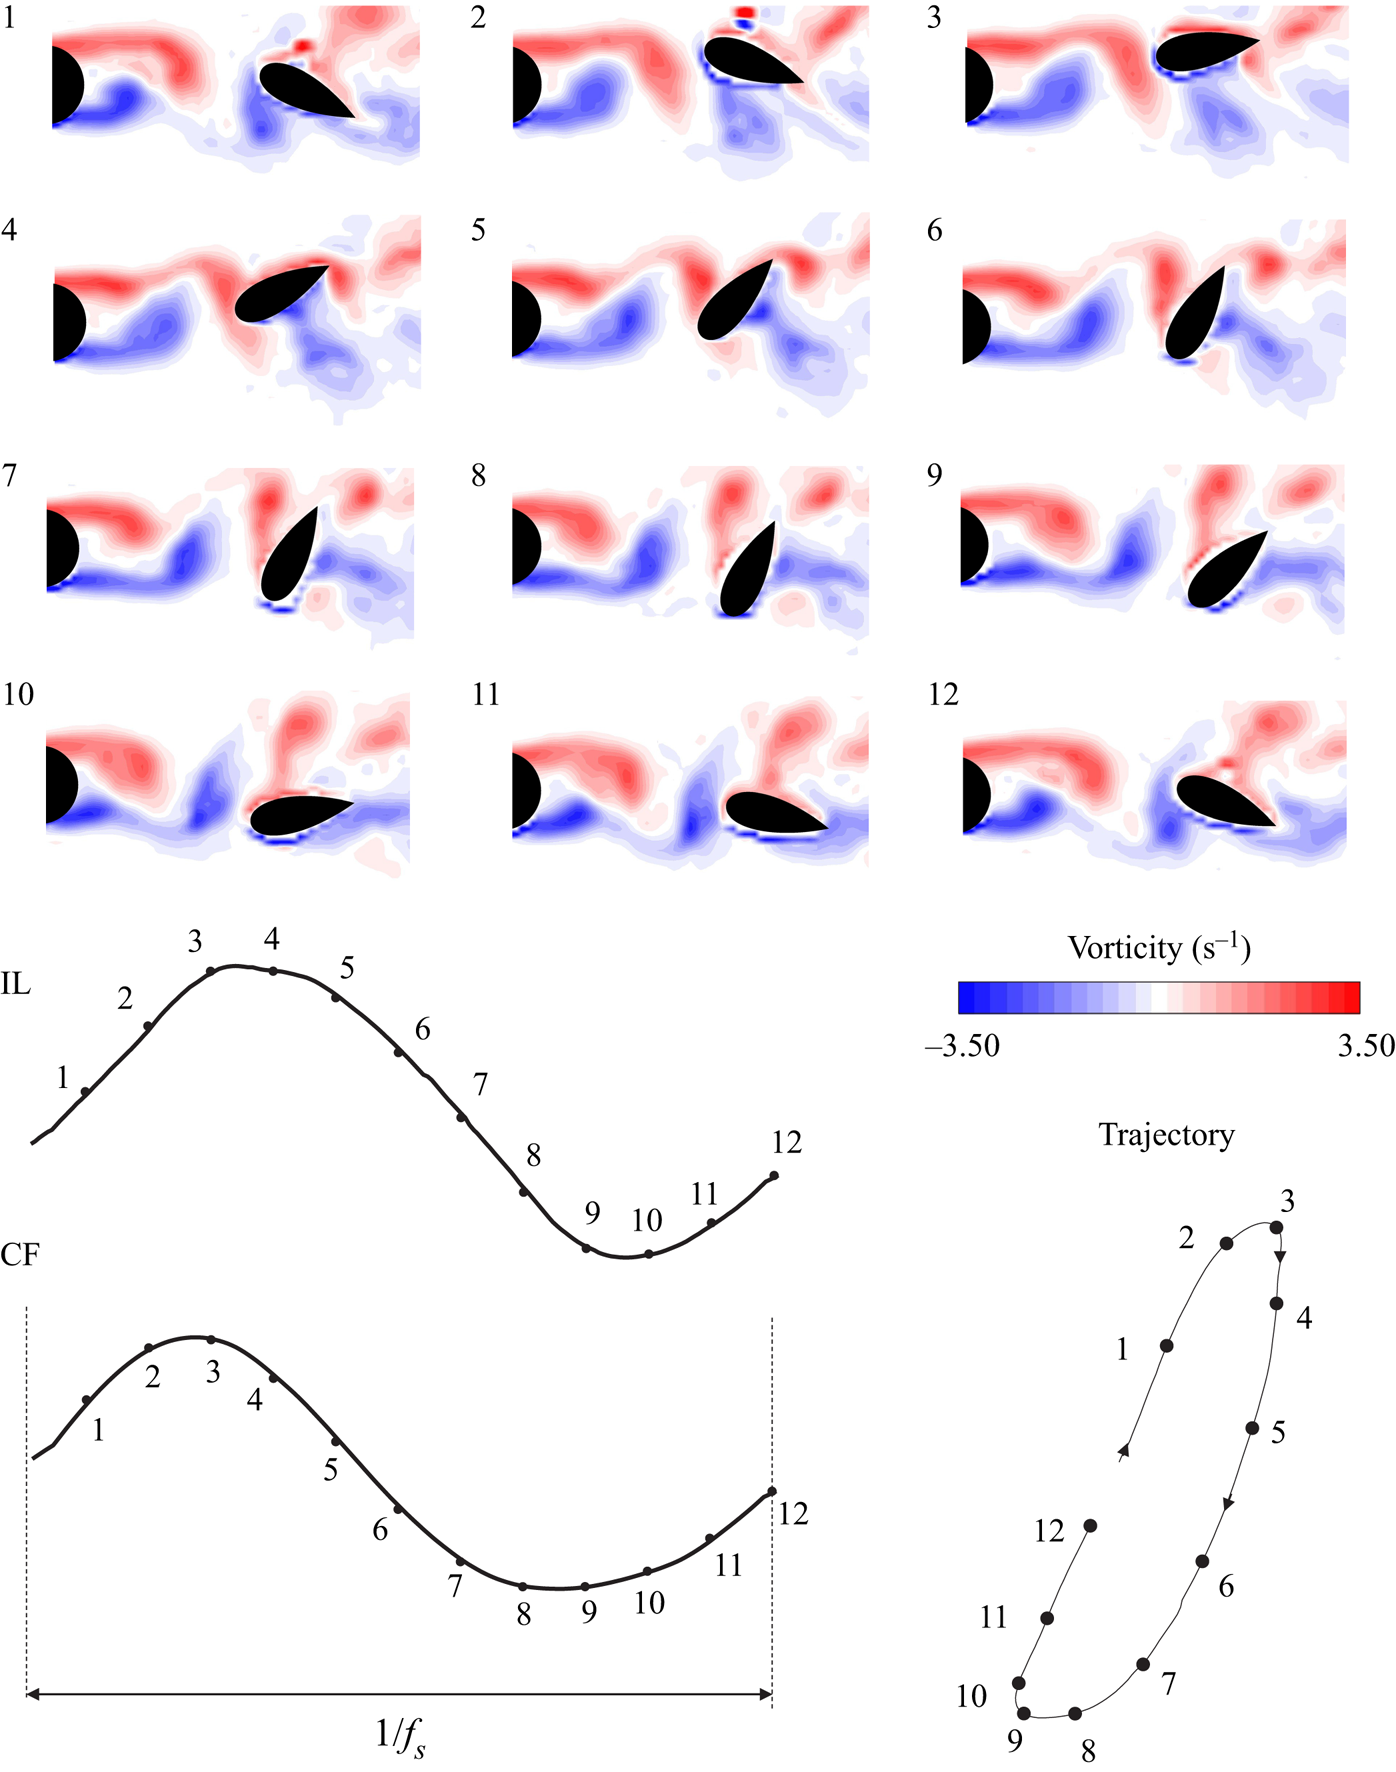
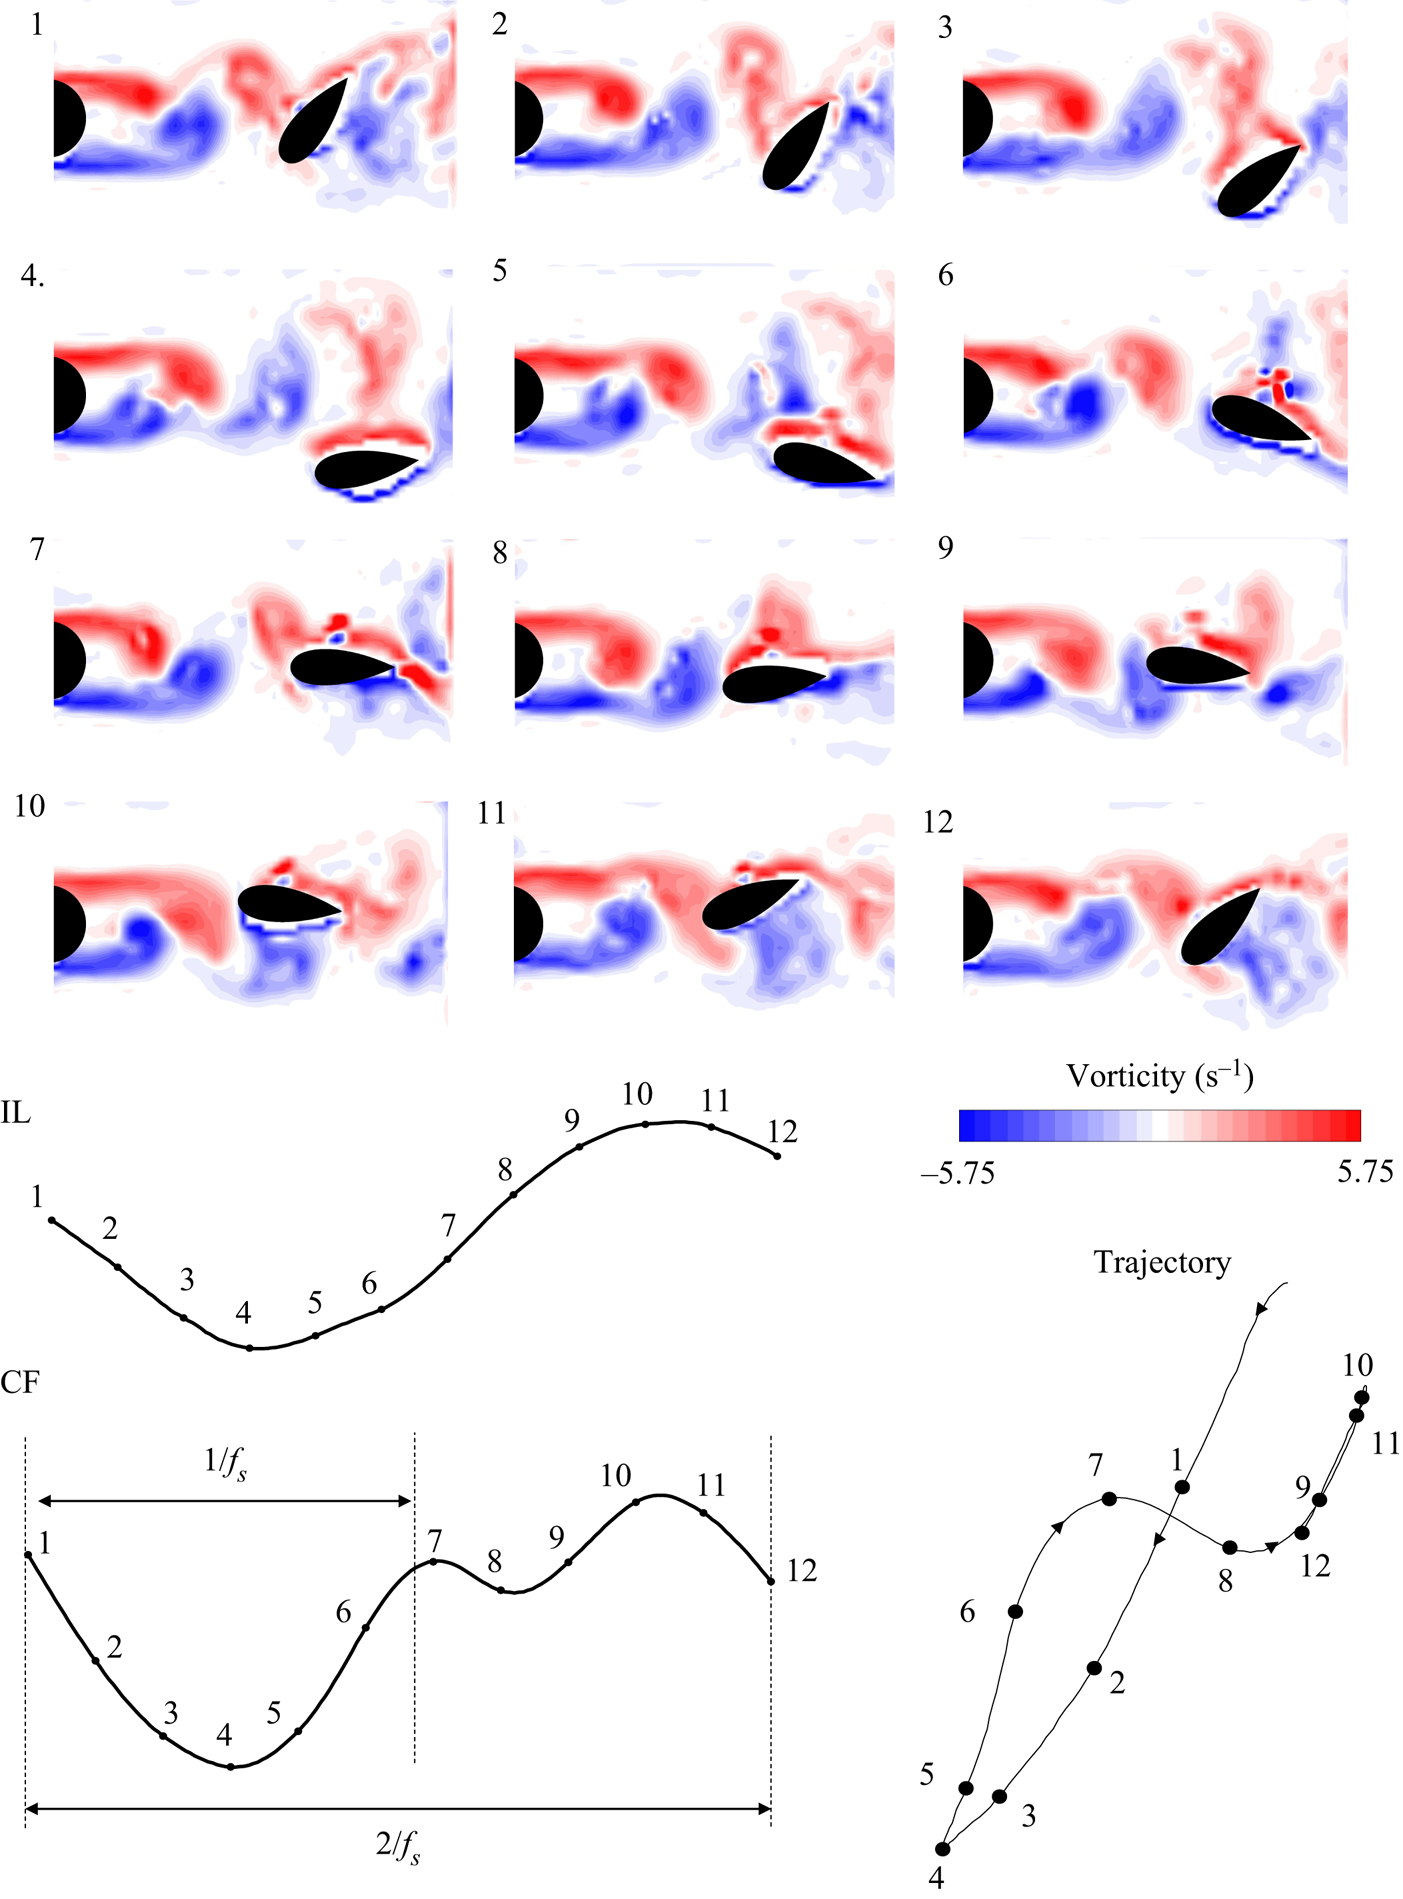
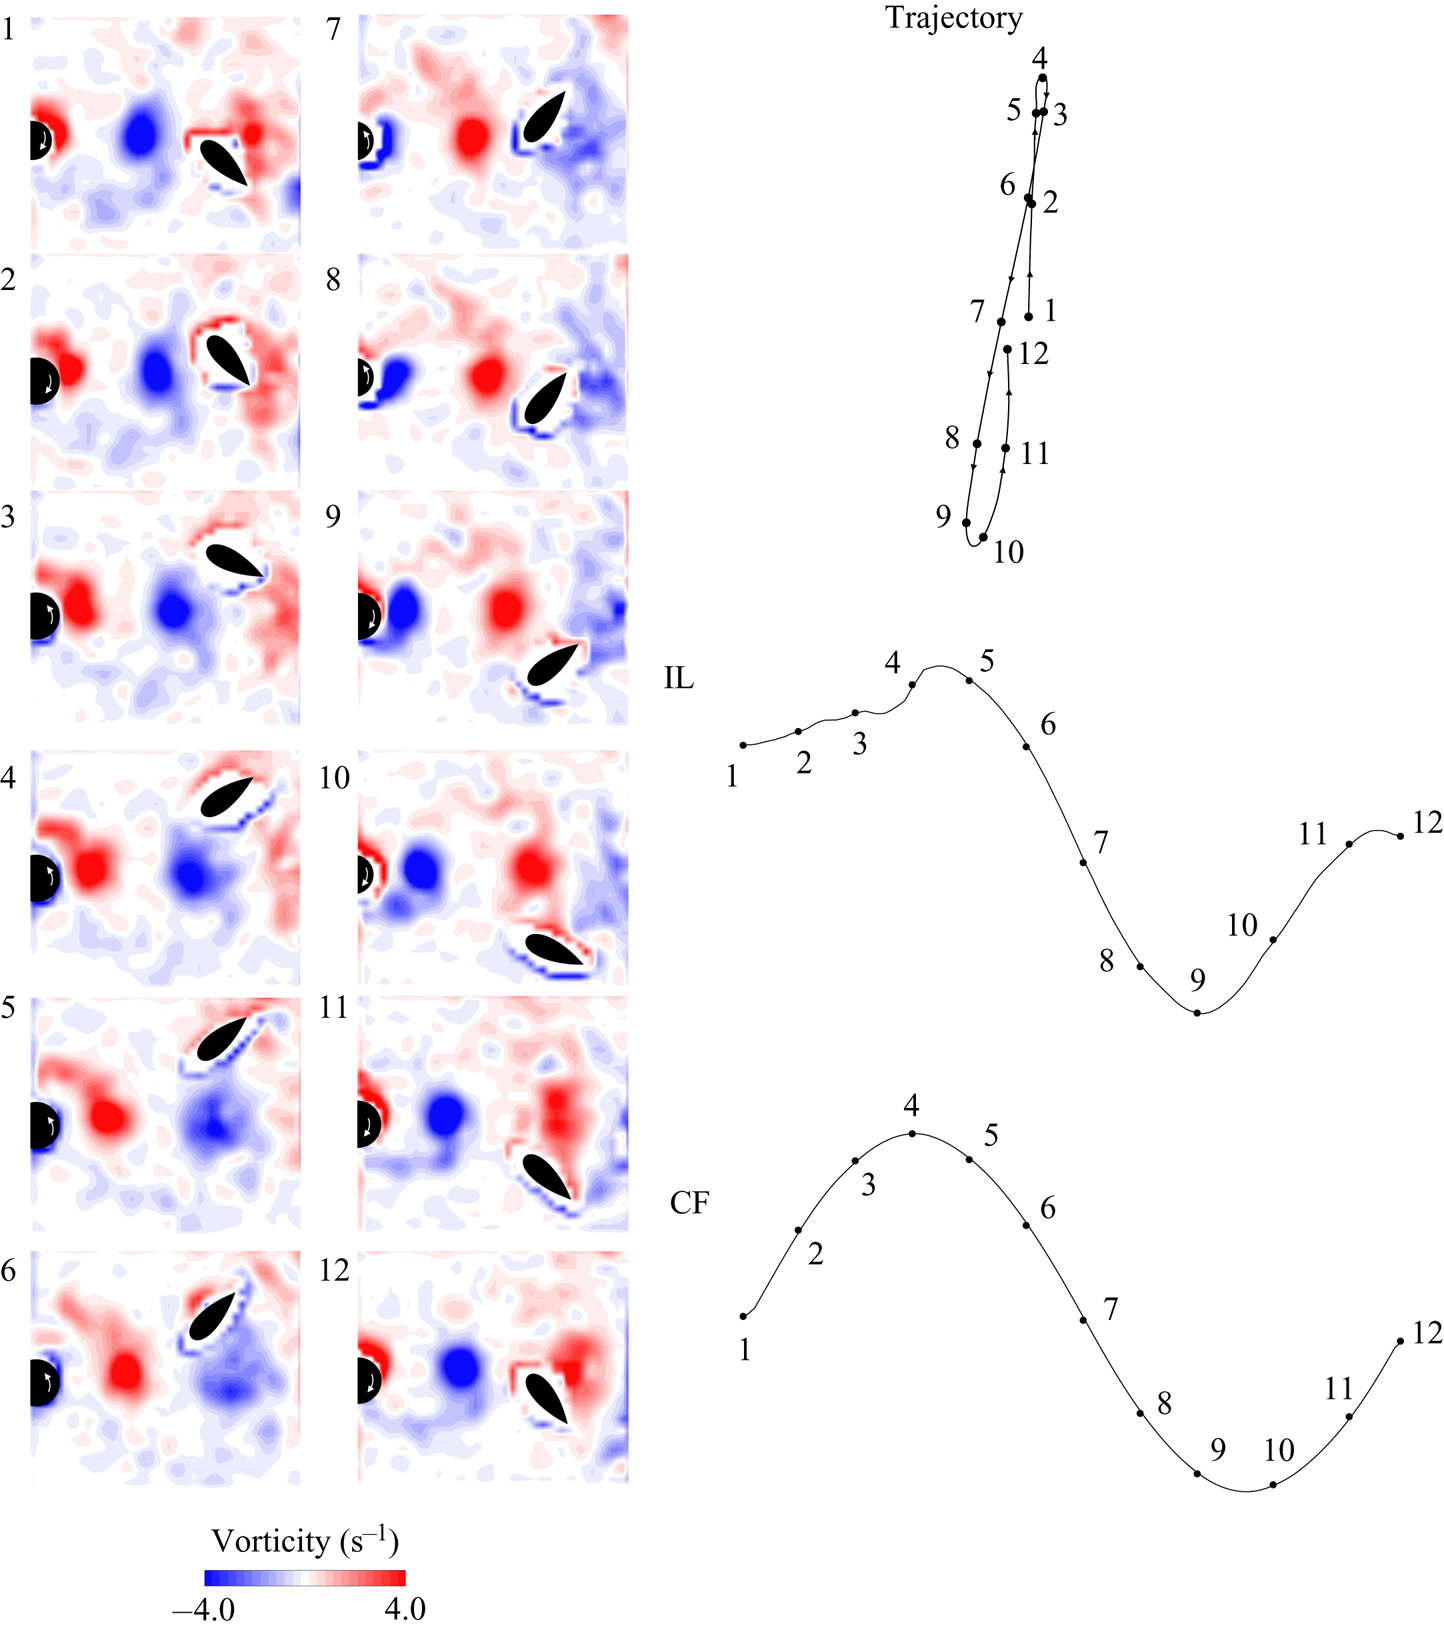
In this section we discuss the details of how the vortices that are shed in the wake of the fixed cylinder interact with the hydrofoil, by focusing on two sample cases from regions I and III of the response. Figure 6 shows snapshots of a case from region I in which the hydrofoil follows an oval trajectory, and figure 7 shows snapshots of a case from region III in which the hydrofoil follows a figure-eight trajectory. In both figures, the interactions between the vortices and the hydrofoil are presented in a series of 12 snapshots of the wake, which correspond to one complete cycle of oscillations. The IL and CF oscillations as well as the trajectories are shown in the figures, with numbers that correspond to the visualization snapshots. In all these snapshots, the two vortices that are shed from the cylinder are clearly visible with the colour red corresponding to the positive (clockwise, CW) vortex and the colour blue corresponding to the negative (counterclockwise, CCW) vortex.
The interactions of the hydrofoil with the vortices in the wake of the fixed cylinder in a sample case of region I, together with the IL and CF time histories and the hydrofoil's trajectory. See supplementary movie 1 available at https://doi.org/10.1017/jfm.2021.539 for an animation of the bubble image velocimetry (BIV) results.

The interactions of the hydrofoil with the vortices in the wake of the fixed cylinder in a sample case of region III, together with the IL and CF time histories and the hydrofoil's trajectory. See supplementary movie 2 for an animation of the BIV results.

In snapshot 1 of figure 6, the hydrofoil interacts with the negative (CCW) vortex. The presence of the negative vortex causes the hydrofoil to move in the positive IL direction (the direction of flow) and upward in the CF direction up to the hydrofoil's maximum amplitudes in both directions (snapshots 2 and 3). After rounding the top of the vortex, the hydrofoil moves downward and upstream (snapshot 4), and starts its interaction with the positive (CW) vortex. This vortex then causes further displacement of the hydrofoil in the same directions. In snapshots 5–7, the hydrofoil moves downward in the CF direction and downstream in the IL direction as it is driven by both the CW and the CCW vortices. In snapshots 8–10, the CW vortex is deflected away from the hydrofoil, and the hydrofoil rotates in the CW direction and aligns itself with the direction of the incoming flow momentarily, before it returns to the same position as snapshot 1 in snapshot 12, and repeats the same cycle.
In the first two snapshots of figure 7, the hydrofoil interacts with the CW vortex, and moves downward in the CF direction and upstream in the IL direction (snapshot 3). Subsequently, the hydrofoil is at its lowest CF point in snapshot 4. The most striking difference in this case compared with the sample case from region I is that the hydrofoil traverses below the CCW vortex (snapshots 5 and 6) before again interacting with the next CW vortex. In interacting with the next CW vortex, snapshots 7 and 8, the hydrofoil is again within the wake of the cylinder, and in snapshots 9–12 the hydrofoil rotates with the CCW vortex and is driven to follow a path between the CW and CCW vortices before returning to the same initial angle and CF position as snapshot 1.
These wake visualizations at regions I and III clarify the reason why the frequency of the hydrofoil's oscillations changes from a 1:1 ratio at the Strouhal frequency to another 1:1 ratio, but at half the Strouhal frequency as the reduced velocity is increased. At lower reduced velocities (region I), the hydrofoil is affected by both vortices that are shed from the two sides of the cylinder in each cycle of its oscillations, resulting in a fluctuating force with the same frequency as the shedding frequency in both the IL and CF directions. In region III, the hydrofoil interacts with only one of the vortices that are shed in each cycle of its oscillations and misses the second vortex, and as a result the external force that acts on the hydrofoil has a frequency equal to half the shedding frequency.
4. The response of the hydrofoil in the wake of a cylinder rotating in a constant direction
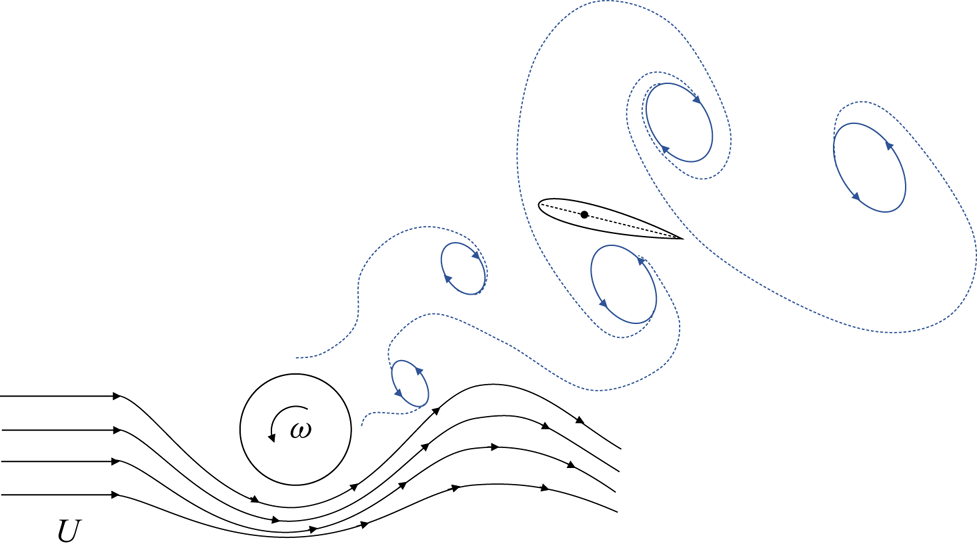
In the second series of experiments, we considered the response of the hydrofoil in the wake of the cylinder as the cylinder was forced to rotate in one direction. A schematic of this case is shown in figure 8. These experiments were conducted at a single reduced velocity,  $U^*=2.5$, and for increasing rotation rates. The rotation rate,
 $\alpha = D \omega / 2 U$, was defined as the ratio of the surface velocity and free-stream velocity, and was increased from 0 to 7.
A schematic of the second series of experiments in which the hydrofoil was placed in the wake of a cylinder as the cylinder was forced to rotate in one direction.

4.1. The hydrofoil's displacement
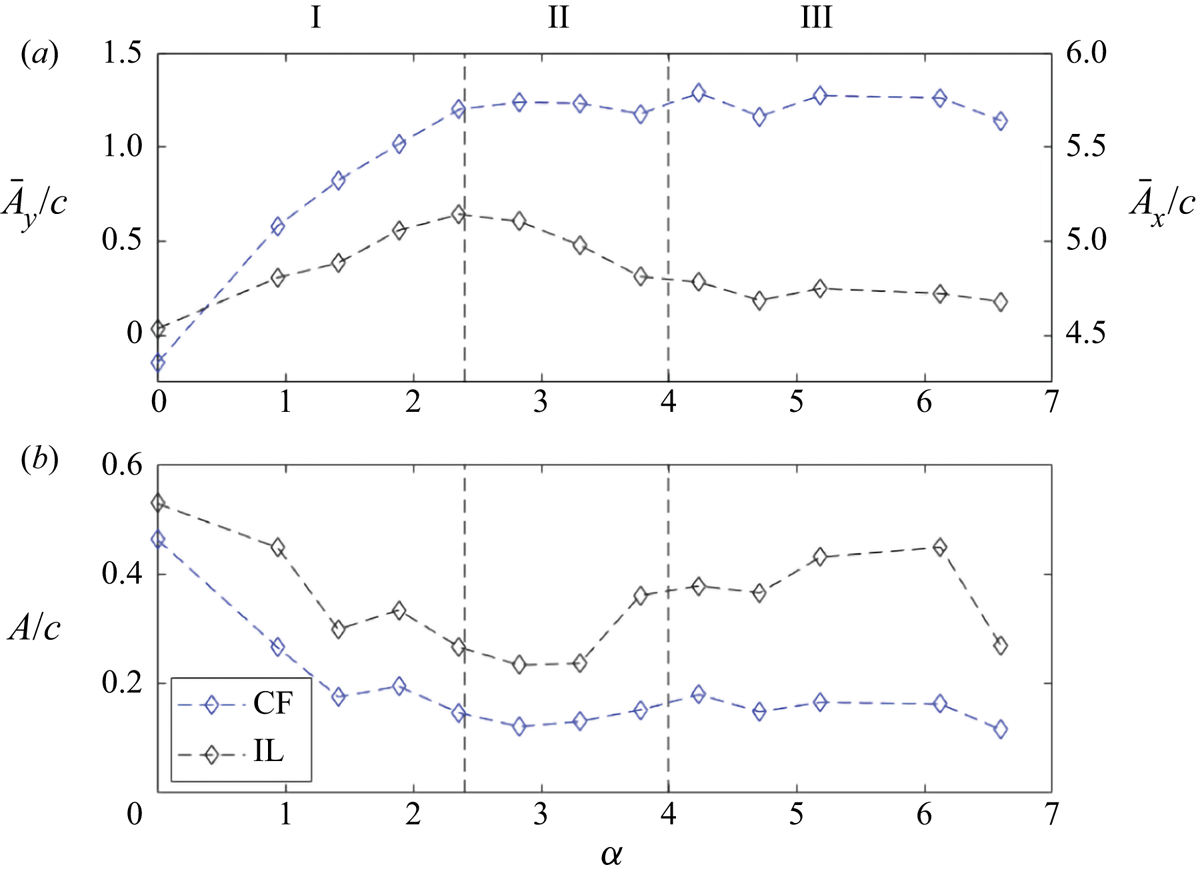
Figure 9 shows how the mean and fluctuating amplitudes of the hydrofoil's oscillations in the CF and IL directions change versus the rotation rate. It is clear from figure 9(a) that the mean displacements of the hydrofoil in the CF and IL directions increase with  $\alpha$ until
 $\alpha \approx 2.4$. For higher values of
 $\alpha$, the mean value of the CF displacement stays more or less constant, but the mean value of the IL displacement decreases first and then stays constant for
 $\alpha >4$. Oscillation amplitudes are relatively large initially for no rotation (
 $\alpha =0$) (figure 9b). As the rotation is applied, the oscillation amplitudes in both the CF and IL directions decrease. By
 $\alpha =2.4$, the oscillation amplitudes in both directions are smaller than the mean values of displacements in those respective directions. For higher rotation rates, a slight increase is observed in the CF amplitude oscillations, but no major change is observed in the IL amplitudes, both staying much smaller than the mean values for all rotation rates larger than
 $\alpha =2.4$.
The hydrofoil's response in the wake of a cylinder forced to rotate in one direction. (a) Mean and (b) fluctuating values of the CF and IL displacements of the hydrofoil versus the rotation rate,  $\alpha$. Vertical dashed lines at
 $\alpha = 2.4$ and
 $\alpha = 4$ highlight the three regions of response.

The response of the hydrofoil can be related to the wake that is observed for the cylinder. It has been shown previously (Mittal & Kumar Reference Mittal and Kumar2003; Seyed-Aghazadeh & Modarres-Sadeghi Reference Seyed-Aghazadeh and Modarres-Sadeghi2015) that for a cylinder forced to rotate in one direction, such as the cylinder that we have used in the present work, an increase in the rotation rate results in the suppression of vortex shedding at  $\alpha =2.4$. This value corresponds to the critical value for
 $\alpha$ observed in the amplitude plots of figure 9 here, which marks the end of an increase in the mean value of displacement in both the CF and IL directions and a decrease of the amplitude of oscillations in both directions. The decrease in the amplitude of oscillations is due to the suppression of shedding in the wake of the upstream cylinder. Overall, for
 $\alpha <2.4$ the hydrofoil's oscillations are due to the shedding of vortices that are observed in the wake of the cylinder. As the rotation rate increases, the amplitudes of these oscillations decrease until
 $\alpha =2.4$, where the vortex shedding is suppressed and as a result the amplitudes of oscillations decrease significantly. According to Mittal & Kumar (Reference Mittal and Kumar2003), at around
 $\alpha =4$, a large vortex forms in the wake of the rotating cylinder. This large vortex is formed around 5
 $D$ downstream the cylinder, which is approximately where the hydrofoil is located in the present experiments. The formation of this large vortex is due to the fact that at rotation rates larger than
 $\alpha =4$, the shear layers leave the cylinder on one side. We have also observed this change in the location where the shear layers leave the cylinder in our flow visualization, and as a result, a change in the response of the hydrofoil at approximately
 $\alpha =4$. Our flow visualizations reveal the differences in the wake of the cylinder in the three different regions identified in figure 9, as discussed in the following section.
4.2. Flow visualizations
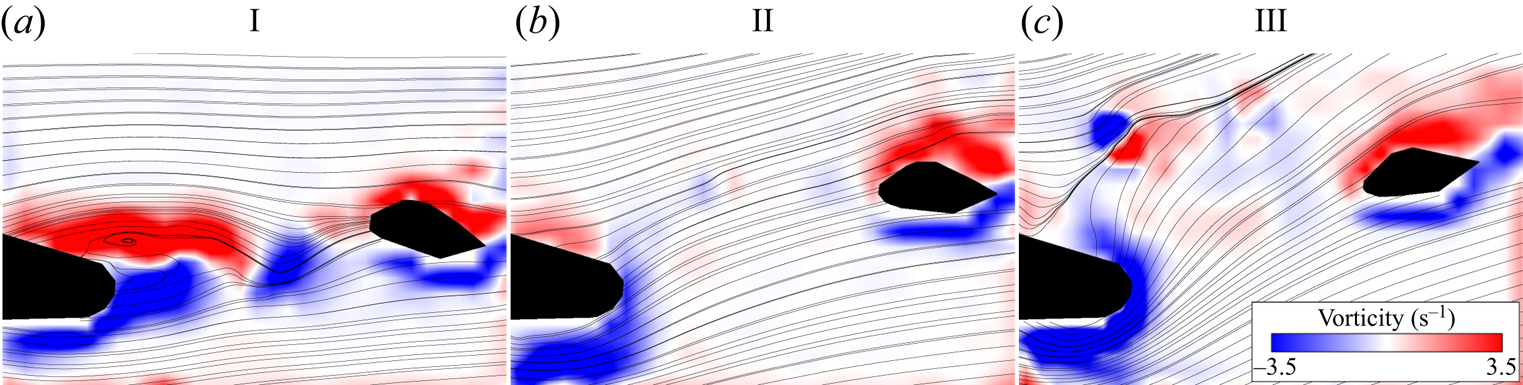
In figure 10(a), the shedding of vortices in the wake of the cylinder is clear. It is the interaction of these vortices with the hydrofoil that provides the oscillatory motion of the hydrofoil in region I. In region II (figure 10b), the vortices are suppressed, and the flow is deflected upward, causing the hydrofoil to move to one side. In region III, while the shedding of vortices similar to what we observe in region I is not observed, the large rotation rate has caused the boundary layer from the lower side of the cylinder to move all the way to its upper side, resulting in a separation point on the upper side of the cylinder, and a major deviation of the flow direction from the direction of the incoming flow.
Interactions of the hydrofoil with the wake of the cylinder rotating in one direction shown through the vorticity plots and streamlines in the three regions observed for the response of the hydrofoil: (a)  $\alpha =0.9$, region I, (b)
 $\alpha =2.8$, region II and (c)
 $\alpha =4.7$, region III.

5. The response of the hydrofoil in the wake of a cylinder forced to rotate periodically
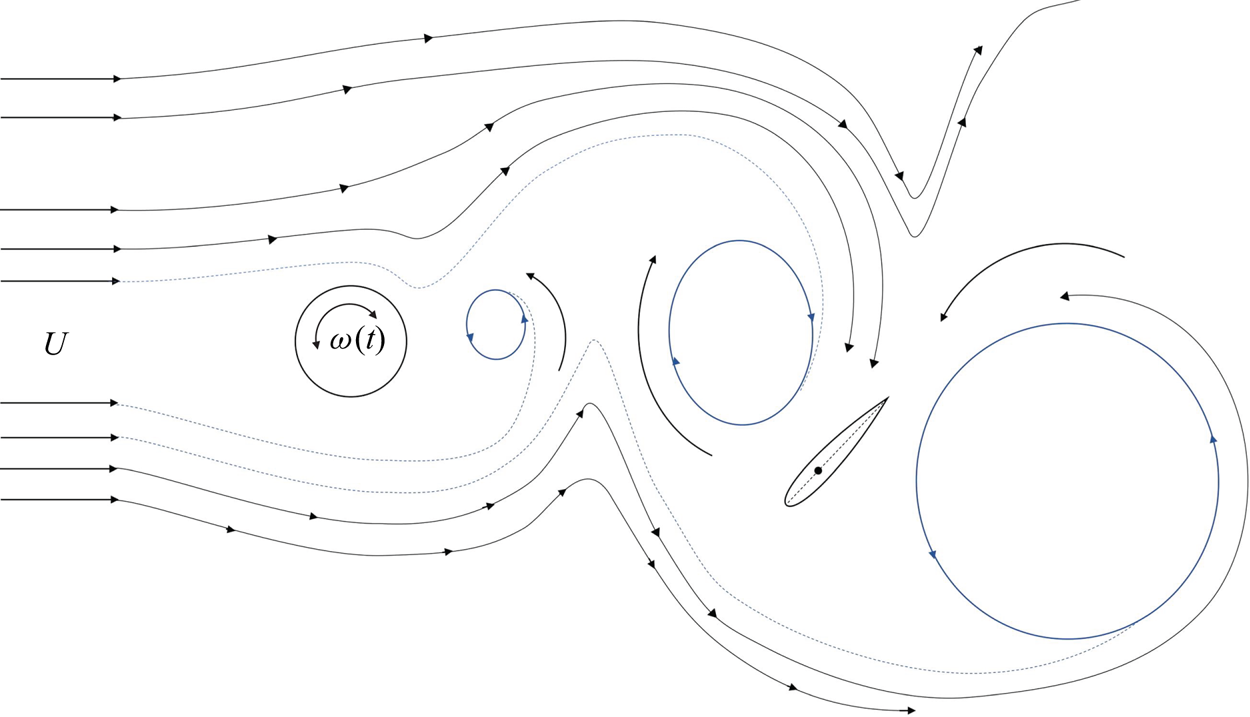
We performed a third series of experiments to investigate the response of the hydrofoil in the wake of a cylinder that was forced to rotate periodically, as opposed to the previous case where the cylinder was rotating in one direction only. A schematic of the experimental configuration is shown in figure 11 with a representation of the typical wake observed for this case. Experiments were performed at a constant reduced velocity of  $U^*=2.5$ and a constant rotation rate of
 $\alpha = 4.7$, while the rotation frequency, defined as
 $f^*_{cyl}=f_{cyl}D/U$, was varied from
 $f^*_{cyl}=0.058$ to 0.167, where
 $f_{cyl}$ is the imposed frequency of rotation in hertz and
 $U$ is the incoming flow velocity. With these parameters, we observed that the frequency of vortices that were shed in the wake was equal to the forcing frequency that we applied on the cylinder, and as a result the hydrofoil also experienced the same external frequency. Thus, we could control the frequency of flow forces that acted on the hydrofoil by controlling the rotation frequency of the cylinder.
A schematic of the third series of experiments in which the hydrofoil was placed in the wake of a cylinder as the cylinder was forced to rotate periodically.

5.1. Amplitude and frequency of response
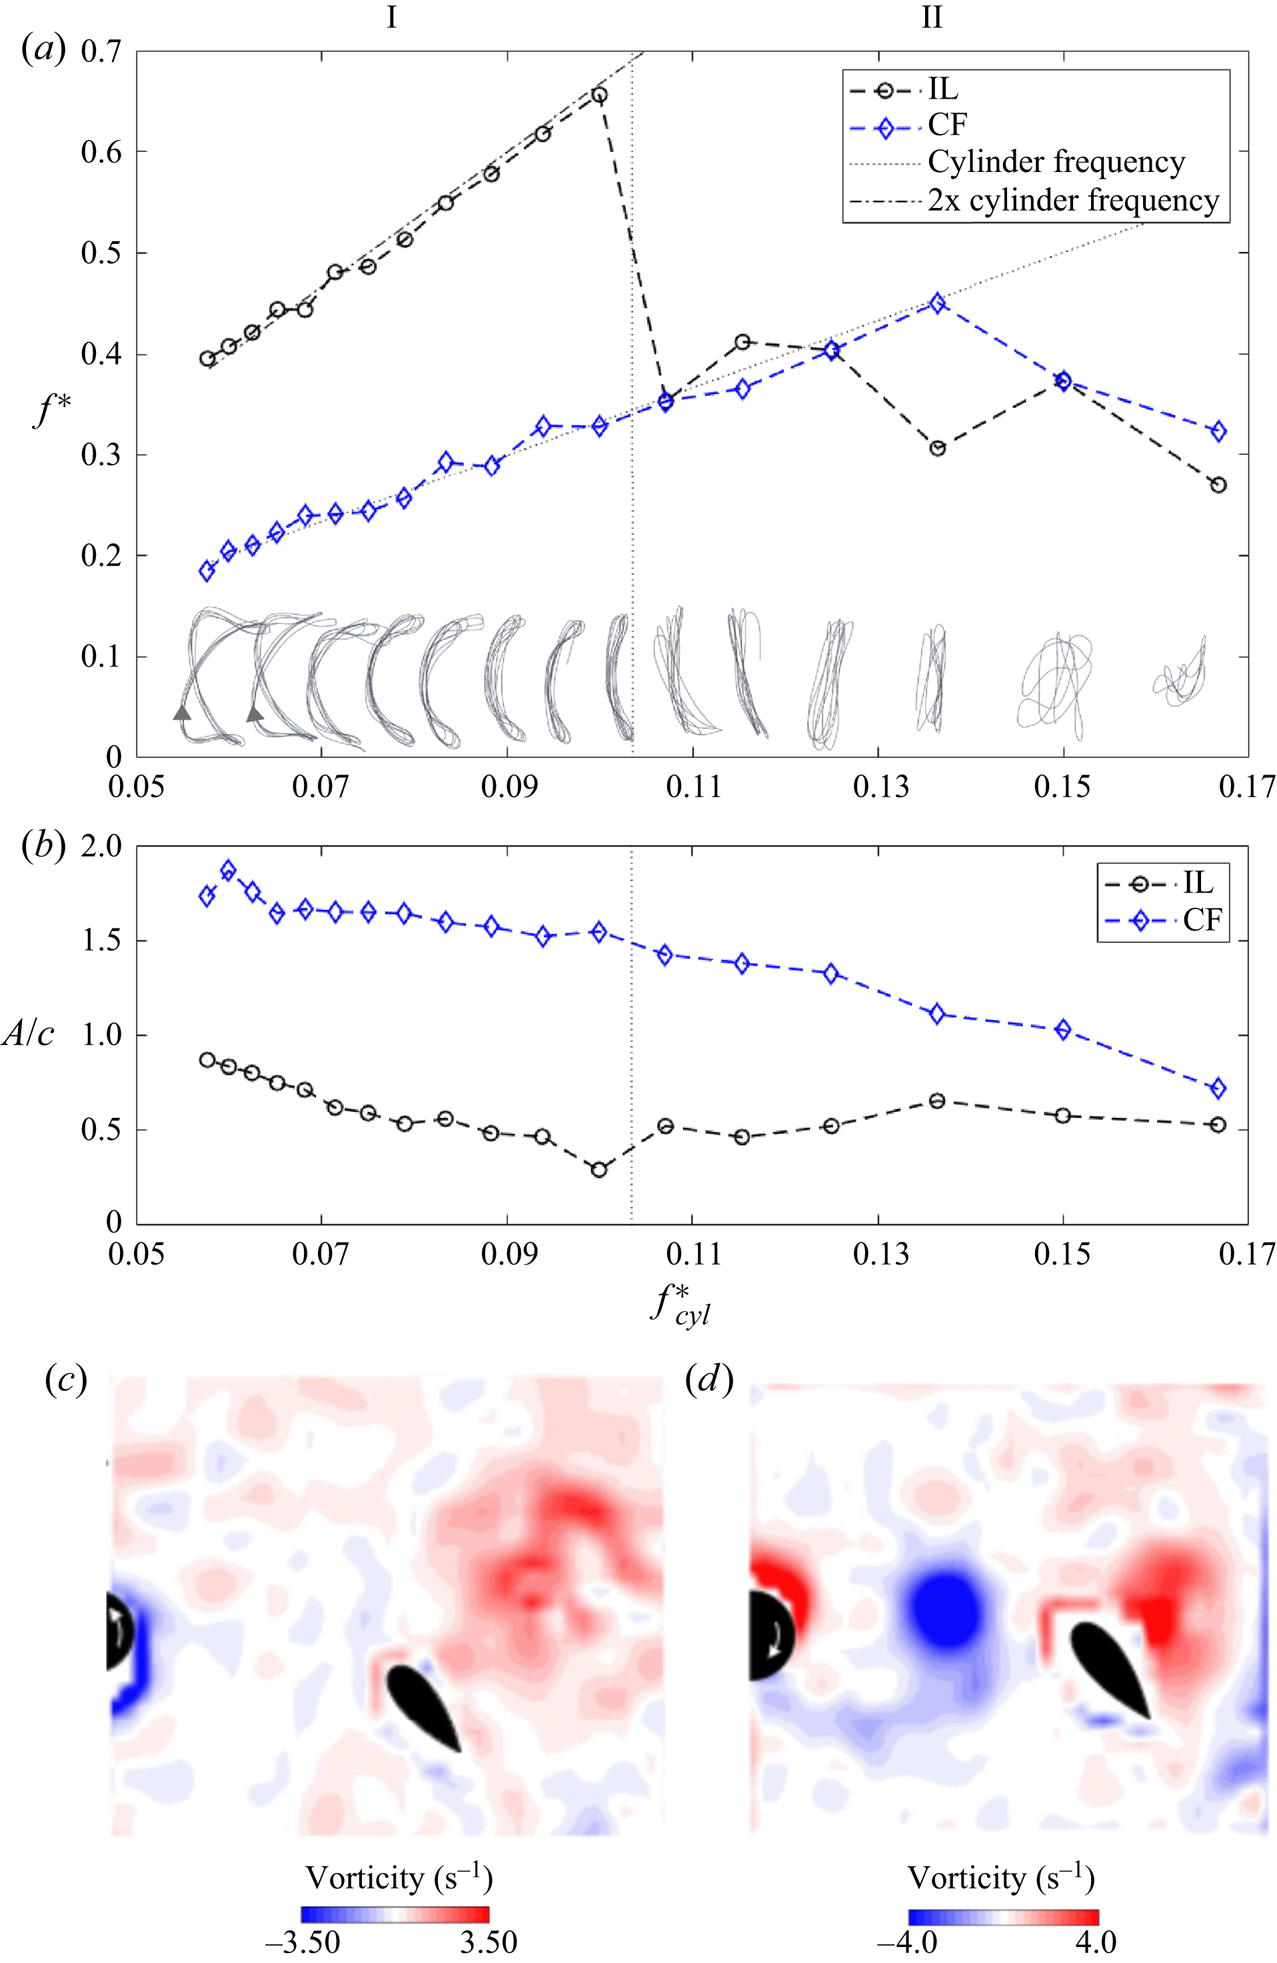
Figure 12 shows how the peak oscillation frequencies observed in the CF and IL directions change as the forcing frequency (and as a result the shedding frequency in the wake of the cylinder) is varied. In this plot, the oscillation frequency is normalized by the natural frequency in air,  $f^*=f/f_n$. Trajectories of the hydrofoil response are also shown in the figure. At lower cylinder frequencies, a 2:1 ratio between the IL and CF oscillation frequencies is observed. Within this range, the trajectories follow a figure-eight pattern, and the hydrofoil moves upstream when it is at the extremes of its CF displacement (the direction of arrows in the figure). The IL amplitude is initially very large (
 ${\approx }0.9c$) at approximately 50 % of the CF amplitude, resulting in wide figure-eight trajectories. As the forcing frequency is increased, while the 2:1 ratio between the IL and CF oscillation frequencies remains, the phasing between the IL and CF displacements changes such that the figure-eight trajectories resemble a crescent shape. Eventually, the IL amplitude decreases and the figure-eight trajectories become mainly vertical trajectories. This is then followed by a loss of the 2:1 ratio, which is replaced by a 1:1 ratio between the IL and CF displacement frequencies, resulting in trajectories that are mainly in the CF direction, and for higher forcing frequencies, trajectories that no longer follow a repeatable pattern. It is observed that as the forcing frequency is increased, both the CF and IL amplitudes decrease slightly in the range where a 2:1 frequency ratio is observed; however, they both are larger than their respective values in the range where the 2:1 ratio is lost. The CF amplitude decreases to values half of the initial values for higher forcing frequencies, while the IL amplitude goes through a relatively small, but noticeable decrease. The fact that a 2:1 ratio between the IL and CF oscillations results in larger amplitudes of oscillations in both directions has been observed and discussed before in studies of vortex-induced vibration (VIV) of a two-degree-of-freedom (2 DOF) cylinder in flow, a model problem in fluid–structure interactions (Dahl, Hover & Triantafyllou Reference Dahl, Hover and Triantafyllou2006; Dahl et al. Reference Dahl, Hover, Triantafyllou, Dong and Karniadakis2007, Reference Dahl, Hover, Triantafyllou and Oakley2010). Based on these studies, the 2:1 ratio is the desired ratio for a 2 DOF cylinder in flow: the shedding of vortices in the wake exerts forces at two times the shedding frequency in the IL direction and equal to the shedding frequency in the CF direction, and as a result the cylinder tends to follow a 2:1 ratio of oscillations more easily, and thus exhibits larger amplitudes of oscillations. The observation in the present work is very similar: the vortices that interact with the hydrofoil exert forces at two times the shedding frequency in the IL direction and equal to the shedding frequency in the CF direction, and as a result the hydrofoil exhibits a 2:1 frequency ratio between its IL and CF oscillations. Sample snapshots of the wake visualizations in the two regions of response (region I with 2:1 frequency ratio and region II with 1:1 frequency ratio) are given in figure 12(c,d). We will give more details of the mechanism by which these vortices interact with the hydrofoil when we discuss the flow visualization of this case.
The hydrofoil's response in the wake of a cylinder forced to rotate periodically. (a) Predominant frequency in the CFand IL directions versus the forcing frequency together with samples of trajectories. The two lines in the plot represent a 1:1 ratio between the dimensional output frequency and the dimensional input frequency (the lower line) and a 2:1 ratio (the upper line). (b) The amplitudes of oscillations in the CF and IL directions versusthe forcing frequency. Sample snapshots of flow visualizations for (c) region I and (d) region II.

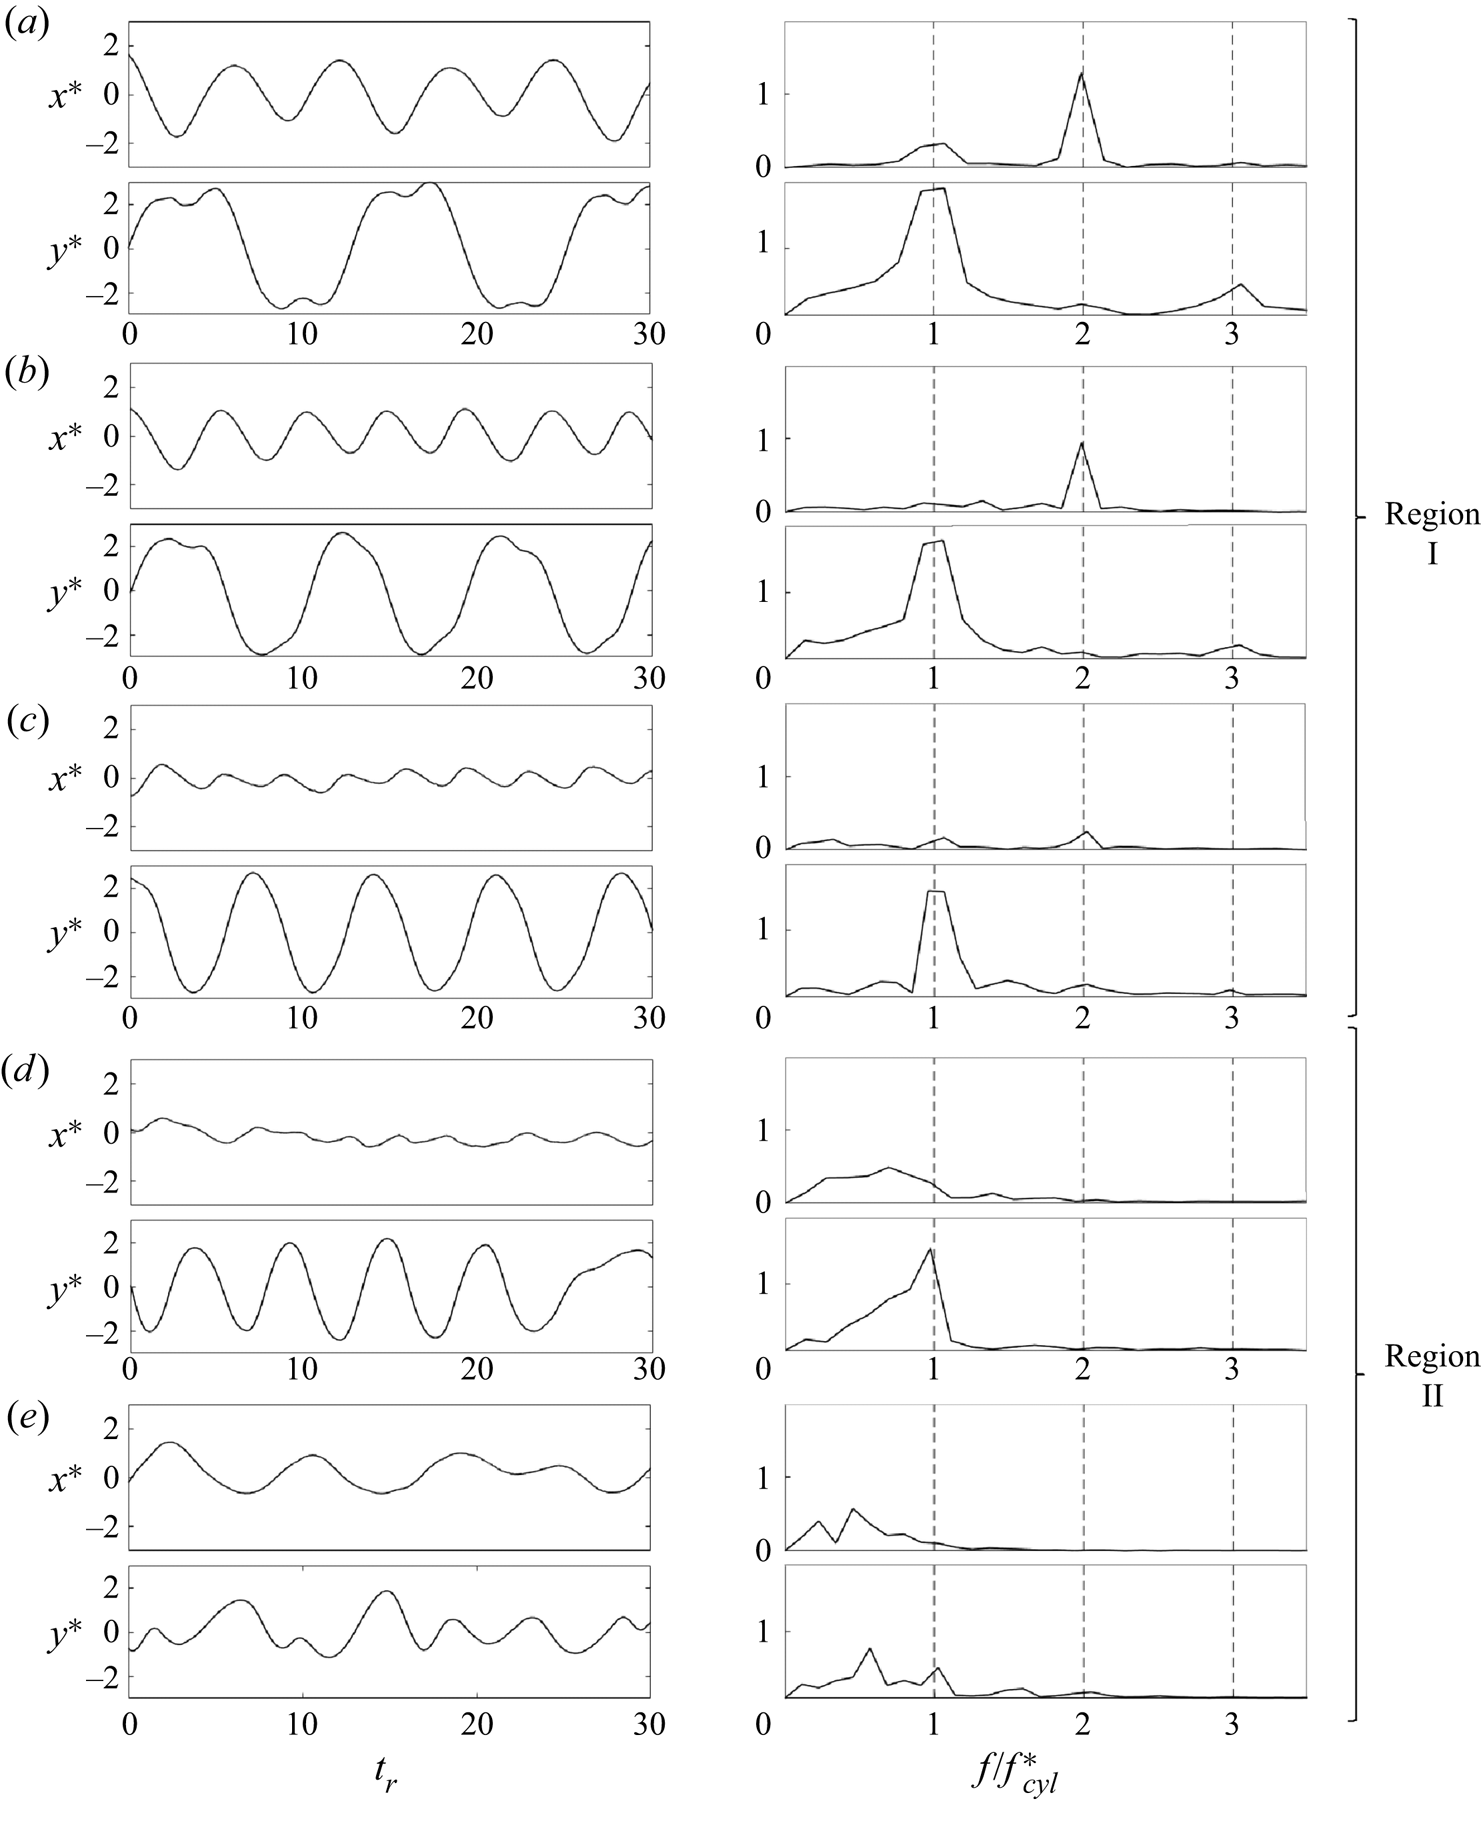
Figure 13 shows sample time histories of the CF and IL displacements of the hydrofoil for five different forcing frequencies. For the first two cases, where a figure-eight trajectory is observed in figure 12, the 2:1 ratio between the IL and CF oscillation frequencies is clear. In the CF frequency contents, besides the peak frequency that occurs at the forcing frequency, contributions at two times and three times the fundamental frequency are also observed. The contributions of these high-frequency contents are also visible in the amplitude plots of these CF displacements. Higher harmonics have been observed previously in the VIV response of a 2 DOF cylinder (Dahl et al. Reference Dahl, Hover, Triantafyllou and Oakley2010). In the VIV response of a cylinder, the presence of the second harmonic is attributed to the asymmetries in the wake (Du, Jing & Sun Reference Du, Jing and Sun2014) and the presence of the third harmonic is related to the shedding of triple vortices in the wake (Dahl et al. Reference Dahl, Hover, Triantafyllou, Dong and Karniadakis2007), or the angles that the fluctuating flow forces make with the CF and IL directions (Seyed-Aghazadeh et al. Reference Seyed-Aghazadeh, Carlson and Modarres-Sadeghi2017). In figure 13(c), a small second-harmonic frequency is still observed in the IL direction. This small peak disappears for higher forcing frequencies. Figure 13(d) shows a sample of cases where the motion is mainly in the CF direction, with a very small amplitude in the IL direction. At higher forcing frequencies (figure 13e), oscillations in both the CF and IL directions become of much lower frequency than before and occur at half the forcing frequency. This example corresponds to a case where the trajectory does not follow any repeatable pattern as shown in figure 12.
Time histories and their corresponding FFTs of the hydrofoil's response for various forcing frequencies of the upstream cylinder: (a)  $f^*_{cyl}=0.06$, (b)
 $f^*_{cyl}=0.08$, (c)
 $f^*_{cyl}=0.10$, (d)
 $f^*_{cyl}=0.125$ and (e)
 $f^*_{cyl}=0.17$.

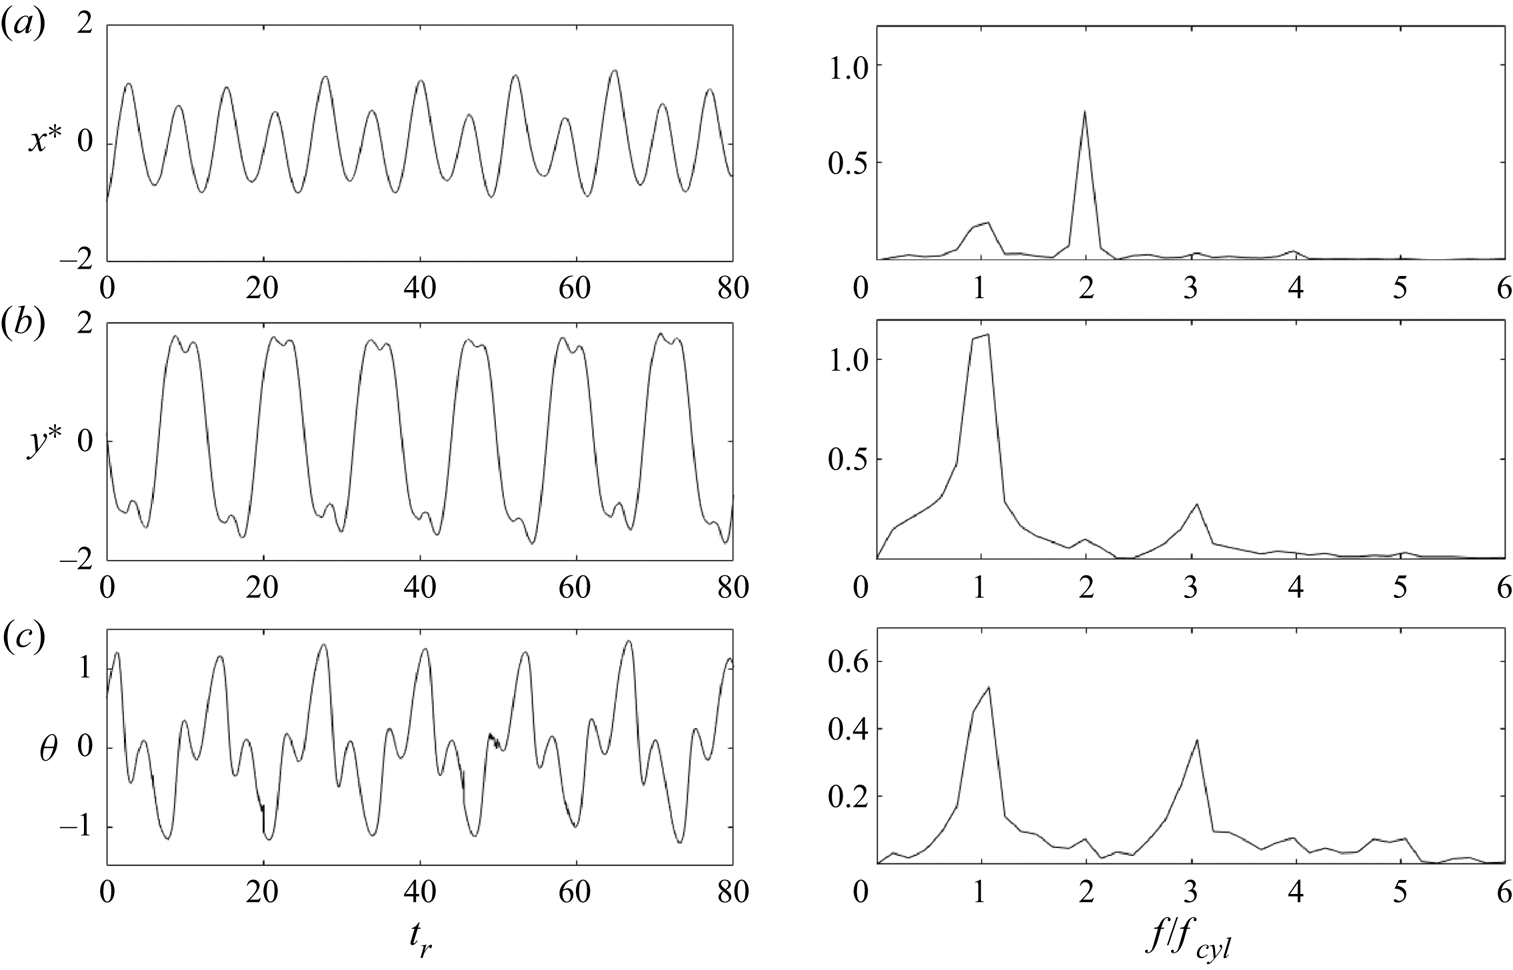
The third harmonic that is observed in the CF oscillations is even more significant in the torsional motion of the hydrofoil. Figure 14 shows the time histories for a sample case where a figure-eight motion has been observed. Clearly, the third-harmonic peak in the torsional direction is almost as large as the first-harmonic peak. This large contribution of the third harmonic is also clear in the time history of the torsional motion. It is worth mentioning that in previous studies of 2DOF VIV of a cylinder where the third harmonics had been observed, they had been observed mainly in the flow forces, and their contributions in the displacement frequencies were very small. Here, however, we observe very large third-harmonic contributions in the displacement time histories. The large third-harmonic component in the torsional oscillations of the hydrofoil explains the source of this third harmonic. When the hydrofoil goes across the wake, its angle of attack is at its maximum, resulting in the hydrofoil moving almost perpendicular to the direction of the incoming flow. Then as the hydrofoil reaches its maximum CF displacement, it rotates and its angle of attack decreases, enabling the hydrofoil to travel upstream in a direction almost parallel to the direction of the incoming flow. As the hydrofoil levels out after traversing the wake, it undergoes one cycle of small-amplitude oscillations about the zero angle of attack, as shown in figure 14(c). After this small-amplitude oscillation, the hydrofoil continues its motion in the CF direction towards the other extreme of the CF amplitude, therefore creating a third-harmonic component in the frequency of its oscillations.
The (a) IL, (b) CF and (c) torsional displacements together with their corresponding FFT plots for the hydrofoil's response in the wake of a cylinder that is forced to rotate at a frequency of  $f^*_{cyl}=0.06$.

As the forcing frequency is increased, there is not enough dwell time between the shed vortices, and as a result the hydrofoil cannot undergo the small-amplitude oscillation about its torsional degree of freedom when it reaches the extremes of its CF oscillations, and the third harmonic in the CF direction disappears. This occurs around  $f^*_{cyl}=0.09$, where the loops of the figure-eight trajectory collapse and the trajectory becomes C-shaped. Increasing the forcing frequency further reduces the dwell time between shedding of vortices even more, such that the hydrofoil cannot recover its upstream motion at the extremes of its CF oscillations, and therefore the C-shaped trajectory is flattened and by
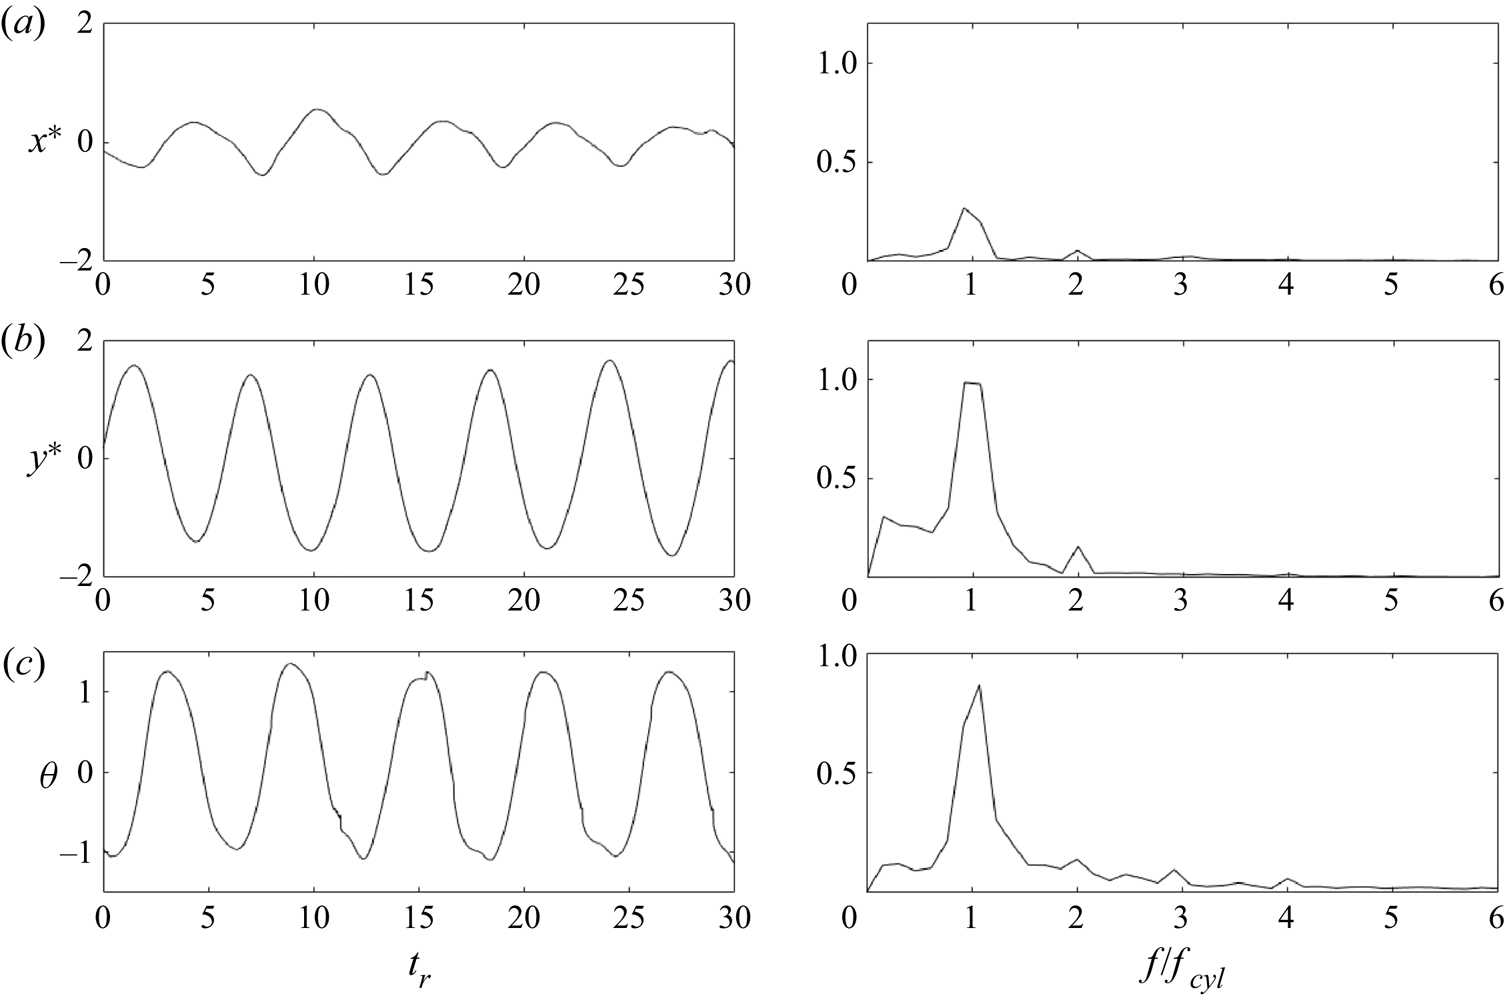
 $f^*_{cyl}=0.11$ the trajectory is mainly in the CF direction only. A sample of a case where the CF, IL and torsional oscillations all exhibit the same peak frequency is shown in figure 15 for
 $f^*_{cyl}=0.125$. This trend holds up to an external frequency of
 $f^*_{cyl}=0.14$, where the trajectory loses its coherence.
The (a) IL, (b) CF and (c) torsional displacements together with their corresponding FFT plots for the hydrofoil's response in the wake of a cylinder that is forced to rotate at a frequency of  $f^*_{cyl}=0.125$.

5.2. Flow visualizations
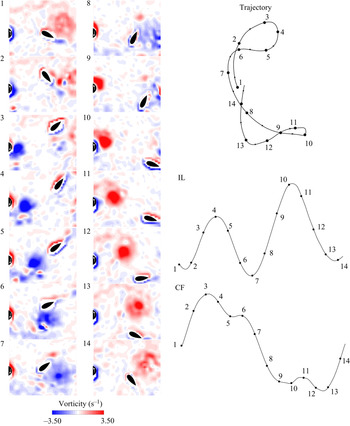
A series of snapshots of the cylinder's wake when a figure-eight trajectory is observed are shown in figure 16. These snapshots are for the case of  $f^*_{cyl}=0.06$, and they cover one complete cycle of oscillations. Snapshot 1 in the figure corresponds to the time in the cycle when the hydrofoil crosses the zero CF amplitude as it moves upward. At this instant, a large CW vortex is observed downstream of the hydrofoil, and the hydrofoil is attracted to this vortex and moves towards it, and as a result it moves both upward and to the right. As it reaches its maximum CF displacement, the hydrofoil rotates and starts moving downward (snapshots 2 and 3). At the same time, a CCW vortex is shed from the lower side of the cylinder and moves towards the hydrofoil (snapshot 4). The hydrofoil rides on top of this vortex on its way down (snapshot 5), and the vortex passes on the lower side of the hydrofoil and travels to its wake (snapshot 6). Then the CCW vortex is on the lower right side of the hydrofoil (snapshot 7) and the hydrofoil is attracted to it and as a result moves to the right again (snapshots 8 and 9). When the CCW vortex is far from the hydrofoil, the hydrofoil stops its motion in the positive IL direction, rotates and moves upward (snapshots 10 and 11). At the same time, a CW vortex is shed from the upper side of the cylinder (snapshot 12). This CW vortex moves towards the hydrofoil. The hydrofoil moves around it (snapshot 13), and the CW vortex goes to the top right of the hydrofoil (snapshot 14), and the hydrofoil is attracted to it, and this brings the hydrofoil to the beginning of its cycle (snapshot 1). These visualizations explain the nature of the 2:1 frequency ratio that has been observed in the response of the system. The two vortices that are shed from the cylinder force the hydrofoil to go to the extremes of its IL oscillations twice over one cycle of its oscillations in the CF direction. In essence, this is very similar to the reason a 2:1 ratio is observed in the frequency response of a 2 DOF cylinder undergoing VIV: the shedding frequency in the IL direction is twice that in the CF direction, and as a result a 2:1 ratio is observed. Here, the two vortices that are shed from the two sides of the cylinder have symmetric influences on the hydrofoil in the CF direction, but identical influences in the IL direction.
A series of BIV wake visualization snapshots for a single period of the hydrofoil's response in the wake of a cylinder that is forced to rotate at  $f^*_{cyl}=0.06$, when a figure-eight response is observed. See supplementary movie 3 for an animation of the BIV results.

Figure 17 shows a series of snapshots of the wake visualization for a case where a 1:1 frequency ratio between the IL and CF oscillations is observed. These snapshots correspond to a case with  $f^*_{cyl}=0.125$. In snapshot 1, the hydrofoil is located at its zero CF amplitude location and moves upward. At this instant, a CW vortex is observed in the wake of the hydrofoil and a CCW vortex is approaching the hydrofoil, resulting in a hydrofoil that is encompassed by two counter-rotating vortices located at approximately the same vertical locations. As a result, the overall force that acts on the hydrofoil from these two vortices in the IL direction is negligible, and the main flow force is in the CF direction. The hydrofoil then travels all the way to the upper extreme of its CF amplitude (snapshots 2 and 3), then it rotates (snapshot 4) and rides on the CCW vortex that was shed from the lower side of the cylinder (snapshots 5 and 6). As the hydrofoil finds its way around the CCW vortex, another CW vortex is already shed from the upper side of the cylinder and interacts with the hydrofoil (snapshot 7) at approximately the same vertical location as the previous two vortices (i.e. at a location of
 $y \approx 0$). Then the hydrofoil finds itself between two counter-rotating vortices again (snapshot 8) and travels downward to the lower end of its CF oscillations (snapshot 9), where it rotates and starts its movement upward (snapshots 10 and 11). At the same time, a second CCW vortex is shed from the lower side of the cylinder, and the hydrofoil finds itself between two counter-rotating vortices, rotating in the same directions as the vortices observed in snapshot 1, and the loop continues.
A series of BIV wake visualization snapshots for a single period of the hydrofoil's response in the wake of a cylinder that is forced to rotate at  $f^*_{cyl}=0.125$, when a linear response is observed. See supplementary movie 4 for an animation of the BIV results.

The differences in the wake of the cylinder in the two cases are clear in figures 16 and 17. As the forcing frequency is increased, the frequency of shedding of vortices in the wake increases. Besides the increase in the frequency, the width of the wake decreases and the vortices are shed closer to the centre of the wake at higher forcing frequencies. This decrease in the width of the wake with increasing forcing frequency has also been observed by Tokumaru & Dimotakis (Reference Tokumaru and Dimotakis1991). The combination of these two effects results in the change in the type of trajectories that we have observed. For lower frequencies, where the vortices are shed at lower frequencies and at the upper right and the lower right of the cylinder, the snapshots of figure 16 show how the hydrofoil interacts mainly with one vortex at any given time, and is influenced by that vortex. For higher forcing frequencies, however, the vortices are shed at higher frequencies and at the centre of the wake, causing the hydrofoil to interact with two vortices simultaneously at any given time as is clearly observed in snapshots of visualizations in figure 17. This interaction with two vortices at the same time then results in the same frequency of oscillations in both the CF and IL directions in the response of the hydrofoil.
6. Conclusions
We have studied the dynamics of a hydrofoil free to oscillate in a plane and placed in the wake of a cylinder when the cylinder is (i) fixed, (ii) forced to rotate in one direction or (iii) forced to rotate periodically. The goal of this study is to investigate how the motion of the hydrofoil is influenced when the wake of the cylinder is altered.
When the cylinder is fixed, at lower reduced velocities, the hydrofoil oscillates with a frequency equal to the shedding frequency in both the CF and IL directions. As the reduced velocity is increased, the response of the hydrofoil transitions to another 1:1 frequency ratio, but this time both frequencies are at half the shedding frequency. In this region, the hydrofoil is moved to the extreme of its CF oscillations in each cycle and does not interact with one of the two vortices that are shed in each cycle, and therefore oscillates with a frequency that is half of the shedding frequency. We have identified seven different types of trajectories in the response of the hydrofoil placed in the wake of a fixed cylinder.
When we force the cylinder to rotate in one direction, for rotation rates smaller than  $\alpha = 2.4$, we observe oscillatory response of the hydrofoil, since vortices are still observed in the wake of the cylinder in this range. With increasing the rotation rate, the amplitude of oscillations decreases and the mean value of the hydrofoil's displacement increases. For rotation rates higher than
 $\alpha = 2.4$, the amplitude of oscillations is very small, but relatively large mean displacements are observed in the CF direction. Flow visualizations show that the hydrofoil follows the deflected wake of the cylinder at these higher rotation rates and moves to the side, and since there is no longer shedding in the wake, the hydrofoil follows a mainly static response.
When we control the shedding frequency by forcing the cylinder to oscillate periodically, at low forcing frequencies, the hydrofoil interacts with one vortex at each half cycle of its oscillations and follows a figure-eight trajectory with large amplitudes of oscillations in both the CF and IL directions (approximately twice the chord length in the CF direction and one chord length in the IL direction). At higher frequencies, the hydrofoil interacts with two counter-rotating vortices that coexist at its two sides, and as a result a 1:1 frequency ratio and a C-shaped or straight-line trajectory is observed. The observed amplitude of oscillations in this range is much smaller than that observed in the range with a 2:1 frequency ratio. Instead of observing several different trajectories, as we observed in the case of a fixed cylinder, in the case of a periodically rotating cylinder, two types of trajectories are observed in the response of the hydrofoil: one with a clear 2:1 frequency ratio (figure-eight trajectories) and one with a 1:1 frequency ratio (linear or C-shaped trajectories). The figure-eight trajectories correspond to the maximum observed amplitudes of oscillations in these experiments.
When a hydrofoil is placed in the wake of a non-rotating cylinder, it interacts with the vortices that are shed from the cylinder, whose shedding frequency follows the Strouhal law, and whose distances from each other follow that expected in a typical von Kármán street. Once the cylinder is forced to rotate periodically, the vortices that are shed in its wake follow the frequency of the imposed periodic motion of the cylinder, rather than following the Strouhal law, and the distances between the shed vortices deviate from those expected in a von Kármán street. As a result, the response of a hydrofoil in the wake of a cylinder forced to rotate periodically could deviate significantly from that of a hydrofoil placed in the wake of a stationary cylinder, as the forced rotation of the upstream cylinder actively influences its wake, as opposed to the passive wake in a fixed cylinder. This active control of the cylinder's wake is a key feature in future designs of control systems that will make it possible to obtain a desired trajectory of the hydrofoil by controlling the wake of the upstream cylinder.
Supplementary movies
Supplementary movies are available at https://doi.org/10.1017/jfm.2021.539.
Funding
This work is partially supported by the National Science Foundation through grant no. CMMI 2024409.
Declaration of interests
The authors report no conflict of interest.