Introduction
The Brachiopoda was one of the most successful animal groups dominating oceans 252 million years ago, but became a marginal component in Mesozoic–Cenozoic ecosystems. The end-Permian mass extinction is responsible for the depauperate nature and evolutionary bottleneck of this clade during the Permian–Triassic (P-Tr) transition (Carlson Reference Carlson and Dudley1991, Reference Carlson2016; Chen et al. Reference Chen, Kaiho and George2005b,Reference Chen, Kaiho and Georgec). Unlike most orders of the Brachiopoda that suffered a dramatic depletion in biodiversity during the extinction, the Spiriferinida, Rhynchonellida, and Terebratulida diversified substantially after the P-Tr crisis (Chen et al. Reference Chen, Kaiho and George2005c; Carlson Reference Carlson2016). In particular, the Spiriferinida Ivanova, Reference Ivanova1972, ranging from the latest Ordovician to the Early Jurassic (Carter and Johnson Reference Carter, Johnson and Kaesler2006), shared most morphologies, life behaviors, and habitats with its impunctate counterpart, the Spiriferida. The latter was one of the largest clades of Paleozoic brachiopods, but was nearly wiped out in the P-Tr extinction. In contrast, the Spiriferinida was overshadowed by other groups (e.g., the Strophomenida, Orthida, Rhynchonellida, Productida, and Spiriferida) during the Paleozoic, but diversified greatly in the Triassic and became one of the four major clades of the Triassic brachiopods (also including: the Rhynchonellida, Terebratulida, and Athyridida) (Curry and Brunton Reference Curry, Brunton and Selden2007; Carlson Reference Carlson2016). The major switch in evolutionary traits between spiriferinids and spiriferids coincides with the P-Tr extinction (Carlson Reference Carlson and Dudley1991; Chen et al. Reference Chen, Kaiho and George2005b,Reference Chen, Kaiho and Georgec; Vörös et al. Reference Vörös, Kocsis and Pálfy2016, Reference Vörös, Kocsis and Pálfy2019). Accordingly, the successful survival strategies and diversification patterns of the Mesozoic spiriferinids may provide a window into the recovery dynamics during this critical period of brachiopod macroevolution.
The relationships among the groups within the Spiriferinida remain poorly understood, when compared with those of other clades, despite several proposed classifications (Carter et al. Reference Carter, Johnson, Gourvennec and Hou1994; Dagys Reference Dagys, Copper and Jin1996; Carter and Johnson Reference Carter, Johnson and Kaesler2006). The phylogeny of the Mesozoic spiriferinids, therefore, requires detailed study. Here, parsimony analysis at the family/subfamily level is applied to test phylogenetic relationships of major groups within the Mesozoic spiriferinids. Evolutionary lineages at the familial level based on the most parsimonious trees (MPTs) are also considered for evaluating phylogenetic diversification of the Mesozoic spiriferinids.
Morphologic analysis is an ideal tool to explore the evolutionary dynamics of clades, and it has been applied to various fossil groups in different time intervals (Ciampaglio et al. Reference Ciampaglio, Kemp and McShea2001; Ciampaglio Reference Ciampaglio2004; Erwin Reference Erwin2007; Sclafani et al. Reference Sclafani, Congreve, Krug and Patzkowsky2018). Based on characters related to ecologic functions, this approach is used to evaluate the ecologic diversity of the animals (Anderson Reference Anderson2009; Anderson et al. Reference Anderson, Friedman, Brazeau and Rayfield2011; Bapst et al. Reference Bapst, Bullock, Melchin, Sheets and Mitchell2012; Dick and Maxwell Reference Dick and Maxwell2015; Stubbs and Benton Reference Stubbs and Benton2016). Here, the occupation of ecomorphospace and disparity of the Spiriferinida from the Wordian (mid-Permian) to Early Jurassic are analyzed based on external characters that have ecologic functionality. As a close relative and potential competitor of the Spiriferinida, the pre-extinction spiriferids are also included in the analysis to test the effects of the P-Tr extinction on ecomorphologic utilization and disparity evolution of the spiriferiformis (the Spiriferida and Spiriferinida).
Data and Methods
Phylogenetic Analysis
Taxa Analyzed
At least one genus from each family/subfamily, following the classification schemes of Carter and Johnson (Reference Carter, Johnson and Kaesler2006) and Dagys (Reference Dagys, Copper and Jin1996), was selected for analysis. Three new subfamilies proposed by He and Chen (in He et al. Reference He, Zhang, Chen, Yan, Yang, Zhang, Gu and Wu2015) were also considered in the analysis (Triadispiridae was established earlier by Xu and Liu [Reference Xu, Liu, Yang, Xu, Wu, He, Liu and Yin1983]). Suessiidae and Tethyspirinae were not included, because the internal characters of these families/subfamilies remain unconfirmed (Dagys Reference Dagys, Copper and Jin1996). For each family/subfamily selected, the type genus represents its features, and its type species was coded. When some important characters are unknown in the type genus, a well-described taxon that is closely allied to the type genus within the family/subfamily has been selected for the analysis. Three late Permian genera, Eolaballa, Licharewina, and Spiriferellina, were also included in the analysis, because they all are important genera that may extend the time range of some superfamilies (Carter and Johnson Reference Carter, Johnson and Kaesler2006; Shen and Clapham Reference Shen and Clapham2009). In total, 30 ingroup genera were coded for phylogenetic analysis.
Outgroup
The spiriferinid genus Cyrtina was selected as the outgroup, because it is the earliest representative of the Spiriferinida (Carter and Johnson Reference Carter, Johnson and Kaesler2006).
Characters
Most of the morphologic terms follow Williams et al. (Reference Williams, Brunton, MacKinnon and Kaesler1997) and Carter and Johnson (Reference Carter, Johnson and Kaesler2006). Definitions of some internal structures were amended and consolidated. For instance, the definitions of dental plates, dental flanges, and dental adminicula are not consistent with one another in various publications (Williams et al. Reference Williams, Brunton, MacKinnon and Kaesler1997; Waterhouse Reference Waterhouse2016). To avoid confusion, two terms, “dental flanges” and “dental adminicula,” were adopted, instead of “dental plates.” Dental flanges are plates that support the teeth directly, and dental adminicula connect dental flanges with the valve floor. Previously, many cyrtinoid and suessioid taxa were considered to possess a spondylium in the ventral valve (Carter et al. Reference Carter, Johnson, Gourvennec and Hou1994; Carter and Johnson Reference Carter, Johnson and Kaesler2006). Nevertheless, most of the so-called spondylia are formed by the convergence of long dental flanges, like those of Komiella (Johnson and Blodgett Reference Johnson and Blodgett1993: fig. 2.13). Thus, we used “dental flanges fused directly or not” to describe the presence and absence of a spondylium. The “true spondylium” refers to that formed by the union of convergent dental adminicula (like that of Psioidiella). A crenulate hingeline was regarded as a synapomorphy of the Spondylospiroidea by Carter and Johnson (Reference Carter, Johnson and Kaesler2006). However, some other orders also possess denticulated or crenulate hingelines (e.g., the Strophomenida; Rong and Cocks Reference Rong and Cocks1994). This character, therefore, should not be overemphasized in phylogenetic analysis (Dagys Reference Dagys, Copper and Jin1996). By contrast, Dagys (Reference Dagys, Copper and Jin1996) believed that the jugal net is a synapomorphy in some spiriferinids and is diagnostic of the superfamily Bittneruloidea.
After reassessment and revision, a total of 32 discrete morphologic characters were coded for the analysis (Supplementary Data), and their details are listed in the Supplementary Text.
Character Management Strategies
In many phylogenetic investigations, characters are unordered and equally weighted (Carlson and Fitzgerald Reference Carlson and Fitzgerald2008; Schreiber et al. Reference Schreiber, Bitner and Carlson2013; Congreve et al. Reference Congreve, Krug and Patzkowsky2015). Equally weighted analysis does not include many a priori assumptions and can reveal relatively conservative topologies (Congreve and Lamsdell Reference Congreve and Lamsdell2016). However, in the traditional classification of brachiopods, internal characters are always regarded as being diagnostic of a high-level classification unit (Carter and Johnson Reference Carter, Johnson and Kaesler2006). This is because the external morphology of the brachiopod shell is hypothesized to have resulted from adaptation to similar environments (Cooper Reference Cooper1972; Lee et al. Reference Lee, Shi, Park and Tazawa2016), and internal structures are relatively stable and should be accentuated. From this perspective, internal characters could be given higher weights. In addition, for brachiopods, there are some multistate characters (such as shell convexity) that show transformation between states (from gently to moderately to strongly convex). To demonstrate the directional morphologic transformations, these characters should be ordered (Brazeau Reference Brazeau2011).
To investigate the effects of strategic character management on the phylogenetic framework of spiriferinids, three different strategies were considered here. In strategy 1 (S1), all characters were unordered and equally weighted. In strategy 2 (S2), eight characters (characters C3–C8, C13, C14) were coded as ordered ones. The ordered characters with multiple states were therefore downweighted according to the total number of their character states. A base weight of six was employed to convert weights of characters to integral numbers. In strategy 3 (S3), characters were ordered as in S2, but three characters (C12, type of microornamentation; C18, presence/absence of dental adminicula; C21, presence/absence of spondylium) were given a weight of 2 (having a weight of 12 after multiplying by a base weight of 6). These three characters are very important in the classification of the Spiriferida and Spiriferinida (Dagys Reference Dagys, Copper and Jin1996; Carter and Johnson Reference Carter, Johnson and Kaesler2006; Waterhouse Reference Waterhouse2016). For the first two strategies (S1, S2), after the preliminary analysis, characters were also reweighted by the rescaled consistency indices (RCI) based on their performance in the preliminary analysis. The results of the reweighted analysis are provided in Supplementary Figures S1 and S2.
Phylogenetic Inference
Parsimony analysis was performed in PAUP* v. 4.0a166 (Swofford Reference Swofford2003). We used heuristic searches with 10,000 random addition sequences to generate the MPTs. The branch-swapping algorithm was tree-bisection-reconnection with no reconnection limit. Strict consensus trees were calculated, and the robustness of the reconstructed trees was examined by bootstrap support resampling all parsimony-informative characters. When “full-heuristic” bootstrap analysis was unachievable due to computational limitations, “fast stepwise-addition” analysis was adopted, instead.
Ecomorphospace and Disparity
Taxa Analyzed
To understand the variations in ecomorphologic occupation of the Spiriferinida and Spiriferida before and after the end-Permian extinction, all genera within these two orders (except for Suessia) from the Wordian (middle Permian) to the Early Jurassic were included in morphologic analysis. The stratigraphic ranges of the genera follow the primary literature and recently published monographs (Waterhouse Reference Waterhouse2016; Shen et al. Reference S. Z., Jin, Zhang, Weldon, Rong, Jin, Shen and Zhan2017; Sun et al. Reference Sun, Xu, Qiao, Rong, Jin, Shen and Zhan2017) as well as the Paleobiology Database (PBDB, paleobiodb.org).
Characters
External characters were employed in the analysis. These characters have specific ecologic functions that can affect the orientation, feeding, and lifestyle of the animal, such as shell convexity, width of hingeline, depth of sulcus, development of ornamentation, height of ventral interarea, and the type of delthyrial cover plates (Ager Reference Ager1967; Rudwick Reference Rudwick1970; Harper and Moran Reference Harper and Moran1997; Chen et al. Reference Chen, Shi and Kaiho2002, Reference Chen, Campi, Shi and Kaiho2005a, Reference Chen, Shi, Yang, Gao, Tong and Peng2006b; Shiino Reference Shiino2010; Shiino and Kuwazuru Reference Shiino and Kuwazuru2010, Reference Shiino and Kuwazuru2011; Shiino and Angiolini Reference Shiino and Angiolini2014; Baeza-Carratalá et al. Reference Baeza-Carratalá, Manceñido and Joral2016; Wu et al. Reference Wu, Shi and Sun2019). Secondary thickening or the umbonal callus of the shell was also considered, because it can alter the center of gravity of the shell and influence its orientation. In total, 14 characters were included (see Supplementary Text and Supplementary Data for details).
Ecomorphospace
The full dataset was used to calculate a distance matrix based on maximum observable rescaled distance (Lloyd Reference Lloyd2016), which is comparable with the Gower coefficient (Gower Reference Gower1971) that is widely used by paleontologists but can deal with the multistate ordered characters (Lloyd Reference Lloyd2016). The distance matrix was then analyzed using principal coordinates analysis (PCO), and the ecomorphospace was constructed by plotting PCO axis 1 and 2 scores. To investigate the temporal variations of ecomorphospace occupation, the plots were generated for 11 time bins from the Wordian to the Early Jurassic. In general, each bin is of stage level. Nevertheless, the spiriferinids were very rare in the Early Triassic (Induan–Olenekian) and Early Jurassic (Hettangian–Toarcian). These two epochs were therefore treated as one bin, respectively. The ecomorphospace occupied by the Changhsingian spiriferids is also shown in the plots of the Anisian to the Early Jurassic bins in order to compare the occupations between the Mesozoic spiriferinids and pre-extinction spiriferids, as these two clades share most of tiering, motility, and trophic functional guilds, and thus are competitors and switch their dominance before and after the end-Permian extinction (Carlson Reference Carlson2016). In addition, the Norian bin has a duration of 21.6 Myr (Ogg and Chen Reference Ogg, Chen, Gradstein, Ogg, Schmitz and Ogg2020) and is much longer than the Changhsingian bin (2.2 Myr). To avoid sampling bias due to different durations between these two bins, the ecomorphospace occupation of the Wordian–Changhsingian (16.9 Myr) was also displayed in comparison with that of the Norian. PERMANOVA (permutational multivariate analysis of variance using the Euclidean distance measure) was performed to assess the significance of differences in patterns of ecomorphospace occupation between time bins and taxon groups (Ruta et al. Reference Ruta, Angielczyk, Fröbisch and Benton2013; Lamsdell and Selden Reference Lamsdell and Selden2016).
Temporal Disparity
Two important metrics, sum of variances (SOV) and sum of ranges (SOR), were employed to calculate ecomorphologic disparity, and all axes with positive eigenvalues were included. SOV provides an estimate of the amount of difference between character states among taxa, but it fails in offering the absolute range of occupied morphospace, which can be estimated by the SOR (Ciampaglio et al. Reference Ciampaglio, Kemp and McShea2001). The integration of these two metrics can reflect the distribution of the data points in morphospace. To quantify disparity variations through time, we performed calculations on the spiriferids and spiriferinids of these 11 bins from the Wordian to Early Jurassic. When a taxon occurred before and after a time interval, it was assumed to be present during this interval. The 95% confidence intervals of disparity are calculated using a bootstrapping procedure. All calculations were performed in R (R Core Team 2018).
Results
Phylogenetic Analysis
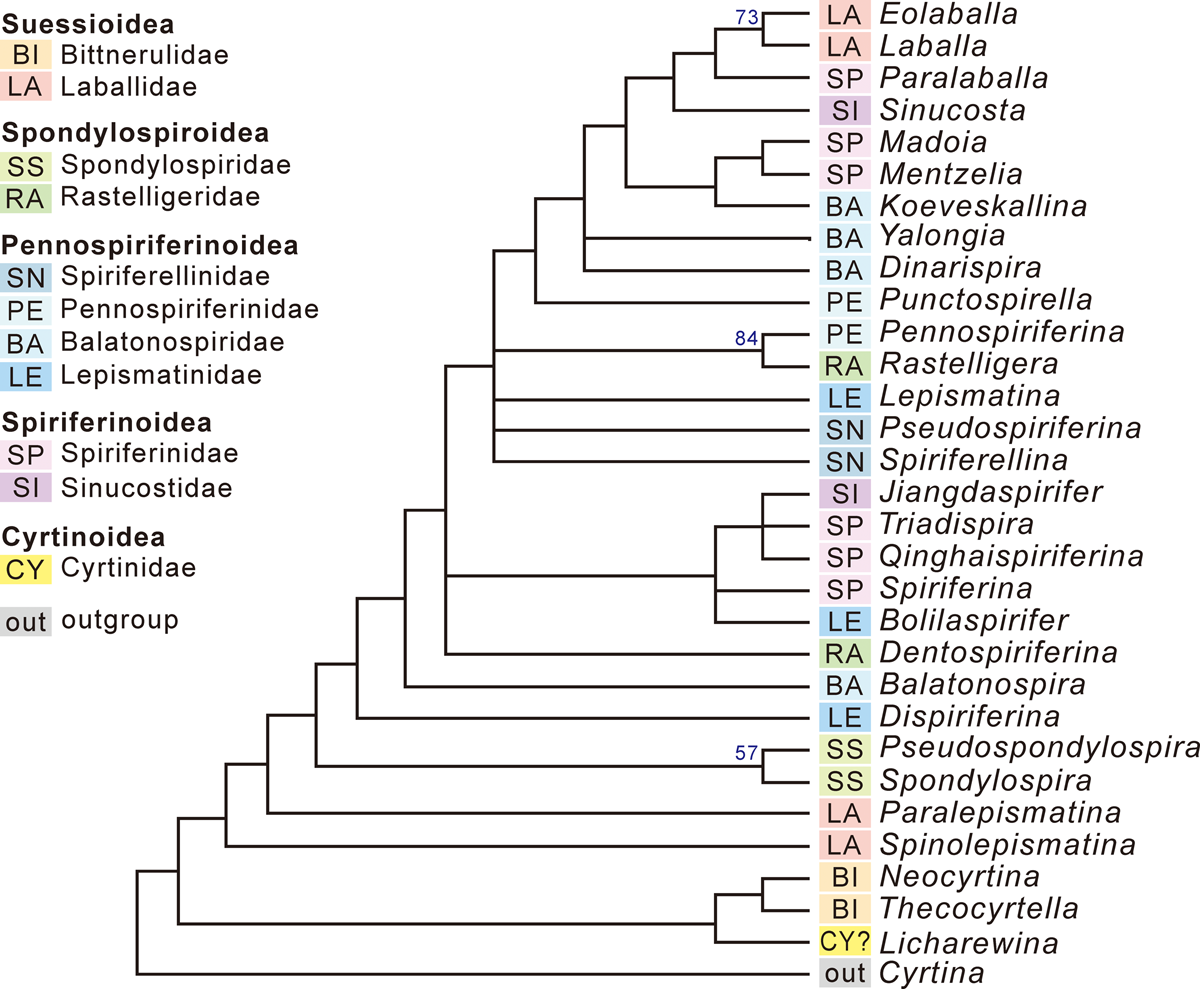
Parsimony analysis based on various the character management strategies generated MPTs with different topologies. Analysis based on S1 generated 66 MPTs with a tree length (TL) of 121, a consistency index (CI) of 0.355, and a retention index (RI) of 0.618. In the strict consensus tree (Fig. 1), the Laballinae (Eolaballa and Laballa), Bittnerulidae, and Spondylospiridae are reconstructed as monophyletic groups, and the last two plus Licharewina, Spinolepismatina, and Paralepismatina form a paraphyletic group. Members of Pennospiriferinoidea, Spiriferinoidea, and Rastelligeridae are grouped together, but no family recovered successfully as a monophyletic group. As stated in the “Data and Methods” section, characters were reweighted according to their RCI in the preliminary analysis. Reweighted analysis resulted in 15 MPTs (TL: 27.47; CI: 0.523; RI: 0.723). The topology of the strict consensus tree (Supplementary Fig. S1) is highly comparable with that before reweighting but with more nodes resolved. The only differences are that Pseudospiriferina and Lepismatina form a monogroup with the Pennospiriferina–Rastelligera clade, while Spiriferellina was grouped with the Eolaballa–Punctospirella clade.
Strict consensus tree of the 66 most parsimonious trees generated from analysis based on strategy 1. All characters are unordered and equally weighted. Superfamilial and familial attributions of every taxon are shown according to Carter and Johnson (Reference Carter, Johnson and Kaesler2006). Numbers at nodes represent bootstrap (fast stepwise-addition) support values.

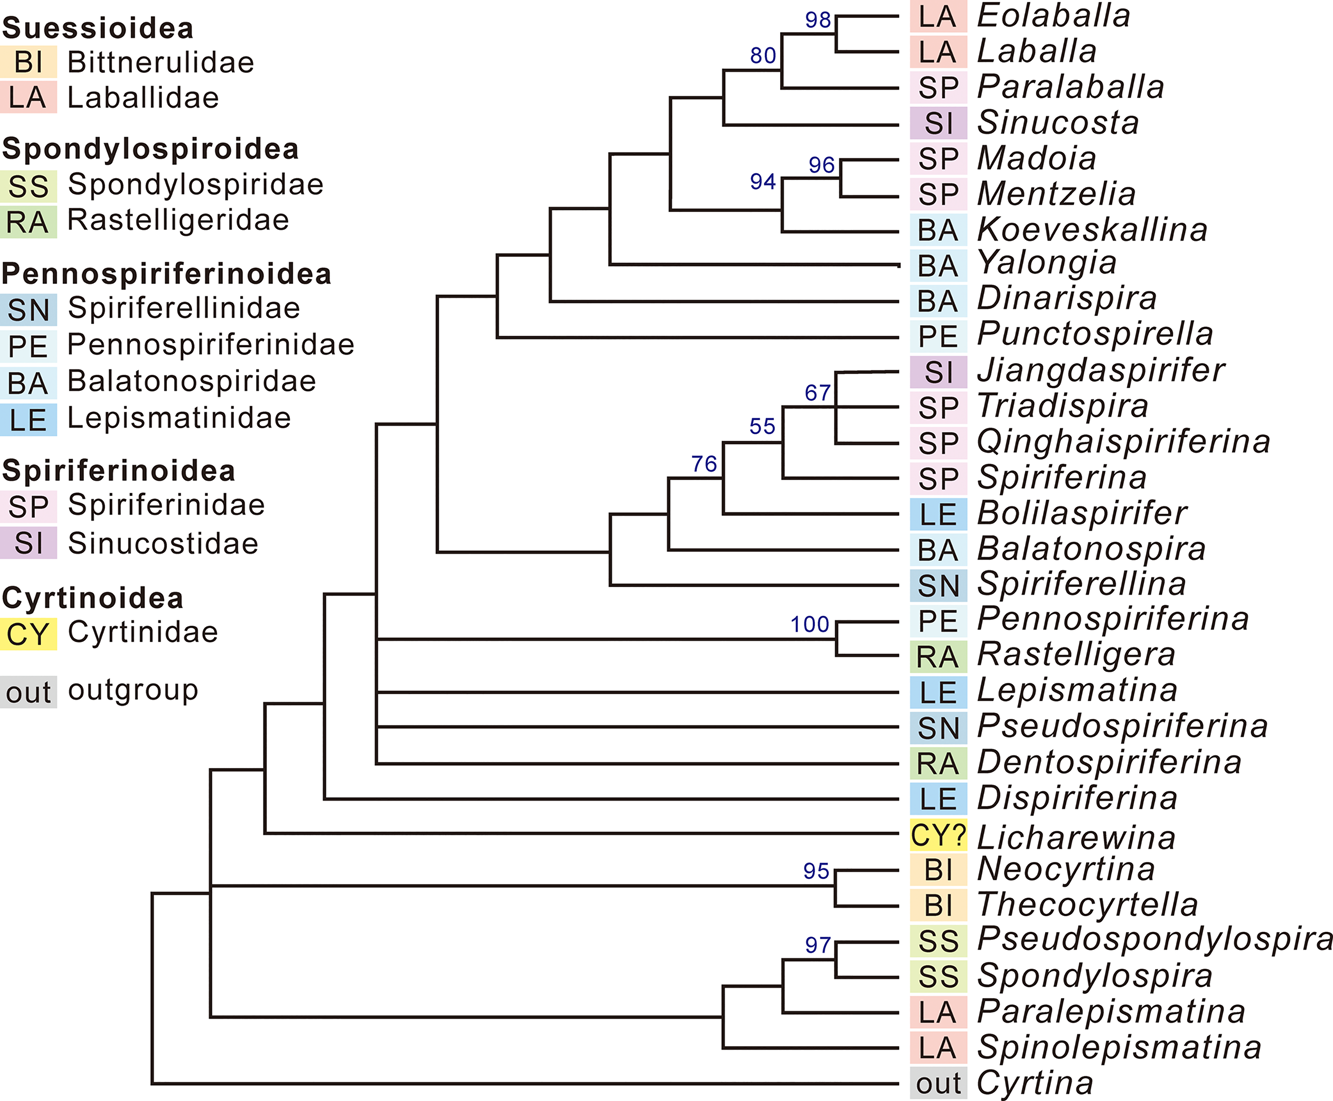
Forty MPTs (TL: 573; CI: 0.356; RI: 0.612) were conducted from the S2-based analysis. As shown by the strict consensus tree (Fig. 2), the Laballinae, Bittnerulidae, and Spondylospiridae recovered again, and the last two, together with Spinolepismatina and Paralepismatina, form a monophyletic group, which is characterized by having a subconical ventral valve and jugal net. The Laballinae, Pennospiriferinoidea, Spiriferinoidea, and Rastelligeridae are clustered in a big monophyletic group. Reweighted analysis also resulted in two trees (TL: 28.02; CI: 0.506; RI: 0.709), and the strict consensus tree is shown in Supplementary Figure S2. As in the tree in Supplementary Figure S1, Pseudospiriferina and Lepismatina are both grouped with the Pennospiriferina–Rastelligera clade.
Strict consensus tree of the 40 most parsimonious trees generated from analysis based on strategy 2. Eight characters are ordered and others are unordered. Superfamilial and familial attributions of every taxon are shown according to Carter and Johnson (Reference Carter, Johnson and Kaesler2006). Numbers at nodes represent bootstrap (full-heuristic) support values.

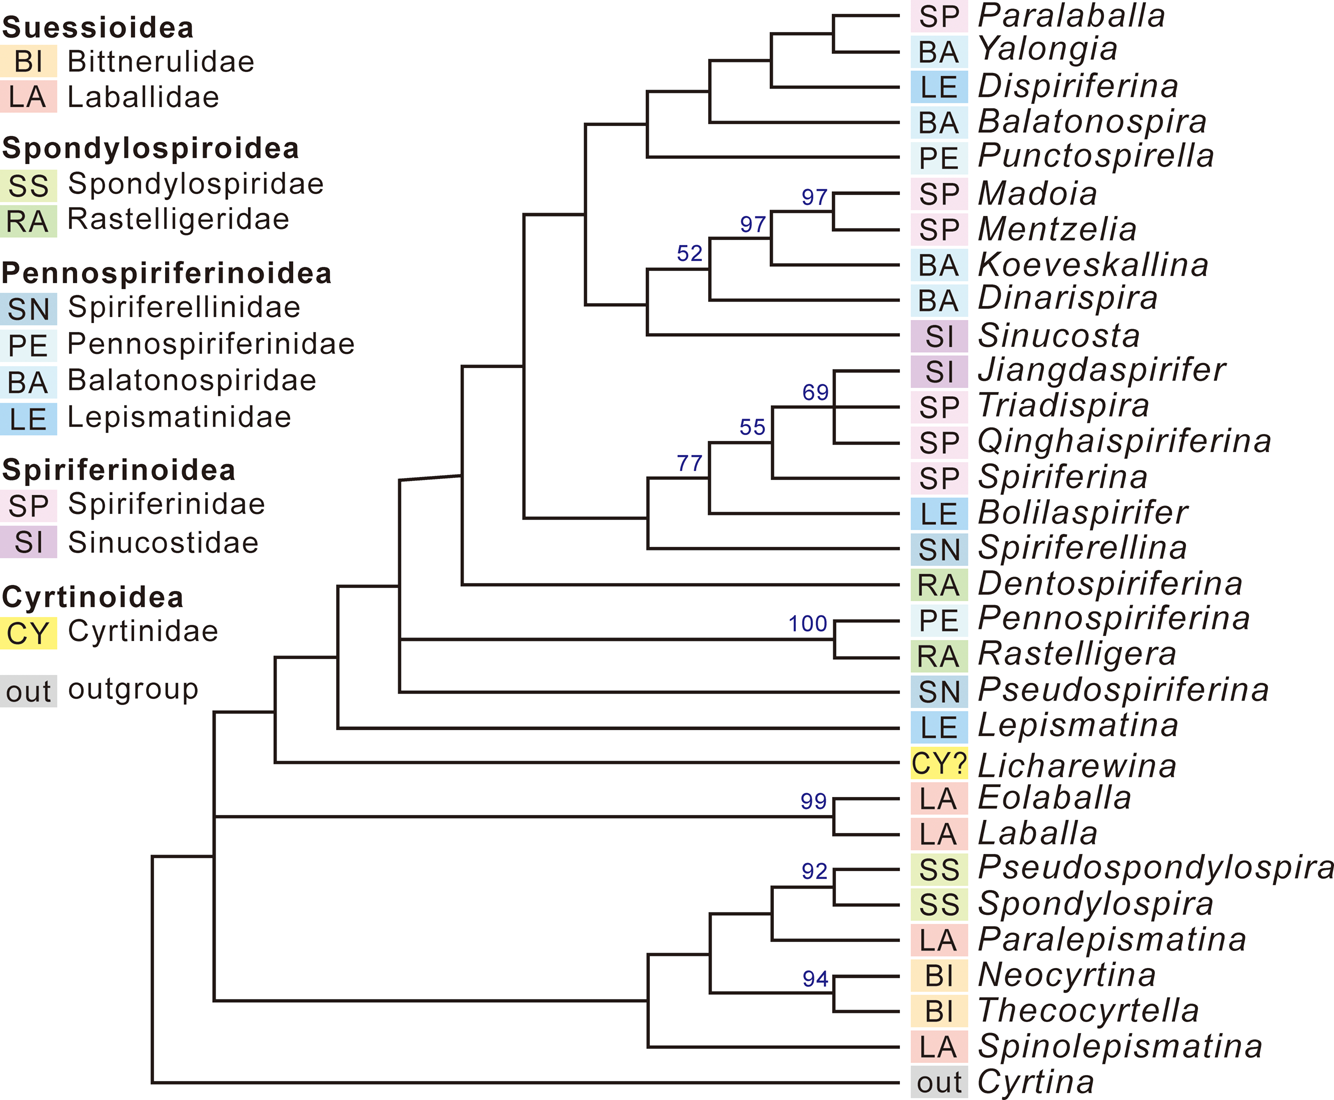
In S3, some characters are weighted, and some are ordered. The S3-based analysis generated 106 MPTs (TL: 626; CI: 0.355; RI, 0.625). The strict consensus tree (Supplementary Fig. S3) is poorly resolved, and the 50% majority-rule consensus tree is shown here (Fig. 3). The greatest difference between this tree and those described earlier is that the Laballinae is removed from the large group that contains pennospiriferinoids and spiriferinoids, showing a closer relationship to the Bittnerulidae and Spondylospiridae. Although the topologies of the large groups in the upper parts of the figures (including Pennospiriferinoidea, Spiriferinoidea, and Rastelligeridae) differ from one another (Figs. 1–3), the Madoia–Koeveskallina and Jiangdaspirifer–Bolilaspirifer clades show considerable consistency in all the trees.
Fifty-percent majority-rule consensus tree of the 106 most parsimonious trees generated from analysis based on strategy 3. Eight characters are ordered, and three characters are emphasized. Superfamilial and familial attributions of every taxon are shown according to Carter and Johnson (Reference Carter, Johnson and Kaesler2006). Numbers at nodes represent bootstrap (full-heuristic) support values.

Spiriferiformis Ecomorphospace
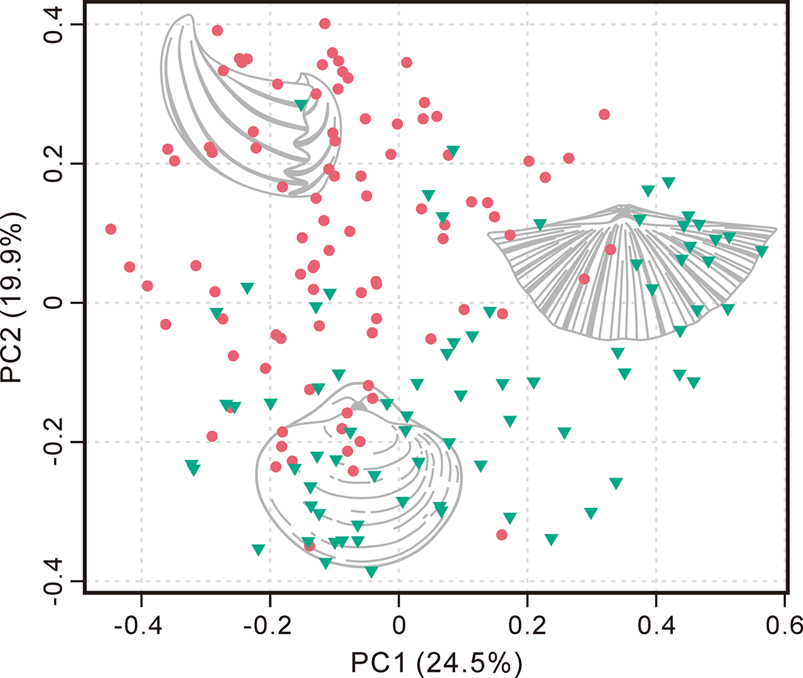
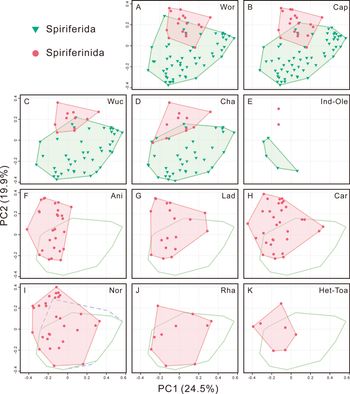
The ecomorphospace plots of the Wordian–Early Jurassic spiriferinids and spiriferids (Fig. 4) show that the two orders share a vast area in the central part of the diagram, although the spiriferinids concentrate in the upper left part of the plot diagram, while the spiriferids are commonly present in the lower right corner of the same diagram. PC 1 and PC 2 account for 44.4% of total variance (percentages of variance explained by the first 30 axes; see Supplementary Fig. S4). The positions of taxa in the plot (Fig. 4) and their characters imply that PC 1 captures variations of ventral interarea height and shell convexity. When PC 1 value increases, ventral interarea height decreases, and the shell exhibits an equibiconvex profile. In contrast, the smaller PC 1 values decipher much higher ventral interarea and strongly ventribiconvex shell of the taxa. The strength of radial ornamentation shows strong association with positioning along PC 2. The smaller PC 2 values indicate weaker ornamentation, while the greater PC 2 values represent the taxa possessing stronger ornamentation.
Empirical ecomorphospace showing the distribution of all the spiriferids and spiriferinids from the Wordian to Toarcian. The circles represent the spiriferinids, and triangles denote the spiriferids. Three typical shapes of spiriferiformis are shown. See text for explanations.

The ecomorphospace plot diagram also clearly illustrates three typical morphologic groups of spiriferiformis (Fig. 4). The taxa plotted in the upper left part of the diagram all have a very high ventral interarea and a ventribiconvex shell profile, and they are usually termed “cyrtiniform” taxa (e.g., Cyrtina). The taxa plotted in the lower part of the diagram are characterized by equibiconvex shells having rounded cardinal extremities and lacking pronounced radial ornamentation, and they are categorized to the “reticulariiform” brachiopods, typified by Reticularia. Most taxa plotted in the right-hand parts of the diagram are categorized as “spiriferiform” brachiopods, which have equibiconvex shells, external ornamentations, and broad hingelines (e.g., Spirifer). Genera plotted in the central part of the diagram generally exhibit transitional shapes and ornamentations among these three major groups. The typical spiriferinid taxa are transverse in outline and ornamented with coarse plications on the flanks and have a high to very high, flattened apsacline to procline ventral interarea and a smooth fold and sulcus (Carter and Johnson Reference Carter, Johnson and Kaesler2006). This ecomorphologic group is typical of the Spiriferellinidae (sensu Carter and Johnson Reference Carter, Johnson and Kaesler2006), typified by Spiriferellina, and they plot in the upper central part of the diagram (Fig. 4).
Ecomorphospace Occupation through Time
Ecomorphospace occupation of the Wordian to Early Jurassic spiriferids and spiriferinids varied from time to time (Fig. 5). However, the ecomorphospace partition between spiriferids and spiriferinids remained relatively constant from the Wordian to the Changhsingian (Fig. 5A–D; PERMANOVA, p > 0.05, Supplementary Tables S1–S3), with spiriferid ecomorphospace being larger than that of spiriferinids. Of these, spiriferid ecomorphospace appears as a transverse oval outline, located in the middle and lower parts of the diagram, while spiriferinids occupied a small area that is confined to the central to slightly left upper part of the plot diagram. All Permian spiriferinids, expect for one genus, Paraspiriferina, became extinct during the P-Tr extinction. Spiriferid biodiversity also suffered drastically during the same crisis. Only a few small and smooth spiriferids survived the first (main) phase of the extinction, but were subsequently wiped out in the earliest Triassic (Chen et al. Reference Chen, Campi, Shi and Kaiho2005a,Reference Chen, Kaiho and Georgeb, Reference Chen, Kaiho, George and Tong2006a). These taxa plot in the left lower part of the ecomorphospace diagram (Fig. 5E). Consequently, both spiriferids and spiriferinids occupied a very small ecomorphospace in the Early Triassic (Fig. 5E) due to the end-Permian extinction.
Patterns of ecomorphospace occupation of spiriferids and spiriferinids from the Wordian to Early Jurassic (A–K). The areas of the two orders are denoted by convex hulls. The solid lines shown in the plots from the Anisian to Hettangian–Toarcian bins represent the area occupied by the Changhsingian spiriferids. The dashed line in the plot of the Norian bin shows the area occupied by the Wordian–Changhsingian spiriferids. Wor, Wordian; Cap, Capitanian; Wuc, Wuchiapingian; Cha, Changhsingian; Ind-Ole, Induan–Olenekian; Ani, Anisian; Lad, Ladinian; Car, Carnian; Nor, Norian; Rha, Rhaetian; Het-Toa, Hettangian–Toarcian.

The first Triassic spiriferinid pioneer, Lepismatina, occurred in the Olenekian, and plots in the upper middle part of the diagram (Fig. 5E). In the Anisian (early Middle Triassic), spiriferinids rapidly expanded their ecomorphospace and occupy almost all of the left half of the diagram. When compared with the pre-extinction Changhsingian spiriferinids, the Anisian spiriferinids occupied almost twice the ecomorphospace (Fig. 5F), which resulted in a significant shift in occupation (PERMANOVA, p < 0.05, Supplementary Table S2). The spiriferinid ecomorphospace increased in size steadily from the Anisian to the Norian, and reached its maximum in the Norian (Fig. 5F–I), when spiriferinids broadened their traditional cyrtiniform ecomorphospace and occupied almost the entire ecomorphospace of pre-extinction spiriferids, except for a small area occurring in the right middle part of the diagram. A significant drop in biodiversity occurred in the Rhaetian, when the spiriferinid ecomorphospace slightly contracted but largely overlapped with that of the pre-extinction spiriferid ecomorphospace. The ecomorphospace of the Early Jurassic spiriferinids further contracted and is confined to the left half of the diagram. The reduced ecomorphospace probably resulted from the extinction of all Triassic spiriferinids during the end-Triassic extinction, and the incoming spiriferinids inherited some of previous ecomorphospace, but their distribution is limited to the left middle part of the diagram (Fig. 5K).
Disparity Variations through Time
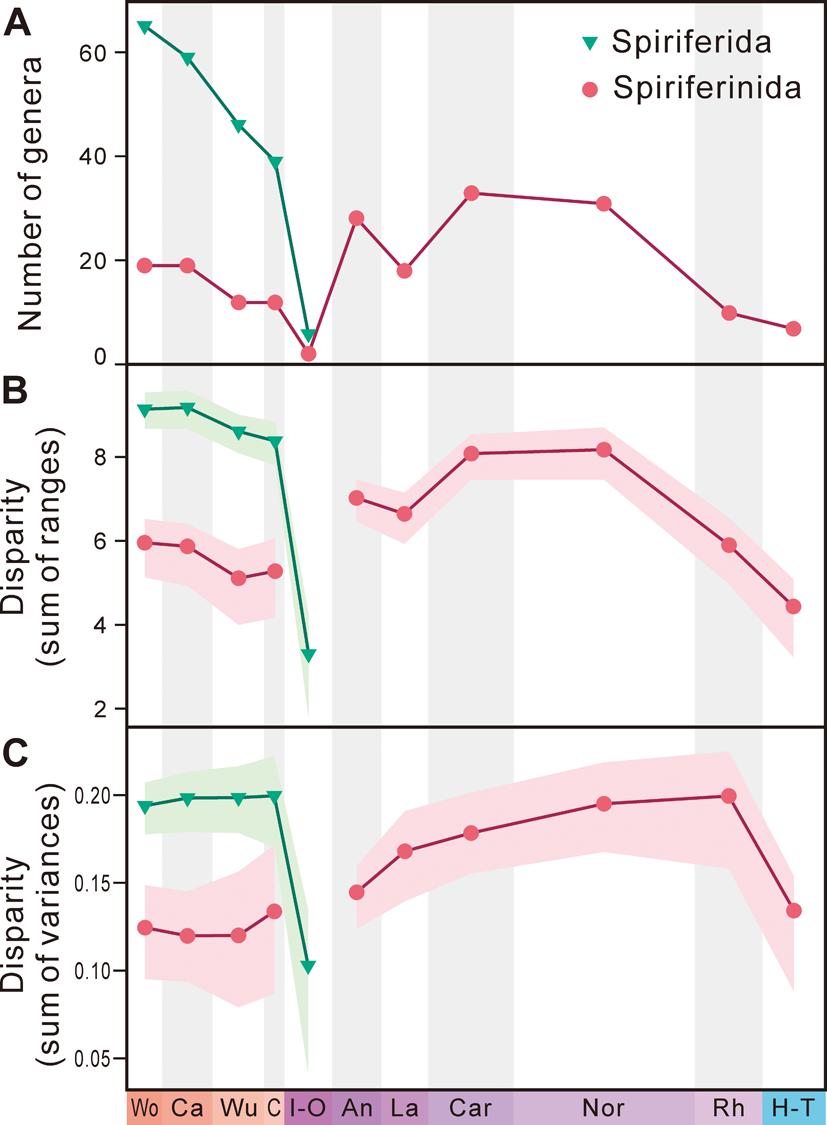
As one of the most taxon-rich clades of brachiopods, spiriferids show great morphologic variance during the Permian. Taxonomic diversity of spiriferids decreased from the Wordian to Changhsingian; the disparities based on the two metrics (SOR and SOV), however, exhibit minor fluctuations (Fig. 6A–C). These two types of disparities fell steeply in the P-Tr transition due to extinction of most genera.
Diversity and ecomorphologic disparity of spiriferids and spiriferinids. A, Diversity is based on the number of genera. Disparity values are based on the sum of ranges (B) and sum of variances (C) metrics. The envelopes represent 95% confidence intervals based on 1000 bootstrap replicates. The disparity values of the Induan–Olenekian spiriferinids are missing because of the limited sample size. Wo, Wordian; Ca, Capitanian; Wu, Wuchiapingian; C, Changhsingian; I-O, Induan–Olenekian; An, Anisian; La, Ladinian; Car, Carnian; Nor, Norian; Rh, Rhaetian; H-T, Hettangian–Toarcian.

For spiriferinids, the SOR disparity exhibits a strong correlation with taxonomic diversity (Ciampaglio et al. Reference Ciampaglio, Kemp and McShea2001). Both diversity and SOR disparity experienced a dramatic drop across the P/Tr boundary (Fig. 6A,B). The SOR disparity cannot be calculated due to rather low sample size in the Early Triassic, then increased rapidly in the Anisian, exceeding the pre-extinction level. The same proxy continued to increase and arrived at a plateau during the Carnian and Norian, returning to almost the same levels of the pre-extinction spiriferids, which flourished in the Middle–Late Permian (Fig. 6). Then, the SOR disparity of spiriferinids underwent a stepwise decline from the Rhaetian to the Early Jurassic.
The SOR disparity trajectory also suggests a gentle stepwise decline from the Wordian to Changhsingian before a sharp decline in the P-Tr transition. In contrast, the SOV disparity shows a possibly opposite trajectory that exhibits a stepwise increase from the Wordian to Changhsingian (the 95% confidence intervals are largely overlapped, and the increasing value is insignificant). Similarly, a distinct SOV disparity gap occurs in the Early Triassic due to poor data recorded from that time. From the Anisian to Rhaetian, the SOV disparity shows a gentle stepwise increase for the spiriferinids, a peak in the Rhaetian, and then a stepwise decline into the Early Jurassic (Fig. 6C).
Discussion
Phylogenetic Diversification
The new phylogenetic analysis based on different character management strategies shows consensus trees differ from one another, but none is identical to the existing classifications proposed by Carter and Johnson (Reference Carter, Johnson and Kaesler2006) and Dagys (Reference Dagys, Copper and Jin1996), although the classification revealed by these trees is much closer to that of Dagys (Reference Dagys, Copper and Jin1996) than that adopted by the Treatise on Invertebrate Paleontology (Carter and Johnson Reference Carter, Johnson and Kaesler2006). The family-level attributions of the analyzed taxa based on both the classification schemes are provided in the Supplementary Data.
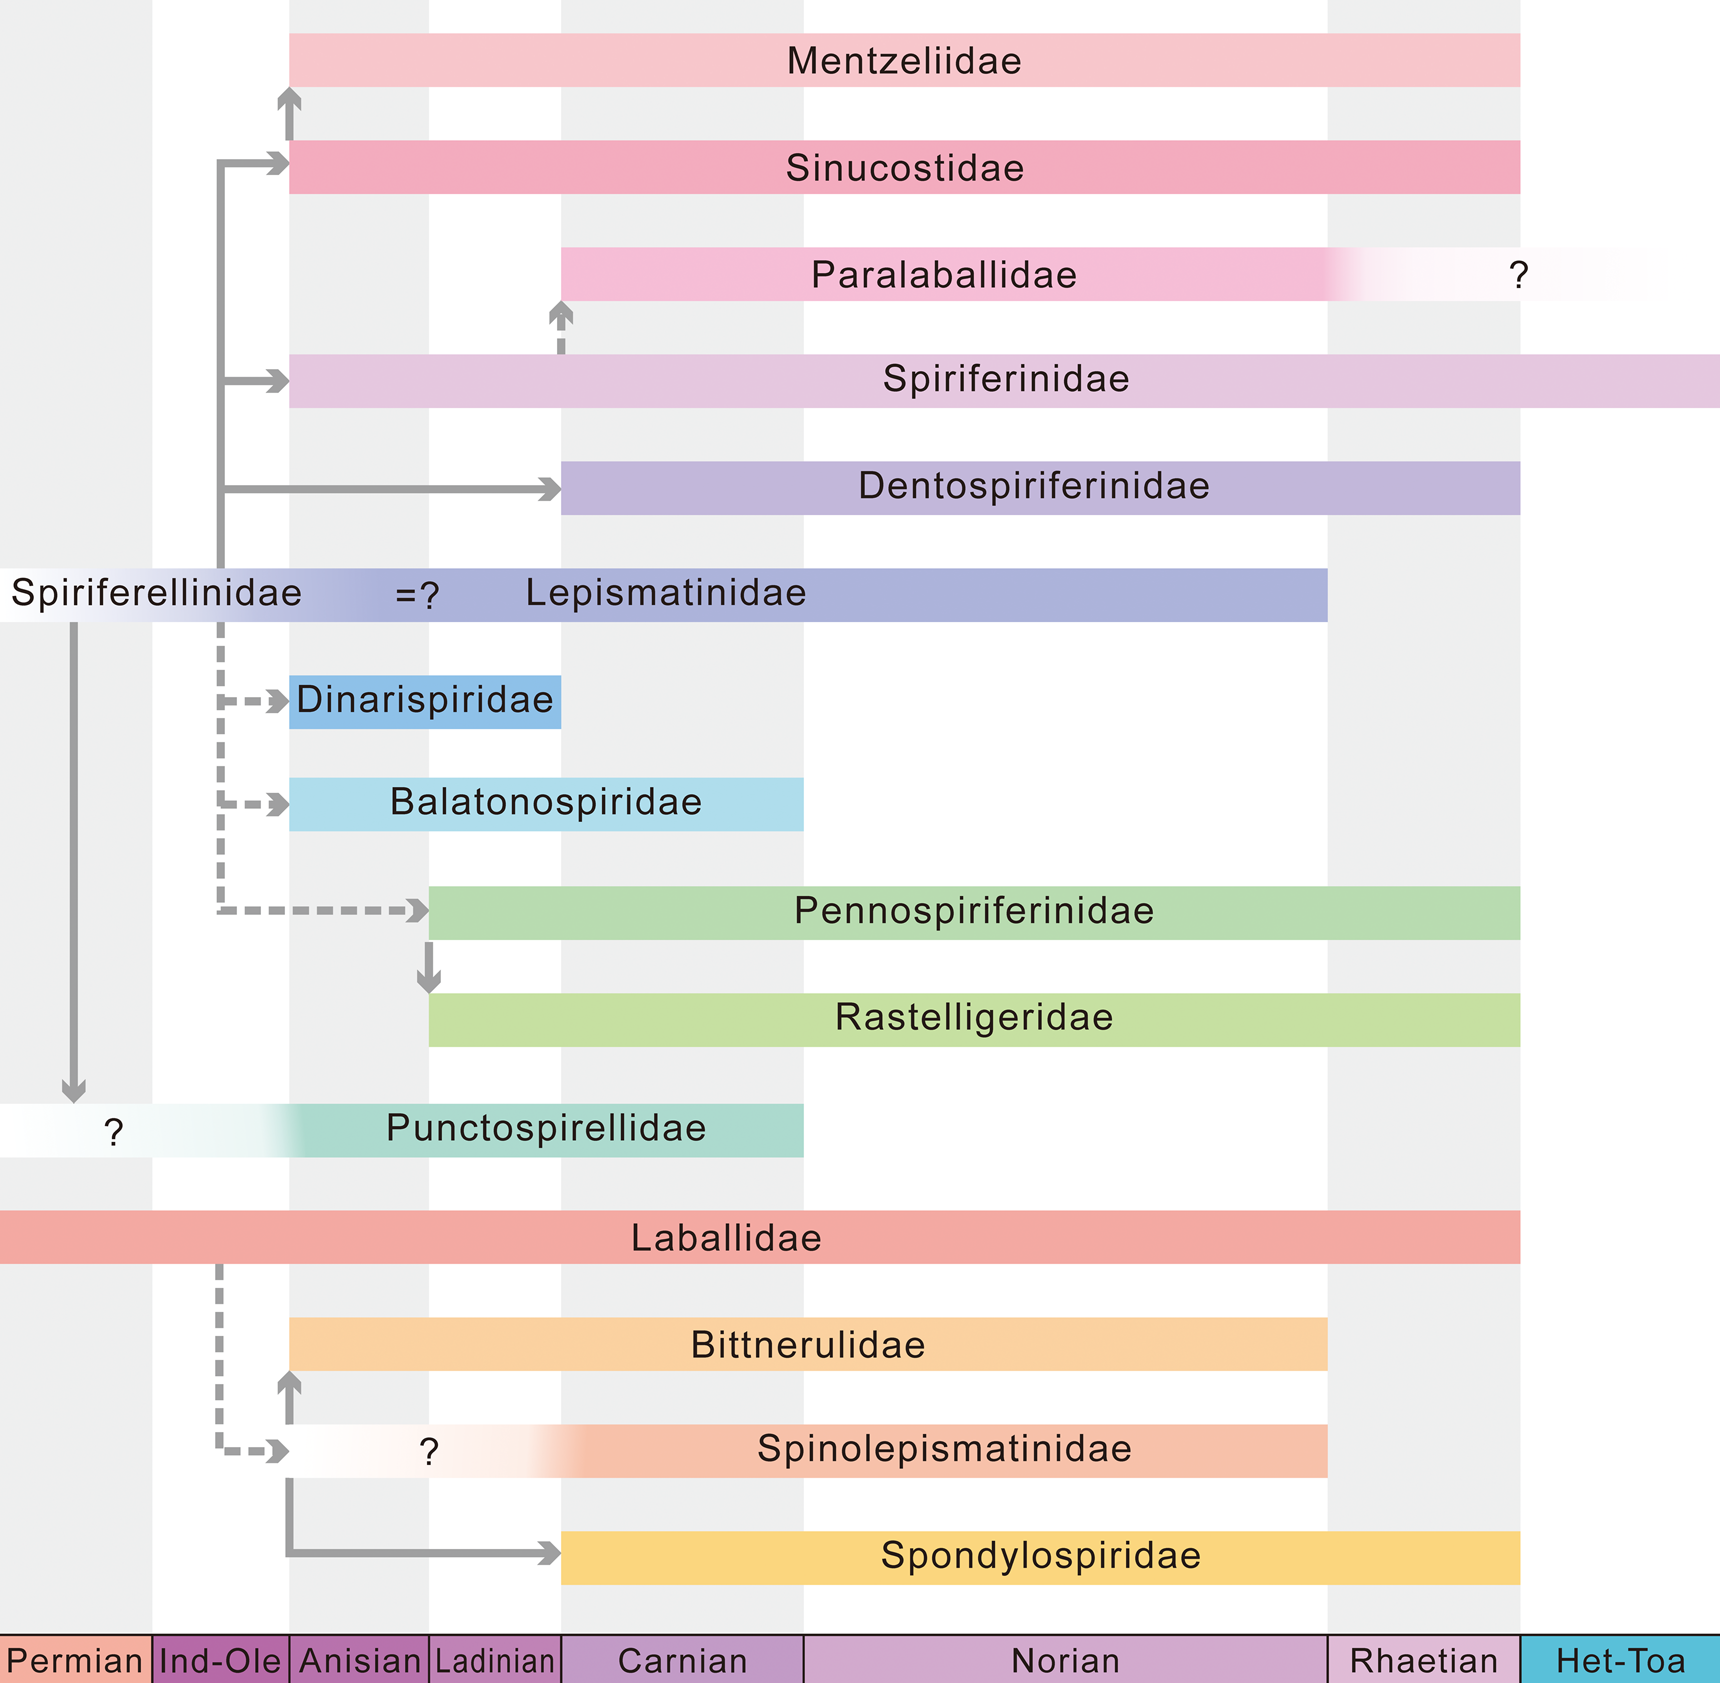
Of the Mesozoic spiriferinids, four major groups—the Spiriferinoidea (sensu Dagys Reference Dagys, Copper and Jin1996), Mentzelioidea (sensu Dagys Reference Dagys, Copper and Jin1996), Pennospiriferinoidea (sensu Dagys Reference Dagys, Copper and Jin1996), and Bittneruloidea (sensu Dagys Reference Dagys, Copper and Jin1996)—are rather diverse and predominant. All of the consensus trees show that the Spiriferinidae (sensu Dagys [Reference Dagys, Copper and Jin1996], roughly equal to Spiriferininae sensu Carter and Johnson [Reference Carter, Johnson and Kaesler2006]) could be a descendant of pennospiriferinoids. The Pennospiriferinoidea also likely gave rise to the Mentzelioidea, with Sinucostidae (= Yalongiinae; Dagys Reference Dagys, Copper and Jin1996) as a bridge between them. The monophyly of the Mentzelioidea, however, is not clearly supported, because in some trees (Figs. 1–3), Balatonospira is not grouped with other members of this superfamily.
The relationship between the Laballidae (sensu Dagys Reference Dagys, Copper and Jin1996) and other groups is inconsistently displayed across the consensus trees. In Figures 1 and 2, Paralaballa is reconstructed as a sister group of the Laballidae, and the Dispiriferina is closely located with Licharewina. In contrast, in the tree generated from the T3-based analysis, which throws more light on internal characters and microornaments, the Laballinae is closely located with other members of the Bittneruloidea (sensu Dagys Reference Dagys, Copper and Jin1996) in a polytomy, and Paralaballa is grouped with Dispiriferina (Fig. 3). In terms of internal characters, the Laballidae is almost identical to the Bittneruloidea, except for the absence of jugal net, but not very close to Paralaballa and Dispiriferina. Both the character states and stratigraphic distributions demonstrate that the Laballidae likely originated in the Late Permian and is possibly the antecedent of the Triassic Bittneruloidea. In brief, excepting the Bittneruloidea (Laballidae not included) that may have evolved from the Laballidae, all other Mesozoic spiriferinids are possibly descendants of the Pennospiriferinoidea (Fig. 7).
Modeled relationships among the Mesozoic spiriferinid families. Ind-Ole, Induan–Olenekian; Het-Toa, Hettangian–Toarcian.

In addition, our results also indicate that the crenulate hingeline of spiriferinids is not a synapomorphy. In our analysis, there are four genera with crenulate hingelines: Spondylospira, Pseudospondylospira, Dentospiriferina, and Rastelligera. Except for the former two genera, they are never grouped together in any of the consensus trees, implying that this character shows very low consistency and should not be overemphasized in the classification. By contrast, several genera with a jugal net always clustered together, sometimes as a monophyletic group (Fig. 3, Supplementary Fig. S2). Most genera that possess a jugal net are similar to one another in having a subconical ventral valve and in lack of dental adminicula. The jugal net therefore is probably a synapomorphy confined to subconical genera that lack dental adminicula.
Stratigraphic distributions of the Mesozoic spiriferinid taxa show that nearly half of the families first appeared in the Anisian (Fig. 7). Except for the “Pennospiriferinoidea” that originated in the Paleozoic, the other three superfamilies: the “Mentzelioidea,” Spiriferinoidea, and Bittneruloidea (excluding the Laballidae) appeared for the first time in the Anisian. Moreover, the Ladinian and Carnian also saw the rise of several new families. Since then, no major morphologic innovations and new families occurred. Accordingly, the burst of the lineages of the Mesozoic spiriferinids may have taken place in the Anisian (early Middle Triassic), which witnessed the greatest phylogenetic diversification of the Mesozoic spiriferinids.
Ecomorphologic Diversification
Ecomorphologic variations in the Mesozoic spiriferinids are tested using ecomorphospace occupation and disparity changes from the middle Permian to Early Triassic. The disparity value measures ecomorphologic diversity of the spiriferinids quantitatively, while the ecomorphospace occupation through the time directly shows morphologic change/adaptation to the morphospace variations. Before the end-Permian extinction, spiriferinids occupy a small area in the upper middle part of the diagram, containing taxa typical of spiriferinids. In contrast, spiriferids plot in the reticulariiform and spiriferiform areas. Besides, spiriferinids possess a much lower disparity value than spiriferids, indicating much lower ecomorphologic diversity than the latter at that time.
The Early Triassic witnessed a pronounced gap in disparity and a drastic decline in ecomorphospace due to dramatic depletion in biodiversity in the end-Permian extinction. The first burst of morphologies of spiriferinids took place in the Anisian (Figs. 5, 6) and is characterized by (1) occupation of ecomorphospace left by pre-extinction reticulariiform spiriferids and (2) strengthening spiriferinid occupation by the radiation of cyrtiniform genera. Clearly, spiriferinids occupied most of the reticulariiform area in Anisian. This area was previously filled by spiriferids rather than spiriferinids before the end-Permian extinction. During biotic recovery in the Anisian (Chen and Benton Reference Chen and Benton2012), abundant spiriferinids having reticulariiform shells flourished rapidly. Since then, the morphologically similar spiriferinid genera occupied this area until the clade was wiped out in the end of the Early Jurassic. The Anisian morphologic diversification is also characterized by the radiation of cyrtiniform spiriferinid genera. The cyrtiniform shells appeared very early in the histories of both the Spiriferida and Spiriferinida (e.g., Cyrtia in the Spiriferida, Cyrtina in the Spiriferinida), but the cyrtiniform members are relatively rare in the Paleozoic. They became a major group of the spiriferiformis for the first time in the Triassic.
After the Anisian, the ecomorphospace occupation and disparity value of spiriferinids increased gradually and reached their highest level in the Late Triassic. In the Norian, spiriferinids maximized their traditional ecomorphospace of cyrtiniform area and also occupied the greatest ecomorphospace of the Changhsingian spiriferids. Their ecomorphospace therefore reached its maximum level since the end-Permian mass extinction. However, it should be noted that the Norian (21.6 Myr; Ogg and Chen Reference Ogg, Chen, Gradstein, Ogg, Schmitz and Ogg2020) has a much longer duration than the Changhsingian (2.2 Myr). The sampling duration of various time bins may bias the comparison of occupation space between the Norian spiriferinids and Changhsingian spiriferids. Thus, we collected spiriferid character data from the Wordian to Changhsingian (~16.9 Myr) and compared their ecomorphospace plotting area with that of the Norian (Fig. 5I). The plot shows that the Wordian–Changhsingian spiriferids possess only a slightly larger ecomorphospace area than the Changhsingian spiriferids, indicating that ecomorphospace plots are little affected by sampling durations of the various time bins. Accordingly, in the Norian, spiriferinids not only expanded their traditional ecomorphospace but also reoccupied most of the ecomorphospace left by their competitors, the spiriferids. This ecomorphospace peak is also reinforced by the highest values of disparity and biodiversity of the Triassic spiriferinids. Additionally, some spiriferinids plot in the marginal areas of the diagram, implying that shell morphologies were highly diverse in the Norian and some unique and highly adapted shell forms returned. For instance, the Late Triassic spiriferinid genus, Triadispira, has large, thick shells and is similar to the Permian reticulariiform spiriferid Johndearia. Another spiriferinid genus, Rastelligera, possesses a strongly transverse shell outline with a wide hingeline and resembles the Permian spiriferid Fusispirifer. To summarize, ecomorphospace occupation, disparity, and morphologic uniqueness all indicate that the Mesozoic spiriferinids had their greatest ecomorphologic diversification in the Norian, coupled with the biodiversification of this clade. In the Rhaetian, the spiriferinid ecomorphospace was significantly reduced. The coeval SOV disparity reaches its highest level, however, the SOR disparity declines, implying a random extinction event (Korn et al. Reference Korn, Hopkins and Walton2013). Both ecomorphospace occupation and disparity remained at low levels in the Early Jurassic following the end-Triassic extinction.
Overall, the Triassic spiriferinids took over a large area of the ecomorphospace released by Permian spiriferids in the Late Triassic, but the centroids of occupations and distributions of the two groups are significantly different (PERMANOVA, Triassic Spiriferinida vs. Permian Spiriferida, p < 0.001). One possible reason is that Permian spiriferiform spiriferids may have been taxonomically overclassified (Gourvennec and Carter Reference Gourvennec, Carter and Selden2007). Alternatively, it is also reasonable that spiriferinids may not have completely expanded into the spiriferiform area before they eventually became extinct in the Early Jurassic.
Morphologic Diversification Drivers
Increasing evidence shows that, for spiriferiformis, the variation of shell outline and depth of the sulcus can provide a variety of preferential conditions to generate a robust passive feeding flow along the spiral feeding organs (Shiino Reference Shiino2010; Shiino and Kuwazuru Reference Shiino and Kuwazuru2010, Reference Shiino and Kuwazuru2011; Lee et al. Reference Lee, Jung and Shi2018). Other functional structures such as the development of shell thickening, ventral interarea, and shell size work together to help them adapt to various seawater conditions (Shiino and Angiolini Reference Shiino and Angiolini2014). In addition, Lee et al. (Reference Lee, Shi, Park and Tazawa2016) reported convergent evolution of Permian spiriferids that live in spatially separate but ecologically compatible habitats in the moderate latitudes of each hemisphere, implying that the habitat latitude could also affect the shell shape in some ways. Accordingly, although characters may be controlled by historically phylogenetic and developmental processes, the shell characters of spiriferiformis clearly also affect the stabilization or attachment of the shell, and spiriferiformis need to develop functional characters that can work coherently to provide the ideal passive feeding flow for the animals to live in ambient environments. In other words, these characters respond to both the environments brachiopods inhabit and their positions in ecospace.
The above assumptions imply that the ecomorphospace expansion of spiriferinids is linked to the diversification of their life strategies and habitats. Biodiversity increase in the Triassic spiriferinids is coupled with the new occupation of the previous reticulariiform region, a strengthening and expansion of the cyrtiniform area, and invasion of the spiriferiform region (Fig. 5).
Generally, the reticulariiform and spiriferiform brachiopods lived with their pedicle attached to a hard substrate. However, a large and thick shell indicates that the pedicle became rudimentary and nonfunctional. Large reticulariiform taxa lay free on the seafloor, while some huge spiriferiform taxa developed wide hingelines and alate outlines, and they could lie on soft seabeds with their shells stabilized by the wide hingelines and interareas (Vörös et al. Reference Vörös, Kocsis and Pálfy2016). According to the paleolatitude data in the PBDB, Permian reticulariiform taxa were widespread and appeared in various environmental settings worldwide. In contrast, Permian spiriferiform genera, especially those with strongly transverse shells (e.g., Fusispirifer, Transversaria), were usually distributed in moderate to high latitudes (i.e., the Himalayas, Australia, New Zealand, and New Caledonia; Waterhouse Reference Waterhouse2016). The Triassic spiriferinids expanded into ecomorphospace occupied previously by the reticulariiforms and spiriferiforms and also exhibit comparable latitude-control distribution patterns, with reticulariiform taxa (such as Mentzelia, Koeveskallina) widespread from the Tethys to Gondwana (Dagys Reference Dagys1974; Guo et al. Reference Guo, Chen and Harper2020), and the large and transverse spiriferiform ones (i.e., Rastelligera, Psioidiella) emerged in New Zealand and New Caledonia (Campbell Reference Campbell1968).
The cyrtiniform genera usually possess a rather high interarea, with a large delthyrium. In the Triassic, they were more common in low to moderate latitudes. For those genera, the delthyrial cover plate is an important structure that reflects their life strategies. Some Triassic cyrtiniform spiriferinids have open delthyria or a delthyrium covered by deltidial plates. These taxa may have lived resting on soft substrates with the interareas adpressed to the substrate or with the heavy umbones and conical ventral valves partially sunk into the sediment (Baeza-Carratalá et al. Reference Baeza-Carratalá, Manceñido and Joral2016). It is noteworthy that two novel types of delthyrial cover plate that were never present in the Paleozoic spiriferids occurred in the Triassic spiriferiformis. Neocyrtina developed a peculiar delthyrial cover plate that consisted of two parts: imbricating plates near the hingeline and irregular solid nodules apically, and it was thought to have lived with the ventral umbo attached to the substrate (Yang and Xu Reference Yang and Xu1966; Chen et al. Reference Chen, Zhao, Wang, Luo and Guo2018). Several Triassic taxa, for example, Thecocyrtelloidea tubulosa and Bittnerula zitteli, embraced special deltidia ornamented with “tubular spines.” These spiriferinids may possess “pedicle fibers” extending from fine tubes to support the shell above the sediment (Yang and Xu Reference Yang and Xu1966) or may have solid and tubular spines that project downward into the sediment, acting as attachment or stabilizing structures (Cowen and Rudwick Reference Cowen and Rudwick1970).
The ecomorphospace plot also shows that ecomorphospace distribution of the Triassic spiriferinids lacks any taxonomic selectivity. Taxa plotted in the reticulariiform area belong to the Mentzeliidae (e.g., Mentzelia, Madoia) or the Spiriferinoidea (e.g., Viligella, Liospiriferina) or the Pennospiriferinidae (e.g., Spondylospiriferina). They possess different evolutionary histories (Fig. 7) but eventually converged morphologically: smooth shells, short hingelines, and rounded cardinal extremities. The members of the Spiriferinoidea (e.g., Cisnerospira) can also evolve a subconical shell and appear in the cyrtiniform region, together with genera within the Bittneruloidea. This evidence implies that spiriferinids from different taxonomic groups modified their morphologies for adaptation to similar environments or comparable lifestyles. After the P-Tr extinction, vast regions of spiriferid ecospace were available for the Triassic spiriferinids to inhabit, and the latter also made some morphologic changes to adapt to the new ecospace. Thus, ecomorphospace variation between the spiriferids and spiriferinids indicates that in the Permian, the diversification of spiriferinids was constrained by the spiriferids, and only when the latter disappeared, did the spiriferinids have enough ecospace to develop. The empty ecomorphospace released by the extinct Permian spiriferids was, therefore, one of the important drivers facilitating the ecomorphologic diversification of the Triassic spiriferinids.
Variation in the occupation of morphologic space through important ecologic crises has been reported by Sclafani et al. (Reference Sclafani, Congreve, Krug and Patzkowsky2018). These authors found that the new strophomenids that appeared in the Silurian are clustered in a previously unoccupied region; nevertheless, rare newcomers revisited the region occupied by Ordovician-type brachiopods (Sclafani et al. Reference Sclafani, Congreve, Krug and Patzkowsky2018). Unlike the Silurian strophomenids, new spiriferinids in the Triassic refilled a large area of the ecomorphospace hitherto occupied by pre-extinction spiriferids. This is possibly because spiriferids occupied almost all niches in the shallow seas before the P-Tr extinction, and they left an entire ecospace to the Triassic spiriferinids for exploitation after their disappearance during the extinction. Then the Triassic spiriferinids diversified their morphologies to inhabit the ecospace left vacant by the extinct spiriferids. When the Triassic spiriferinids reoccupied most of the ecospace released by the Spiriferida, their biodiversity also peaked.
The changing trends of taxonomic diversity and ecomorphologic disparity of the Mesozoic spiriferinids also seem to correlate with the seawater temperature variation through the Triassic. After the P-Tr extinction, high seawater temperature, along with widespread anoxia, prevented the recovery of the spiriferinids in the Early Triassic (Chen and Benton Reference Chen and Benton2012; Sun et al. Reference Sun, Joachimski, Wignall, Yan, Chen, Jiang, Wang and Lai2012; Song et al. Reference Song, Wignall, Chu, Tong, Sun, Song, He and Tian2014; Huang et al. Reference Huang, Chen, Wignall and Zhao2017, Reference Huang, Chen, Algeo, Zhao, Baud, Bhat, Zhang and Guo2019). Major cooling events of seawater temperatures in the Anisian and Carnian (Trotter et al. Reference Trotter, Williams, Nicora, Mazza and Rigo2015; Sun et al. Reference Sun, Orchard, Kocsis and Joachimski2020) seem to have facilitated the recovery of the spiriferinids and their radiation in the Triassic. The former seems to have stimulated phylogenetic diversification and rebounds of ecomorphologic occupation of the spiriferinids in the Anisian. The latter cooling event possibly resulted in a greater increase in biodiversity and ecomorphologic disparity in the Late Triassic. Accordingly, both seawater temperature and oxygen content have likely acted as two extrinsic factors driving diversification of the spiriferinid brachiopods in the early Mesozoic. Nevertheless, further research based on data in smaller time bins is necessary to certify their relationships, and more research is needed to understand how these environmental factors affect the morphologic innovation of the spiriferinids physiologically.
Conclusions
The higher-level parsimony-based phylogenetic analysis of the Mesozoic spiriferinids presents trees of Mesozoic families. The results show that, except for the Bittneruloidea, which possibly originated from the Laballidae, all other Mesozoic spiriferinids may have evolved from the Pennospiriferinoidea. Nearly half of the Mesozoic families occurred in the Anisian, suggesting the burst of the lineages of the Mesozoic spiriferinids may have taken place then, marking the greatest phylogenetic diversification event in that clade. Ecomorphologic analysis shows that the Spiriferinida is restricted to a small ecomorphospace area, while the larger area was occupied by the Spiriferida before the end-Permian mass extinction. In the Triassic, the Spiriferinida reoccupied almost the entire ecomorphospace area released by the Spiriferida. The spiriferinids also fully exploited the cyrtiniform area and invaded new ecomorphospace. In the Late Triassic, the ecomorphologic disparity of this clade rebounded to the level of the pre-extinction spiriferids. This suggests that the empty ecomorphospace released by the extinct Permian spiriferids was one of the important drivers for the ecomorphologic diversification of the Triassic spiriferinids. The end-Permian extinction event killed off the competitors of Spiriferinida and provided this clade with an unrivaled opportunity to flourish before its demise at the end of the Early Jurassic.
Acknowledgments
We sincerely thank T. A. Grunt, S. Lee, and H. T. Wu for providing us with some important publications. We are very grateful to T. L. Stubbs and M. J. Benton for their helpful guidance on the analytical approaches. We would also like to thank two anonymous reviewers and associate editor J. Crampton for their critical comments and constructive suggestions, which greatly improved the quality of the paper. The contributors of the PBDB are also thanked for their provision of taxonomic data for the database. This study was supported by three NSFC grants (41821001, 41830323, and 41930322) and by 111 project of China (grant no. BP0820004). This is a contribution to the IGCP 630: Permian–Triassic climatic and environmental extremes and biotic responses.