I. INTRODUCTION
The nano/micromechanical behavior of metals has been the focus of intense research for well over 50 years. In the past, much emphasis was placed on microscale measurements due to perceived errors in very near surface or nanoscale measurements.Reference Poole, Ashby and Fleck1 This interest is driven in large part by the emerging “nano” technology sector that continues to push the envelope for designing structures at the micro and nanoscale. It has been well established that the flow stress of metals can be characterized by measuring the hardness using microindentation but the research was limited to the microrange. Over the past two decades, advances in characterization equipment and techniques, such as Instrumented Indentation Testing (IIT) and continuous stiffness measurement (CSM), have revolutionized the ability to probe surface layers accurately to less than 50 nm. The use of IIT to characterize the properties of materials at depths as shallow as 20 nm or less has become very popular in recent years.Reference Mencik2 This technique is used to measure the very near-surface hardness and elastic modulus of materials and can be used for bulk or composite (thin film) systems.
The hardness of a material is generally defined as the ability of a material to resist plastic deformation and has particular significance in polycrystalline metals as it is related to the flow stress (yield) and the tensile stress. The flow in a metal takes place when plastic deformation occurs as a result of a specific loading condition. In this case, when an indenter is pushed into the metal using hardness tester, a measure of the flow stress can be determined using the familiar relation where hardness equals three times the flow stress. When attempting to characterize the mechanical behavior of metals for both bulk and thin films, it has long been known that at small scales, the hardness is observed to increase with decreasing depth of indentation for certain metals as demonstrated by Ma and ClarkeReference Ma and Clarke3 and Nabarro et al.Reference Nabarro, Shrivastava and Luyckx4 To account for this size effect, several theories have been proposed by Fleck et al.,Reference Fleck, Muller, Ashby and Hutchinson5 Gao et al.,Reference Gao, Huang, Nix and Hutchinson6 Huang et al.,Reference Huang, Gao, Nix and Hutchinson7 including strain gradient plasticity (SGP) that includes an intrinsic length scale to replace conventional plasticity models. The basic framework proposed by the SGP has been modified in part by several researchers over the years, but the essential foundation lies in the belief that the indentation size effect (ISE) is governed by the presence of geometrically necessary dislocations (GNDs) within the plastic zone for indentations in the nanoscale range (generally taken to be less than 1 μm). Gao et al.Reference Gao, Huang, Nix and Hutchinson6 developed a widely used relationship between microhardness and depth that has been used to describe the ISE based on the Taylor Dislocation Hardening model (TDH) and a characteristic length scale. The TDH model is used to relate the flow stress dependence on the presence of GNDs and statistically stored dislocations (SSDs) where the GNDs scale with the strain gradient, while the SSDs scale with the effective strain. When microhardness data are fitted to the Nix–GaoReference Gao, Huang, Nix and Hutchinson6 model, it remains linear, but when nanohardness data are introduced, the fit is no longer linear. This phenomenon has been noted by several investigators including Kim et al.Reference Kim, Kang, Greer and Kwon8 and Durst et al.Reference Durst, Backes and Goken9 when comparing hardness data across scales. An attempt to understand this breakdown led others to develop simulations to analytically model the behavior and ascertain the deviation for the nanohardness data. The simulation developed by Huang et al.Reference Huang, Zhang, Hwang, Nix, Pharr and Feng10 concluded that there are two main factors for the discrepancy between the Nix–GaoReference Gao, Huang, Nix and Hutchinson6 model and data from nanoindentation. The first factor is due to the indenter tip radius at small depths and the second one is due to the storage volume for the GNDs.
In this work, we examine the ISE for several FCC metals including 99.999% aluminum, 99.95% nickel, 99.95% silver, and 70/30 copper–zinc alloy (α-brass) using a single Berkovich indenter tip on the same test machine. This machine is capable of providing loads that resulted in depths that extend from the nanorange to the microrange (50 nm to 25 μm), respectively. These metals were chosen based on their stacking fault energy (SFE) with α-brass having a very low SFE of >10 mJ/m2 and aluminum having a very high SFE of 200 mJ/m2. Two metals with intermediate SFE, nickel (125 mJ/m2) and silver (22 mJ/m2), were also chosen. The plastic deformation of FCC metals is directly influenced by the SFE. The SFE is a measure of the distance between partial dislocations and has a direct impact on the ability of dislocations to cross slip during plastic deformation. The lower the SFE, the larger the separation between partial dislocations, and thus, cross slip and dynamic recovery are inhibited. The SFE impacts pure metals differently from alloys.
It is our belief that no other work has been published to date that examines the ISE of polycrystalline metals using the same hardness machine with a single tip that covers the range mentioned above (50 nm to 25 μm depth of indentation). There have been several investigations of the ISE in single crystal metals including Ma and ClarkeReference Ma and Clarke3 and some researched polycrystalline metalsReference Elmustafa and Stone11 using nanoindetation testers in the near-surface range with a Berkovich shaped indentation tip and traditionally microhardness testers in the microrange with a Vickers indenter. Elmustafa et al.Reference Elmustafa, Ananda and Elmahboub12 concluded that when the data from microindentation tests are plotted along with nanoindentation data for α-brass and pure aluminum samples and fitted to the TDH model, the nano data produced a shallower slope when compared to the microindentation data. The microindentation data correlated well with the TDH model and the data exhibited a slope approximately close to one based on the model. They referred to this change in slope as “bilinear behavior.” However, because they used two different tips and two machines to collect the data, there were some questions regarding whether the actual cause of the bilinear behavior was mechanism based or due to the use of two different tips. The current work was conducted to address the existence of an ISE and to verify the bilinear behavior of these metals using a single tip.
II. EXPERIMENTS
A. Sample preparation
Four metals were chosen for this research according to their SFE. A plate of 76.2 × 76.2 × 3.175 mm was obtained from Kamis Inc. (Mahopac Falls, NY) for each metal. The metals chosen were 99.999% aluminum, 99.95% nickel, 99.95% silver, and 70/30 α-brass (Cartridge Brass C26000). Two samples were cut from each plate to a size suitable for nanoindentation testing.
The aluminum samples were annealed at 344 °C for 30 min and then air cooled to ambient temperature resulting in a grain size of 120 μm. The nickel samples were annealed at 750 °C for 60 min and then air cooled to ambient temperature resulting in a grain size of 100 μm. The silver samples were annealed at 350 °C and then air cooled to ambient temperature resulting in a grain size of 97 μm. The α-brass samples were stress relieved at 260 °C and then air cooled to ambient temperature resulting in a grain size of 63 μm.
The samples were polished using an Allied MultiPrep automated polishing system (Rancho Dominguez, CA) that can actively monitor the amount of material removed by means of a calibrated micrometer attached to the polishing head. This system can accurately control the speed, rotation, flatness, and load on the specimen to provide a high quality surface. The polishing procedure used for these metals is given in Tayon et al.Reference Tayon, Crooks, Domack, Wagner and Elmustafa13 This type of polishing procedure has been used in lieu of electropolishing for electron backscattered diffraction analysis and is capable of producing a nearly strain-free surface resulting in a deformed layer of less than 50 nm. The minimal deformation on the surface of a sample resulting from the use of this polishing technique is acceptable for nanoindentation testing. Properties at these shallow penetration depths are generally more scattered due to the effect of environmental noise, errors in tip calibration, surface roughness, and thermal drift. Therefore, the results in this article are focused on penetration depths that exceed the thickness of this deformed layer caused by polishing.
B. Indentation testing
Indentation tests were carried out on each sample using an XP Nanoindenter, from Agilent Technologies (Santa Clara, CA), outfitted with a high load option that allows testing to loads up to 10 N (1 kg force). The indentation tests were carried out using two different test protocols to compare and verify the ISE results. The first test technique was a traditional quasistatic load control test. During this test, the nanoindenter presses the stylus into the sample at a constant rate to a defined load and then holds at that load for a dwell time of 10 s and then unloads. The stiffness of contact is determined from the slope of the load–depth curve during the unloading segment of the test, and the data were used to determine the mechanical properties of the sample by the Oliver–PharrReference Oliver and Pharr14 analysis. The load control experiments were conducted with loads ranging between 0.3 (10−3) and 10 N. This test technique provides the hardness and modulus at a specific load and penetration depth.
The second test protocol used the CSM technique. The CSM technique produces the evolution of hardness and elastic modulus as a continuous function of penetration depth into the surface by superimposing a small harmonic force oscillation (usually resulting in a harmonic displacement oscillation of 2 nm or less) on the tip during the loading cycle. This allows the stiffness of contact, and subsequently, the mechanical properties of the sample to be continuously evaluated by analyzing the harmonic force and harmonic displacement data, as detailed in Oliver and Pharr.Reference Oliver and Pharr15 The tests using the CSM were conducted to achieve the maximum depth possible in each specimen, typically 25 μm.
The calibration and verification of the tip area function for the Berkovich shaped tip of a penetration range up to 30 μm requires several steps. We performed a preliminary calibration procedure recommended by Agilent Technologies for an initial 2 μm of geometry using a fused silica standard. This procedure has been widely cited in similar research involving nanoindentation experiments where indentation tests are performed on a reference material with known mechanical properties. Using the resulting data (load, displacement, and stiffness), the lead term of the tip is fixed, and the residuals between the contact area and contact depth are minimized as demonstrated by Oliver and Pharr.Reference Oliver and Pharr14 The tip calibration (or area function calibration) is the process of determining best-fit coefficients for the Oliver Pharr function given by Oliver and Pharr.Reference Oliver and Pharr14 This area function is then verified by performing indentation tests to maximum penetration depths for different materials such as tungsten and high-strength steel (AISI 4340) where the tip shape can be readily verified over the entire penetration range using well-known standards.
Arrays of five indentation tests were conducted for each load with proper spacing between adjacent indents. The initial indentation tests were performed on the as-polished surface of each sample. At the beginning, no etching was performed on the samples to reveal grain boundaries or microstructure morphology. As discussed later, we performed indentation tests on a Ni sample that had been etched using a 50/50 nitric acetic solution to reveal the grain boundaries.
III. RESULTS AND DISCUSSION
A. Experimental considerations
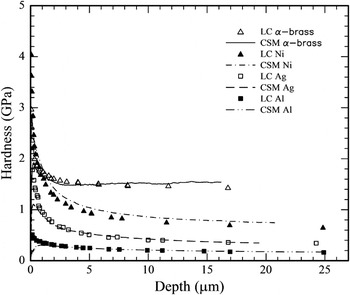
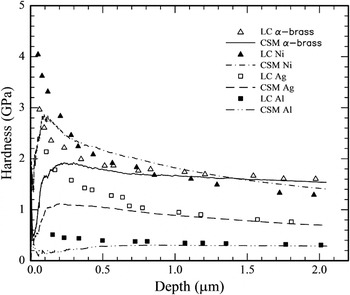
We chose to use both the CSM and load control protocols to verify the ISE for each metal. Our expectation was that the continuous hardness line from the CSM would trace through the discrete data points for hardness obtained using the load control test protocol; however, we noted a deviation from this expectation at very shallow depths for all the metals tested. The CSM data which are plotted against the load control data for all the samples in Fig. 1 agree very well from about 1 to 25 μm depth. A closer inspection of the data from the surface to about 2 μm as shown in Fig. 2 reveals that the hardness measured using the CSM deviates from the hardness measured using load control at depths less than 500 nm. Therefore, we conclude that the data from the load control protocol display a conventional ISE, whereas the data from the CSM protocol at depths below 500 nm are not.
CSM and load control data to ∼25 μm.

CSM and load control data from surface to 2 μm.

A review of recent research indicates that there are several opinions as to the exact cause of the deviation in the CSM data at very shallow depths, i.e., tapping effect. Of particular interest and relevance to this work are two differing proposed sources for the tapping effect when using the CSM for indentation experiments on FCC metals. The first theory to be examined involves the possible interaction of the indentation with a grain boundary resulting in a localized hardening due to several sources including solute and/or interstitial pinning of dislocations related to the Hall–Petch effect.Reference Almasri and Voyiadjis16–Reference Voyiadjis and Peters19 Next, we investigated the possibility that the CSM is responsible for this behavior based on research that was conducted by Pharr et al.Reference Pharr, Strader and Oliver20 on FCC metals having a high modulus to hardness (E/H) ratio.
B. Grain boundary interaction
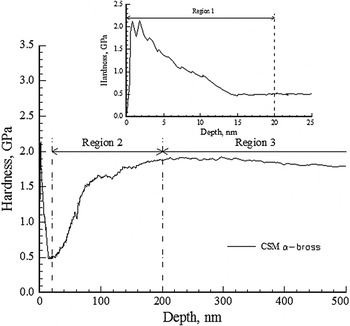
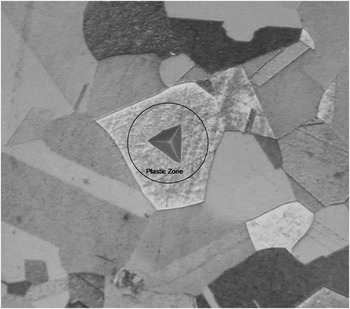
The effect of grain boundary strengthening on the hardness of metals, both FCC and BCC (body centered cubic), has been widely studied and well documented in the literature.Reference Wyrzykowski and Grabski21–Reference Beaudoin, Acharya, Chen, Korzekwa and Stout26 In many studies, the increase in hardness around a grain boundary was attributed to solute and/or interstitial pinning of dislocations, whereas in other studies, it was attributed to slip transmission across the grain boundary. In particular, Almasri and VoyiadjisReference Almasri and Voyiadjis16 reported similar hardness versus depth behaviors for nanoindentaiton tests of pure silver, nickel, copper, and aluminum polycrystalline samples. Their work presented results of indentation experiments on FCC metals to examine the ISE and was further discussed by Voyiadjis and Peters.Reference Voyiadjis and Peters19 They used an XP Nanoindenter with a Berkovich tip utilizing the CSM test protocol. They identified three regions where the ISE of the hardness changes similar to that shown in Fig. 3 for our α-brass data. They referred to Regions 1 and 3, where the hardness decreases with increasing depth, as being dominated by the SGP mechanism. They also concluded that Region 2 was dominated by grain boundaries acting as barriers to dislocation movement resulting in an increase in hardness with increasing depth. The hardening effect is driven by the volume of the plastic zone beneath the indenter increasing in size until it is obstructed by the grain boundaries as shown in Fig. 4. However, because the indentation process continues, the number of GNDs continues to be introduced into the plastic zone resulting in an increase in hardness. These observations are based on work presented by Yang and VehoffReference Yang and Vehoff27 where the dependence of ISE was investigated for several nickel samples having grain sizes of 850 nm, 1350 nm, and 80 μm. It was concluded that at grain sizes below 1350 nm, the material did not exhibit a true ISE, whereas at 80 μm, the material did show an ISE. These observations make sense given at smaller grain sizes as the indentation progresses into the material the plastic zone increases until it reaches the grain boundary. The effective strain gradient remains high until the indentation crosses over the grain boundary, therein the gradient is relaxed and the plastic zone continues to grow again. When the grain size is large enough to accommodate the entire plastic zone generated by the indentation, without any influence from grain boundaries, the material showed a classic ISE with continuously decreasing hardness with increasing depth. Almasri and VoyiadjisReference Almasri and Voyiadjis16 also noted that the hardness can be affected by impurities and their concentrations as cited by Sayan and UlrichReference Sayan and Ulrich28 in a study of the microhardness behavior of NaCl. Therefore, based on their conclusions, it would seem that this behavior is caused by factors related to the specimen chemistry and structural morphology. We anticipate that the hardness will continuously increase with decreasing depth due to ISE. Apparently, Almasri and VoyiadjisReference Almasri and Voyiadjis16 conclude that the ISE could be impacted by different mechanisms in these three regions despite the fact that the hardness fails to increase with decreasing depth.
Typical α-brass CSM hardness versus depth curve identifying the three regions of changing hardness as articulated by Almasri et al.Reference Almasri and Voyiadjis16 Region 1 is shown in the inset figure to a depth of ∼25 nm.

Schematic of an indent and associated plastic zone in a pure nickel sample having a grain size of ∼100 μm. The plastic zone is generally assumed to be 2.5 times the diameter of the indent.

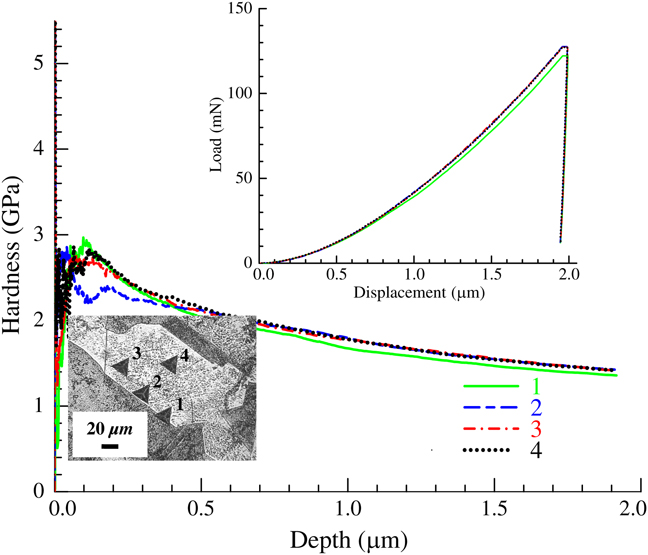
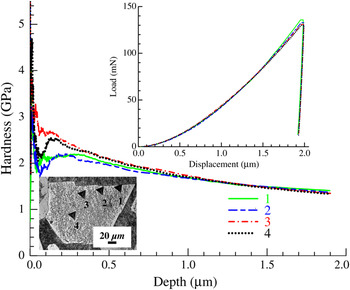
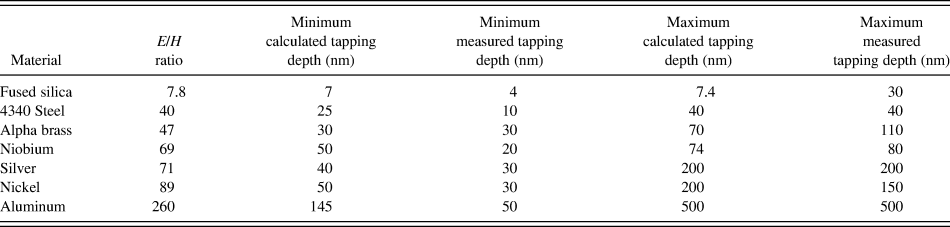
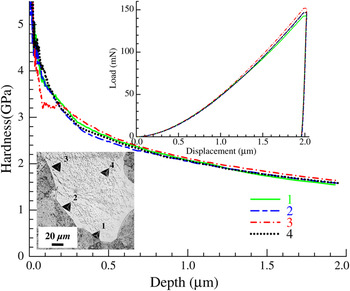
As stated previously, our initial tests were conducted on the as-polished surface of each sample. To investigate the effect of a grain boundary on the hardness, we performed a series of tests on a pure Ni sample where we made three indents at varying distances from the grain boundary and near the center of the grain. These tests were conducted in a manner similar to those reported by Brittion et al.Reference Britton, Randman and Wilkinson29 for commercially pure iron. We etched the surface of the Ni sample to reveal the grain boundaries under the microscope. Each indentation was made using the standard Testworks© XP CSM protocol (MTS, Eden Prairie, MN) with a maximum depth of 2 μm, a strain rate of 0.05/s and a hold time at maximum depth of 10 s. We also performed the tests using a new standard Berkovich tip (having a usable shape to about 3 μm) on one grain and for comparison our previously used tip for high loads (capable of reaching depths up to 30 μm) on another similarly sized grain. The results of the tests are shown in Fig. 5 for the high load tip and Fig. 6 for the low load tip. It is clear that the tapping effect is present for all indentations regardless of location with respect to the grain boundary.
High Load Berkovich Tip XP-Series Method on pure polycrystalline nickel. The hardness versus depth curve shows a clear tapping effect for all indentations regardless of location to grain boundary. Inset upper right shows the load displacement curves for each test. Inset lower left shows micrograph of indentations near grain boundary.
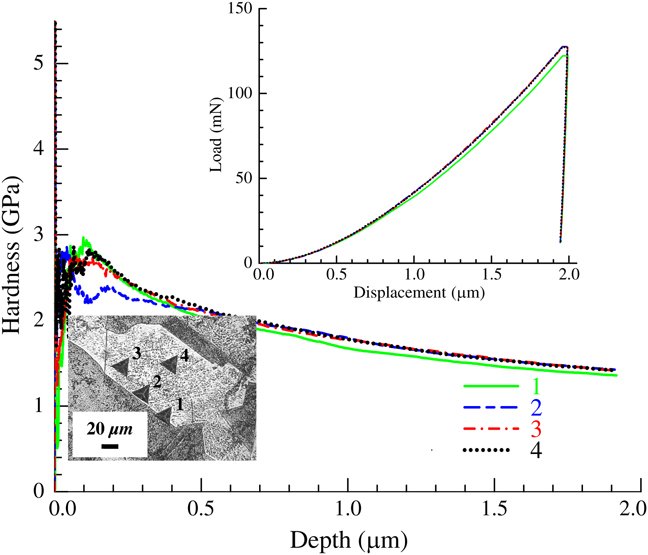
Standard Berkovich Tip XP-Series Method on pure polycrystalline nickel. The hardness versus depth curve shows a clear tapping effect for all indentations regardless of location to grain boundary. Inset upper right shows the load displacement curves for each test. Inset lower left shows micrograph of indentations near grain boundary.

C. CSM issues
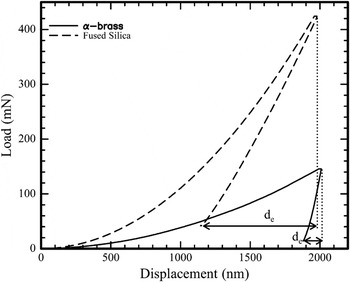
Pharr et al.Reference Pharr, Strader and Oliver20 also observed a similar behavior for soft metals with high modulus to hardness (E/H) ratios, such as single crystal copper, where the hardness increases and suddenly decreases before it increases back again unexpectedly at shallow depths less than 500 nm. They reported this behavior when testing a very soft metal, single crystal copper. It was noted that this behavior is expected for metals having a high contact stiffness with very little elastic rebound when using the CSM protocol. We confirmed this postulate as can be seen in Fig. 7, where fused silica exhibits a significant amount of elastic rebound on the unloading side of the curve and has a very low E/H ratio. The FCC metals exhibit almost no elastic rebound on the unloading side, which is indicative of a high E/H ratio metal. Pharr et al.Reference Pharr, Strader and Oliver20 stated that the stiffness, which for an elastic contact is given by the ratio of the load amplitude to the displacement amplitude, can be measured continuously during the loading cycle. It is assumed that the amplitude of the oscillation, usually 2 nm or less, has no significant effect on the overall loads and displacements. They determined that this assumption does not hold for soft metals with high E/H ratios. Pharr et al.Reference Pharr, Herbert and Yanfei30 concluded that at shallow depths, the dynamic unloading produces errors in load and displacement that result in the indenter lifting off the surface during the CSM oscillation cycle and produces noisy unreliable data. The drop in the hardness occurs because the force oscillation required to generate the target displacement oscillation, which is between 1 and 2 nm by default, is too large to be supported by the material and this causes a loss of contact with the sample resulting in a lower reported stiffness. Since stiffness is defined as the harmonic force divided by the harmonic displacement, the resulting hardness and modulus readings will be lower than the actual values.
Load–depth curves for α-brass and fused silica. The elastic rebound is denoted by d e.

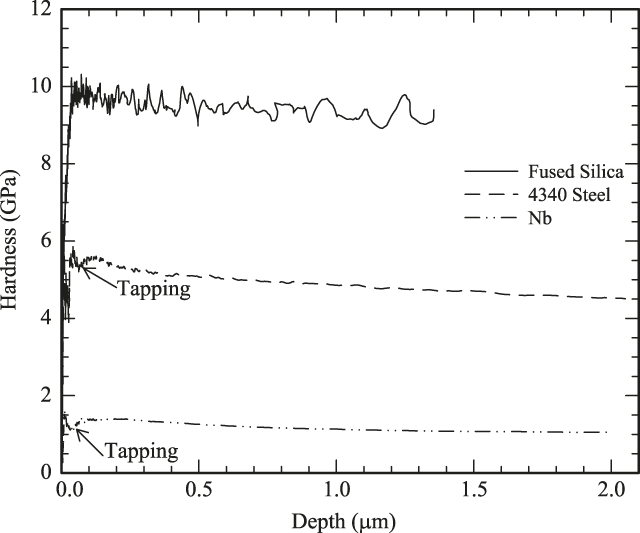
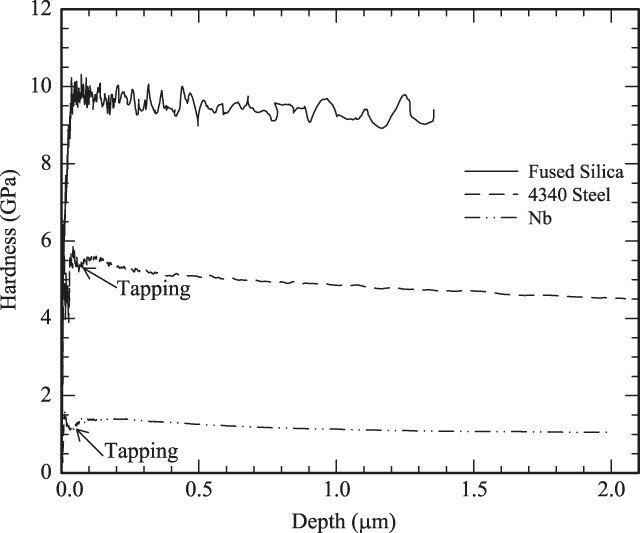
Hardness depth curves for various E/H ratio metals.
Pharr et al.Reference Pharr, Strader and Oliver20 developed a model for predicting the maximum and minimum depth to which the “tapping” can be expected to occur for a high ratio (E/H) metal having a clear ISE. The tapping depth can be determined from Eq. (1) given below, which stems from the Gao et al.Reference Gao, Huang, Nix and Hutchinson6 model:

where h tap is the maximum, or minimum, depth that tapping can be expected to occur based on the reduced modulus Er, Ho is the bulk hardness, the indenter geometry ψ, h * is a material dependent characteristic length, K and m are constants, and h is related to the contact depth.
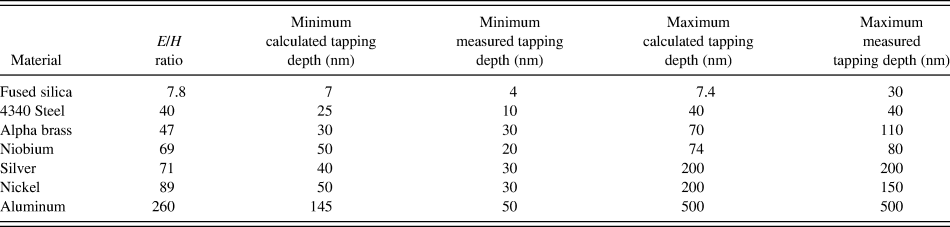
The calculated versus measured CSM tapping depths for the metals tested in this study are shown in Table I. We expanded the application of this model to hardness data from several materials other than the FCC metals described above to demonstrate the “tapping” effect. We chose fused silica, which has a very low E/H, pure niobium, which has a BCC structure and moderate E/H ratio, and we chose a 4340 steel with a body centered tetragonal (BCT) structure and moderate E/H ratio. The results of these metals are shown in Fig. 8. It can be seen that the fused silica exhibits very little to no tapping, while the niobium and 4340 steel samples exhibit some “tapping” to depths less than 70 nm. It is also noted that the fused silica shows no ISE, whereas the other metals do show a clear ISE. This is expected given the mechanical behavior of fused silica is not dislocation dependent. When comparing the data for each FCC metal, and including the reference samples, we could predict when the tapping would occur to within less than 20 nm. Pharr et al.Reference Pharr, Herbert and Yanfei30 stated that when using the CSM for high E/H ratio soft metals, the loss of contact with the surface due to tapping can only be minimized but not eliminated. They further provide for a correction to the force–displacement stiffness data to minimize the tapping effect in high E/H ratio metals. The correction is applied to the calculation of the load on sample and the displacement into surface. Specifically, the square root of two times the Harmonic Force to the load on sample and the square root of two times the harmonic displacement to the displacement into surface channel. This correction only minimizes the tapping effect therefore; it is for this reason that they recommend either not using CSM for characterizing the ISE of soft metals or using exceedingly small harmonic displacement oscillation sizes. We conclude through our research that beyond the predicted tapping range, it is acceptable to use both CSM and load control data.
Calculated versus measured depths for tapping to occur using CSM.
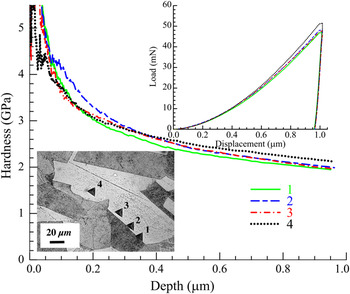
We repeated the experiments on the etched Ni sample along grain boundaries as described in the previous section, but this time, we used new G-Series CSM methods included in the Nanosuite© software package provided by Agilent. Nanosuite© is the latest driver interface for the XP Nanoindenter and replaces the previous Testworks© interface. The correction for load on sample and displacement into surface, mentioned above, has been incorporated into the latest CSM methods, included with the Nanosuite© software. The tests were set up exactly as before, except this time, a 1-μm depth was used for the standard Berkovich tip, while a 2-μm depth was used for the high load Berkovich tip. This change was added to compare the difference in depths along the grain boundary. The results of the new G-Series CSM test methods are shown in Figs. 9 and 10 for the high load and standard load Berkovich tips, respectively. It is clear that the corrections have significantly improved the shallow depth results for all the indentations regardless of location with respect to the grain boundary.
High Load Berkovich Tip New G-Series Method on pure polycrystalline nickel. The hardness versus depth curves show significantly minimized tapping effect for all indentations regardless of location to the grain boundary. Inset upper right shows the load displacement curves for each test. Inset lower left shows micrograph of indentations near grain boundary.

Standard Berkovich Tip New G-Series Method on pure polycrystalline nickel. The hardness versus depth curves show significantly minimized tapping effect for all indentations regardless of location to the grain boundary. Inset upper right shows the load displacement curves for each test. Inset lower left shows micrograph of indentations near grain boundary.

D. Discussion of experimental results
We have observed a deviation from the expected increase in hardness with decreasing depth that characterizes the ISE for several FCC metals using the CSM protocol. This deviation is not supported as a physically based phenomenon when using the traditional load control protocol, which shows a continued increase in hardness with decreasing depth as shown in Fig. 2. We could neither confirm nor deny the location of the indentations on the as-polished surface of the samples to ascertain what effect the grain boundary could be having on the results. Therefore, we conducted several experiments using the XP-based CSM protocol on the etched Ni samples at increasing distance from a grain boundary and found that the deviation in hardness at shallow depths is present regardless of location or tip used. We then used the G-Series CSM protocols that used a correction, which minimized the error associated with the measurements of load on sample and displacement into surface at shallow penetration depths along the grain boundary for the same Ni sample using the same two tips. We found that the deviation was significantly minimized. The CSM and load control data had much better agreement at very shallow depths of penetration.
The increase in hardness due to grain boundary interaction has been well established in the literature for BCC metals.Reference Faghihi and Voyiadjis17, Reference Wang and Ngan23, Reference Aifantis, Soer, De Hosson and Willis25, Reference Britton, Randman and Wilkinson29, Reference Pathak, Michler, Wasmer and Kalidindi31, Reference Faghihi and Voyiadjis32 However, for FCC metals, the results are less conclusive.Reference Wo and Ngan22, Reference Britton, Randman and Wilkinson29, Reference Lee, Robertson and Birnbaum33, Reference Vadalakonda, Banerjee, Puthcode and Mirshams34 Both Wo and NganReference Wo and Ngan22 and Britton et al.Reference Britton, Randman and Wilkinson29 conducted grain boundary experiments on FCC metals and found that the hardness was not directly affected by the presence of a grain boundary. Britton et al.Reference Britton, Randman and Wilkinson29 explained that in the case of FCC Cu, it would be expected to have slightly higher grain boundary strengthening as compared to BCC metals given the fewer available slip systems. However, FCC metals show no pop-in events on the load–depth curve that are associated with grain boundary interaction. This observation was attributed to an ease of slip transfer across the grain boundary for FCC Cu, whereas in BCC metals, there is typically dislocation locking due to Cottrell atmospheres associated with interstitial impurities. Referring to Figs. 5, 6, 9, and 10, we show that the load–depth curves show no strain burst or pop-in behavior that is typically associated with grain boundary interaction in BCC metals.Reference Wo and Ngan22, Reference Britton, Randman and Wilkinson29 Wo and NganReference Wo and Ngan22 also reported that they found that there was no significant statistical difference in the load–depth curve and associated hardness near selected grain boundaries for Ni3Al as compared to the grain interior.
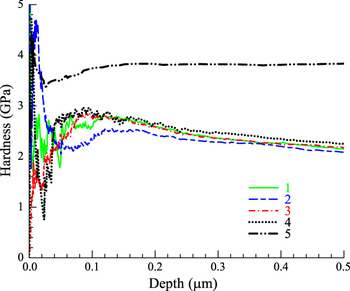
Finally, in Fig. 11, we compared data from the grain interior for each method and tip to previous data collected on the as-polished surface of Ni, along with Ni data taken by Voyiadjis and PetersReference Voyiadjis and Peters19 that were reported to be near a grain boundary. The tapping effect is present in all cases when using the XP CSM protocol. The data for the sample from Voyiadjis and PetersReference Voyiadjis and Peters19 do depict higher overall hardness but that is likely due to the difference in polishing procedures used that left the sample in a more work hardened state. The magnitude of the tapping effect in the hardness and depth were in good agreement with all the samples shown.
Comparison of hardness versus depth for pure nickel. (1) HL Berkovich Tip XP Method (Center Grain). (2) Standard Berkovich Tip XP Method (Center Grain). (3) HL Berkovich Tip XP Method (As-Polished Surface). (4) Standard Berkovich Tip XP Method (As-Polished Surface). (5) Voyadjis and PetersReference Voyiadjis and Peters19 Data Nickel (Acta. Mech. 211, 2010).

If the CSM protocol is used to study the ISE, then discrete data points obtained using a load control method should be used in the shallow range for verification. Based on the experimental evidence given above, we have determined that for the metals presented in this study, the deviations between the CSM and load control hardness data at very shallow depths are a result of the CSM tapping as articulated by Pharr et al.Reference Pharr, Herbert and Yanfei30 We have verified the ISE in these metals by showing that the hardness obtained by the load control test protocol in the shallow “tapping” range decreases with increasing depth and further over the entire plunge by both methods, CSM and load control.
E. Indentation size effect and bilinear behavior
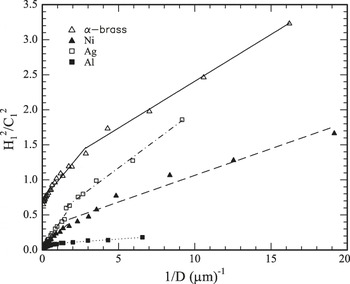
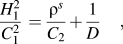
We wanted to examine the resulting hardness behavior and the ISE of several metals, having different SFE, using a single indenter tip. We used two different testing protocols (CSM and load control) to verify the ISE and in doing so identified a deviation between the hardness at shallow depths that had been previously examined by Pharr et al.Reference Pharr, Strader and Oliver20 The hardness data for all four FCC metals investigated are shown in Fig. 12 fitted to the Elmustafa and StoneReference Elmustafa and Stone11 model for the bilinear behavior. The model is described in detail by Elmustafa et al.Reference Elmustafa, Ananda and Elmahboub12 where they plotted the hardness as a function of the reciprocal of the depth and accounts for the contribution of GNDs and the strain gradient. In this model, which is given below by Eq. (2), H f is the hardness due to friction stress associated with the drag of dissociated dislocations and their interactions with point defects, ρs is the density of SSDs, λ ≈ 9 is a constant that relates the flow stress in shear to the hardness, Γ ≈ 19% is the shear strain in the plastic zone beneath the indenter, G is the shear modulus, b is the Burgers vector, β = 1, α ≈ 0.33 is a constant.
Bilinear behavior from nano- to microscale using a single tip.

where:
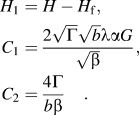
A plot of  versus 1/D should result in a straight line having a slope equal to one regardless of the depth. The slope of the nanoindetation data is notably different from the microhardness data. Also, it can be seen that the slopes for each metal in the nano-region are different, which is consistent with the findings of Elmustafa et al.Reference Elmustafa, Ananda and Elmahboub12 As seen in Fig. 12, the bilinear behavior is evident regardless of indenter geometry, including the tip radius above 20 nm. We conclude that tip issues do not contribute to the discrepancy in the Nix–GaoReference Gao, Huang, Nix and Hutchinson6 relation or the Elmustafa–StoneReference Elmustafa and Stone11 model for the bilinear behavior. This finding provides experimental support for the finite element simulations developed by several investigators to study the indenter tip radius effect in the micro/nanoindentation hardness in FCC metals. This finding also validates the observation of Elmustafa et al.Reference Elmustafa, Ananda and Elmahboub12 in which they determine that there is no plausible explanation to support the hypothesis that indenter geometry would have an effect on the bilinear behavior. Furthermore, the research presented in this paper would seem to also validate the conclusions that Elmustafa et al.Reference Elmustafa, Ananda and Elmahboub12 articulate that the SGP collapses at small scales and further supports the notion that the bilinear behavior of these FCC metals could very well be attributed to the presence of long-range shear stresses induced by GNDs.
IV. CONCLUSION
The following can be concluded from this research:
(i) We have verified that the bilinear behavior for pure Al and α-brass is mechanistic in nature and is observed regardless of the type of the self-similar indenter tip used.
(ii) The XP CSM protocol resulted in erroneous hardness readings at very shallow depths due to the errors in the reported load on sample and displacement into surface and the so-called “tapping” of the stylus as articulated by Pharr et al.Reference Pharr, Strader and Oliver20 We performed indentation tests along grain boundaries with the XP CSM methods using TestWorks and found the associated tapping effect errors in the shallow depth data regardless of the proximity to a grain boundary. We performed indentation tests along grain boundaries with the G-Series CSM methods using Nanosuite and found that the tapping issue is significantly minimized compared to the XP data regardless of the proximity to a grain boundary.
(iii) We also compared two different Berkovich tips, one new standard Berkovich tip having no tip blunting from previous use and one high load Berkovich tip that was previously used. There was no significant difference in the tapping effect.
(iv) An examination of the load depth curves show no significant “pop-in” events or “strain burst” type behavior regardless of the location that is typically associated with grain boundary hardening for BCC metals.
(v) Our data are in agreement with Britton et al.Reference Britton, Randman and Wilkinson29 for Cu as well as Wo and NganReference Wo and Ngan22 for Ni3Al in that FCC metals do not exhibit hardening effects due to interaction with the grain boundary interface. It is reported by Britton et al.Reference Britton, Randman and Wilkinson29 that only BCC metals show this type of behavior where there is a propensity for dislocation pinning and locking due to the Cottrell atmospheres associated with interstitial atoms. Also, for FCC metals, there is little resistance to slip transfer across grain boundaries.
(vi) A comparison of Ni data taken at the center of an etched grain, on the surface of an as-polished Ni sample, and near a grain boundary in NiReference Voyiadjis and Peters19 revealed that the tapping issue is present in all cases.
(vii) We therefore conclude that the apparent hardening/softening behavior at shallow depths for the FCC metals examined in this research is due to the errors associated with the XP CSM protocol and the so-called tapping effect for high E/H metals.
(viii) Despite the fact that the SFE of the single metals tested (Al, Ni, and Ag) depicted limited correlation with the magnitude of the ISE, the impact of interfacial energies including the SFE of the solid solution alloys (Cu–Zn, Al–Zn, and Ni–Cu) will be further examined in forthcoming research.