I. INTRODUCTION
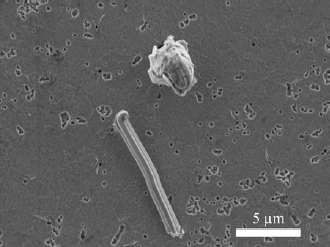
Whiskers and hillocks spontaneously grow on Sn and Sn alloy film surfaces as one form of stress relaxationReference Fisher, Darken and Carroll 1 (See Fig. 1). Whiskers and hillocks grow by accretion of atoms at the grain boundaries between whisker and hillock grains and their neighboring grains, leading to their growth out of the plane of the film. Whiskers maintain an approximately constant cross section as they grow from the film surface. Hillock grains grow both by this process and by lateral grain boundary migration in the film thereby growing both in height and width over time.Reference Boettinger, Johnson, Bendersky, Moon, Williams and Stafford 2 , Reference Pedigo, Handwerker and Blendell 3 While whisker growth in Sn films was recognized as early as 1951 as posing a risk of electric short circuiting of adjacent leads or components,Reference Compton, Medizza and Arnold 4 the electronics industry mitigated whisker formation by adopting Arnold’s discovery that Pb additions to electroplated Sn films eliminate whisker formation.Reference Arnold 5 With the ban of Pb in electronics due to regional legislation in 2006, pure Sn or Pb-free Sn alloy-electrodeposited coatings have replaced Sn–Pb coatings and the risk of Sn whisker formation has returned. Along with this risk, the study of the underlying mechanisms responsible for whisker and hillock formation has increased, with an emphasis on (i) the partitioning of stress relaxation between whisker and hillock formation, creep, grain boundary sliding, and other forms of stress relaxation; (ii) the formation of specific surface active sites for stress relaxation, with whiskers and hillocks being two types of such sites; and (iii) the localization of stress relaxation processes in thin-film microstructures. In this paper, we will refer generally to surface active sites for stress relaxation by growth out of the film as “defects” and to whiskers and hillocks specifically when those are the observed defect morphologies.
Scanning electron microscopy (SEM) image showing a whisker and a hillock growing from Sn + 0.7 wt% Cu film on a Cu substrate 30 days after electroplating with a current density of 60 mA/cm2.

Initial models of whisker and hillock growth focused on stress relaxation in a single grain, without significant consideration of why one grain in the original film was different enough from its surrounding grains or other grains in the microstructure to accommodate compressive film stresses by growth out of the film.Reference Chaudhari 6 , Reference Tu 7 In a study of one Sn whisker in a Sn–Cu film using synchrotron diffraction, Choi et al.Reference Choi, Lee, Tu, Tamura, Celestre, MacDowell, Bong and Nguyen 8 calculated that the deviatoric stress distribution around the whisker was inhomogeneous and the stress was low under the whisker but did not explicitly consider the role of microstructure and the differences in elastic anisotropy between the whisker and its neighboring grains or the average microstructure. Sobiech et al.Reference Sobiech, Welzell, Mittemeijer, Hügel and Seekamp 9 , Reference Sobiech, Wohlschlögel, Welzell, Mittemeijer, Hügel, Seekamp, Liu and Ice 10 proposed that whiskers most likely form in regions where a high stress or stress gradient exists due to the presence of large Cu6Sn5 intermetallic particles that form along the Cu–Sn interface and wet the Sn grain boundary triple junctions at the base of the whiskers. However, Pei et al.Reference Pei, Jadhav and Chason 11 determined that Sn grain boundary wetting by the intermetallic was widespread and whiskers did not form preferentially above the largest intermetallic particles at the Sn–Cu interface. In addition, intermetallics are not required for defect formation: whiskers and hillocks were observed by Williams et al.Reference Williams, Moon, Boettinger, Josell and Deal 12 to form on electroplated Sn–Cu films on tungsten substrates due only to electroplating-induced compressive stress since Sn and W do not form intermetallics.
Whisker growth models based on strain or stress gradients should be based on real microstructures that exhibit whisker and/or hillock formation. Since whisker and hillock densities are very low (1 whisker or hillock grain per 1000 film grains), the local microstructure around whiskers and hillocks is important. In terms of local driving forces and growth mechanisms, the elastic strain energy density (ESED) and all strain and stress components of the individual grains and their relationship in a microstructure must be examined. Zhao et al.Reference Zhao, Su, Ding, Chopin and Ho 13 calculated the ESED in a simulated microstructure based on the global texture of the film and found regions with high ESED. However, the model was not connected to actual microstructures or defects, and no specific predictions of defect formation were possible.
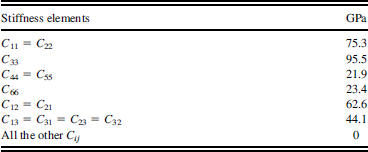
Lee and LeeReference Lee and Lee 14 proposed that differences in elastic anisotropy between the whisker grain and the average microstructure or environment are key features in determining the whisker location. Their model hypothesized that Sn elastic anisotropy provides strain localization, based on their observation that the crystallographic orientations of whiskers in the normal direction (ND) to the film surface were different from the dominant film texture as measured by x-ray diffraction (XRD).Reference Lee and Lee 14 The β-Sn structure is body-centered tetragonal (c = 0.3183 nm; a = 0.5832 nm),Reference Rayne and Chandrasekhar 15 and the physical properties are highly anisotropic. The elements of the stiffness matrix are listed in Table I Reference House and Vernon 16 ; the highest stiffness is along the c-axis, <001> direction, C 33 = 95.5 GPa. In the Lee and Lee’s model, a biaxial compressive stress of 8 MPa applied to a single crystal film creates an out-of-plane strain of 0.294% when the <001> direction lies in the film plane and an out-of-plane strain of 0.069% when the <001> direction is normal to the film plane. They proposed that in a polycrystalline thin film with columnar grains, the grains with the highest local out-of-plane strain crack the surface oxide and become whisker “nuclei.”
β-Sn elastic constants at 300 K.Reference House and Vernon 16

An alternative hypothesis based on Sn grains with specific crystallographic orientations relative to their neighbors is that some “weak” grains will plastically deform before the rest of the grains in the filmReference Chaudhari 6 , Reference Jadhav, Buchovecky, Chason and Bower 17 , Reference Sarobol, Pedigo, Su, Blendell and Handwerker 18 and become defect nuclei. The nondeforming grains remain elastically stressed, thereby creating a stress gradient in the film and a driving force for diffusion and whisker formation.Reference Fisher, Darken and Carroll 1 However, no specifics on the microstructural and crystallographic conditions for this to operate were given. To gain better insight into the detailed effects of local microstructure and the ESED gradient on defect formation, spatially localized measurements of strain, crystallographic orientation, and microstructures are needed from a representative set of surface defects from Sn-based films, not just from a single defect.
In this study, synchrotron microdiffraction was used to measure grain-by-grain orientations as well as the deviatoric elastic strain distributions in polycrystalline electrodeposited Sn–Cu films on Cu substrates. The specific electrolyte and the resulting films were chosen for this study based on previous research demonstrating the propensity of whisker and hillock formation.Reference Sarobol, Pedigo, Su, Blendell and Handwerker 18 From the microdiffraction measurements, misorientation angles between defect grains and their neighbors were calculated and compared with misorientation distributions for nondefect grains. The measured local grain orientations and microstructures were used in finite element analysis to simulate the local elastic strain and ESED distributions before defect formation. The simulated local strains (before defect formation) and local strains measured by microdiffraction (after defect formation) are compared. The defects were highly misoriented with respect to average film grain orientations, and this effect along with the anisotropic elastic properties lead to highly localized elastic strain and ESED, driving defect formation. The primary findings include that (i) defect grain orientations were not unique, relative to the film normal; (ii) defect grain orientations differ significantly from other grains in the film, leading to high misorientations around the defect grains; and (iii) the observed high misorientations create nonuniform localized elastic strain around the defects due to β-Sn elastic anisotropy. Based on elastic anisotropy, simulations predicted high out-of-plane elastic strains and high ESEDs at the highly misoriented grain locations, much higher than those of the surrounding grains (before defect formation). The highly misoriented grains became defects, and the measurements showed that the out-of-plane elastic strains at the defect grain locations appeared to have relaxed and the ESEDs at the defect grain locations were lower than those in the surrounding grains (after defect formation). Thus, the highly misoriented grains and the associated elastic anisotropy effect produce highly localized differences in elastic strain and ESED and determine the grains from which defects form.
II. EXPERIMENTAL DETAILS
A. Film deposition
Electrodeposition was performed at room temperature on ∼1-mm-thick Cu substrates (cold rolled and annealed). Before electrodeposition, the Cu substrates were electropolished to a scratch-free finish, etched in concentrated phosphoric acid, and rinsed first with deionized water, followed by ultrapure water. A methanesulfonic acid (MSA)-based commercial electrolyte was prepared using ultrapure water (>18 MΩ·cm). Cu MSA was added to the electrolyte to produce Sn films containing 0.7 wt% Cu and 1.2 wt% Cu as determined previously.Reference Pedigo, Handwerker and Blendell 3 , Reference Sarobol, Pedigo, Su, Blendell and Handwerker 18 , Reference Sarobol, Pedigo, Su, Li, Xue, Blendell and Handwerker 19 The pure Sn anode (>99.999%) was stationary and the Cu substrate disk cathode was rotated at 200 rpm, using a current density of 60, 80, or 120 mA/cm2. Cu MSA was not replenished in the electrolyte during plating; however, as noted in previous studies,Reference Sarobol, Pedigo, Su, Blendell and Handwerker 18 , Reference Sarobol, Pedigo, Su, Li, Xue, Blendell and Handwerker 19 this did not result in a detectable change in film concentration. Following the preparation of the films, both hillocks and whiskers developed with time on the Sn + 0.7 wt% Cu and Sn + 1.2 wt% Cu films stored at room temperature. Increasing the current density led to an increase in defect density; the general effects of the plating current density and the addition of the alloying elements were discussed previously.Reference Pedigo, Sarobol, Su, Handwerker and Blendell 20
B. Measurement of global grain orientation via area detector XRD
Global orientation or texture analysis was performed after plating, using an area detector XRD with a Cu source (Bruker GADDS, Bruker AXS, Inc., Madison, WI). Samples were rotated about the film normal during the measurement, imposing fiber texture, which is suitable for electrodeposited films, including Sn.Reference Frye, Galyon and Palmer 21 , Reference Lingk, Gross and Brown 22 Samples were tilted at 0° and 35°, allowing analysis at tilt angles up to 50°. Inverse equal area pole figures were constructed from the XRD data assuming fiber texture in the films, utilizing the MAUD (materials analysis using diffraction ) program.Reference Wenk, Cont, Xie, Lutterotti, Ratschbacher and Richardson 23 Each measurement from the area detector XRD sampled over 125,000 grains based on the beam diameter of 1 mm and an approximate grain size of ∼1–2 μm2. Texture measured using area detector XRD is more accurate than that measured by θ–2θ XRD using the peak intensity comparison method. As there are forbidden reflections, such as 111, corresponding textures are not directly measurable and must be determined by fitting the orientation distribution function.Reference Pedigo 24
C. Measurements of local grain orientation and strain distribution via microdiffraction
Local orientations and strain distributions were collected 30 days after plating, at the Advanced Light Source (ALS; Lawrence Berkeley National Laboratories, Berkeley, CA) beamline 12.3.2.Reference Kunz, Tamura, Chen, MacDowell, Celestre, Church, Fakra, Domning, Glossinger, Plate, Smith, Warwick, Padmore and Ustundag 25 The x-ray beam has a spot size of 0.5 × 0.5 μm and the scanning step size was 0.5 μm. Prior to measurements, the samples were inspected, and hillocks and whiskers of interest were marked using Pt surface deposition for locating defects in the beamline experiments. The examined areas around hillocks and whiskers were:
-
(i) three (20 × 20 μm) areas around whiskers on Sn + 0.7 wt% Cu electroplated at 60 mA/cm2,
-
(ii) one (20 × 20 μm) area around a hillock on Sn + 0.7 wt% Cu electroplated at 120 mA/cm2, and
-
(iii) six (40 × 50 μm) areas around hillocks on Sn + 1.2 wt% Cu electroplated at 80 mA/cm2.
During the microdiffraction scans, the highly focused polychromatic x-ray beam entered the samples at 45° to the sample normal, penetrating both the Sn–Cu films and the Cu substrates, producing the Laue patterns in reflection mode. For each measured point, the Laue diffraction pattern was captured. Background subtraction and peak intensity normalization were performed. The orientation determination was performed using the XMAS program.Reference Tamura, MacDowell, Spolenak, Valek, Bravman, Brown, Celestre, Padmore, Batterman and Patel 26 The x-ray beam penetrated through several grains for each scan step, due to the columnar grain structure of the film, but only the grain with the highest intensity reflections was reported.
The deviation of measured peak positions from the calculated positions (using the strain-free lattice parameters) was determined. The elastic deviatoric strain was determined by refining the lattice parameters (using a downhill simplex method within XMAS) to minimize the total deviation of the measured and calculated peak positions. The accuracy for elastic strain is within 0.005% strain or 50 × 10−6. The dilatational strain was calculated based on the assumption that the total stress component normal to the sample plane was zero (σZZ = 0). The ESED was then calculated based on the total elastic strain (εXX, εYY, εZZ, εYZ, εXZ, and εXY).
D. Simulation of local strain distribution via finite element modeling
To obtain a better understanding of the experimental results, the elastic response of the films calculated from microdiffraction was compared with those simulated using object-oriented finite elements, version 2 (OOF2). OOF2 solves the linear elasticity equation to obtain the local stresses in mechanical equilibrium. 27 , Reference Reid, Lua, García, Coffman and Langer 28 The two-dimensional (2D) freestanding film microstructure was built using the orientation maps obtained from microdiffraction scans (20 × 20 μm area) on the Sn + 0.7 wt% Cu film. Prior to simulation, the orientations of poorly indexed pixels were replaced by those of the nearest well-indexed pixels and the orientations of single-pixel grains were set to that of the majority neighboring grain. The microstructure was first meshed with a grid of 70 × 70 linear triangular elements, further annealed and refined to the order of 10,000 elements and 20,000 nodes to match the grain boundary features. The stiffness matrix of β-SnReference House and Vernon 16 was assigned to the generated triangular finite elements. All grains were assumed to be columnar in a film of uniform thickness. The plane stress condition (σZZ = σYZ = σXZ = 0) was imposed to simplify this system to become 2D. The consequence of this plane stress assumption will be addressed in detail in Sec. IV. Out-of-plane elastic strain and ESED distributions were simulated using an applied 0.1% uniform in-plane biaxial compressive strain (εXX = εYY= −0.001).
III. RESULTS
A. Global grain orientations
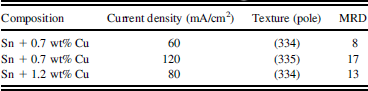
The textures from XRD macrodiffraction measurements are shown in area-weighted equal area inverse pole figures (IPFs) with intensities in multiples of a random distribution (MRD), assuming fiber texture, in the left-hand column of Fig. 2. In this work, all grain orientations and textures are reported as the (hkl) pole, or the (hkl) plane normal [in any noncubic crystal systems, the (hkl) pole is not equivalent to the [hkl] crystal direction. Due to β-Sn having a c/a ratio of 0.5701, the difference between poles and directions is quite significant]. The textures (preferred orientations), given in poles, and MRDs for the three composition/current density conditions are shown in Table II. Changes in texture, the degree of texture as characterized by the MRD, and defect density were previously reported as a function of current density and film composition by Pedigo et al.Reference Pedigo, Sarobol, Su, Handwerker and Blendell 20 As the current density increased, the MRD increased.
Global grain orientations (left) generated from macrodiffraction measurement and local grain orientations (right) generated from microdiffraction measurements on microstructures surrounding defects, displayed on ND, area-weighted, equal area IPFs of the Sn + 0.7 wt% Cu and Sn + 1.2 wt% Cu samples electroplated at current densities of 60, 80, and 120 mA/cm2. Each of the data points for the local texture from microdiffraction represents a single pixel in the scan area. For the 60, 80, and 120 mA/cm2 samples, the local textures were generated from 3254, 1182, and 3960 pixels, respectively.

Textures and MRDs of the investigated films.

B. Local grain orientations at defect locations
The orientations of individual grains from microdiffraction measurements for the three composition/current density conditions are shown in the area-weighted equal area IPFs in the right-hand column of Fig. 2. The top figure represents the cumulative data for three scans, the middle one for one scan, and the bottom one for six scans; the data for the middle figure are sparse but qualitatively agree with the measured global texture. These results suggest that the local grain orientations measured by microdiffraction are representative of global grain orientations measured by area detector XRD and are therefore representative of the films’ microstructures.
C. Orientations of whiskers and hillocks
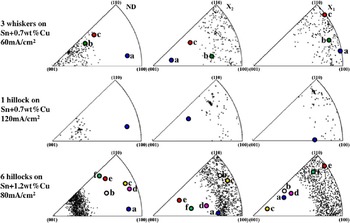
The orientations of whiskers and hillocks (colored points) shown in the equal area IPFs in Fig. 3 are significantly different from the orientations of random grains (black points). From Fig. 3, the orientations of the whiskers measured in the Sn + 0.7 wt% Cu sample plated at 60 mA/cm2 were (a) (811), (b) (323), and (c) (433), and the orientation of the hillock measured in the Sn + 0.7 wt% Cu sample plated at 120 mA/cm2 was (611). The orientations of the six hillocks measured in the Sn + 1.2 wt% Cu sample plated at 80 mA/cm2 were 2° to 4° within the (a) (911), (b) (522), (c) (631), (d) (931), (e) (432), and (f) (432). The defect grains do not have a unique orientation with respect to the sample normal. However, it can be seen qualitatively that the orientations of the whiskers and hillocks are significantly different from the neighboring grains as well as from the dominant textures of the films, as demonstrated in Fig. 3. Lee and Lee,Reference Lee and Lee 14 Frye et al.,Reference Frye, Galyon and Palmer 21 and Susan et al.Reference Susan, Michael, Yelton, McKenzie, Grant, Pillars and Rodriguez 29 also reported similar results.
Orientations of whisker and hillock grains (colored points) and other grains in the films (black points) from microdiffraction measurements shown in area-weighted equal area IPFs in normal, X 1, and X 2 directions for three whiskers on Sn + 0.7 wt% Cu electroplated at current density of 60 mA/cm2, one hillock on Sn + 0.7 wt% Cu electroplated at current density of 120 mA/cm2, and six hillocks on Sn + 1.2 wt% Cu electroplated at current density of 80 mA/cm2. All defect orientations differed from the surrounding grain orientations and the film textures.

D. Local grain misorientations
The measured local grain orientations from microdiffraction were used to calculate local misorientations as described in literature for tetragonal grain pairs.Reference He, Jonas and Rollett 30 The local defect misorientations between defect grains and their touching neighboring grains as well as the global misorientations between nondefect grains within the films can be represented by an axis and angle of rotation about that axis, which translate one grain orientation to the other grain orientation. In this work, only the minimum misorientation angle for each grain pair was used in the analysis. The misorientations between nondefect grains in the film were considered as the “global misorientations,” based on the agreement of the local texture collected by microdiffraction measurements and the global texture collected by area detector XRD measurements, as previously shown in Fig. 2.
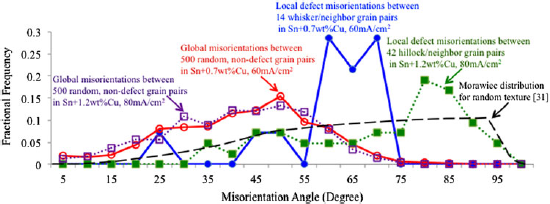
Ideally, the global misorientations around randomly selected nondefect grains should be between the nondefect grains and their touching neighboring grains in the scans. However, due to the small scan areas and the fact that not all the grains in the collected microdiffraction grain maps were well indexed, the data for the misorientations between nondefect grains and their touching neighboring grains were sparse (a 20 × 20 μm microdiffraction scan area measured a population of ∼120 grains). Thus, the global misorientations were calculated using orientations of nontouching nondefect grain pairs, which were randomly selected from three (20 × 20 μm) scan areas for Sn + 0.7 wt% Cu sample and six (40 × 50 μm) scan areas for Sn + 1.2 wt% Cu sample. Again, this “nontouching” assumption is valid because the local texture collected by microdiffraction measurements (sampling less than 500 grains) and the global texture collected by area detector XRD measurements (sampling over 125,000 grains) are similar. In this paper, the “global misorientations” are, therefore, between two nontouching nondefect grain pairs, randomly selected from each of the datasets from microdiffraction. The distributions of local defect misorientation angle (between defect grains and their touching neighboring grains) and “global misorientation” angle (between two randomly selected, nontouching, nondefect grain pairs) are shown in the fractional frequency of occurrence versus misorientation angle plots in Fig. 4.
Comparison of the global and local defect misorientation angle distributions of the Sn + 0.7 wt% Cu sample electroplated at current density of 60 mA/cm2 and the Sn + 1.2 wt% Cu sample electroplated at current density of 80 mA/cm2 to the global misorientation angle distribution calculated from random texture sample by MorawiecReference Morawiec 31 (dashed line). The global misorientations were between 500 randomly selected nondefect grain pairs with peak global misorientation angle of 50° at the frequency of 0.15 for Sn + 0.7 wt% Cu sample (red solid line with open circles) and at the frequency of 0.12 for the Sn + 1.2 wt% Cu sample (magenta dotted line with open squares). The local defect misorientations were between 14 whisker-neighbor grain pairs (blue solid line with filled circles) for the Sn + 0.7 wt% Cu sample with peak global misorientation angle of 57° to 69° and between 42 hillock-neighbor grain pairs (green dotted line with filled squares) for the Sn + 1.2 wt% Cu sample with peak global misorientation angle of >75°. The area under each curve is 1.

For the Sn + 0.7 wt% Cu electroplated at current density of 60 mA/cm2 sample, the local defect misorientations (blue solid line with filled circles in Fig. 4) were between the 3 whisker grains and their touching neighboring grains (14 defect-neighbor grain pairs). For the Sn + 1.2 wt% Cu electroplated at current density of 80 mA/cm2 sample, the local defect misorientations (green dotted line with filled squares in Fig. 4) were between 6 hillock grains and their touching neighboring grains (42 defect-neighbor grain pairs). For both the Sn + 0.7 wt% Cu and the Sn + 1.2 wt% Cu samples, the “global misorientations” from 500 randomly selected grain pairs (nontouching) were calculated (red solid line with open circles and magenta dotted line with open squares, respectively, in Fig. 4). Two distinct distributions were found for the local defect misorientations and “global misorientation.” An additional global misorientation angle distribution for randomly textured tetragonal polycrystals (independent of the c/a ratio) was derived by MorawiecReference Morawiec 31 and is plotted in Fig. 4 for comparison.
The “global misorientation” angle distributions in both the Sn + 0.7 wt% Cu and the Sn + 1.2 wt% Cu samples (red solid line with open circles and magenta dotted line with open squares, respectively, in Fig. 4) were nearly identical, with the highest frequency of occurrence of 0.15 and 0.12, respectively, at the peak misorientation angle of 50°. In contrast, very high misorientation angles (57° to 69° for three whiskers on Sn + 0.7 wt% Cu film and >75° for six hillocks on Sn + 1.2 wt% Cu film) were found only in local misorientations around defect grains. The spread in local misorientation angle distribution around hillocks tends toward that of the misorientation angles of a randomly textured sample given by Morawiec.Reference Morawiec 31 This results in a different local defect misorientation angle distribution than the global one; the peak misorientation angles around defect grains were much higher than those around other nondefect grains in the film. The peak local defect misorientation angle around three whiskers (57° to 69°) was lower than that around six hillocks (>75°).
The large differences in the orientation of defect grains and the touching neighboring grains, as well as their corresponding high misorientation angles at the defects, are hypothesized to cause localized high strain and ESED gradients due to β-Sn elastic anisotropy, providing the driving force for diffusion of Sn atoms to the base of the defect grains. To further understand the elastic anisotropy effect on the strain distribution around the defect grains, the measured and simulated out-of-plane elastic strain distributions, as well as the ESED distributions, were compared. Although it was not clear specifically how defects nucleate, the simulated out-of-plane elastic strain and ESED due to grain misorientations and elastic anisotropy represent the state before defects form, whereas the measured strains and the calculated ESEDs from the measured strains represent the state after defects form.
E. Elastic strain gradients and strain energy density distributions around defects
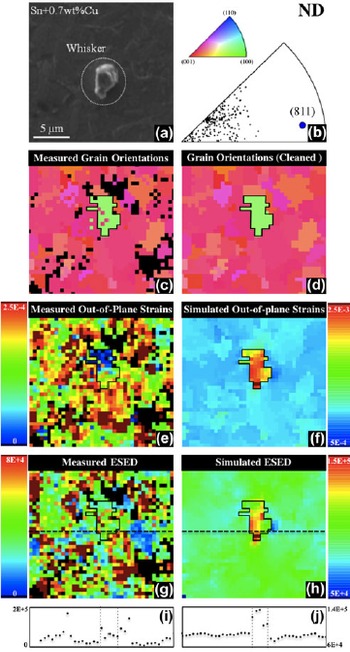
Microdiffraction measurements were performed after defect formation. The reported elastic strains and ESEDs may not be the same as when the defects initially formed. To better understand the effects of elastic anisotropy on the formation of defects, an OOF2 simulation was utilized to explore the distribution of local elastic strains and ESEDs due to grain orientations, but without the out-of-plane defect growth. The simulated local elastic strains and ESEDs from OOF2 were compared to those determined from microdiffraction measurements. A comparison is shown for the whisker in Fig. 5(a). The orientations of the whisker grain and other grains in the film projected in ND are shown using an IPF [Fig. 5(b)], along with the corresponding grain orientation map (in IPF colors) from microdiffraction [Fig. 5(c)] and cleaned map for simulation [Fig. 5(d)]. The measured out-of-plane elastic strain [Fig. 5(e)] and ESED distribution [Fig. 5(g)] were compared to the simulated out-of-plane elastic strain [Fig. 5(f)] and ESED distribution [Fig. 5(h)]. There are significant differences observed in both the out-of-plane elastic strain and the ESED at the whisker location compared to the surrounding grains, from both measurement and simulation.
(a) SEM image of a whisker on Sn + 0.7 wt% Cu film. (b) Orientation of the whisker grain (blue) and other grains in the film (black) displayed in the ND equal area IPF. (c) As-collected (from microdiffraction) grain orientation map presented in ND IPF colors (the black pixels correspond to poorly indexed areas). (d) Cleaned grain orientation map in ND IPF colors used for OOF2 simulation. (e) Measured out-of-plane elastic strain distribution from microdiffraction. (f) OOF2 simulated out-of-plane elastic strain distribution. (g) Measured ESED distribution from microdiffraction. (h) OOF2 simulated ESED distribution. The out-of-plane elastic strain distribution around the whisker grain from microdiffraction measurement is near zero, whereas that from OOF2 simulation is predicted to be much higher than elsewhere in the film. The measured ESED of the whisker grain is lower than the average ESED in the scan area, whereas the simulated ESED of the whisker grain is higher than that of the other grains in the film. (i) Line plot of measured ESED as a function of distance across the whisker grain corresponding to the position of the dashed line in (g). (j) A line plot of simulated ESED as a function of distance across the whisker grain corresponding to the position of the dashed line in (h).

For the specific whisker in Fig. 5, the misorientation angles between the whisker grain and its neighboring grains ranged from 55° to 69°. The measured elastic strain distribution after whisker formation was quite nonuniform. The measured out-of-plane strain at the whisker grain was lower than that of the surroundings as shown in Fig. 5(e). In fact, the out-of-plane elastic strain at the whisker root was (80 ± 50) × 10−6, whereas the average out-of-plane elastic strain of the surrounding area was (250 ± 50) × 10−6, 3 times higher than the whisker grain. The fact that the measured out-of-plane elastic strain was much lower for the whisker than the surrounding area confirmed that defect growth produces stress relaxation. Out-of-plane elastic strain in the whisker grain measured via synchrotron microdiffraction by Sobiech et al.Reference Sobiech, Wohlschlögel, Welzell, Mittemeijer, Hügel, Seekamp, Liu and Ice 10 also reported a similar result where the strain was nearly zero.
In the simulation, the elastic response, including elastic anisotropy, to an applied in-plane biaxial strain represents the state before whisker formation. The simulated out-of-plane elastic strain in the whisker grain is about 2.4 times higher than other grains in the film, assuming a plane stress condition. The simulated elastic strain arises directly from the β-Sn stiffness anisotropy. As the whisker grain normal orientation was a (811) pole, the c-axis, <001> direction with the highest stiffness, lies nearly parallel to the film plane. Nondefect grains have an average texture at the (334) pole, with the angle between the c-axis and the film plane of about 70°. Hence, it was expected that the applied in-plane strain would induce high out-of-plane elastic strain for the whisker grain relative to the surrounding grains, with a simulated out-of-plane elastic strain at the whisker grain of 2280 × 10−6 and a simulated average out-of-plane elastic strain of the surrounding grains of 945 × 10−6.
The measured ESED distribution after whisker formation was also highly nonuniform. The ESED was calculated using all the components of total strain tensor:
 $${\rm{ESED}} = {1 \over 2}\mathop\sum\limits_{i = 1}^6 \!{{\rm{\sigma }}_i {\rm{\varepsilon }}_i } = {1 \over 2}\mathop\sum\limits_{i = 1}^6 {\mathop\sum\limits_{j = 1}^6 {C_{ij} {\rm{\varepsilon }}_i {\rm{\varepsilon }}_j } } \quad,$$
where σ i is the total stress, ε i is the total strain, and Cij is the stiffness in the Voigt notationReference Voigt 32 as listed in Table I. Because the strains exist in all directions, the ESED may be high even when the out-of-plane stress (σZZ) and out-of-planes strain (εZZ) are nearly zero. Figures 5(i) and 5(j) show line plots of ESED (J/m3) as a function of distance across the whisker grain, corresponding to the dashed line positions in Figs. 5(g) and 5(h). The measured ESED of the whisker grain is 2–3 times higher than ESED of some of the nearest neighboring grains but is lower than the average ESED in the scan area. For the simulated ESED (uniform in-plane compressive strain applied), again analogous to the state before whisker formation, the whisker grain exhibited an ESED that was 1.4 times higher than those of the other grains in the film.
In summary, based on elastic anisotropy and no relaxation, simulations predicted high out-of-plane elastic strains and high ESED in the highly misoriented grains that become defects, much higher than those of the surrounding nondefect grains. Microdiffraction measurements showed that the out-of-plane elastic strains in the defect grains appeared to have relaxed, leading to lower ESED in the defect grains compared with the surrounding grains. Although we do not have microdiffraction measurements of the microstructures before defect formation, these results suggest a two-step process: initially high elastic strains and ESEDs before defect formation leading to growth and local relaxation.
IV. DISCUSSION
An inherent problem in measurements from polychromatic (Laue) microdiffraction is that the total out-of-plane stress must be assumed to be zero (σZZ = 0) to calculate the dilatational strain from the measured deviatoric strain in noncubic systems. The magnitude of the calculated dilatational strain was very small, on the average of 2% of each deviatoric strain component. Using the elastic constants, the total stress tensor was calculated from the total strain tensor (dilatational + deviatoric), and stresses exist in all directions in each grain. Thus, the local stress from microdiffraction was not biaxial. Similarly, using synchrotron microdiffraction, Choi et al.Reference Choi, Lee, Tu, Tamura, Celestre, MacDowell, Bong and Nguyen 8 reported that the local stress around a whisker was not biaxial.
An analysis by Vodnick et al.Reference Vodnick, Nowak, Labat, Thomas and Baker 33 found that local deviations from plane stress exist near 111/110 texture boundaries in thin Cu films assuming that the boundary cannot slide. Extending this to the case of grain boundaries in Sn films, we expect local deviations from plane stress to exist near grain boundaries in our films. As the grain size is only a factor of 2–4 larger than the beam size, the dilatational strain will be larger than the near zero value calculated assuming that the out-of-plane stress is zero.
In this work, the 2D simulation was limited to a columnar grain geometry, where all the grain boundaries extend from the surface of the film. In reality, the defects on these films were surface grains, not columnar grains. Thus, the effects of the grain boundary geometry of the defect on the elastic strain and ESED distributions are yet to be determined. Moreover, the 2D simulation was limited to a plane stress condition. In contrast, the experimentally determined stresses exist in all directions in each grain. Thus, the absolute magnitude of strain from the measurement and that from the simulation cannot be directly compared. However, the relative magnitudes of the strains of the defects and those of the surrounding grains can be compared. The simulation result from this work suggests that local high misorientation and elastic anisotropy provide high elastic strain and ESED gradients as the driving force for nucleation of whiskers and hillocks. The experimental result confirms that after nucleation, the out-of-plane elastic strain and ESED at the whisker and hillock locations are lowered, creating elastic strain and ESED gradients [Figs. 5(i) and 5(j)]. As suggested by the Fisher et al. diffusion model, the strain gradients drive atomic diffusion to the bases of whiskers and hillocks, causing growth.Reference Fisher, Darken and Carroll 1 As a consequence, electroplated Sn and Sn alloy films may likely form whiskers and hillocks in areas containing highly misoriented grains, regardless of the film textures. The implication of this work is that engineering a particular crystallographic texture that is “whisker resistant” may reduce the density of whiskers but may not completely mitigate the formation of whiskers on the films unless all highly misoriented grains are eliminated.
V. CONCLUSIONS
In this work, the effects of local grain orientations and Sn anisotropic elasticity on the growth of three whiskers and seven hillocks were examined via x-ray synchrotron microdiffraction and finite element simulation. For these 10 defects and their neighboring grains, the local ESED gradients, grain misorientations, elastic strain gradients, and the microstructural features that influence whisker and hillock formation and growth were determined.
In this study, the orientation of whiskers and hillocks on electroplated Sn + 0.7 wt% Cu and Sn + 1.2 wt% Cu films were not unique with respect to the film normal; however, the defect orientations differed significantly from those of the neighboring grains as well as the primary texture, (334), of the films. The ND orientations measured by synchrotron microdiffraction of the whisker grains were (323), (433), and (811). The ND orientations of hillocks were (611), (432), (522), (911), (631), and (931).
The orientation differences between defect grains and their neighboring grains differed from the typical orientation differences between other grains, as represented by the global misorientation between random grain pairs in the films. For the Sn–Cu films examined in this study, very high misorientation angles (57° to 69° for three whiskers on Sn + 0.7 wt% Cu film and >75° for six hillocks on Sn + 1.2 wt% Cu film) were observed for local misorientation around defects, whereas lower misorientation angles (highest frequency at 50°) were found for global misorientation elsewhere in the Sn–Cu films. The high misorientation around a defect grain was postulated to create high localized elastic strain and ESED due to Sn elastic anisotropy. These high localized elastic strain and ESED were relieved after defect nucleation. Both the experimentally measured and simulated elastic strain and ESED results from this work support this idea. The postulated resulting effects on defect growth based on these results are:
-
(i) The anisotropic elastic properties of β-Sn and the high misorientation of the defect grain provided high out-of-plane elastic strain and ESED at the defect location. These high out-of-plane elastic strain and ESED gradients induced defect nucleation by specific mechanisms that are still unknown.
-
(ii) After defect nucleation, the high strain and ESED are partially relieved in the local area. The elastic strain gradient (low elastic strain at the defect location and higher elastic strain elsewhere in the film) provides the driving force for atomic diffusion to the defect grain.
ACKNOWLEDGMENTS
This work was supported by NSF Graduate Research Fellowship Program, Cisco Systems, Inc., and Naval Surface Warfare Center (Crane Division). The authors would like to thank Martin Kunz, Nobumichi Tamura, Kai Chen, Benjamin Anglin, and Anthony Rollett for assistance with data extraction and valuable discussions. We acknowledge support from DOE-BES (Grant No. DE-FG02-05ER15637) and NSF (Grant No. EAR-0337006) and access to ALS beamline 12.3.2. ALS is supported by the Director, Office of Science, Office of Basic Energy Sciences, Materials Science Division, of the U.S. Department of Energy under Contract No. DE-AC02-05CH11231. The microdiffraction program at the ALS beamline 12.3.2 was made possible by NSF Grant No. 0416243.