


What makes trade liberalization possible? This has been a central question in the study of the politics of trade policy. Over the last several decades, much progress has been made in understanding how countries can achieve trade liberalization even when they have strong incentives to protect domestic markets. We know, for example, that international institutions (Bagwell and Staiger Reference Bagwell and Staiger1999; Keohane Reference Keohane1984), global supply chains (Milner Reference Milner1987), delegation of negotiation authority to the executive branch (Bailey, Goldstein, and Weingast Reference Bailey, Goldstein and Weingast1997), and political motivation (Maggi and Rodríguez-Clare Reference Maggi and Rodríguez-Clare2007) all play a role. However, the majority of both theoretical and empirical research on the domestic politics of international trade either implicitly or explicitly assumes that the underlying trade policy preferences diverge across industries (e.g., Hiscox Reference Hiscox2002).
This article is motivated by several consistent empirical patterns that I find that contradict the industry-level explanations for U.S. trade policy outcomes. First, I find that similar products within an industry are often subject to very different tariff rates; in fact, the variation in rates for similar products within an industry is often greater than the variation in rates between different products from different industries. For example, as of 2013, the applied most favored nation (MFN) tariff rate for Cotton, not carded or combed, having staple length of 28.575 mm or more but under 34.925 mm (HS8 52010038) is 31.4 cents/kg ( ≈ 14}), whereas Cotton, not carded or combed, having a staple length under 19.05 mm (3/4 inch), harsh or rough (HS8 52010005) is duty free.Footnote 1 The tariff on Flashlights (HS8 85131020) is 12.5% while that of Portable electric lamps designed to function by their own source of energy, other than flashlights (HS8 85131040) is 3.5%. Second, I observe that firms individually lobby on trade policies targeting very specific products. This suggests that firm-level preferences may matter more than industry-level preferences in trade policy. Despite the large within-industry variation in tariff rates, we know relatively little about how politics affects the distribution of tariffs across products within industry (see Goldstein and Gulotty (Reference Goldstein and Gulotty2014) and Gowa and Kim (Reference Gowa and Kim2005) for notable exceptions).
I argue that firm-level lobbying is the reason there is product-specific liberalization and high within-industry tariff rate variation. To analyze the political incentives of firms, I extend the theoretical framework of new-new trade theory (e.g., Bernard et al. Reference Bernard, Eaton, Jensen and Kortum2003; Melitz Reference Melitz2003) to include political interaction between firms and government. In order to allow for within-industry heterogeneity, I extend the Grossman and Helpman (Reference Grossman and Helpman1994) model by introducing firm-level differences in productivity. I show that it is both economically and politically optimal to reduce tariffs on differentiated products (defined as less substitutable goods).Footnote 2 My argument differs from the theory of endogenous protection, which identifies the conditions under which firms intensify their lobbying activity for protection (Baldwin Reference Baldwin1985; Hillman Reference Hillman1982; Magee, Brock, and Young Reference Magee, Brock and Young1989; Mayer Reference Mayer1984; Trefler Reference Trefler1993). Although it is well known that governments respond to the interests of exporting industries and firms by reducing trade barriers (Destler and Odell Reference Destler and Odell1987; Gilligan Reference Gilligan1997a; Hansen and Mitchell Reference Hansen and Mitchell2000; Milner Reference Milner1987; Milner and Yoffie Reference Milner and Yoffie1989; Schattschneider Reference Schattschneider1935), existing studies are unable to predict which firms within an industry are more or less likely to lobby, when they lobby, and which products get lower tariffs. That is, few theoretical and empirical studies identify the conditions under which lobbying on product-specific liberalization is successful.
My theory provides the microfoundations for the argument that exporting firms lobby for free trade (Gilligan Reference Gilligan1997b; Milner Reference Milner1988; Yaşar Reference Yaşar2013). Specifically, I focus on the effects of product differentiation on product-specific trade liberalization by examining the strategic interaction between firms and government. First, I argue that product differentiation eliminates the collective action problem exporting firms confront because only a small number of firms actually trade the specific products on which governments set tariffs. Thus, the firm’s lobbying decision is an endogenous response to its own cost-benefit calculation rather than a collective problem at the industry level. Second, product differentiation means that domestic firms face less competition than they would if their products were substitutable with cheaper versions from foreign producers. This implies that domestic firms will be less likely to oppose open trade because their products are shielded from competition as a result of consumers’ love of variety. Finally, given these domestic dynamics, it will be easier for governments to commit to eliminating trade barriers on the basis of the norm of reciprocity. That is, exchanging differentiated products within the same industry (i.e., intra-industry trade) will create similar domestic political environments amenable to liberalization, unlike inter-industry trade that often results in opposing political demands.
To estimate the effect of product differentiation on firm-level lobbying and trade liberalization, I construct a firm-level lobbying dataset based on 890,248 lobbying reports filed under the Lobbying Disclosure Act (LDA) of 1995. For each lobbying report, I identify the firms lobbying for any trade bills introduced between 1999 and 2014. I then use financial databases (e.g., Compustat and Orbis) to obtain economic data for those firms. I show that productive firms are more likely to lobby on trade policy when they compete in industries with differentiated products. I then analyze the content of trade bills to better understand the object of firms’ lobbying activities. Consistent with my theory, I find that firms individually lobby to reduce trade barriers on highly specific products. This article makes both theoretical and empirical contributions to the firm-based research of international trade policy within the framework of the new-new trade theory (Baccini, Impullitti, and Malesky Reference Baccini, Impullitti and Malesky2015; Bombardini Reference Bombardini2008; Bradford, Quinn, and Weymouth Reference Bradford, Quinn and Weymouth2015; Kuno and Naoi Reference Kuno and Naoi2015; Osgood Reference Osgood2016). By emphasizing the importance of firm-level political activities and their subsequent effects on trade liberalization, it also contributes to the empirical literature on the domestic politics of trade policy-making (e.g., Gawande and Bandyopadhyay Reference Gawande and Bandyopadhyay2000; Goldberg and Maggi Reference Goldberg and Maggi1999; Hainmueller and Hiscox Reference Hainmueller and Hiscox2006; Lü, Scheve, and Slaughter Reference Lü, Scheve and Slaughter2012; Mansfield and Mutz Reference Mansfield and Mutz2009; Scheve and Slaughter Reference Scheve and Slaughter2001).
The rest of the article is organized as follows. In the next section, I highlight the large within-industry variation in U.S. tariff rates and discuss the limits of existing studies. I then present a theory as to why a high level of product differentiation implies trade liberalization. Next, I report main empirical findings, summarizing the importance of lobbying on product-specific liberalization. The final section concludes. The lobbying database is made publicly available through the webpage (http://www.lobbyview.org).
GRANULARITY OF TRADE POLICY AT THE PRODUCT LEVEL
This section undertakes an empirical analysis of tariffs and trade flows of the U.S., a country that is commonly used as a testing ground in the endogenous protection literature. As demonstrated by the examples in the Introduction, U.S. trade policy is set at a highly granular product level. I first show that most of the variation in tariff rates in the U.S. arises within rather than across industries. I then discuss how this finding contradicts two dominant existing theoretical frameworks in the literature, which focus on conflicts of interest across factor owners or industries (e.g., Hiscox Reference Hiscox2002; Rogowski Reference Rogowski1987).
Product-level Trade Policy Variation within Industry
Over the last several decades, international trade has increased not only in volume but also in the variety of goods traded (Broda and Weinstein Reference Broda and Weinstein2006; Krugman Reference Krugman1980). Because consumers “love variety,” countries exchange similar and yet slightly differentiated products within the same industry. For example, Broda and Weinstein (Reference Broda and Weinstein2006) find that an average consumer in 2001 was willing to pay 2.6 percent of her income just to have access to a wider variety of product types, such as wines, compared to what she would have had access to in 1972. It is worth noting that the increased level of product differentiation has been accompanied by increasing granularity in trade policies. For example, while the U.S. had 7,731 unique product categories for its imports in 1972, it now sets distinct tariffs and nontariff barriers across almost 17,000 products. As of 2016, the Harmonized Tariff Schedule of the United States is specified in a 3,670-page document.
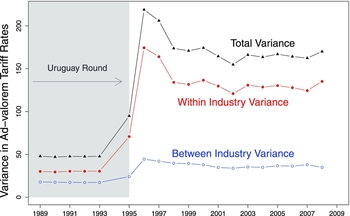
Despite the increasing granularity in tariff rates, few studies have examined the sources of variation in trade policy that results in this granularity. Explaining this variation is important for several reasons. First, most of the variation in tariff rates arises across products rather than industries. Figure 1 shows that the within industry variation across products accounts for most of the total variation in U.S. tariffs.Footnote 3 Second, countries spend enormous resources on negotiating tariff rates at this level of disaggregation, reflecting diverse domestic and foreign interests in the policy-making process.Footnote 4 Third, 60% of products are still subject to positive tariffs and the mean applied MFN tariff rate for dutiable products is ≈ 7.27%. According to the International Trade Commission, U.S. tariff revenue was estimated to be $31 billion in FY 2012, which is comparable to the amount that the U.S. spent on foreign aid ($23 billion) and foreign military assistance ($14 billion) combined. Finally, tariffs still function as an effective foreign policy tool for the U.S. For example, Carnegie (Reference Carnegie2015) finds that the U.S. used its tariffs to pressure Vietnam to improve its human rights record until it joined the WTO in 2006. Because tariffs remain an important policy tool in a variety of domestic and international contexts, a deeper understanding of product-specific trade policy making on tariffs is needed.
Within-industry Variance in Applied Tariff Rates

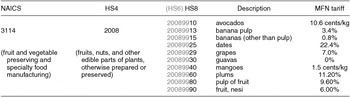
Indeed, the levels of trade barriers differ across fairly similar products in the U.S. Table 1 shows the large variation in tariffs across products even within a narrowly defined canned-fruits manufacturing industry. I argue that the existing theoretical frameworks, with their primary focus on inter-industry variation, are inadequate in explaining the variation within industry. For example, the U.S. exports and imports each product that appears in Table 1, and similar factors of production are used to produce these products.Footnote 5 And yet, tariff rates vary from 22.4% on preserved dates to 0% on preserved guava. This makes it difficult to determine whether the products belong to an exporting industry or import-competing industry, and whether they are capital- or labor-intensive goods. Clearly, neither sectoral nor factoral models can explain variations in these tariffs.
Variation in Applied MFN Tariff Rates

Notes: This table illustrates that there exists large variation in MFN applied tariff rates of the U.S. even within a single industry (here, the canned-fruit industry as of 2013). Applied tariff rates are from WITS (World Integrated Trade Solution).
It is worth noting that the difference in variation is most noticeable after the Uruguay Round negotiation. This is due to several factors. In particular, the number of tariff lines of the U.S. increased by 1,303 between 1993 and 1996. Although it is well known that the negotiation led to a significantly lower mean tariff, the amount of tariff reduction varied greatly even across very similar products.Footnote 6 Next, the Uruguay Round negotiation involved many developing nations and covered all agricultural and textiles products, which had mostly been excluded until then, yielding further variation in tariff rates. In fact, the product-by-product negotiation approach during the Uruguay Round resulted in a 22,500-page document listing individual countries’ highly detailed commitments on duties for specific goods. In sum, the U.S. tariff schedule is finely granular, exhibiting considerable variation in tariff rates across similar products within a single industry, and this pattern suggests that industry-level explanations may not be adequate for U.S. trade policy.
Inconsistencies between IPE Models and Trade Flows
This section provides further evidence of the limits of two dominant theories of trade policy formation. Specifically, it shows that existing patterns of trade are inconsistent with the assumption that actors within the same industry share similar interests toward trade policies.
Factor-based Model (Heckscher-Ohlin)
The Stolper-Samuelson theorem in the Heckscher-Ohlin trade model predicts that political cleavages will arise between owners of different factors of production because trade liberalization will reduce the price of the relatively scarce factor. For instance, the United States is abundant in high-skilled labor relative to other countries in the world while its supply of low-skilled labor is relatively scarce, meaning the U.S. is expected to export products involving high-skilled labor and import products involving low-skilled labor. Based on this expectation, Stolper-Samuleson predicts that high-skilled labor will favor trade liberalization while low-skilled labor opposes it, leading to political clashes over trade policy that fall along factoral lines. This perspective has long been an important theoretical foundation for understanding the domestic political cleavages in trade politics (Rogowski Reference Rogowski1987).
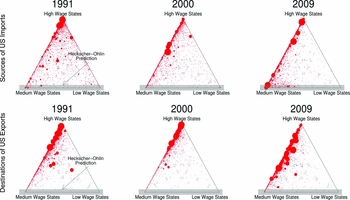
However, Figure 2 suggests that U.S. trade patterns are inconsistent with the factor-based theory. This theory predicts that the United States, a high skill and thus high-wage country, should trade primarily with medium- and low-wage countries because they have different factor endowments (shaded region). However, imports and exports of the United States have actually been dominated by products from high- and medium-wage countries. More importantly, the top panel shows that many products are produced by countries with very different factor prices (circles inside the triangles). This is striking because the Stolper-Samuelson theorem does not hold if the same product is produced by countries with different factor endowments. In fact, trade flows should be concentrated only at the bottom two vertices, according to the logic of the theorem. That trade is occurring between countries with similar factors suggests that factor ownership alone cannot explain patterns of trade liberalization, because it is unclear in which direction their factor prices would move. Thus Stolper-Samuelson can no longer provide guidance here.
Inconsistencies Between Heckscher-Ohlin Model and Actual Trade Flows

Sector-based Model (Ricardo-Viner)
The Ricardo-Viner theory builds on Stolper-Samuelson by assuming that factors of production are immobile, at least in the short term. This means factors are “stuck” in a specific industry; as a result, political cleavages on trade are expected to fall along industry lines. Specifically, Ricardo-Viner predicts that exporting industries will prefer trade liberalization while import-competing industries seek protection. However, when countries import and export products simultaneously in most industries, the sectoral divide loses its meaning.
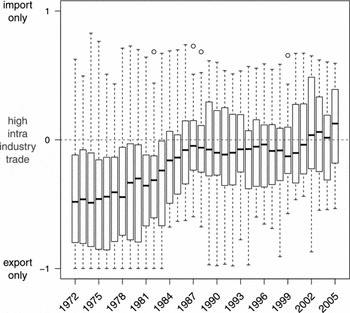
Figure 3 shows that the degree of intra-industry trade (i.e., co-occurrence of import and export flows) in U.S. trade has increased significantly over the last 30-odd years. The U.S. now imports as much as it exports of the products in its top 20 exporting industries. The figure also shows that the level of variation has decreased over time. The results in Figure 3 cast doubt on many empirical studies in the field of IPE that dichotomize import-competing versus exporting industries. For instance, Hiscox (Reference Hiscox2002) measures the trade policy preferences of legislators based on total production in the fixed “10 leading exporting and import-competing industries in each year as a proportion of the state income.” However, the U.S. increasingly imports products even in its top export industries, while it also exports products that import-competing firms produce. Thus, legislators may not prefer a proliberalization policy even when firms in their state produce a large volume of goods in the top exporting industries because those firms may actually be import-competing. That is, high intra-industry trade implies that an industry is likely to be populated with both import-competing and exporting firms with potentially divergent interest. Thus, analysis at the firm level is necessary in order to correctly identify the heterogeneous political interests of firms in the presence of high intra-industry trade.
Inconsistencies Between the Ricardo-Viner Model and Actual Trade Flows

Although differences across industries are still relevant, the patterns identified in this section reveal the conditions under which a new theoretical framework for trade politics is needed. First, researchers should consider the importance of product differentiation in examining trade politics. Similar products are now imported (exported) from (to) countries that are endowed with similar factors of production. Thus, states do not appear to be “specializing” according to factor endowment or industry, as Stolper-Samuelson and Ricardo-Viner respectively predict. Rather, there seems to be room in the market for similar products on the shelves. Together, these patterns imply that products are highly differentiated. It follows that neither factor ownership nor industrial interests alone are sufficient to explain trade politics. Second, high intra-industry trade, in which countries exchange differentiated products, implies that firms within the same industry might have heterogeneous preferences, as the same industry might be populated with import-competing domestic firms, importers, and exporters. These insights inform the theoretical development below.
THEORY
The empirical analysis in the previous section suggests the importance of product differentiation and the relevance of the firm as the unit of analysis in studying trade policy. In this section, I examine trade politics under product differentiation theoretically. First, I discuss how product differentiation fundamentally changes the political incentives of firms. Second, I introduce a formal model of the strategic interaction between firms and government to characterize optimal trade policy under lobbying. I argue that lobbying by productive exporting firms, accompanied by the absence of objections from firms who serve only the domestic market, can shift trade policies in the direction of open trade when products are highly differentiated.
Trade Politics with Product Differentiation
After examining the incentives of exporting and import-competing firms in the same industry, I argue that product differentiation will make it easier for governments to liberalize certain products. This approach contrasts with the existing literature on the domestic determinants of trade policy, which assumes that conflicts of interest divide consumers and producers: free trade leads to gains for consumers and losses for domestic producers. In this regard, it has been generally assumed that import-competing firms are privileged actors in the tariff-setting process because they can more easily solve the collective-action problem that lobbying creates than can consumers. Product differentiation alters these political dynamics.
First, product differentiation mitigates the collective action problem that exporting firms confront. As noted, U.S. legal tariff lines are becoming increasingly fine-grained, with over 17,000 products listed as of 2016. Because tariffs are set at a highly specific product level, there are very few firms that actually produce the product in question. Thus if a firm wants to lower the tariffs it faces, it must do the lobbying itself. This implies lobbying should be undertaken by individual firms producing highly differentiated products. In contrast, for a tariff applied to many products produced by many exporting firms, these firms would face a collective action problem: each firm would have an incentive to free ride on the lobbying efforts of others when products are substitutable (Olson Reference Olson1971).
Second, with product differentiation, domestic firms are less likely to oppose open trade because consumers’ love of variety implies that import-competing firms can still secure some domestic market share even when foreign imports enter the market. When goods are highly substitutable (i.e., not differentiated), cheap foreign products might replace domestic products, and thus import-competing firms have a significant incentive to lobby. With highly differentiated products, firms will not actively lobby for protection unless the costs of lobbying are less than the benefits. If the benefits are minimal because the firm won’t lose many customers even when foreign firms enter the market, then there should be little lobbying for protection.
Finally, product differentiation creates a political environment in which governments can credibly commit to reciprocal trade liberalization. When countries exchange differentiated products within the same industry, it becomes easier for governments to mutually agree on reducing trade barriers as they face similar domestic political dynamics, described above. Knowing this, exporting firms will pursue trade liberalization even when their domestic market share might decrease as a result of increased foreign competition. That is, firms will have less interest in opposing trade liberalization at home because they will be hopeful that they can increase foreign market share due to reciprocal reduction of foreign trade barriers. This norm of reciprocity has been identified as the most important principle used in trade negotiation (Bagwell and Staiger Reference Bagwell and Staiger1999), and many countries, including the U.S., mandate reciprocal liberalization by law (Bailey, Goldstein, and Weingast Reference Bailey, Goldstein and Weingast1997). As an example of how the norm of reciprocity affects firm preferences, consider the tariff reduction on automobile products that was included in the U.S.–Korea Free Trade Agreement (FTA). Conventional wisdom holds that U.S. car makers would oppose such a deal because they do not want to face competition from foreign car makers. However, U.S. car makers actually came to support the FTA because reciprocal tariff reductions give them the opportunity to enter the Korean market. The statement from Representative Sander M. Levin (D-MI) demonstrates that important role that reciprocity played in convincing U.S. car makers to support the bill:
“[T]he Obama Administration negotiated an additional agreement that will provide U.S. automakers with a real opportunity to compete and succeed in the Korean market. With the changes achieved through the additional agreement, the U.S. auto industry (Ford, Chrysler, GM and the UAW) are supporting the U.S.-Korea FTA.”Footnote 7
Trade Liberalization under Firm-level Lobbying
Having discussed the heterogeneous political incentives of firms under product differentiation, I present a political economy model that combines an oligopolistic competition model under product differentiation with the Grossman and Helpman (Reference Grossman and Helpman1994) model. The primary goal of this section is to characterize the levels of tariffs that are endogenously determined as a function of product differentiation. I first describe the demand and supply in the market by formalizing the problems that consumers and firms face. I then examine the strategic interaction between firms and government and the role of lobbying in making trade policy.
I analyze the behavior of firms under the following scenario. A representative consumer maximizes the utility function given in equation (1) subject to the budget constraint E.Footnote 8 The utility function follows the setup proposed by Melitz and Ottaviano (Reference Melitz and Ottaviano2008), which allows the analysis of firms’ heterogeneous incentives when they produce differentiated products. The first term captures how much consumers care about their overall consumption level, while the second term with quadratic components explicitly accounts for the degree to which consumers differentiate the available products. That is, the utility function incorporates the level of product differentiation in an industry through the parameter 0 ⩽ σ ⩽ 1, where lower values of σ imply a higher degree of product differentiation. Simply put, some consumers “love variety” in that they want to consume a bundle of differentiated products while others are particularly “loyal” to a certain products. Formally,
 $$\begin{eqnarray}
U(q_i;\sigma ,\alpha ) & = & \alpha \sum _i q_i - \frac{1}{2}\left(\sum _i q_i^2 + 2\sigma \sum _i \sum _{j \ne i} q_i q_j \right)\nonumber \\
& \textrm {s.t.} & \sum _i p_i q_i \le E
\end{eqnarray}$$
where α, pi , and qi denote the size of the economy, price of product i, and quantity of product i, respectively. This allows an analysis of firms’ political incentives under the economic environment consistent with my theoretical argument.
Suppose that there are two states s ∈ {D, F} (domestic and foreign) and four firms i ∈ {1, 2, 3, 4}, where product i is associated with firm i. All four firms produce products in the same industry. Firms 1 and 2 are domestic firms and firms 3 and 4 are foreign firms, each with different marginal cost of production ci (productivity). Variables that correspond to the foreign market will have an asterisk. To examine the effect of productivity, I assume that the firms with lower index value (1, 3) in each market have lower marginal cost of production: c 1 < c 2, c 3 < c 4. That is, firms 2 and 4 are not considered to be productive. I further assume that only productive firms 1 and 3 can export to the other market.Footnote 9 Countries are symmetric in that consumers in each market face the same utility function when consuming product i in a given industry. Firm i maximizes its profit Π i by choosing the quantity to produce in each market as given in equation (2). The Online Appendix provides a detailed solution for each firm’s maximization problem.
 $$\begin{eqnarray}
\Pi _1 & = & (p_1 - c_1)q_1 + (p_1^{\ast } - c_1 - \tau )q_1^{\ast }, \nonumber \\
\Pi _2 & = & (p_2 - c_2)q_2, \nonumber \\
\Pi _3 & = & (p_3 - c_3 - \tau )q_3 + (p_3^{\ast } - c_3)q_3^{\ast }, \nonumber \\
\Pi _4 & = & (p_4^{\ast } - c_4)q_4^{\ast }.
\end{eqnarray}$$
Note that firm 1 and firm 3 face the same tariff τ in their respective exporting markets. This reflects the importance of the norm of reciprocity in trade negotiation (Bagwell and Staiger Reference Bagwell and Staiger1999). It is also consistent with the “principal supplier rule” that underlies the Uruguay Round negotiation in which advanced economies simultaneously lower trade barriers reciprocally when they exchange differentiated products with each other within an industry (Gowa and Kim Reference Gowa and Kim2005). However, the assumption of reciprocity itself does not necessarily imply trade liberalization. The intensity of the import-competing firm’s interest is also captured by a higher import tariff, while the productive domestic firm will lose a significant portion of its domestic revenue if products are substitutable. That is, productive firms still need to evaluate the trade-off between the decrease in domestic revenue and the increase in foreign market revenue when deciding whether to lobby for liberalization, and this tradeoff will vary with the level of product differentiation. In fact, the result below shows that even with the norm of reciprocity, high tariffs are optimal with sufficiently high levels of substitutability.
Given this setup, I investigate the strategic interaction between firms and governments. Following Grossman and Helpman (Reference Grossman and Helpman1994), I consider the following two-stage game. In the first stage, firms simultaneously choose their political contribution schedules, and in the second, government sets policy τ and collects contributions Li (τ) from each firm, which is determined endogenously by τ. I consider the lobbying game in the domestic market (i ∈ {1, 2, 3}) since similar results will follow in the foreign market due to symmetry. Note that foreign productive firm 3 lobbies in this model.Footnote 10 In order to reflect the reality that actual tariff levels between nations are not exactly the same, I introduce an asymmetry between countries D and F by allowing them to have different choke prices α ∈ {α D , α F } (the lowest price at which the quantity demanded of a good is equal to zero) in their respective demand functions. Thus, the actual applied tariff rates will differ across the two countries in equilibrium.
The government values social welfare. Specifically, it tries to increase consumer surplus so that consumers have access to more products in the market, as defined in equation (3), as well as tariff revenue. I assume that the government distributes tariff revenue equally to its population. The revenue is defined as r(τ) = τq 3.
 $$\begin{eqnarray}
s(\tau ) & = & U(\cdot ) - \sum _i q_i p_i = \alpha _D \sum _i q_i \nonumber\\
&&-\, \frac{1}{2}\left(\sum _i q_i^2 + 2\sigma \sum _i \sum _{j \ne i} q_i q_j \right)- \sum _i q_i p_i.
\end{eqnarray}$$
The government maximizes the following objective function. Note that a is a weight that the government assigns to welfare relative to political rents,
 $$\begin{equation}
\max _{\tau } \sum _i L_i(\tau ) + aW(\tau ),
\end{equation}$$
where W(τ) = Π1(τ) + Π2(τ) + s(τ) + r(τ).
The government faces the following trade-off depending on the level of product differentiation. When products are highly substitutable, increasing a tariff protects domestic firms from foreign competition. The demand for protection will be particularly strong if foreign firm 3 is highly productive and charges a much lower price than domestic firms 1 and 2. On the other hand, when products are less substitutable (consumers value variety), introducing protective measures will decrease consumer surplus. It is important to note that in this scenario, domestic firms will not suffer from foreign competition as much as they would under high substitutability. In fact, productive domestic firm 1 will enjoy a significant opportunity to make profits in the foreign market because foreign consumers love variety as well. I next characterize the optimal tariff in the game as a function of product differentiation.
Proposition 1 (Optimal Tariff)
Suppose firms use lobbying schedules that are differentiable around equilibrium tariff rate τ o . Then, government optimally chooses tariff τ o that satisfies
 $$\begin{equation}
\tau ^{o} = \frac{\zeta \sigma ^3 + \eta \sigma ^2+\xi \sigma +\kappa }{10a\sigma ^3+(10+21a)\sigma ^2+(16-20a)\sigma +16-20a}.
\end{equation}$$
The proof and specific functional forms of each polynomial coefficient are in Appendix A.
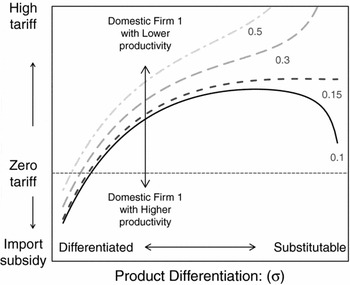
Proposition 1 shows that the optimal tariff can be expressed as a ratio of two third-order polynomial functions of the level of product differentiation. Although the equation is hard to interpret on its own, an oligopoly game with a finite number of firms has the benefit of giving a closed-form solution as a result of political interaction between firms and the government. Evaluating the equation at σ = 0 (products are fully differentiated) helps understand the intuition.Footnote 11 With sufficiently large a (the government values social welfare more than political rents), it is optimal to set a negative tariff. In other words, import subsidy is optimal when products are not substitutable with each other.
This result suggests that strong political pressures to open trade will exist when products are differentiated, whereas demands for protection will be stronger if products are generally substitutable. Figure 4 presents the result from Proposition 1 graphically, simulating the optimal tariff level over different values of firm 1’s productivity and the level of product differentiation.Footnote 12 Three general patterns are worth noting. First, it is optimal to set low trade barriers when products are sufficiently differentiated. Second, the range of parameter values of σ that requires a negative tariff (i.e., import subsidy) increases as the productivity of domestic firm 1 increases. Finally, non-monotonicity exists when domestic firm 1 is highly productive. The inverse-U shape of the optimal tariff schedule suggests that the government may also want to liberalize when products are highly substitutable and its domestic firm is very productive. The intuition behind this result is that highly productive domestic firms can compete with foreign firms by setting lower prices and taking a larger market share due to the substitutability of goods.
Domestic Firm’s Productivity and Optimal Tariff

In order to highlight the importance of lobbying in explaining trade liberalization, consider the following scenarios under a fixed level of product differentiation at σ = 0.Footnote 13 First, when the government cares only about social welfare (a → ∞), it can be shown that it is optimal to set positive tariffs either when the productive domestic firm is less productive than the productive foreign firm (c 1 ≫ c 3) or when domestic market size is sufficiently big (α D ≫ α F ).Footnote 14 This is consistent with the terms-of-trade externality whereby “big” governments adopt a beggar-thy-neighbor policy even under perfect competition. On the other hand, when the government cares only about political rents (i.e., a = 0), a sufficiently big domestic market size (α D ≫ α F ) results in a negative tariff rate. This highlights the importance of lobbying in explaining trade liberalization. Appendix B formally characterizes the equilibrium contribution schedule to show that productive firms lobby more aggressively when products are differentiated. Based on these theoretical results, I present two hypotheses, which will be tested empirically in the following section.
Hypothesis 1 Productive firms are more likely to lobby for trade liberalization when they compete in an industry with differentiated products than when they compete in an industry with substitutable products.
Hypothesis 2 Differentiated products will have lower tariffs than substitutable products, on average.
To summarize, lobbying by productive exporters can shift trade policies toward more open trade. My analysis focuses on the distributional consequences of new-new trade theory at the level of the firm, which has become a primary unit of analysis in international trade research (e.g., Bernard and Jensen Reference Bernard and Jensen1999; Bernard et al. Reference Bernard, Eaton, Jensen and Kortum2003, Reference Bernard, Jensen, Redding and Schott2007; Eaton, Kortum, and Kramarz Reference Eaton, Kortum and Kramarz2011; Melitz Reference Melitz2003). Although new-new trade theory can account for economic heterogeneity across firms within an industry, its theoretical analysis of market equilibrium is predicated upon the assumption that trade policy is exogenous to political interaction between firms and government. In contrast, the analysis in this section made tariff rates endogenous to trade politics. In particular, it showed that firms will have incentive to lobby for trade liberalization on highly differentiated products that they produce.
EMPIRICAL ANALYSIS
This section presents the main empirical results that establish the effects of product differentiation on firm-level lobbying and product-level tariffs. I begin with a description of the data used for the analysis. I then present my empirical finding that productive exporting firms lobby more when they produce differentiated products (Hypothesis 1). In addition, I find that firms lobby on trade policies related to the highly differentiated products that they produce. Finally, I show that products with a high degree of differentiation have lower tariffs (Hypothesis 2).
Data
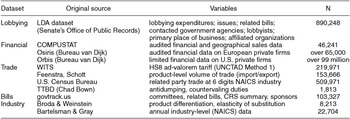
This article makes an important empirical contribution by making an original lobbying dataset publicly available. I construct a firm-level lobbying dataset based on lobbying reports that became available under the Lobbying Disclosure Act (LDA) of 1995 and went into effect in 1999.Footnote 15 Although a number of studies have analyzed these lobbying reports (e.g., Ansolabehere, Snyder, and Tripathi Reference Ansolabehere, Snyder and Tripathi2002; Bertrand, Bombardini, and Trebbi Reference Bertrand, Bombardini and Trebbi2014; Bombardini and Trebbi Reference Bombardini and Trebbi2012; Ludema, Mayda, and Mishra Reference Ludema, Mayda and Mishra2010), there exist two main challenges that have limited their use for the study of firms’ political activities. First, it has been difficult to link firms’ lobbying behavior to their economic characteristics because there is no unique identifier for firms (other than their names) in the reports. To overcome this problem, I mapped firms that lobbied at least once since 1999 with their unique identifiers in widely available databases such as Compustat and Orbis.Footnote 16 This bridge allows researchers to easily access a rich set of firm-level covariates along with firms’ lobbying activities. Second, contents of lobbying have been mostly ignored in the literature because the reports themselves provide limited information about the details of lobbying activities. To overcome this challenge, I identified all congressional bills in the House and Senate that are indicated to have been lobbied.Footnote 17 This database thus provides researchers with richer information about the issues that firms are concerned with when they engage in lobbying.
The lobbying dataset I created identifies firm-level political activity that is directly related to trade policy making. Using this database departs significantly from other work that focuses on industry-level campaign contributions (e.g., Bombardini Reference Bombardini2008; Gawande and Bandyopadhyay Reference Gawande and Bandyopadhyay2000; Goldberg and Maggi Reference Goldberg and Maggi1999). I argue that campaign contributions conflate highly complex preferences of member firms within each PAC, such as those over electoral outcomes, domestic social-political issues, and various economic policies that are distinct from trade policies. In contrast, the lobbying dataset captures each firm’s direct, expressed interest in a particular trade policy (Bombardini and Trebbi Reference Bombardini and Trebbi2012). To be sure, this is not to argue that campaign contributions do not matter. In fact, campaign contributions can serve as both substitutes and complements to lobbying. Rather, I argue that existing studies have omitted an important political channel whereby private corporations utilize lobbying in order to transmit information or buy access to legislators to affect specific policies and bills, rather than to make campaign contributions to influence electoral outcomes. This justifies the use of the LDA dataset in studying the political behavior of firms relevant to trade policy.
To examine the relationship between political activities and policy outcomes, I consider trade flows and trade policies at highly refined levels. I consider tariffs at the eight-digit Harmonized System (HS8), which is the actual legal tariff line of the U.S. I also use the Temporary Trade Barriers Database (TTBD) to address the concern that countries increasingly use nontariff barriers instead of (or in addition to) traditional tariff barriers. All HS8 products that have been subject to at least one antidumping case and countervailing duties are included in the analysis. Finally, given that this article considers not only firms that engage in trade but also import-competiting domestic firms, I use NAICS (North American Industry Classification System) six-digit industries in the analysis because there is no associated HS products for the latter. This allows me to compare firms with different levels of engagement in trade while controlling for industry-level characteristics such as total employment, payment, value added, energy consumption, etc., which have been identified as important determinants of trade policy-making. Table 2 describes the sources of data used in this article.
Final Database

Note: The final database is a panel of annual firm-level lobbying data combined with firms’ financial characteristics and trade policies.
Firm-level Lobbying for Trade Liberalization
This section tests Hypothesis 1, that productive exporters lobby more on trade policy when they produce differentiated products. I begin by examining whether firm-level productivity and the level of product differentiation are important determinants of lobbying on trade policy. I then investigate substantive contents of lobbying to show that firm-level lobbying for product-specific liberalization is important in trade politics.
Product Differentiation and Lobbying by Productive Firms
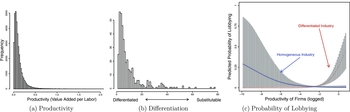
I use productivity, measured as value added (total sales less cost of goods sold) per employee, as a proxy measure for a firm’s interest in exporting markets. My focus on productivity in examining firms’ interests in foreign market access is justified on both theoretical and empirical grounds. The model in the previous section suggests that productivity differences across firms is important for understanding the strategic interaction between firms and governments. Furthermore, there exists ample empirical evidence that productivity is critical in determining a firm’s ability to export (Bernard et al. Reference Bernard, Jensen, Redding and Schott2007). The distribution of productivity across all firms used in this article is presented in panel (a) of Figure 5. Note that the highly skewed shape of the distribution is consistent with the literature’s wide use of a Pareto distribution.Footnote 18
Productivity, Product Differentiation, and Firm-level Lobbying

The measure for product differentiation for each industry is based on Broda and Weinstein (Reference Broda and Weinstein2006). Specifically, I calculated the inverse of the mean elasticity of substitution for all Harmonized System 10-digit products that are matched with the six-digit NAICS industry of a given firm. It is important to note that the product-level elasticity of substitution is estimated based on product-level trade data of the United States. Thus, unlike other measures used in the literature such as Rauch (Reference Rauch1999), the measure used for this analysis captures the level of product differentiation specific to the U.S. market. As noted, firms with no trade will not have any corresponding HS products because the HS designation refers only to internationally traded products. Thus, the concordance between HS and NAICS will allow me to measure the degree of product differentiation at the most disaggregated level comparable across firms with different levels of engagement in international trade. Panel (b) of Figure 5 displays the distribution of the product differentiation measure across all NAICS six-digit industries.Footnote 19
For my empirical analysis, I consider all publicly traded firms in manufacturing and agriculture between 1999 and 2014. I then identify every firm that lobbied at least once on either trade or tariff issues. Out of 4,030 firms from 535 different NAICS 6 digit industries, there are 359 firms that have lobbied at least once on trade/tariff issues.
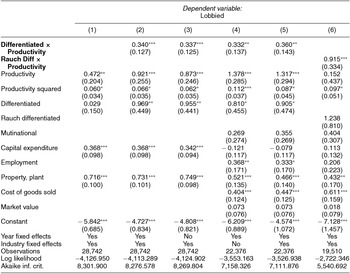
Table 3 presents the results from a logistic regression of lobbying (a binary indicator for lobbied or did not lobby) on Productivity, Differentiation, and their interaction term. I used logistic regression to account for the binary nature of the dependent variable and to capture the potential nonlinearity at the end of the covariate distribution, which is particularly important due to the skewed distribution of key variables, such as productivity and differentiation. In order to account for endogeneity due to selection of big firms in lobbying, I control for Capital expenditure, Employment, Property, Plant and equipment, Cost of goods sold, and Market value.Footnote 20 Furthermore, I control for whether firms have a foreign presence (Helpman, Melitz, and Yeaple Reference Helpman, Melitz and Yeaple2004): Multinational is a binary variable that is unity when the firm has positive sales in foreign countries in their 10-K filing. The squared term of Productivity is also included to account for its nonlinear effects and to be consistent with empirical findings that only very few highly productive firms export. Finally, I include year and NAICS two-digit industry fixed effects to account for misspecification and confounding due to several unobservable time-invariant factors.
Interaction Between Product Differentiation and Firm-level Productivity

* p < 0.1; **p < 0.05; ***p < 0.01.
Notes: Productive firms are more likely to lobby on trade issues when their products are differentiated. Differentiated used in models (1)–(5), is a continuous measure of product differentiation based on Broda and Weinstein (Reference Broda and Weinstein2006) that uses the concordance between HS 10-digit product and NAICS six-digit industry. The result is robust to using Rauch (Reference Rauch1999)’s measure for product differentiation as presented in model (6). Productivity is measured as value-added (total sales less cost of goods sold) per employee. The results are based on all 4,030 public firms in agriculture and manufacturing industries from 1999 to 2014. Standard errors are clustered at each firm.
I find that productive firms are more likely to lobby when they compete in industries with differentiated products, as shown in the interaction terms in the first and second rows of the table. Note that the measure for product differentiation varies across NAICS six-digit industries but is time invariant. Thus, this measure also controls for time-invariant industry-level unobservable heterogeneity. As a robustness check, I also use the Rauch product differentiation index. I created an indicator for differentiated goods that are not traded on organized exchanges following Rauch (Reference Rauch1999). The last column of Table 3 shows that the result is robust to using this widely used measure of product differentiation as well. The Online Appendix contains results from further robustness checks.Footnote 21
To focus on our quantity of interest, I examine the predicted probability of lobbying by simulating over different levels of productivity observed in the data, holding other variables at their mean (scalar variables) and median values (categorical variables). Panel (c) of Figure 5 shows that productive firms are more likely to lobby on trade issues when they compete in an industry with highly differentiated products. The results are consistent with the theoretical prediction that product differentiation explains active lobbying by productive firms. This is starkly different from the firm-level lobbying behavior in industries with substitutable products, where the lobbying activity of firms is predicted to be more likely when firms are less productive. This suggests that, when products are substitutable, less productive firms have an interest in lobbying because they might be forced to exit the market if consumers switch to cheaper foreign goods. Unlike earlier studies, my finding identifies which firms lobby and when they actively do so (cf., Milner Reference Milner1988). That is, productive firms lobby when they produce differentiated products.
Product Specific Lobbying by Firms
An important limitation of the analysis in the previous section is that we still do not know what exactly firms are looking for when they lobby. Indeed, identifying firms’ preferences directly is notoriously difficult given that firms often do not disclose information about product-level business operations, as it could be used against them by competitors. To overcome this difficulty, I investigate the contents of the trade bills that were disclosed in the LDA data.
One way to identify firm preferences when lobbying is to compare bills that were the subject of firm lobbying to those that were not. This type of analysis should reveal whether bills that were lobbied are systematically different from those that were not. Specifically, finding words that are associated with bills that were lobbied will allow researchers to learn if lobbied trade bills have distinct contents compared to the bills that were not lobbied. To do this comparison, I first identified all trade-related bills introduced in Congress between 1999 and 2014. To identify the universe of trade and tariff bills, I utilize the Congressional Research Service (CRS) subjects and summary of each bill introduced in Congress. CRS aims to provide nonpartisan analysis of policy issues for both the United States Congress and the public. It categorizes each bill according to subject and offers a detailed summary, which can be used to identify the policy areas the bill addresses. I consider all bills whose top subject is either Foreign trade and international finance or Tariff. Of these bills, I identify bills that include at least one of the following terms: trade barrier(s); tariff barrier(s); non-tariff barriers(s); tariff reduction; export subsidy; the U.S. trade representative; World Trade Organization; most favored nation; rules of origin; generalized system of preferences; free trade agreement; Uruguay round. This results in a total of 685 trade-related bills. I then search the lobbying reports to see if there exists any lobbying activities associated with each bill. The list of bills along with any associated lobbying activity is available in the Online Appendix.Footnote 22
To identify the specific content of each bill, I utilize the CRS summary. I do not analyze the actual text of the bills in order to limit the use of legal terms used by legislators (and lobbyists) with expertise in trade or language employed for political reasons. In fact, lobbyists often help draft bills or even write them outright, and legislators often insert partisan language to satisfy their constituencies. Although such information is still valuable in distinguishing the language of bills that are lobbied, the technical summary given by CRS provides a sharper focus on the substance of the bills. Moreover, the use of the summary will mitigate the use of partisan language, as CRS is an independent and nonpartisan organization. Finally, its detailed descriptions still allow researchers to investigate the content of each bill.
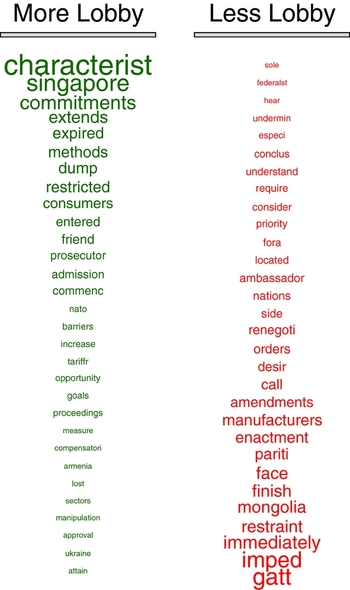
Next, I create a list of p words w used in trade-related bills.Footnote 23 I then count wij , the number of times each word j ∈ {1, . . ., p} appears in each bill i: wi = (w i1, . . ., wip ). This will create a bill-to-term matrix (number of trade-related bills × p) summarizing the distribution of words over trade bills. It is well known that estimating the effect of individual words on lobbying is computationally difficult due to the large dimensionality of p, the number of unique words. To address this problem, I use the variable selection method LASSO (least absolute shrinkage and selection operator) to select the list of words that are particularly useful in predicting whether bill i is lobbied or not (yi ) because this method constrains most coefficients to be zero (Tibshirani Reference Tibshirani1996). This so-called “sparsity” is an important advantage of LASSO because a set of a small number of words with high predictive power not only provides a summary of contents but also facilitates interpretation.Footnote 24 Figure 6 presents the top 30 words that are found to increase and decrease the predicted probability of lobbying for each bill. The size of each word is proportional to the absolute size of the coefficient from the regression, where bigger word size in the first (second) column implies that a bill with the word is more (less) likely to be lobbied.
Words with Top 30 Loadings

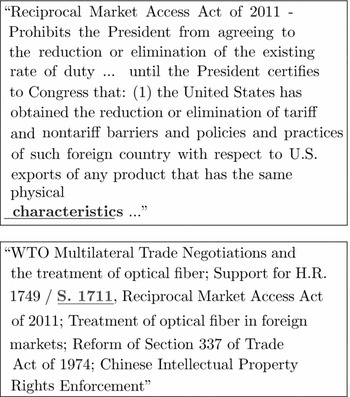
This analysis is useful because, having identified the words associated with frequent lobbying, one can then examine the context in which they are used. The word “characterist,” for instance, appears in the Reciprocal Market Access Acts of 2007, 2009, and 2011. As shown in the top panel of Figure 7, the Reciprocal Market Access Act of 2011 requires that foreign governments reduce or eliminate trade and nontariff barriers with respect to U.S. exports of any product with the same physical characteristics.
Top: CRS Summary of S. 1711 (112th Congress); bottom: Lobbying Report by Corning Inc. (2012 Fourth Quarter).

Two important points are in order. First, the word “characteristics” is used to describe specific physical properties of products, which confirms the theoretical connection that product differentiation increases the incentive to lobby. This bill was lobbied by Corning Inc. Based on the text in the lobbying report (bottom panel), we know that Corning Inc. lobbied to reduce the trade barriers on optical fibers, a highly differentiated product (the σ value of Optical fibers, optical fiber bundles and cables (HS8 90011000) is 1.92, compared to the mean σ value of 11.14 across all products). Second, Corning Inc. lobbied in support of reducing trade barriers on the product both at home and abroad (reciprocally). This is consistent with the modeling assumption that firms will use the norm of reciprocity to obtain lower tariff barriers abroad as a means to increase foreign market access and hence profits. Note that Senator Brown (D-OH) specifically identified optical fiber as a key product for foreign market access when he introduced the bill.
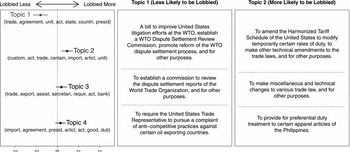
To be sure, examining a certain word and focusing primarily on the sentence where it is used will not give a complete picture of the overarching theme of a given bill. In fact, a bill generally covers a large number of issues reflecting diverse political interests and topics. Hence, to further my analysis, I utilize a structural topic model on the CRS summaries of each bill (Roberts, Stewart, and Tingley Reference Roberts, Stewart and Tingley2016). Figure 8 summarizes the results. It shows that lobbied bills are more likely to be related to trade policies on certain products or on highly specific aspects of products (Topic 2). Bills that are not lobbied, on the other hand, tend to be related to general trade policy agenda matters (Topic 1). As a robustness check, I ran the standard Latent Dirichlet Allocation topic model. Again, topics that are characterized by a set of words including certain, duty, treatment, and specific are associated with frequent lobbying. This provides additional evidence for the occurrence of product-specific lobbying. A detailed description of this analysis is available in the Online Appendix.
Topic of Trade Bills Likely to be Lobbied

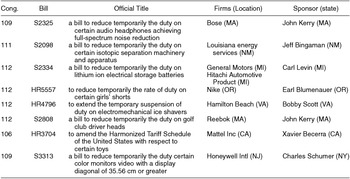
Next, I consider miscellaneous tariff bills that members of Congress introduce to suspend or extend the current suspension of duties on hundreds of highly specific products.Footnote 25 There were almost 2,000 miscellaneous tariff bills introduced in the 112th Congress alone. The individual legislative proposals are then reviewed by the U.S. International Trade Commission (USITC) to ensure that they do not harm domestic interests. In fact, domestic producers can express their concerns during this process to block the bill. Ludema, Mayda, and Mishra (Reference Ludema, Mayda and Mishra2010) describe this as “protection for free” because a simple objection by a domestic firm is often enough to block a specific miscellaneous tariff bill. It is intriguing, however, that most miscellaneous tariff bills have encountered little objection from import-competing firms. For instance, Ludema, Mayda, and Mishra (Reference Ludema, Mayda and Mishra2010) find that about 79% of the miscellaneous bills introduced between 1999 and 2006 have become law as a part of larger legislation known as miscellaneous trade bills (MTBs). I argue that product differentiation is key to understanding the absence of objections. Specifically, when products are differentiated, domestic producers are less likely to object because product differentiation implies that the bill poses no direct threat to them.
Productive exporters, on the other hand, individually lobby to reduce trade barriers on their differentiated products. Table 4 shows a number of miscellaneous tariffs bills that have been introduced in Congress with their respective sponsors. The fourth column presents all clients found to have lobbied on the given bill. It reveals that many firms lobby by themselves for reducing tariffs on specific products. Surprisingly, I find that the median number of clients lobbying on miscellaneous tariff bills is one! This suggests that trade policy of the U.S. has been sufficiently disaggregated that it has effectively become a private good for firms.
Lobbying on Miscellaneous Tariff Bills

Note: This table shows that firms lobby for reductions in tariff barriers on specific products. Also, there generally exists a high correlation between a firm’s headquarter location and the sponsor state of each bill.
This section finds that there exist political pressures from firms to reduce trade barriers on specific products. These findings complement the results in the previous section, as they highlight the importance of product differentiation in understanding firms’ lobbying decisions. A close analysis of trade bills and firm-level lobbying provides additional evidence that the contents of lobbied bills are consistent with Hypothesis 1.
Product Differentiation and Trade Liberalization
This section provides empirical evidence for Hypothesis 2. Specifically, I examine the high variation in tariffs arising at the product level as described in Figure 1, and I investigate whether tariff policy varies across products with different degrees of substitutability. For the measure of product differentiation (σ), I take the average of the trade elasticity measure from Broda and Weinstein (Reference Broda and Weinstein2006) across HS10 products that make up an HS8 product category i in order to match the unit of analysis at the legal tariff line of the U.S. Each HS8 product is then classified by its level of product differentiation: low (less than the 33th percentile), medium (between the 33th and the 66th percentile), and high (above 66th percentile).Footnote 26
In order to identify time-varying effects of product differentiation over trade policies, I use a random coefficient model. That is, I estimate the time-varying average differences (β t ) in applied MFN tariff rate (τ ijt ) across products with different levels of differentiation. This allows me to identify any systemic differences in trade policies across products over time. I also incorporate the hierarchical structure of the data involving various products and their corresponding industries. Formally, the multilevel mixed-effects model is given by
 $$\begin{eqnarray}
\tau _{ijt} \mid \delta _j, \beta _t & \stackrel{\rm indep.}{\sim } & \mathcal {N}(\delta _j + \lambda _t + T_{i}\beta _t + Z_{i}\zeta + M_{ijt} \eta %\nonumber\\
%&&
+ X_{jt}\xi , s^2_\tau ),\\
\delta _j &\stackrel{\rm i.i.d.}{\sim }& \mathcal {N}(\delta + X_{jt}\gamma , s^2_\delta ), \lambda _t \ \stackrel{\rm i.i.d.}{\sim }\ \mathcal {N}(\lambda , s^2_{\lambda }), %\nonumber\\
%&&\times\,
\beta _t \ \stackrel{\rm i.i.d.}{\sim }\ \mathcal {N}(\beta , s^2_{\beta }), \nonumber \\
\zeta &=& (\zeta _1 \ \zeta _2 )^\top ,\quad \eta = (\eta _1 \ \eta _2 )^\top , \nonumber \\
\xi &=& (\xi _1, \ \xi _2, \ \xi _3, \ \xi _4,\ \xi _5)^\top , \nonumber \\
T_{i} & = & \left(\begin{array}{cc}low_{i} & high_i \end{array} \right), \quad Z_{i} \ = \ \left(\begin{array}{cc}AV_{i} & CVD_{i}\end{array} \right),\nonumber \\
M_{ijt} & = & \left(\begin{array}{cc}value_{ijt} & cty_{ijt}\end{array} \right), \nonumber \\
X_{jt} & = & \left(\begin{array}{ccccc}emp_{jt} & vadd_{jt} & tfp_{jt} & pay_{jt} & eng_{jt} \end{array} \right). \nonumber
\end{eqnarray}$$
The unit of analysis is HS8 manufacturing product i in NAICS6 industry j at year t. To address the concern that nontariff barriers can function either as substitutes or complements to tariff barriers, I include dummy variables indicating whether a given HS8 product i has ever been subject to an anti-dumping (AD) or countervaling duties (CVD) investigation using the TTBD database (Bown Reference Bown2012). I also control for the value of total imports (value) and the number of exporting nations (cty) for each product in order to account for differences in import-penetration and domestic production. Industry-specific effects are modeled hierarchically by assuming that the mean of industry random effects is a function of several industry level (NAICS6) covariates such as employment, value-added, total-factor-productivity, payroll, and energy consumption using the information from Marvakov, Becker, and Gray (Reference Marvakov, Becker and Gray2000). The analysis is based on 92,267 observations (HS8 product i—NAICS6 industry j—year t) from 1990 to 2005 with 7,670 unique manufacturing products and 373 NAICS6 industries.
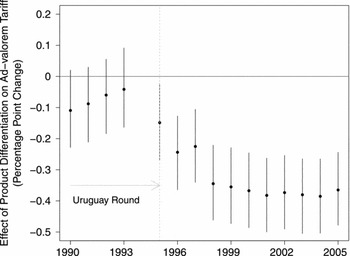
Figure 9 presents a quasi-Bayesian simulation result based on the prediction of the model. It shows that changing the level of product differentiation from the low (less than the 33th percentile) to high (higher than the 66th percentile) category is associated with a 0.4 percentage point decrease in the applied MFN tariff rate. The result provides empirical evidence for Hypothesis 2: differentiated products are indeed more likely to have lower tariffs than substitutable products. In particular, the estimated effects become statistically significant after the completion of the Uruguay Round negotiation in 1994. This suggests that the multilateral negotiation provided an opportunity for productive exporting firms to inform the government of their product-specific preferences.
Lower Tariffs on Differentiated Products

Taken together, the findings in this article demonstrate that the stark increase in the within-industry variation in tariffs after the Uruguay Round negotiation described in Figure 1 is attributable to the tariff reductions on differentiated products specifically. I also find that productive exporting firms are politically active particuarly when they produce differentiated products. The content analysis of lobbied and non-lobbied U.S. trade bills showed that firms’ lobbying efforts were directed at lowering or eliminating tariff barriers on specific products of interest to their business. In sum, product differentiation is key to understanding exporting firms’ increased influence in trade politics.
CONCLUDING REMARKS
In this article, I have shown that product differentiation in economic markets induces different political incentives among firms within the same industry. My theory predicts that demand for trade liberalization will increase with differentiation because high product differentiation eliminates the collective action problem that exporting firms confront. Meanwhile, political objections by import-competing firms to product-specific liberalization will decline due to low substitutability and the possibility of serving foreign markets based on the norm of reciprocity. I use a new dataset to test these predictions empirically, finding that productive firms actively lobby on trade policy only when they produce differentiated products. I further find that goods that are not easily substitutable get lower applied tariffs on average.
It is important to discuss the generalizability of these findings. First, an important scope condition for the finding that individual firms have an interest in lobbying for trade liberalization is high product differentiation. The analysis presented in this article shows that whether consumers differentiate similar products from each other in the consumer market is key to reducing collective action problems in the political market. Second, the presence of intra-industry trade is necessary for firm heterogeneity. The co-occurrence of imports and exports within the same industry implies that firms with different levels of engagement in international trade may coexist in the same industry with potentially little overlap in their interests. In this regard, the proposed framework is particularly relevant for understanding trade politics of industrialized countries that increasingly exhibit these two patterns, as demonstrated from the analysis of U.S. trade flows at the outset.
In seeking to examine firm-level lobbying for trade liberalization, this article had to confront the fact that firms do not usually disclose their true preferences over complex trade policy. To overcome this difficulty, I constructed a large firm-level lobbying data set. Although the combination of evidence presented in this article cannot be used to directly test the causal mechanisms of the theory, it does identify a systemic pattern in firms’ individual lobbying on highly differentiated products and lower trade barriers for such goods. Successfully identifying the causal mechanisms is likely to require survey methodologies that directly measure firm-level preferences as well as an analysis that exploits technological shocks on product differentiation and productivity at the firm level. I leave for future research this challenging task of investigating how exactly firm-level preferences translate into trade policy outcomes.
Finally, this article contributes to our fundamental understanding of what makes trade liberalization possible. First, it complements the small but important literature on product-specific liberalization. It shows that firm-level lobbying can be as important as other political and institutional dynamics that have been identified as key factors for post-WWII trade liberalization, including executives’ strategic choices to ensure support from Congress (Goldstein and Gulotty Reference Goldstein and Gulotty2014) and the principal supplier rule that governs reciprocal negotiation amongst industrialized nations (Gowa and Kim Reference Gowa and Kim2005). Second, that firms within an industry have heterogeneous political interests while products within an industry are subject to different tariff rates may mean that we need to call into question some foundational assumptions of existing theories. The majority of research on the domestic politics of international trade is based on the assumption that individual trade preferences are shaped by how trade affects individual income, which is tied directly to the industry in which an individual works. However, recent research has found that most wage inequality dispersion occurs within occupations and sectors rather than between occupations and sectors (Helpman, Itskhoki, and Redding Reference Helpman, Itskhoki and Redding2010; Helpman et al. Reference Helpman, Itskhoki, Muendler and Redding2012). A better understanding of firms’ preferences on trade policy may alter our view of the political forces behind trade liberalization.
Appendix A. PROOF OF PROPOSITION 1
Proof First, Grossman and Helpman (Reference Grossman and Helpman1994) provide a useful methodology to characterize optimal tariff schedules of our game using the original result from Bernheim and Whinston (Reference Bernheim and Whinston1986). Proof for this well-known lemma is omitted.
Lemma 1 (G-H: Equilibrium Tariff Policy)
({Lo i }, τ o ) is a subgame-perfect Nash equilibrium if and only if
-
1. Lo i is feasible for all i,Footnote 27
-
2. τ o maximizes [∑ i Li (τ)] + aW(τ),
-
3. τ o maximizes
 $$\begin{equation*}
\Pi _i(\tau ) - L_i(\tau ) + \sum _i L_i(\tau ) + aW(\tau ),
\end{equation*}$$
-
4. for every j there exists τ ∈ that maximizes [∑ i Li (τ)] + aW(τ) such that Lo j (τ) = 0.

Now, we characterize the optimal tariff schedule. From condition 2 of Lemma (1),
 $$\begin{equation}
\sum _i \frac{\partial L_i}{\partial \tau }(\tau ^{o}) + a \frac{\partial W}{\partial \tau }(\tau ^{o}) = 0.
\end{equation}$$
Likewise, the government’s maximization problem from condition 3 of Lemma (1) gives
 $$\begin{equation}
\frac{\partial \Pi _i}{\partial \tau }(\tau ^{o}) - \frac{\partial L_i}{\partial \tau }(\tau ^{o}) + \sum _i \frac{\partial L_i}{\partial \tau }(\tau ^{o}) + a \frac{\partial W}{\partial \tau }(\tau ^{o}) = 0.
\end{equation}$$
Combining equations (7) and (8) and summing over i gives the following equality:
 $$\begin{equation}
\sum _i \frac{\partial \Pi _i}{\partial \tau }(\tau ^{o}) = \sum _i \frac{\partial L_i}{\partial \tau }(\tau ^{o}).
\end{equation}$$
Substituting equation (9) to equation (7), we get
 $$\begin{equation}
\sum _i \frac{\partial \Pi _i}{\partial \tau }(\tau ^{o}) + a \frac{\partial W}{\partial \tau }(\tau ^{o}) = 0.
\end{equation}$$
Now, calculate each side of equation (10) from the profit functions of each firm and government:
 $$\begin{eqnarray*}
&&\frac{\partial \Pi _1}{\partial \tau }(\tau ^{o}) \nonumber\\
&&\quad = \frac{(\alpha _F-\alpha _D+c_2-c_4+2\tau )\sigma ^2+2(\alpha _D-c_3-c_4+2\tau )\sigma +4(c_1+\tau -\alpha _F)}{2(-2+\sigma )^2(1+\sigma )^2},
\end{eqnarray*}$$
 $$\begin{eqnarray*}
\frac{\partial 2}{\partial \tau }(\tau ^{\rm o}) = \frac{(c_1+c_3-c_2-\alpha _D+\tau )\sigma ^2 - 2(c_2-\alpha _D)\sigma }{2(-2+\sigma )^2(1+\sigma )^2},
\end{eqnarray*}$$
 $$\begin{eqnarray*}
&&\frac{\partial 3}{\partial \tau }(\tau^{\rm o}) \\
&&\quad = \frac{(\alpha _D-\alpha _F+c_4-c_2+2\tau )\sigma ^2 + 2(c_3-c_1-c_2+2\tau -\alpha _F)\sigma +4(c_3+\tau -\alpha _D)}{2(-2+\sigma )^2(1+\sigma )^2},
\end{eqnarray*}$$
 $$\begin{eqnarray*}
&&\frac{\partial W}{\partial \tau }(\tau ^{\rm o}) = \frac{(4\alpha _D+10\tau +8c_3-4c_1-8c_2)\sigma ^3}{4(-2+\sigma )^2(1+\sigma )^2}\nonumber\\[5pt]
&&\quad+\,\frac{(2\alpha _F-15\alpha _D+7c_1+c_2+15c_3-2c_4+21\tau )\sigma ^2}{4(-2+\sigma )^2(1+\sigma )^2}\nonumber \\[5pt]
&&\quad + \, \frac{(3\alpha _D+2c_1-6c_3-c_4-5\tau )\sigma }{(-2+\sigma )^2(1+\sigma )^2}+ \frac{(\alpha _D-2\alpha _F-5\tau +2c_1-5c_3)}{(-2+\sigma )^2(1+\sigma )^2}.
\end{eqnarray*}$$
Therefore, plugging the results from equations (11)–(14) into equation (10) and solving for τ o gives the optimal tariff τ o ,
 $$\begin{equation*}
\tau ^{o} = \frac{\zeta \sigma ^3 + \eta \sigma ^2+\xi \sigma +\kappa }{10a\sigma ^3+(10+21a)\sigma ^2+(16-20a)\sigma +16-20a},
\end{equation*}$$
where
 $$\begin{eqnarray*}
\zeta &=& 4a(c_1+2c_2-2c_3-\alpha _D),\\
\eta &=& 2(c_2-c_3+\alpha _D) -(2+7a)c_1 \\
&&-\, a(c_2+15c_3-2c_4-15\alpha _D+2\alpha _F),
\end{eqnarray*}$$
$$\begin{eqnarray*}
\\[-44pt]
\xi &=& 4\left[2 c_2 + c_4 + a (-2 c_1 + 6 c_3 + c_4 - 3 \alpha _D) - 2 \alpha _D - \alpha _F \right],\\
\kappa &=& -8 (1 + a) c_1 + 4 (-2 + 5 a) c_3 - 4 (-2 + a) \alpha _D\\
&& +\, 8 (1 + a) \alpha _F.
\end{eqnarray*}$$
Appendix B. TRUTHFUL CONTRIBUTION SCHEDULE
To characterize the contribution schedule, I follow the literature to assume that contribution schedules are truthful everywhere (Bombardini Reference Bombardini2008; Grossman and Helpman Reference Grossman and Helpman1994). See equation (10) in Grossman and Helpman (Reference Grossman and Helpman1994). Formally,
Assumption 1 (Truthful Contribution)
 $$\begin{eqnarray*}
L_i(\tau , V_i) = \max \left[0, \Pi _i(\tau ) - V_i\right]
\end{eqnarray*}$$
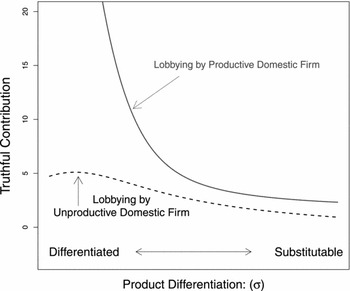
where Vi is an arbitrary benchmark level of welfare for firm i. Note that Assumption 1 is stronger than the local differentiability at the equilibrium point (Bernheim and Whinston Reference Bernheim and Whinston1986). I focus on the profit evaluated at the optimal tariff rate: Π i (τ o ). Note that this quantity is positively correlated with the truthful contribution given a fixed level of Bi , which does not depend on τ o . Given this the truthful contribution schedules can be written as follows:
Productive Domestic Firm
 $$\begin{eqnarray*}
&&\Pi _1(\tau _{o}) =\frac{1}{[4(-2 + \sigma )^2 (1 + \sigma )^2]}\\
&&\quad\times\, \left[\left(A_0+ \frac{(2 + \sigma ) (A_1 + 4A_2\sigma - A_3\sigma ^2 + 4aA_4\sigma ^3)}{2[8 + \sigma (8 + 5\sigma )] + a\lbrace -20 + \sigma [-20 + \sigma (21 + 10\sigma )]\rbrace }\right)^2 \right.\\
&&\quad \left. +\, \left(B_0- \sigma \left\lbrace c_2 + c_3 + \frac{B_1 + 4B_2\sigma - B_3\sigma ^2 + B_4\sigma ^3}{2[8 + \sigma (8 + 5\sigma )] + a\lbrace -20 + \sigma [-20 + \sigma (21 +10\sigma )]\rbrace }\right\rbrace \right)^2. \right]
\end{eqnarray*}$$
Unproductive Domestic Firm
 $$\begin{eqnarray*}
&&\Pi _2(\tau _{o})\\
&&\quad = \left(C_0 + \frac{\lbrace \sigma [-8(c_3 + \alpha _{D} + \alpha _{F}) - 2\sigma C_1 - C_2 + aC_3]\rbrace }{ 2[8 + \sigma (8 + 5\sigma )] + a\lbrace -20 + \sigma [-20 + \sigma (21 + 10\sigma )]\rbrace )}\right)^2 \\
&&\quad /\,\left[ 4(-2 + \sigma )^2(1 + \sigma )^2\right].
\end{eqnarray*}$$
Due to algebraic complexity, I put the expressions for the polynomial coefficients (e.g., A1) in Section 3 of the Online Appendix, and focus on presenting a simulation result in Figure B.1.
Truthful Contribution Schedule

SUPPLEMENTARY MATERIAL
To view supplementary material for this article, please visit https://doi.org/10.1017/S0003055416000654.






Comments
No Comments have been published for this article.