- Adenosine diphosphate ribose (cADPR)
- cercarial antigen (CAP)
- circulating cathodic antigen (CCA)
- capillary electrophoresis (CE)
- digestive gland-gonad (DGG)
- deoxyribonucleic acid (DNA)
- enzyme-linked immunosorbent assay (ELISA)
- liquid chromatography (LC)
- matrix-assisted laser-desorption-ionization (MALDI)
- nuclear magnetic resonance (NMR)
- orthogonal partial least squares discriminant analysis (O-PLS-DA)
- phenyl acetyl glycine (PAG)
- principal components analysis (PCA)
- polymerase chain reaction (PCR)
- post-infection (PI)
- rate of change of direction (RCD)
- S. mansoni adult worm antigen (SWAP)
- soluble egg antigen (SEA)
- statistical total correlation spectroscopy (STOCSY)
- time-of-flight (TOF)
- ultra performance LC (UPLC)
- ultraviolet (UV)
INTRODUCTION
Aquatic snails of the genera Bulinus, Biomphalaria, Oncomelania and Neotricula are the main species that act as intermediate hosts of the Schistosoma spp. These snails are mainly found in various regions throughout Africa, Asia and South and Central America either in natural freshwater or man-made water reservoirs. Hosts – whether human, cattle, rodents or any other – are infected when coming into contact with cercariae swimming in water bodies. Currently the infection with this helminth is endemic in many Third World countries and affects an estimated 200 million individuals with another 600 million people exposed yearly (WHO, Fact Sheet No. 115). Five species (Schistosoma mansoni, S. intercalatum, S. haematobium, S. japonicum, and S. mecongi) cause schistosomiasis in humans (Bewtra et al. Reference Bewtra, Burkart and Aberra2009). With respect to other mammals, around 530 million infected cattle were estimated to live in endemic areas of Africa and Asia (Quack et al. Reference Quack, Beckmann and Grevelding2006). As hybridization can also occur between cattle and human schistosome species, this has been reported with expressed fears of new and vigorous pathogens (Huyse et al. Reference Huyse, Webster, Geldof, Stothard, Diaw, Polman and Rollinson2009).
Co-infections, where different species parasitise the same individual, often occur in humans. Geiger, (Reference Geiger2008) states that, in contrast to animal studies with monospecific disease burdens, this aspect of the present global disease burden is poorly known in humans (Geiger, Reference Geiger2008; Stothard et al. Reference Stothard, Sousa-Figueiredo, Standley, Van Dam, Knopp, Utzinger, Ameri, Khamis, Khamis, Deelder, Mohammed and Rollinson2009). In animal models, competition between two schistosomes has shown that both reproduce successfully (Norton et al. Reference Norton, Webster, Kane and Rollinson2008) and that commensal co-infections may protect the host from trematode infection (Rodgers et al. Reference Rodgers, Sandland, Joyce and Minchella2005). More recent data show that a pre-existing chronic gastrointestinal nematode infection facilitates the survival and migration of S mansoni schistosomula to the portal system (Bickle et al. Reference Bickle, Solum and Helmby2008).
Stothard points out that schistosome do not directly reproduce within the human host (Stothard et al. Reference Stothard, Sousa-Figueiredo, Standley, Van Dam, Knopp, Utzinger, Ameri, Khamis, Khamis, Deelder, Mohammed and Rollinson2009). Schistosomatids are the only bisexual family within the trematodes and continuous pairing-contact is required for the development of the female reproductive organs, producing large numbers of eggs (Quack et al. Reference Quack, Beckmann and Grevelding2006). Eggs then can be expelled or become encapsulated within tissues producing granulomas in several organs. For example in S. haematobium infections, eggs perforate the bladder wall which results in the proxy marker macrohaematuria (visible blood in the urine) whilst eggs of S. mansoni perforate the bowel wall where the associated release of blood is not as evident (Quack et al. Reference Quack, Beckmann and Grevelding2006).
Praziquantel is the drug of choice for treatment, although in some areas treatment with oxamniquine or metrifonate is preferred. All of these drugs effectively kill adult worms in established infections (Fitzpatrick et al. Reference Fitzpatrick, Fuentes, Chalmers, Wynn, Modolell, Hoffmann and Hesse2009). Combined strategies (praziquantel and artesunate) have recently been shown to be safe and more effective than treatment with either drug alone, when treating urinary schistosomiasis (Inyang-Etoh et al. Reference Inyang-Etoh, Ejezie, Useh and Inyang-Etoh2009).
Over the last few years very few specific metabolite biomarker discoveries have been made since the changes in metabolites have not been proven to be specific of the infection. Research has been predominantly focused on the search for protein biomarkers (Verjovski-Almeida and DeMarco, Reference Verjovski-Almeida and DeMarco2008; Ellis and McManus, Reference Ellis and McManus2009), potential vaccine candidates (Wen and Wu, Reference Wen and Wu2007; Zhang et al. Reference Zhang, Lv, Zhou, Zhang, Yang, Yu, Zheng and Wu2008), the identification of enzymes in the worm such as novel arginases and tyrosinases (Knobloch et al. Reference Knobloch, Beckmann, Burmeister, Quack and Grevelding2007; Cai et al. Reference Cai, Bae, Zhang, He, Jiang and He2009; Fitzpatrick et al. Reference Fitzpatrick, Fuentes, Chalmers, Wynn, Modolell, Hoffmann and Hesse2009) or the study of new drug targets for thioredoxin glutathione reductase (Sayed et al. Reference Sayed, Simeonov, Thomas, Inglese, Austin and Williams2008; Simeonov et al. Reference Simeonov, Jadhav, Sayed, Wang, Nelson, Thomas, Inglese, Williams and Austin2008). In screening studies, the integration of the different -omics and use of the latest ‘-ome’ (transcriptome, proteome and glycome) technologies have been reviewed (Hokke et al. Reference Hokke, Fitzpatrick and Hoffmann2007).
Metabolomics and metabonomics focus on metabolite profiles. The terms have been exchangeable in the past and often they are used in the literature as similar concepts. However, their differences have been also employed to define two independent -omic disciplines. In general terms, metabolomics is the qualitative and quantitative study of all metabolites in tissues and biofluids rather than the classical targeted analysis, whereas metabonomics quantifies change in metabolite level over time as a result of an intervention such as diet, gene modification and mutation, drug administration, or infection. As a comparatively recent -omics science, metabonomics saw its first application to parasitic disease in 2004 by Wang et al. and has seen many successful applications in recent years (Li et al. Reference Li, Wang, Saric, Nicholson, Dirnhofer, Singer, Tanner, Wittlin, Holmes and Utzinger2008, Reference Li, Holmes, Saric, Keiser, Dirnhofer, Utzinger and Wang2009; Saric et al. Reference Saric, Li, Wang, Keiser, Bundy, Holmes and Utzinger2008, Reference Saric, Li, Wang, Keiser, Veselkov, Dirnhofer, Yap, Nicholson, Holmes and Utzinger2009; Wang et al. Reference Wang, Utzinger, Saric, Li, Burckhardt, Dirnhofer, Nicholson, Singer, Brun and Holmes2008 b).
As mentioned above, metabonomics relies on the fingerprinting of metabolites in complex mixtures (biofluids) and the integration of different analytical techniques with statistical modelling to extract the maximum information relevant to the data. Many applications have been reported to date in fields of biomedicine (Nicholson and Lindon, Reference Nicholson and Lindon2008; Xiayan and Legido-Quigley, Reference Xiayan and Legido-Quigley2008). Metabolites found in schistosome infections (e.g. in blood and urine, tissue from organs) are profiled and compared to controls to identify trait differences or possible biomarkers. In the event that specific metabolite ratios or signatures are found, these could be of use in drug development programmes by helping to identify drug targets for therapeutic intervention. Additionally metabonomics is an alternative method that could lead to new diagnostic tools for schistosomiasis. Up to now it has had a very important role in discovering pathways that have been affected during infection in mice/hamster models. Furthermore it is complementary to other -omics since resulting data have been integrated with other metadata such as genomic or proteomic outcomes (Dumas et al. Reference Dumas, Wilder, Bihoreau, Barton, Fearnside, Argoud, D'Amato, Wallis, Blancher, Keun, Baunsgaard, Scott, Sidelmann, Nicholson and Gauguier2007; Gauguier and Dumas, Reference Gauguier and Dumas2007) and work is currently being carried out by several groups on the integration of analytical techniques with new modelling techniques since this is one of the most challenging problems of modern biology.
It should be noted, however, that a fingerprinting approach (in which the entire set of a given biofluid/tissue metabolite composition is identified) is highly demanding and can have its limitations. The obvious challenge is the amount and the heterogeneous nature of metabolite chemistry, together with the likelihood of unknown confounding factors in parasitology such as co-infection. As a result, the majority of metabonomic studies performed to date involve the ‘metabolic profiling’ or ‘metabolic fingerprinting’ of subsets of metabolites, making the numbers of metabolites that are identified with the available analytical techniques in the hundreds with no applications shown in human samples. Although detection of all metabolites in a biofluid/tissue is at present impossible, there is no doubt that this approach when applied correctly can lead to the identification of biomarkers. Recent examples show how metabonomics has been applied to interpret associations between human phenotypes for diet and blood pressure (Holmes et al. Reference Holmes, Loo, Stamler, Bictash, Yap, Chan, Ebbels, De Iorio, Brown, Veselkov, Daviglus, Kesteloot, Ueshima, Zhao, Nicholson and Elliott2008) or to predict drug metabolite first order conjugations in urine in advance of administration of drugs, a new – omics science, termed phamacometabonomics (Clayton et al. Reference Clayton, Lindon, Cloarec, Antti, Charuel, Hanton, Provost, Le Net, Baker, Walley, Everett and Nicholson2006, Reference Clayton, Baker, Lindon, Everett and Nicholson2009).
The aim of the present work was to explore the literature in order to find metabolites related to the schistosome parasite and so called ‘biomarkers’ of Schistosoma infections, and discuss a number of studies performed using either a more targeted analysis or holistic approach such as metabonomics. This review has been organised into a number of sub-headings first relating to the life cycle of the parasite and then tackling studies where cells/tissue or animals have been infected. There is no focus on the biochemical pathways since few validation or selectivity studies have been published to date. A key strategy was adopted for searching online databases with near 500 manuscripts reviewed, however less than 100 were relevant. Some papers might also have been missed thus biasing the review.
REVIEWED LITERATURE
Metabolites in the snail
One of the first nuclear magnetic resonance (NMR) spectroscopy studies on the tissues of B. glabrata by 31P nuclear magnetic resonance spectroscopy revealed that several phosphorus metabolites were affected by S. mansoni infection. The decrease in a phosphonic acid was particularly notable. Although the ATP/ADP ratio was not affected by infection, an increase in the relative level of inorganic phosphate suggested a possible decrease in phosphorylation potential once the snail has been infected (Thompson and Lee, Reference Thompson and Lee1985).
A validation study was performed by Fried et al. (Reference Fried, Muller, Broadway and Sherma2001) to study B. glabrata when infected with S. mansoni and maintained on a diet of hen's egg yolk or Romaine lettuce. A number of neutral lipids were analysed in the digestive gland-gonad complex (DGG) of snails maintained on both diets. Infected snails maintained at 26 C and fed either diet produced fully developed cercariae by 4 wk post-infection (PI). Likewise, infected snails maintained at 23 C and fed either diet produced fully developed cercariae by 6 wk PI. Correlation between diet and time to cercarial patency was not proven. However, the analysis of neutral lipids showed that the DGG of infected snails fed the yolk diet contained greater amounts of free sterols and cholesteryl esters but not triacylglycerols compared to infected snails fed the lettuce diet (Fried et al. Reference Fried, Muller, Broadway and Sherma2001).
Also the effects of aestivation or starvation on the neutral lipid and phospholipid content of B. glabrata infected with S. mansoni were studied six years later. Infected-aestivated snails exhibited greater mortality rate and weight loss after 7 days than did the infected-starved snails. The steryl ester concentration in the infected-starved snails was increased compared with the controls but not compared with infected-aestivated snails; the concentration of phosphatidylcholine in infected-aestivated snails was significantly decreased compared with the controls but not when compared with the infected-starved snails. It was concluded that aestivation or starvation had a significant effect on the concentration of certain lipid classes in the DGG of B. glabrata infected with S. mansoni (White et al. Reference White, Fried and Sherma2007). Similarly a set of carboxylic acids were quantified in the DGG and haemolymph of B. glabrata. Infection with S. mansoni caused a significant reduction (Student's t test, P<0·05) in the concentrations of acetic, fumaric, malic and pyruvic acids in the DGG but not the haemolymph of B. glabrata compared to uninfected cohort snails. The findings suggested that these acids are utilized by the sporocysts and cercariae in the snail tissue or that the infection stimulates reduced production or increased utilization by the snail tissue (Massa et al. Reference Massa, Chejlava, Fried and Sherma2007).
Metabolites in the cercaria-worm-host interaction cycle
Haas et al. (Reference Haas, Haeberlein, Behring and Zoppelli2008) have found that cercariae of S. mansoni approach the host's skin via chemokinesis which can be used to calculate the attraction of cercarie to certain metabolites. Cercarie respond to human skin extracts by swimming in shifts which the group quantified as the rate of change of direction (RCD). Molecules termed attractants were identified by fractionating human skin surface extracts. The cercariae responded specifically to three skin surface compounds by increasing the frequency of shifts in swimming direction. (1) Free fatty acids. The effectiveness was limited to chain lengths between 10 and 14 carbon atoms in saturated chains and increased by the number of double bonds. (2) Free L-arginine at concentrations as low as 100 nM. (3) Small peptides with terminally located L-arginine at concentrations as low as 50 μM (Haas et al. Reference Haas, Haeberlein, Behring and Zoppelli2008; Haeberlein and Haas, Reference Haeberlein and Haas2008).
Although not specifically a metabolite, but due to the rarity of cercarie studies also mentioned in this review, a small protein (8 kDa) was recently determined by matrix-assisted laser desorption/ionization time-of-flight (ToF). This technique has been widely applied to the identification of proteins related to infection and in this particular case the small calcium-binding protein (SjCa8) was specifically expressed in cercariae and skin-stage schistosomulum (transformed within 3 h) (Lv et al. Reference Lv, Yang, Hu, Sun, He, He, Li, Zhou, Fung, Yu, Zheng, Cao and Wu2009). Another small protein (55 kDa) was detected in adult worm extracts and was also found to be expressed on the tegumental surface of cercariae (Lochmatter et al. Reference Lochmatter, Schifferli and Martin2009).
One of the first studies published concerning detection of various metabolites concentrated on the uptake of sugars and amino acids by the adult worm. Transintegumental uptake in living schistosomes (in vitro) was tested by using 14C labeled compounds. L-glucose uptake was low, but high uptake rates were observed in both sexes for D-glucose. Minimal uptake of mannitol was observed. The uptake rates of D-glucose and the L-amino acids (arginine, ornithine, lysine, histidine, phenylalanine and serine) were higher in female schistosomes. Slight elevations in uptake by females were observed for threonine, valine and glycine, but aspartate uptake was slightly higher in males. No dramatic male-female differences were immediately apparent for the uptake of proline, leucine, isoleucine, tyrosine and glutamate. Schistosome uptake of L-amino acids that are essential for vertebrates was generally higher than uptake of the non-essential amino acids (Cornford and Oldendorf, Reference Cornford and Oldendorf1979).
In an interesting study by Zhu et al. (Reference Zhu, Baggerman, Secor, Casares, Pryor, Fricchione, Ruiz-Tiben, Eberhard, Bimi and Stefano2002) HPLC coupled with electrochemical detection and by nano-electrospray-ionization-TOF analysis were employed to show that adult Dracunculus medinensis and S. mansoni both contain the opiate alkaloid morphine and that D. medinesis also contained the conjugated metabolite, morphine 6-glucuronide. From these results, it was suggested that helminths could use opiate alkaloids as immunosuppressive and anti-nociceptive signal molecules, to down-regulate immunosurveillance, responsiveness and pain signalling in their hosts (Zhu et al. Reference Zhu, Baggerman, Secor, Casares, Pryor, Fricchione, Ruiz-Tiben, Eberhard, Bimi and Stefano2002).
More recently, in a study concerning enzymes, cryosections of adult worms were probed and the production of calcium-mobilizing metabolites such as cyclic adenosine diphosphate ribose (cADPR) was detected. This molecule was synthesized by a novel member of the ADP-ribosyl cyclase family also expressed in S. mansoni (Goodrich et al. Reference Goodrich, Muller-Steffner, Osman, Moutin, Kusser, Roberts, Woodland, Randall, Kellenberger, LoVerde, Schuber and Lund2005).
Metabolites in liver
In the 1940s and 1950s, the first findings on the effects of S. mansoni infections on certain liver functions associated with protein metabolism were made. The metabolite allantoin increased in the rabbit on infection (Nishizaki et al. 1938) and fifteen years later, it was postulated in the mouse model that the urea cycle and its metabolism were disrupted (Daugherty et al. Reference Daugherty, Garson and Heyneman1954). In the 1980s, macrophages isolated from liver granulomas in mice infected with S. mansoni for 8 to 20 weeks, were found to synthesize thromboxane A2. Thromboxane A2 was the predominant metabolite found when the cells were stimulated by phagocytic stimuli, such as zymosan or the exogenous substrates arachidonic acid and PGH2 (Tripp et al. Reference Tripp, Needleman, Kassab and Weinstock1988).
More recently, Muller et al. (Reference Muller, Rosa Brunet, Fried and Sherma2001) studied lipid metabolism disruption due to infection, as it was suggested by the group that granulomatous lesions interfere with normal organ functions. Egg-induced tissue damage in a mouse model was investigated and the lipid profiles of the liver and ileum were analysed. The group found mainly that triacylglycerol and cholesteryl ester levels decreased significantly as the infection progressed (Muller et al. Reference Muller, Rosa Brunet, Fried and Sherma2001). Five years later, an original study claimed that praziquantel therapy improves granulomas found in the liver. The authors postulate that adult schistosomes excrete pigments after erythrocyte ingestion; these unidentified pigments are essentially small molecules and metabolites that are deposited outside and inside the granuloma. The group found correlation between the level of pigment and the degree of liver fibrosis. After dosing with praziquantel, results showed that the amount of pigment decreased and the size of granuloma diminished also. They concluded that schistosome infection and the effect of praziquantel can be monitored by the amount and distribution of the pigments (Tao et al. Reference Tao, Cai, Zhang, Huang, Xiang and Liu2006).
In recent years it has been suggested that chronic exposure to S. mansoni could have beneficial effects such as preventing the onset of diseases such as diabetes mellitus, but this validation study found different results. With four groups of mice: (1) control group, (2) group infected with S. mansoni, (3) group injected with streptozotocin to induce diabetes, and (4) group infected and then 3 months post-infection injected with streptozotocin. No differences were detected between the infected non-diabetic and infected diabetic groups regarding worm burden, tissue egg count and oogram. Consecutively, the group showed that S. mansoni infection reduced the rate of glucose uptake by the diaphragm (Thabet et al. Reference Thabet, Saleh, Thabet, Abdel-Aziz and Kalleny2008).
Based on the beneficial influence of the naturally occurring hormone, melatonin, on the immune system its administration was studied during the course of schistosomiasis. Melatonin was given with S. mansoni adult worm antigen (SWAP) and cercarial antigen (CAP). Results showed that the worm reduction percentages were 99·3% for SWAP+melatonin in the hamster model. Highly significant reductions in egg load in the liver were observed in the groups that received melatonin treatment suggesting a possible role for melatonin in egg production metabolism (Soliman et al. Reference Soliman, El Shenawy and El Arabi2008).
Recently, in a comparison of two different strains of mice, a significant increase in malondialdehyde level was found in infected mice. This reactive metabolite occurs naturally and is a marker for oxidative stress. Detailed discussion on the parasitological and other biochemical differences between the two strains was also presented in this manuscript (Bin Dajem et al. Reference Bin Dajem, Mostafa and El-Said2008).
Metabolites from eggs in human urine
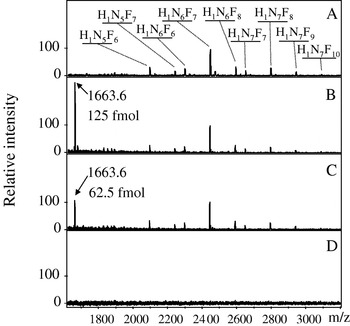
The group of Hokke and Deelder have produced pioneering work with human urine. Free fuco-oligosaccharides (higher mass than a metabolite again, 1000–2000 uma but considered small molecule markers by the authors) were detected with matrix-assisted laser-desorption-ionization time-of-flight (MALDI-TOF). Urine samples from Egyptian individuals with different intensities of infection were analysed and correlated to schistosome egg load (Robijn et al. Reference Robijn, Koeleman, Hokke and Deelder2007, Reference Robijn, Planken, Kornelis, Hokke and Deelder2008). One can observe in Fig. 1 the results of analysis by MALDI-TOF: in particular the spectra of mAb 114-4D12-affinity-purified marker oligosaccharides from a pool of urine from S mansoni-infected individuals (A–C) and non-infected controls (D) are shown.
Matrix-assisted laser-desorption-ionization time-of-flight (MALDI-TOF) spectra of mAb 114-4D12-affinity-purified marker oligosaccharides from a pool of urine from heavily Schistosoma mansoni-infected individuals (A–C) and non-infected controls (D). The compositions of the marker oligosaccharides are indicated (A). H, hexose; N, N-acetylhexosamine; F, fucose. For quantification, the eluate of the S. mansoni-infected urine was spiked with 125 fmol (B) and 62·5 fmol (C) of the di-antennary N-glycan standard, H5N4 (m/z 1663·6, [M+Na]+). (Permission granted)

Metabonomics
NMR spectroscopy, coupled with data-mining techniques, is a powerful technique for metabonomics. This approach when compared with LC-MS-based studies shows greater reproducibility/robustness and samples can be reanalyzed. For metabolite identification some open-source software is available (Wang et al. Reference Wang, Shao, Chu, Ren, Mu, Qu, He, Jin and Xia2009). As mentioned previously, in Reference Wang, Holmes, Nicholson, Cloarec, Chollet, Tanner, Singer and Utzinger2004 Wang et al. pioneered the first application of metabonomics in parasitology. The study consisted of designing an experiment for the S. mansoni-mouse model which was analysed with 1H NMR spectroscopy and multivariate pattern recognition. Mice were infected with 80 S. mansoni cercariae each and urine was collected for 49 and 56 days post-infection. They found that the metabolic signature of an S. mansoni infection consists of reduced levels of the tricarboxylic acid cycle intermediates, including citrate, succinate and 2-oxoglutarate, and increased levels of pyruvate, suggesting stimulated glycolysis. In addition a disturbance of amino acid metabolism was also associated with an S. mansoni infection, as indicated by depletion of taurine, 2-oxoisocaproate and 2-oxoisovalerate and elevation of tryptophan in the urine. Microbial-related metabolites were also detected: trimethylamine, phenylacetylglycine, acetate, p-cresol glucuronide, butyrate, propionate, and hippurate, were correlated with the S. mansoni infection, indicating disturbances in the gut microbiota (Wang et al. Reference Wang, Holmes, Nicholson, Cloarec, Chollet, Tanner, Singer and Utzinger2004).
The same team performed a similar metabolic profiling study to investigate the metabolic responses of Syrian hamsters to S. japonicum infection using 1H NMR and pattern recognition. In two independent experiments, male hamsters were each infected with 100 S. japonicum cercariae. At days 34 and 36 post-infection, urine was obtained from hamsters and the respective controls housed individually in metabolism cages. The main biochemical effects of S. japonicum infection in the hamster consisted of reduced levels of urinary tricarboxylic acid cycle intermediates, including citrate and succinate and increased levels of pyruvate. In addition, as in the previous study a range of microbial-related metabolites, such as hippurate, p-cresol glucuronide, phenylacetylglycine and trimethylamine were also associated with S. japonicum infection. The major distinguishing result of S. japonicum infection in the hamster was the inhibition of manufacture or utilization of short-chain fatty acids, when compared to a S. mansoni infection in the mouse (Wang et al. Reference Wang, Utzinger, Xiao, Xue, Nicholson, Tanner, Singer and Holmes2006). Further to this, the group examined different tissue samples recovered from the host animal (mice) using the same metabolic profiling strategy. At day 74 PI, jejunum, ileum, colon, liver, spleen and kidney samples were collected (Li et al. Reference Li, Holmes, Saric, Keiser, Dirnhofer, Utzinger and Wang2009). Most tissues obtained from S. mansoni-infected mice were characterized by high levels of amino acids, such as leucine, isoleucine, lysine, glutamine and asparagine. High levels of membrane phospholipids metabolites, including glycerophosphoryl choline and phosphoryl choline were found in the ileum, colon, liver and spleen of infected mice.
S. mansoni has been fingerprinted using another technique, capillary electrophoresis (CE). CE is a technique that is mainly used for larger molecules but has seen an increased number of applications in metabonomics in the last years due to its low cost (Garcia-Perez et al. Reference Garcia-Perez, Vallejo, Garcia, Legido-Quigley and Barbas2008 a; Papaspyridonos et al. Reference Papaspyridonos, Garcia-Perez, Angulo, Domann, Vilca-Melendez, Heaton, Murphy, Holmes, Barbas and Legido-Quigley2008). Methods developed for CE-UV detection usually rely on charged compounds and are based on the mass-to-charge ratio of the metabolite in solution. In such a way cations and anions are detected. Application of a voltage across the capillary causes electrophoretic and electrosmotic movement, this results in the ionic species in the samples moving along the capillary and passing through the online UV detector. The Institute for Advanced Biosciences, Japan has led the way to the linking of CE-MS for metabolic fingerprint acquisition; its application to the field of parasitology could indeed bring new information on metabolites related with infection, since the group claims to have a database of 1000 metabolites detected already in bacteria (Soga and Imaizumi, Reference Soga and Imaizumi2001; Sugimoto et al. Reference Sugimoto, Kikuchi, Arita, Soga, Nishioka and Tomita2005; Monton and Soga, Reference Monton and Soga2007; Soga, Reference Soga2007; Soga et al. Reference Soga, Igarashi, Ito, Mizobuchi, Zimmermann and Tomita2009).
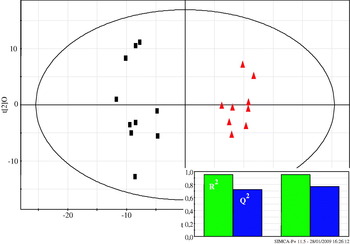
In CE, combining two analyses can enhance fingerprints when using only CE-UV. Two modes of separation were used with untreated urine samples. Micellar EKC (MEKC) and zonal CZE conditions where neutral compounds are also separated due to interaction with micelles. The traditional problems associated with variability in electrophoretic peak migration times for analytes were countered by using a dynamic programming algorithm for electropherogram alignment. Discriminant analysis (PLS-DA) provided a valuable means of rapid sample classification when infected urines were compared to controls (Garcia-Perez et al. Reference Garcia-Perez, Whitfield, Bartlett, Angulo, Legido-Quigley, Hanna-Brown and Barbas2008b). In Fig. 2 as an example we can observe the scores plot for the OPLS-DA model derived from CE-UV data. The control and infected mice in the last week of infection are shown in black boxes and red triangles respectively.
Scores plot for the OPLS-DA model derived from CE-UV data. The control and infected mice in the last week of infection are shown in black boxes and red triangles respectively. R2 is the percentage of data explained by the model (near 95%) and Q2 is the estimation of a new data point/sample being predicted correctly (78%). (Permission granted)

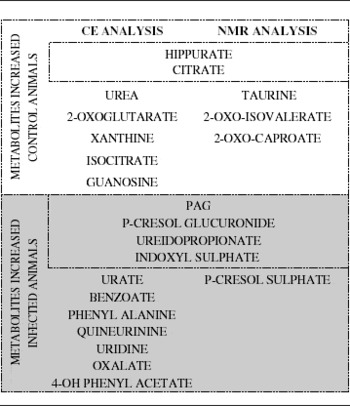
Using the same data, an autocorrelation algorithm was devised by the Barbas' group (Angulo et al. Reference Angulo, Garcia-Perez, Legido-Quigley and Barbas2009), this enabled finding further relationships between metabolites. The method was similar to STOCSY, a method applied previously in NMR data and based on the Pearson's correlation (Holmes et al. Reference Holmes, Cloarec and Nicholson2006). It was found that various metabolites of the phenylalanine cycle were indeed correlated and over metabolized in the infected animals. Another statistical correlation application but this time hyphenating two different analytical techniques, NMR and CE shown in 2D plots was published (Garcia-Perez et al. Reference Garcia-Perez, Couto Alves, Angulo, Li, Utzinger, Ebbels, Legido-Quigley, Nicholson, Holmes and Barbas2010). A number of metabolites, such as 3-ureidopropionate, p-cresol glucuronide, phenylacetylglycine (PAG), indoxyl sulfate, isocitrate, and trimethylamine, were identified as differentiating between infected and control animals. It was concluded by the authors that this correlation provided deeper mechanistic insight into the biological process in the infection. In Table 1 a list of the metabolites identified as important metabolites in the infection process with CE and NMR is shown.
The main metabolites found following a metabonomics approach using two different analytical techniques, CE and NMR

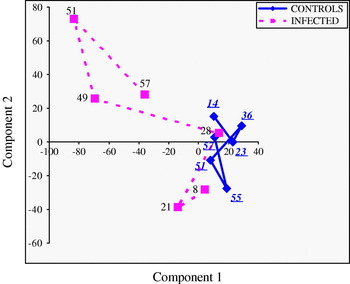
Ultra-performance liquid chromatography, a technique which has seen wide application in metabonomics in recent years and is preferred over conventional liquid chromatography, has been utilised to fingerprint the urine of infected mice. In Fig. 3 we observe what are called time trajectories, which are the scores mean trajectory derived from PCA using UPLC-MS data, where each point is a day in the life of the mice representing the mean position for the whole group during the course of the disease. In day 49 of infection, a significant deviation from the metabolic trajectory of controls is observed. This difference was attributed to PAG which was a metabolite related to microbial composition/metabolism and had been observed in previously published NMR and CE studies (Garcia-Perez et al. Reference Garcia-Perez, Whitfield, Bartlett, Angulo, Legido-Quigley, Hanna-Brown and Barbas2008 b; Wang et al. Reference Wang, Zhou, Vounatsou, Chen, Utzinger, Yang, Steinmann and Wu2008 a).
Scores mean trajectory derived from PCA of UPLC-MS data: Each point is a day in the life of the mice, representing the mean position for the whole group along the illness. (Ahead of publication)

DISCUSSION
To my knowledge there have been no fingerprinting studies on humans infected with Schistosoma spp. published to date, so not surprisingly clinical diagnosis is at a stage which lags behind other -omic sciences such as methods based on proteomic and genomic outcomes (DeMarco and Verjovski-Almeida, Reference DeMarco and Verjovski-Almeida2009; Han et al. Reference Han, Brindley, Wang and Chen2009).
To a large extent, metabonomics or particular metabolite investigations need to be applied more widely as this will increase the chance of finding specific small molecule biomarkers. This becomes more apparent when compared to techniques that are already highly sensitive and specific such as circulating cathodic antigen (CCA) and ELISA. These techniques are now complementary to detection by microhaematuria with reagent strips, which is the known proxy marker for urinary schistosomiasis. This year it was shown that CCA urine reagent strip methods can achieve sensitivities of 88·2% and 95·8%, respectively, for pre- and post-praziquantel treatment. The improved version has been employed in the field by diagnosing S. haematobium in Zimbawe (Midzi et al. Reference Midzi, Butterworth, Mduluza, Munyati, Deelder and van Dam2009). A different result was obtained in Zanzibar where CCA strip and the soluble egg antigen ELISA were tested for detection in 150 schoolchildren. Diagnostic scores were poor for the urine-CCA strip and the authors defined the test as ‘not satisfactory’ showing a sensitivity of 9%. By contrast, the performance of the SEA-ELISA using sera from fingerprick blood was good; a sensitivity of 89% and a specificity of 70% were obtained. (Stothard et al. Reference Stothard, Sousa-Figueiredo, Standley, Van Dam, Knopp, Utzinger, Ameri, Khamis, Khamis, Deelder, Mohammed and Rollinson2009). Another approach is to measure albumin concentrations in urine, which has shown promising diagnostic results, especially in school-aged children with lesser sensitivity (63·3%) and specificity of 83·1% at detecting lower urinary tract lesions (Sousa-Figueiredo et al. Reference Sousa-Figueiredo, Basanez, Khamis, Garba, Rollinson and Stothard2009).
Early diagnosis and prompt treatment of schistosome infection is crucial to avoid granulomas/chronic infection and this is where detection of low concentrations of small molecules could be of great benefit since these could be easier to analyse/detect in urine. In the case of S. mansoni, low-burden infections may be detected by means of serological immunodiagnostic tests. Serum ELISA gave positive results as early as 4–6 weeks post-infection depending on the cercarial doses in the mouse and rabbit model (Lei et al. Reference Lei, Liu, Sun, Tang, Li, Chen and Li2009; Xia et al. Reference Xia, Rong, Lu, Shi, Xu, Zhang, Gong and Luo2009 a). The full-length DNA sequence of FBPA (fructose-1,6-bisphosphate aldolase) was found to be 1092 bp, encoding a protein of 363 amino acid residues, with a molecular mass of 39·6 kDa. Western blot analysis showed that the recombinant FBPA reacts strongly with schistosome ova-positive sera. The sensitivity and specificity of ELISA with FBPA were 85·3% and 93·0%, respectively (Peng et al. Reference Peng, Tsaihong, Fan and Lee2009). However, the fastest detection method for S mansoni DNA was touchdown PCR in sera at only 2 weeks post-infection in mice (Helmy, Reference Helmy2007), whilst S. japonicum DNA in the rabbit was detected in sera at a record first week post-infection (Xia et al. Reference Xia, Rong, Lu, Shi, Xu, Zhang, Gong and Luo2009 a). Nonetheless, in our opinion a specific method for early detection in urine would be easier to test especially if produced in an economical format. Some thoughts on future prospects will be provided below.
CONCLUSION AND FUTURE PROSPECTS
Metabolites found at the different stages of the schistosome life cycle have yet to be proven as biomarkers of infection. The enzymes associated with those metabolites might prove useful drug targets in the case of drug-induced tolerance, however an assay combining information on proteins and small molecules should be more specific, especially when co-infection is frequent.
The crucial requirement for any metabolic profiling technique is wide selectivity, i.e. it should provide identifiable signals for as many metabolites as possible. As noted above, the possibility of measuring samples in CE when operating with two different polarities allows the acquisition of information on a subset of metabolites. Identification of many more metabolites can already be achieved (up to 1000) when CE is combined with MS. Similarly NMR and LC-MS studies and future improvements in sensitivity and robustness respectively will lead to larger subsets of metabolites being identified, probably in the thousands. This is an exciting prospect since it will increase the chances of discovering a specific biomarker or signature of metabolites at the near infection stage.
In the next decade, not only analytical techniques will improve but also multivariate analysis algorithms will become more powerful (databases of algorithms are available free on-line like this version (Xia et al. Reference Xia, Psychogios, Young and Wishart2009 b)). This will allow the biochemical mechanisms at the low molecular mass level of the infecting S. mansoni larvae to be understood. The feasibility of the metabonomics approach in assessing complex disease in human conditions has been demonstrated in recent years. Based on this, my opinion is that metabolic fingerprints could be used as a diagnostic tool in humans and this could become a reality in the next decade. The likelihood of such a tool becoming available will depend in general terms on research initiatives/collaborations and funding. However, the real challenge still remains with the scientists in the field to attain faster, more selective, more specific and economically viable tests that surpass the currently available methods.