




No CrossRef data available.
Article contents
Measurement and prediction of subjective fatigue following traumatic brain injury
Published online by Cambridge University Press: 01 July 2005
Abstract
Numerous outcome studies have found fatigue to be a common problem following traumatic brain injury (TBI). This study examined the magnitude, causes and impact of fatigue following TBI using three subjective fatigue scales, and investigated its relationship with demographic and injury-related factors, and mood. Forty-nine controls and 49 TBI participants (36.2% with GCS score of 13–15, 29.8% with GCS score of 9–12, and 34% with GCS score of 3–8) were seen at a mean of approximately 8 months post injury. All participants completed three subjective fatigue measures, including the Fatigue Severity Scale (FSS), Visual Analogue Scale–Fatigue (VAS–F) and Causes of Fatigue Questionnaire (COF). TBI participants reported a significantly greater impact of fatigue on their lifestyle on the FSS relative to controls, and reported activities requiring physical and mental effort as more frequent causes of fatigue on the COF. There were, however, no significant group differences on subscales of the VAS–F. Greater time since injury and higher education levels were associated with higher fatigue levels, independent of the effects of mood. Injury severity and age were not found to be significant predictors of subjective fatigue severity in TBI participants. (JINS, 2005, 11, 416–425.)
Information
- Type
- Research Article
- Information
- Journal of the International Neuropsychological Society , Volume 11 , Issue 4 , July 2005 , pp. 416 - 425
- Copyright
- © 2005 The International Neuropsychological Society
INTRODUCTION
Many studies have reported fatigue as one of the most common symptoms following traumatic brain injury (TBI; Dikmen et al., 1993; Evans, 1992; Middleboe et al., 1992; Olver et al., 1996; Ponsford et al., 1995; Seel et al., 2003; van der Naalt et al., 1999; van Zomeren & van den Burg, 1985; Vitaz et al., 2003). These studies indicate varying prevalence of fatigue ranging from 32.4% to 73% at 5 years post injury (Masson et al., 1996; Olver et al., 1996). Fatigue appears to persist over time, with results from a large sample of moderate to severely injured patients at 2 and 5 years post injury indicating relative stability in the reporting of fatigue over time (68% and 73%, respectively; Olver et al., 1996). Family members have also reported fatigue to be a persisting problem over a two year time period in their severely head injured relatives (Hellawell et al., 1999). Other studies conducted with mild head injury patients and brain injured patients of mixed etiology have suggested improvement in fatigue levels over time (Jones, 1974; Middleboe et al., 1992). With respect to severity of injury, Masson et al. (1996) reported the highest prevalence of fatigue in the most severely injured patients (57.7%) compared with patients with moderate (32.4%) and minor (35.1%) head injuries.
Aaronson and colleagues (1999) have defined fatigue as “the awareness of a decreased capacity for physical and/or mental activity due to an imbalance in the availability, utilization, and/or restoration of [psychological or physiological] resources needed to perform activity” (p. 46). This definition highlights the subjective nature of fatigue, as the experience of fatigue is reliant upon its awareness. Fatigue occurs when there is an imbalance in the utilization and restoration of these resources, or when utilization and restoration processes are impaired (Aaronson et al. 1999).
Physiologically, fatigue is associated with functional organ failure caused by excessive energy consumption, and is characterized by depletion of essential substrates of physiological functioning (e.g., hormones, neurotransmitters) or a diminished ability to contract muscles (Aaronson et al., 1999; Lee et al., 1991). Physiological fatigue can be further characterized by the origin of dysfunction into central and peripheral fatigue, with fatigue of central origin involving impairment of the central nervous system (CNS) such as injury of the reticular activating system, or diffuse axonal injury which might compromise information processing efficiency. Fatigue of peripheral origin involves malfunction of the peripheral nervous system, such as impaired transmission at the neuromuscular junction (Gibson & Edwards, 1985; Piper, 1989). Psychological factors are also associated with fatigue (Fuhrer & Wessely, 1995; Pawlikowska et al., 1994; Wessely et al., 1995). A person's psychological state can be affected by the presence of fatigue (DeVries et al., 2003) and, conversely, fatigue can be a common symptom of psychiatric disorders such as depression (American Psychiatric Association, 1994).
Attempts to measure fatigue have been complicated by the absence of biological markers, a lack of standardization of fatigue measures, and a paucity of data on fatigue in healthy individuals (Aaronson et al., 2003). As fatigue is a subjective phenomenon, it has been argued that it cannot be measured objectively with tests, and that assessment of fatigue should be based on self-report measures (Ferrell et al., 1996; Lewis & Wessely, 1992; Meek et al., 2000; Ream & Richardson, 1996; Smets et al., 1993). Numerous subjective fatigue scales have been developed (Belza et al., 1993; Chalder et al., 1993; Fisk et al., 1994; Hann et al., 1998; Krupp et al., 1989; Lee et al., 1991; McNair et al., 1981; Mendoza et al., 1999; Piper, 1989; Piper et al., 1989; Schwartz et al., 1993; Smets et al., 1995). These scales address different aspects of fatigue, with some measuring characteristics of fatigue, some measuring consequences of fatigue and others measuring the subjective feelings associated with fatigue (Aaronson et al., 1999). Other multidimensional questionnaires attempt to measure a combination of these aspects. Many of these measures have only been validated for use in specific clinical populations (e.g., cancer), and only three (i.e., the Fatigue Severity Scale, FSS; the Visual Analogue Scale–Fatigue, VAS–F; and the Fatigue Impact Scale, FIS) have been used in individuals with acquired brain injury, although this study involved injuries of mixed etiology (LaChapelle & Finlayson, 1998). The extent to which these measures inter-relate with one another and with other objective measures of fatigue remains unclear. Moreover, no studies have focused on subjective measurement of fatigue in groups comprising of TBI individuals only.
While there have been few detailed studies of fatigue following TBI, there is a growing literature on fatigue in other illnesses (e.g., cancer, multiple sclerosis, MS; chronic fatigue syndrome) and healthy individuals. In the general population, fatigue is reported more commonly by those with higher levels of education, more acute health complaints, a greater frequency of psychosocial problems and psychiatric disorders, lower levels of perceived health and overwork in life roles (Aaronson et al., 2003; Bensing et al., 1999; Ridsdale et al., 1993). Fatigue is also more common in employed females with children, whereas having children is not related to fatigue in men (Bensing et al., 1999; Pawlikowska et al., 1994). Some studies report greater fatigue in older participants, and others report greater fatigue in younger participants (Bensing et al., 1999; Schwarz et al., 2003). Other factors thought to be associated with fatigue include sleep and pain (Cooke et al., 1998; Fishbain et al., 2003; Hayashi et al., 1999; Lavidor et al., 2003; Morriss et al., 1997; Reyes-Gibby et al., 2003). Medications such as anticonvulsants, antidepressants and analgesics (e.g., tramadol hydrochloride and oxycodone hydrochloride) may also cause fatigue or drowsiness (Beenen et al., 1999; MIMS Australia, 2004; Salinsky et al., 1996; Schwartz et al., 2004; Spigset, 1999; Wade et al., 2003).
Research investigating fatigue, its causes, and its relationships with injury-related factors (e.g., severity of injury), demographic factors, and emotional changes commonly associated with TBI has been sparse. One study, conducted by LaChapelle and Finlayson (1998), investigated fatigue in a group of 30 patients who sustained brain injury due to various causes including motor vehicle accidents, falls, assault, stroke, aneurysm, encephalitis and meningitis. In comparison with healthy controls, brain-injured participants reported significantly greater levels of fatigue on two subjective measures, the FSS and FIS, and lower levels of energy on the vigour subscale of the VAS–F. There was also a trend for scores on the fatigue subscale of the VAS–F to be higher in brain injured participants.
Two studies of fatigue following brain injury have attempted to objectively assess fatigue levels with measures focusing on central physiological processes. The first, by LaChapelle and Finlayson (1998), used a thumb pressing task, and the second compared performance on a reaction time task at the beginning and end of a testing session (Stuss et al., 1989). Both studies failed to show a significant decline in performance over time. Another study conducted by Walker and colleagues (1991) examined peripheral physiological fatigue following TBI with objective measures including quadricep muscle isometric force, maximum isokinetic torque and torque curves, and found no significant difference on these measures between TBI and able-bodied controls. Walker et al. (1991) also reported that subjective ratings of fatigue did not correlate significantly with peripheral fatigue measures. These findings are not surprising, given the abovementioned distinction between peripheral and central physiological fatigue. Arguably, it is more appropriate to focus on measures of central physiological fatigue in conditions such as TBI that involve damage to the CNS. In addition, the absence of significant differences between TBI participants and controls on objective measures of central physiological fatigue suggests that such measures may not be capturing fatigue adequately. There is therefore a need to use subjective fatigue measures.
Depression is common following TBI, and potentially contributes to fatigue. Studies assessing depression using a structured interview format and DSM–IV diagnostic criteria suggest rates of major depressive disorder ranging from 42% to 61% at a mean of 2.5 and 8 years, respectively (Hibbard et al., 1998; Kreutzer et al., 2001). Walker et al. (1991) reported a significantly greater level of depression in TBI patients with fatigue compared with those without fatigue. These authors argued that it is difficult to infer the direction of causality between fatigue and depression, with depression secondary to TBI potentially leading to fatigue, and fatigue as a separate entity, potentially affecting mood subsequent to limitations placed on lifestyle.
Given the limited research investigating subjective fatigue following TBI, the present study had the following aims:
- To investigate the subjective magnitude, self-reported causes and impact of fatigue experienced in a group of TBI participants compared with healthy controls using three subjective fatigue measures
- To investigate the internal consistency of and relationship between three subjective fatigue measures
- To examine relationships between subjective fatigue and demographic factors, severity of brain injury, time since injury, severity of orthopedic injury, levels of depression and anxiety, and medication use following injury.
Following from the findings of LaChapelle and Finlayson (1998), it was hypothesized that TBI participants would report higher levels of fatigue on the FSS and lower vigor levels on the vigor subscale of the VAS–F. Accordingly, it was anticipated that TBI participants would report a range of activities of both a physical and cognitive nature as more frequent causes of fatigue. While there has been no known published research investigating the relationship between demographic factors and fatigue following TBI, given the findings of studies conducted in the general population, it was hypothesized that fatigue would be more common in females and those with higher levels of education. On the basis of previous outcome studies, no relationship between fatigue and time since injury was expected, however, it was anticipated that greater fatigue would be associated with more severe injury. Finally, it was hypothesized that higher subjective fatigue ratings would be associated with the presence of depression, more severe orthopedic injuries and use of medications including antidepressants, anticonvulsants and analgesics, due to their known effects.
METHODS
Research Participants
Participants with TBI were recruited from the brain injury rehabilitation unit at Epworth Rehabilitation Centre, Melbourne, Australia following discharge from inpatient care. Controls of similar age and educational background were recruited from the general community. All participants were between the ages of 16 and 60, had adequate physical and cognitive abilities and understanding of English to complete tasks, had no history of previous neurological disturbance and were not using illicit drugs at the time of testing. In addition, control participants had no history of brain injury or other neurological illness.
Forty-nine TBI participants were recruited, of whom 65.3% were male. The average age of the TBI group was 34.86 years (SD = 12.99, range = 16–59), and the average years of education was 12.29 (SD = 3.00, range = 8–23). On the basis of performance on the National Adult Reading Test (NART), the mean estimated full-scale IQ of the TBI group was 98.96 (SD = 13.40, range = 69–123). They had a mean GCS score of 9.85 (SD = 4.11, range = 3–15), with 36.2% scoring between 13 and 15, 29.8% scoring between 9 and 12, and 34% scoring between 3 and 8. Of the patients who obtained a GCS score between 13 and 15, 58.2% had positive findings on CT or MRI. Mean post-traumatic amnesia (PTA) duration was 21.03 days (SD = 24.23, range = 1–120), with 34% of patients having a PTA duration of less than 7 days, 39% having a PTA duration of between 7 and 28 days, and 24.5% having a duration of PTA greater than 28 days. TBI participants were seen at an average of 241.67 days post injury (SD = 218.24, range = 21–1153), with 22.4% assessed less than 3 months, 59.2% between 3 and 12 months and 18.3% more than 12 months post injury. Prior to injury, 87.8% of TBI participants were employed, 8.2% were students and 4.1% were not employed or involved in study (e.g., unemployed, home-based duties). At the time of participation, 38.8% of TBI participants were involved in employment or study. As these participants were being treated within a no-fault accident compensation system, they were not involved in litigation relating to their injury.
The control group comprised 49 participants, of which 63.3% were male. Their mean age was 34.51 years (SD = 10.44, range = 16–60), and the average years of education was 12.72 (SD = 2.37, range = 9–19). The estimated full-scale IQ of the control group was 99.50 (SD = 10.99, range = 77–121). At the time of testing, 85.7% of control participants were involved in employment or study.
There were no significant differences between the TBI and control groups in age, IQ and years of education [F(3,89) = .25, p = .86] or in the proportion of males in each group [χ2(1) = .04, p = .83]. There were, however, significantly fewer TBI participants involved in employment or study at the time of testing [χ2(1) = 22.96, p < .001].
Measures
Fatigue measures
Aaronson et al. (1999) have argued that measurement of fatigue should include subjective assessment of (1) quantification of fatigue; (2) experience of distress caused by fatigue; and (3) impact of fatigue on lifestyle. In addition, Aaronson argues that recognized correlates of fatigue such as depression and key biological parameters should also be examined.
The Visual Analogue Scale for Fatigue (VAS–F; Lee et al., 1991) was employed to subjectively quantify fatigue levels at a given point in time. It is an 18-item measure that requires participants to circle a number between 1 and 10 on a continuum of fatigue or energy/vigor indicating current subjective fatigue and energy levels. The scale contains a fatigue subscale and a vigor subscale. Items include not at all tired versus extremely tired, and not at all energetic versus extremely energetic. Research has shown this scale to be a reliable and valid measure of fatigue (Lee et al., 1991; Meek et al., 2000; Winstead-Fry, 1998), and the vigor subscale of the VAS–F has been shown to differentiate between brain-injured and control subjects (LaChapelle & Finlayson, 1998; Lee et al., 1991).
The Fatigue Severity Scale (FSS; Krupp et al., 1989) was included as a measure of both the impact of fatigue on activities of daily life and distress caused by fatigue. It contains nine items including, Fatigue causes frequent problems for me, Fatigue interferes with my physical functioning, and Fatigue interferes with carrying out certain duties and responsibilities. Studies examining the FSS have shown it to have acceptable internal consistency, stability over time, and sensitivity to clinical changes, and it distinguishes fatigue in brain-injured patients from that of controls (Krupp et al., 1989; LaChapelle & Finlayson, 1998). It has been used in clinical groups with sleep disorders, multiple sclerosis, eosinophilia–myalgia syndrome, post-lyme syndrome, cancer, chronic fatigue syndrome, Parkinson's disease and epilepsy (Bruce et al., 1999; Ettinger et al., 1998; Gaudino et al., 1997; Herlofson & Larsen, 2002; Krupp et al., 1995; Lichstein et al., 1997; Pollina et al., 1998; Tench et al., 2000, 2003; Winstead-Fry, 1998).
The Causes of Fatigue Questionnaire (COF) was developed for use in the study as a measure of the extent to which 12 activities cause fatigue. Activities included tasks that are primarily physical (e.g., exercising, going for walk), tasks that are primarily mental (e.g., concentrating, reading, having a conversation) and tasks that are less easily categorized as physical or mental (e.g., going shopping, participating in social activities). Responses were scored from 1 to 5, with 1 representing never true and 5 representing always true.
Depression and anxiety were assessed with the Hospital Anxiety and Depression Scale (HADS; Snaith & Zigmond, 1994). The HADS is a 14-item scale containing two separately scored subscales of anxiety and depression. While the HADS was initially designed as a measure of anxiety and depression in non-psychiatric hospital settings, it has also been shown to be a valid and reliable measure in other settings with various populations (Caci et al., 2003; Harter et al., 2001; Snaith & Zigmond, 1994). It is relatively unaffected by concurrent physical illness.
Possible biological parameters of fatigue such as blood pressure were examined as part of a parallel study investigating the relationship between vigilance and fatigue. Other parameters such as liver function, renal function and fluid and electrolyte status were not examined as these were not considered potential causes of TBI induced fatigue.
National Adult Reading Test (NART; Nelson & Willison, 1991)
The NART is a reading test comprising irregularly spelled words that was used as a measure of estimated premorbid intellectual ability.
Bethesda Scale for Orthopaedic Injury Classification (Hill et al., 2001)
This 4-point rating scale provides an index of orthopedic injury severity. A rating of 1 reflects an uncomplicated fracture with no major joint disruption, no motor loss and no significant soft tissue injury. A rating of 2 reflects multiple uncomplicated fractures excluding joint surface disruption or nerve lesions. A rating of 3 is given for fractures involving major joint surface, and a rating of 4 reflects severe crush fractures and/or major peripheral nerve lesion and/or major soft tissue lesions.
Procedure
Ethics approval was obtained from relevant hospital and university ethics committees, and all participants (and/or their legal guardians) provided informed consent prior to participating in the study. Medical details including physical injuries sustained at time of injury, GCS score upon admission to acute hospital and PTA duration were obtained from hospital records. PTA duration was determined by prospective monitoring using the Westmead PTA Scale (Shores et al., 1986). A physiotherapist examined details of physical injuries sustained at injury and rated them according to the Bethesda Scale for Orthopaedic Injury Classification.
Participants were asked to complete a background questionnaire documenting their age, occupation, employment status, educational background, drug and alcohol history, medical and psychiatric history, and previous head injuries. They then completed the FSS, HADS and NART. After completing several attentional measures as a part of a larger study over approximately 10 min, participants then completed the VAS–F.
RESULTS
Differences Between TBI and Control Participants on Fatigue Measures
Items from the COF were categorized to create two subscales according to whether the activities primarily involved mental effort or physical effort. Items comprising the mental effort Causes of Fatigue subscale (COF–ME) included (1) watching television; (2) mental effort; (3) reading; (4) having a conversation in person; (5) concentrating; and (6) having a conversation over the telephone. Items comprising the physical effort Causes of Fatigue subscale (COF–PE) included (1) walking; (2) exercising; (3) physical effort; and (4) showering. Two items (shopping and participating in social activities) were excluded, as these items were not easily categorized as being primarily physical or cognitive in nature.
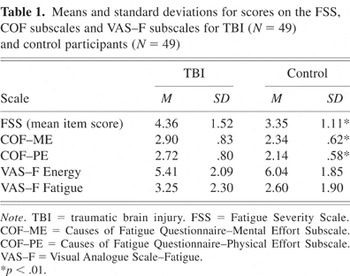
Mean scores on the three fatigue scales are shown in Table 1. A one-way between-groups MANOVA revealed an overall significant difference between TBI and control participants on subjective fatigue measures [F(5,92) = 4.78, p = .001]. When results for the FSS, VAS–F subscales and COF subscales were examined separately, scores on the FSS were found to reach the Bonferroni adjusted level of significance of .01, with TBI participants reporting significantly greater behavioral consequences and impact of fatigue on their lifestyle [F(1,96) = 13.81, p < .001]. TBI participants reported activities requiring mental effort and physical effort as significantly greater causes of fatigue on the COF–ME [F(1,96) = 14.53, p < .001], and COF–PE [F(1,96) = 16.99, p < .001], respectively. Scores on the VAS–F subscales were in the expected direction, but there were no significant differences between TBI and control participants on the vigor subscale [F(1,96) = 2.52, p = .12], or fatigue subscale [F(1,96) = 2.27, p = .14].
Means and standard deviations for scores on the FSS, COF subscales and VAS–F subscales for TBI (N = 49) and control participants (N = 49) %*p < .01.
Internal consistency and relationship between fatigue measures
The fatigue scales demonstrated good internal consistency. Cronbach's alpha for the FSS was .90 and item-total correlations ranged from .37 to .84. For the fatigue and vigor subscales of the VAS–F, Cronbach alpha co-efficients were .95 and .91, respectively, and item-total correlations ranged from .66 to .83 and .67 to .83, respectively. Reliability analysis indicated that the COF–ME and COF–PE subscales showed good internal consistency, with Cronbach's alpha values of .87 and .75, respectively. Item-total correlations ranged from .53 to .68 for the COF–ME subscale, and .26 to .75 for the COF–PE subscale.
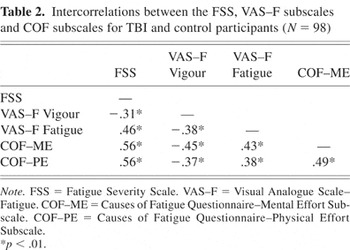
The relationships between the FSS, VAS–F subscales and COF subscales were examined using Pearson product-moment correlations. As shown in Table 2, these scales all correlated significantly with each other. Scores on the VAS–F vigor subscale were moderately correlated with scores on the VAS–F fatigue subscale, FSS and COF subscales, with lower vigor scores being associated with higher fatigue scores on all other scales. Moderate positive correlations were found between scores on the VAS–F fatigue subscale, and FSS scores and COF subscales. A moderate positive correlation was found between physical effort and mental effort subscales of the COF, and a strong positive correlation was found between the FSS and COF subscales.
Intercorrelations between the FSS, VAS–F subscales and COF subscales for TBI and control participants (N = 98) %*p < .01.
Predictors of fatigue severity following TBI
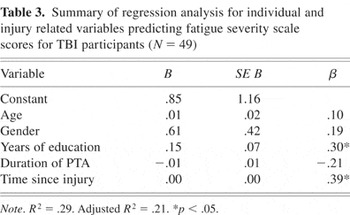
A multiple regression analysis was conducted to examine predictors of fatigue for TBI participants. FSS score was chosen as the dependent variable as it is a general measure of the impact of fatigue on lifestyle, and was sensitive to the fatigue experience following TBI. Age, sex, years of education and time since injury were entered as predictors. Duration of PTA was also entered as an index of severity of injury, with a growing number of studies suggesting it a stronger predictor of outcome than GCS (Cattelani et al., 2002; Doig et al., 2001; Fleming et al., 1999; Sherer et al., 2002; van der Naalt et al., 1999). R for the regression was significantly different from zero [F(5,41) = 3.39, p = .01]. As shown in Table 3, years of education and time since injury significantly contributed to the prediction of FSS scores, with higher years of education and greater time since injury being associated with higher reported fatigue on the FSS. In total, 29% (21% adjusted) of the variance in FSS scores was explained by the five variables. Injury severity, as indexed by PTA duration, was not a significant predictor of FSS scores. The same regression analysis was conducted with GCS scores (instead of PTA duration) as index of injury severity, and education level and time since injury remained as the only significant predictors of fatigue severity rating.
Summary of regression analysis for individual and injury related variables predicting fatigue severity scale scores for TBI participants (N = 49)

Depression and anxiety in relation to fatigue
Pearson product-moment correlations were calculated to examine relationships between anxiety and depression scores and fatigue measures for TBI participants (shown in Table 4). Higher depression scores were moderately associated with lower vigor scores on the VAS–F, and showed stronger associations with higher fatigue ratings on the VAS–F and COF–ME. FSS and COF–PE scores were not significantly correlated with depression scores. Higher anxiety scores were modestly associated with lower vigor ratings on the VAS–F and higher fatigue ratings on the FSS, COF–ME and COF–PE. Anxiety scores showed a strong positive association with fatigue ratings on the VAS–F.
Correlations between anxiety and depression scores, and FSS, VAS–F subscales and COF subscales for TBI participants (N = 49) %*p < .05. **p < .01.

Correlations were also calculated to examine the relationships between HADS depression and anxiety scores, and significant predictors of FSS scores in this TBI group, namely years of education and time since injury. There were no significant correlations between depression and years of education, and time since injury. Anxiety correlated significantly with time since injury (r = .36, p = .01) but not with years of education
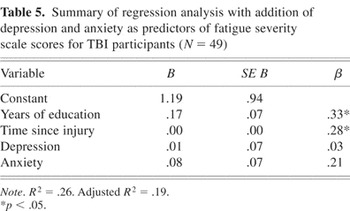
A second multiple regression analysis was conducted to examine whether emotional state was influencing the relationship between years of education and time since injury, and FSS scores. R for the regression was significantly different from zero [F(4,44) = 3.83, p < .01]. As shown in Table 5, years of education and time since injury remained significant predictors of FSS scores independent of depression and anxiety scores on the HADS. Depression and anxiety scores were not significant predictors of fatigue severity ratings in this group of TBI participants.
Summary of regression analysis with addition of depression and anxiety as predictors of fatigue severity scale scores for TBI participants (N = 49) %*p < .05.

Relationship between fatigue and employment
A two-way ANOVA was conducted to investigate the impact of involvement in employment or study in TBI and control participants on FSS scores. There was, however, no significant difference in fatigue scores between those involved in employment or study and those who were not [F(1,94) = .07, p = .84]. There was also no significant interaction of Group × Employment status [F(1,94) = .18, p = .67].
Medication use and fatigue
With respect to medication use, 50% of head injured patients were taking some form of medication at the time of testing, with 19.6% taking anti-depressant medication, 13% regularly taking analgesic medication, 15.2% anti-convulsant medication, 4.3% anti-inflammatory medication, 2.2% anti-spasmodic medication and 13% taking other forms of medication (e.g., herbal medicines). Point-biserial correlations revealed no significant correlation between scores on the FSS and medication use.
Orthopedic injuries and fatigue
In order to assess the impact of orthopedic injuries sustained at the time of injury on subjective fatigue levels at the time of testing, Pearson product-moment correlations were calculated between Bethesda Scale for Orthopedic Injury Classification scores and subjective fatigue scale scores. No significant correlations were found between orthopedic injury rating and FSS, VAS–F or COF–ME scores. However, level of orthopedic injury showed a small but significant positive correlation with COF–PE scores, with more severe orthopedic injuries being associated with the reporting of activities requiring physical effort as frequent causes of fatigue, r = .29, p = .05.
DISCUSSION
The results of this study indicate that TBI participants experience greater behavioral consequences and impact of fatigue on their daily functioning, as assessed by the FSS, in comparison with non-injured controls. TBI participants also reported activities involving physical and mental effort as more frequent causes of fatigue relative to controls on the COF, indicating that fatigue is an important factor for therapists to consider in assisting patients' return to such activities. In contrast to the findings of LaChapelle and Finlayson (1998), who reported significantly lower scores on the VAS–F vigor subscale in their sample of brain injured patients of mixed etiology, no statistically significant differences were found between TBI and control participants on either subscale of the VAS–F.
Findings suggest that the FSS is sensitive to fatigue following TBI, however, raise doubts as to the sensitivity of the VAS–F as a tool for assessing the fatigue experience in TBI patients on a single occasion. The VAS–F measures a different aspect of fatigue from the FSS, as supported by the absence of a strong correlation between these two measures. While the FSS measures the behavioral consequences and impact of fatigue on daily functioning, the VAS–F measures fatigue levels at a single point in time. Ratings on such a scale are likely to be affected by the frame of reference of the rater, with current fatigue levels being rated relative to typical fatigue levels experienced by the participant. TBI participants are likely to have been comparing their fatigue levels with those at other times of the day rather than with their pre-injury state, and this may have minimized the likelihood of significant differences relative to controls. The VAS–F may be a more useful instrument in assessing change in fatigue over time, as suggested by research showing significant changes in VAS–F scores in a group of MS patients undergoing medical treatment for management of fatigue (Rammohan et al., 2002).
With respect to the reliability and validity of the fatigue scales, the results indicate that the FSS, VAS–F subscales and COF subscales have good internal consistency. The high correlation between the FSS and COF subscales is suggestive of a strong relationship between the functional impact of fatigue on daily activities and the frequency with which activities are reported to cause fatigue.
Time since injury was found to be a significant predictor of fatigue severity independent of the effects of mood, with the greater the time after injury the greater the reported impact of fatigue on lifestyle. This may result from patients becoming more engaged in pre-injury activities with increasing time post injury or increased awareness of changes caused by injury with greater time post injury. Increasing insight could be associated with higher levels of emotional distress, which may further contribute to fatigue. This was supported by the findings of significant positive correlation between anxiety and time since injury, and significant positive correlation between anxiety and subjective fatigue.
Consistent with findings in the general population, years of education was also found to be a significant predictor of fatigue severity, with higher levels of education being associated with greater self-reported fatigue. This relationship was independent of emotional state. One can only speculate as to the reasons for this association, but it is possible that individuals with higher education had more demanding pre-injury occupations and placed greater demands or had greater expectations of themselves following their injury. This is supported by findings showing that higher education is a significant predictor of productivity status post-injury (Keyser-Marcus et al., 2002; Sherer et al., 2002, 2003). However, this was not supported by the absence of significant differences in subjective fatigue ratings between those who are employed and unemployed.
Of interest, age, gender and severity of injury (as measured by duration of PTA and GCS score) were not found to be significant predictors of fatigue in this group of TBI patients. More severe orthopedic injuries were modestly associated with activities requiring physical effort being more frequent causes of fatigue, possibly because of greater physical effort expended in completing such tasks in the presence of injury, or because of ongoing pain associated with more severe injuries. Severity of orthopedic injuries was not related to other subjective fatigue ratings, suggesting orthopedic injury is not the primary cause of fatigue in this population.
Findings indicate a complex relationship between depression and fatigue following TBI. Higher depression scores on the HADS showed moderate to strong relationships with subjective fatigue and vigor experienced at time of testing on the VAS–F, and the reporting of activities requiring mental effort as more frequent causes of fatigue on the COF–ME. However, depression was not related to the impact of fatigue on lifestyle on the FSS or the reporting of activities requiring physical effort as causes of fatigue on the COF–PE. It is unclear as to why this dissociation was evident, but the absence of relationship between depression and some fatigue scales suggests that depressed patients are not simply affirming all symptoms. Furthermore, the absence of a significant correlation between FSS and depression scores confirms that the FSS is measuring a distinct phenomenon (i.e., not depression). Levels of anxiety showed modest to strong associations with all subjective fatigue measures.
This study has demonstrated a significant relationship between fatigue and numerous factors following TBI, however, other lifestyle factors that were beyond the scope of this study require consideration as possible predictors of fatigue. These include time spent engaged in employment or study or completing household tasks. These factors will be considered further in a follow-up study of this same group of TBI participants when a larger proportion have returned to employment. Future research should also address the issue of awareness of impairment and its impact on the findings of greater reports of fatigue with increasing time following injury. It would also be of interest to examine the relationship between pain and fatigue following TBI, and the impact of pain on the relationship between severity of orthopedic injury and fatigue resulting from physical activities. The relationship between sleep disturbance and fatigue following TBI also requires further investigation.
This study has shed light on a measure of fatigue that is sensitive to fatigue experienced by patients with TBI and identified types of activities which TBI participants report as more frequent causes of fatigue. This study has also highlighted that greater time since injury and higher education levels are associated with higher levels of self-reported fatigue following TBI. Given the higher self-reported fatigue levels in the population and the wide range of activities that patients reported as more frequent causes of fatigue, the question remains as to the underlying causes of fatigue following TBI. It has been well established that TBI results in a range of cognitive changes, including impairments of attention, speed of information processing, memory and executive function (Ponsford, 1995). Such changes may potentially render the performance of everyday tasks more effortful, leading to greater fatigue (van Zomeren et al., 1984). These factors are explored further in a study examining the relationship between fatigue and attention following TBI.
ACKNOWLEDGMENTS
We wish to thank Dr Simon Moss for his advice on statistical methods, and members of the psychology and research departments at Epworth Rehabilitation Centre for their assistance in recruiting head injured participants. We are also grateful to Bridget Hill (Physiotherapist, Epworth Rehabilitation Centre) for rating TBI participants' orthopedic injuries.
References
REFERENCES
Aaronson, L.S.,
Pallikkathayil, L., &
Crighton, F.
(2003).
A qualitative investigation of fatigue among healthy working
adults.
Western Journal of Nursing Research,
25,
419–433.CrossRefGoogle Scholar
Aaronson, L.S.,
Teel, C.S.,
Cassmeyer, V.,
Neuberger, G.B.,
Pallikkathayil, L.,
Pierce, J.,
Press, A.N.,
Williams, P.D., &
Wingate, A.
(1999).
Defining and measuring fatigue.
Image–The Journal of Nursing Scholarship,
31,
45–50.CrossRefGoogle Scholar
American Psychiatric Association.
(1994).
Diagnostic and statistical manual of mental disorders
(4th ed.).
Washington, DC:
American Psychiatric Association.
Beenen, L.F.M.,
Lindeboom, J.,
Kasteleijn-Nolst Trenite, D.G.A.,
Heimans, J.J.,
Snoek, F.J.,
Touw, D.J.,
Ader, H.J., &
van Alphen, H.A.M.
(1999).
Comparative double blind clinical trial of phenytoin and sodium
valproate as anticonvulsant prophylaxis after craniotomy: Efficacy,
tolerability and cognitive effects.
Journal of Neurology, Neurosurgery & Psychiatry,
67,
474–480.CrossRefGoogle Scholar
Belza, B.L.,
Henke, C.J.,
Yelin, E.H.,
Epstein, W.V., &
Gillis, C.L.
(1993).
Correlates of fatigue in older adults with rheumatoid
arthritis.
Nursing Research,
42,
93–99.Google Scholar
Bensing, J.M.,
Hulsman, R.L., &
Schreurs, K.M.G.
(1999).
Gender differences in fatigue: Biopsychosocial factors relation to
fatigue in men and women.
Medical Care,
37,
1078–1083.CrossRefGoogle Scholar
Bruce, I.N.,
Hallett, D.C.,
Gladman, D.D.,
Urowitz, M.B., &
Mak, V.C.
(1999).
Factors associated with fatigue in patients with systemic lupus
erythematosus.
Annals of the Rheumatic Disease,
58,
379–381.CrossRefGoogle Scholar
Caci, H.,
Bayle, F.J.,
Mattei, V.,
Dossios, C.,
Robert, P., &
Boyer, P.
(2003).
How does the hospital and anxiety and depression scale measure
anxiety and depression in healthy subjects?
Psychiatry Research,
118,
89–99.Google Scholar
Cattelani, R.,
Tanzi, F.,
Lombardi, F., &
Mazzucchi, A.
(2002).
Competitive re-employment after severe traumatic brain injury:
Clinical, cognitive and behaviour predictor variables.
Brain Injury,
16,
51–64.CrossRefGoogle Scholar
Chalder, T.,
Berelowitz, G.,
Pawlikowska, T., &
Watts, L.
(1993).
Development of a fatigue scale.
Journal of Psychosomatic Research,
37,
147–153.CrossRefGoogle Scholar
Cooke, K.M.,
Kreydatus, M.A.,
Atherton, A., &
Thoman, E.B.
(1998).
The effects of evening light exposure on the sleep of elderly women
expressing sleep complaints.
Journal of Behavioral Medicine,
21,
103–114.CrossRefGoogle Scholar
DeVries, J.,
Michielsen, H.J., &
Van Heck, G.L.
(2003).
Assessment of fatigue among working people: A comparison of six
questionnaires.
Occupational and Environmental Medicine,
60(Suppl. 1),
i10–i15.CrossRefGoogle Scholar
Dikmen, S.,
Machamer, J., &
Temkin, N.
(1993).
Psychological outcome in patients with moderate to severe brain
injury.
Brain Injury,
7,
113–124.CrossRefGoogle Scholar
Doig, E.,
Fleming, J., &
Tooth, L.
(2001).
Patterns of community integration 2–5 years post-discharge
from brain injury rehabilitation.
Brain Injury,
15,
747–762.CrossRefGoogle Scholar
Ettinger, A.B.,
Weisbrot, D.M.,
Krupp, L.B.,
Coyle, P.K.,
Jandorf, L., &
Devinsky, O.
(1998).
Fatigue and depression in epilepsy.
Journal of Epilepsy,
11,
105–109.CrossRefGoogle Scholar
Evans, R.W.
(1992).
The post-concussion syndrome and sequelae of mild head
injury.
Neurologica Clinics,
10,
815–847.CrossRefGoogle Scholar
Ferrell, B.R.,
Grant, M.,
Dean, G.E.,
Funk, B., &
Ly, J.
(1996).
“Bone tired”: The experience of fatigue and its impact
on quality of life.
Oncology Nursing Forum,
23,
1539–1547.Google Scholar
Fishbain, D.A.,
Cole, B.,
Cutler, R.B.,
Lewis, J.,
Rosomoff, H.L., &
Steele Rosomoff, R.
(2003).
Is pain fatiguing? A structured evidence-based review.
Pain Medicine,
4,
51–62.CrossRefGoogle Scholar
Fisk, J.D.,
Ritvo, R.G.,
Ross, L.,
Haase, D.A.,
Mattie, T.J., &
Schlech, W.F.
(1994).
Measuring the functional impact of fatigue: Initial validation of
the fatigue impact scale.
Clinical Infectious Diseases,
18(Suppl. 1),
S79–S83.CrossRefGoogle Scholar
Fleming, J.,
Tooth, L.,
Hassell, M., &
Chan, W.
(1999).
Prediction of community integration and vocational outcome 2–5
years after traumatic brain injury rehabilitation in Australia.
Brain Injury,
6,
417–431.Google Scholar
Fuhrer, R. &
Wessely, S.
(1995).
The epidemiology of fatigue and depression: A French primary-care
study.
Psychological Medicine,
25,
895–905.CrossRefGoogle Scholar
Gaudino, E.A.,
Coyle, P.K., &
Krupp, L.B.
(1997).
Post-lyme syndrome and chronic fatigue syndrome.
Archives of Neurology,
54,
1372–1376.CrossRefGoogle Scholar
Gibson, J. &
Edwards, R.H.
(1985).
Muscular exercise and fatigue.
Sports Medicine,
2,
120–132.CrossRefGoogle Scholar
Hann, D.M.,
Jacobsen, P.B.,
Azzarello, L.M.,
Martin, S.C.,
Curran, S.L.,
Fields, K.K.,
Greenberg, H., &
Lyman, G.
(1998).
Measurement of fatigue in cancer patients: Development and
validation of the fatigue symptom inventory.
Quality of Life Research,
7,
301–310.CrossRefGoogle Scholar
Harter, M.,
Reuter, K.,
Gross-Hardt, K., &
Bengel, J.
(2001).
Screening for anxiety, depressive and somatoform disorders in
rehabilitation. Validity of HADS and GHQ-12 in patients with
musculoskeletal disease.
Disability and Rehabilitation,
23,
737–744.Google Scholar
Hayashi, M.,
Watanabe, M., &
Hori, T.
(1999).
The effects of a 20 min nap in the mid-afternoon on mood,
performance and EEG activity.
Clinical Neurophysiology,
110,
272–279.CrossRefGoogle Scholar
Hellawell, D.J.,
Taylor, R.T., &
Pentland, B.
(1999).
Cognitive and psychosocial outcome following moderate or severe
traumatic brain injury.
Brain Injury,
13,
489–504.CrossRefGoogle Scholar
Herlofson, K. &
Larsen, J.P.
(2002).
Measuring fatigue in patients with Parkinson's
disease—the fatigue severity scale.
European Journal of Neurology,
9,
595–600.CrossRefGoogle Scholar
Hibbard, M.R.,
Uysal, S.,
Kepler, K.,
Bogdany, J., &
Silver, J.
(1998).
Axis I psychopathology in individuals with traumatic brain
injury.
Journal of Head Trauma Rehabilitation,
13,
24–39.CrossRefGoogle Scholar
Hill, B.,
Ponsford, J.,
Hart, P., &
Sanders, R.
(2001, August).
Factors influencing outcome following orthopaedic trauma.
Paper presented at the Innovations in Rehabilitation Conference,
Melbourne, Australia.
Jones, R.K.
(1974).
Assessment of minimal head injuries: Indications for in-hospital
care.
Surgical Neurology,
2,
101–104.Google Scholar
Keyser-Marcus, L.A.,
Bricout, J.C.,
Wehman, P.,
Campbell, L.R.,
Cifu, D.X.,
Englander, J.,
High, W., &
Zafonte, R.D.
(2002).
Acute predictors of return to employment after traumatic brain
injury: A longitudinal follow-up.
Archives of Physical Medicine and Rehabilitation,
83,
635–641.CrossRefGoogle Scholar
Kreutzer, J.S.,
Seel, R.T., &
Gourley, E.
(2001).
The prevalence and symptom rates of depression after traumatic brain
injury: A comprehensive examination.
Brain Injury,
15,
563–576.CrossRefGoogle Scholar
Krupp, L.B.,
Coyle, P.K.,
Doscher, C.,
Miller, A.,
Cross, A.H.,
Jandorf, L.,
Halper, J.,
Johnson, B.,
Morgante, L., &
Grimson, R.
(1995).
Fatigue therapy in multiple sclerosis.
Neurology,
45,
1956–1961.CrossRefGoogle Scholar
Krupp, L.B.,
LaRocca, N.G.,
Muir-Nash, J., &
Steinberg, A.D.
(1989).
The fatigue severity scale: Application to patients with multiple
sclerosis and systemic lupus erythematosus.
Archives of Neurology,
46,
1121–1123.CrossRefGoogle Scholar
LaChapelle, D.L. &
Finlayson, M.A.J.
(1998).
An evaluation of subjective and objective measures of fatigue in
patients with brain injury and healthy controls.
Brain Injury,
12,
649–659.CrossRefGoogle Scholar
Lavidor, M.,
Weller, A., &
Babkoff, H.
(2003).
How sleep is related to fatigue.
British Journal of Health Psychology,
8,
95–105.CrossRefGoogle Scholar
Lee, K.A.,
Hicks, G., &
Nino-Murcia, G.
(1991).
Validity and reliability of a scale to assess fatigue.
Psychiatry Research,
36,
291–298.CrossRefGoogle Scholar
Lewis, G. &
Wessely, S.
(1992).
The epidemiology of fatigue: More questions than answers.
Journal of Epidemiology and Community Health,
46,
92–97.CrossRefGoogle Scholar
Lichstein, K.L.,
Means, M.K.,
Noe, S.L., &
Aguillard, R.N.
(1997).
Fatigue and sleep disorders.
Behavioural Research and Therapy,
35,
733–740.CrossRefGoogle Scholar
Masson, F.,
Maurette, P.,
Salmi, L.R.,
Dartigues, J.F.,
Vecsey, J.,
Destaillats, J.M., &
Erny, P.
(1996).
Prevalence of impairments 5 years after a head injury, and their
relationship with disabilities and outcome.
Brain Injury,
10,
487–497.CrossRefGoogle Scholar
McNair, D.M.,
Lorr, M., &
Droppleman, L.F.
(1981).
Edits manual: Profile of mood states.
San Diego, CA:
Educational and Industrial Testing Service.
Meek, P.M.,
Nail, L.M.,
Barsevick, A.,
Schwartz, A.L.,
Stephen, S.,
Whitmer, K.,
Beck, S.L.,
Jones, L.S., &
Walker, B.L.
(2000).
Psychometric testing of fatigue instruments for use with cancer
patients.
Nursing Research,
49,
181–190.CrossRefGoogle Scholar
Mendoza, T.,
Wang, X.,
Cleeland, C.,
Morrissey, M.,
Johnson, B., &
Wendt, J.
(1999).
The rapid assessment of fatigue severity in cancer patients: Use of
a brief fatigue inventory.
Cancer,
85,
1186–1196.3.0.CO;2-N>CrossRefGoogle Scholar
Middleboe, T.,
Anderson, H.H.,
Birket-Smith, M., &
Friis, M.L.
(1992).
Minor head injury: Impact on general health after 1 year: A
prospective follow-up study.
Acta Neurologica Scandinavica,
85,
5–9.CrossRefGoogle Scholar
MIMS Australia.
(2004).
2004 MIMS annual.
Sydney:
MIMS Australia.
Morriss, R.K.,
Wearden, A.J., &
Battersby, L.
(1997).
The relation of sleep difficulties to fatigue, mood and disability
in chronic fatigue syndrome.
Journal of Psychosomatic Research,
42,
597–605.CrossRefGoogle Scholar
Nelson, H.E. &
Willison, J.
(1991).
The national adult reading test (NART): Test manual
(2nd ed.).
Windsor:
NFER–Nelson.
Olver, J.H.,
Ponsford, J.L., &
Curran, C.
(1996).
Outcomes following traumatic brain injury: A comparison between 2
and 5 years after injury.
Brain Injury,
10,
841–848.CrossRefGoogle Scholar
Pawlikowska, T.,
Chalder, T.,
Hirsch, S.R.,
Wallace, P.,
Wright, D.J.M., &
Wessely, S.C.
(1994).
Population based study of fatigue and psychological distress.
British Medical Journal,
308,
763–766.CrossRefGoogle Scholar
Piper, B.F.
(1989).
Fatigue: Current bases for practice. In
S.G. Funk,
E.M. Torniquist,
M.T. Champagne,
L.A. Copp, &
R. Wiese (Eds.),
Key aspects of comfort (pp.
197–198).
New York:
Springer.
Piper, B.F.,
Lindsay, A.M.,
Dodd, M.J.,
Ferketich, S.,
Paul, S.M., &
Weller, S.
(1989).
The development of an instrument to measure the subjective
dimensions of fatigue. In
S.G. Funk,
E.M. Torniquist,
M.T. Champagne,
L.A. Copp, &
R. Wiese (Eds.),
Key aspects of comfort (pp.
199–209).
New York:
Springer.
Pollina, D.,
Kaufman, L.D.,
Masur, D.M., &
Krupp, L.B.
(1998).
Pain, fatigue, and sleep in eosinophilia–myalgia syndrome:
Relationship to neuropsychological performance.
Journal of Neuropsychiatry and Clinical Neurosciences,
10,
338–342.CrossRefGoogle Scholar
Ponsford, J.,
Olver, J.H., &
Curran, C.
(1995).
A profile of outcome: 2 years after traumatic brain injury.
Brain Injury,
9,
1–10.CrossRefGoogle Scholar
Ponsford, J.L.
(1995).
Mechanisms, recovery and sequelae of traumatic brain injury: A
foundation for the REAL approach. In
J.L. Ponsford (Ed.),
Traumatic brain injury: Rehabilitation for everyday adaptive
living (pp.
1–31).
Hove, UK:
Psychology Press Ltd.
Rammohan, K.W.,
Rosenberg, J.H.,
Lynn, D.J.,
Blumenfeld, A.M.,
Pollak, C.P., &
Nagaraja, H.N.
(2002).
Efficacy and safety of modafinil (Provigil) for the treatment of
fatigue in multiple sclerosis: A two centre phase 2 study. Journal of
Neurology,
Neurosurgery & Psychiatry,
72,
179–183.CrossRefGoogle Scholar
Ream, E.K. &
Richardson, A.
(1996).
Fatigue: A concept analysis.
International Journal of Nursing Studies,
33,
519–529.CrossRefGoogle Scholar
Reyes-Gibby, C.C.,
Mendoza, T.R.,
Wang, X.S.,
Anderson, K.O., &
Cleeland, C.S.
(2003).
Pain and fatigue in community-dwelling adults.
Pain Medicine,
4,
231–237.CrossRefGoogle Scholar
Ridsdale, L.,
Evans, A.,
Jerrett, W.,
Mandalia, S.,
Osler, K., &
Vora, H.
(1993).
Patients with fatigue in general practice: A prospective
study.
British Medical Journal,
307,
103–106.CrossRefGoogle Scholar
Salinsky, M.,
Oken, B., &
Binder, L.
(1996).
Assessment of drowsiness in epilepsy patients receiving chronic
antiepileptic drug therapy.
Epilepsia,
37,
181–187.CrossRefGoogle Scholar
Schwartz, J.E.,
Jandorf, L., &
Krupp, L.B.
(1993).
The measurement of fatigue: A new instrument.
Journal of Psychosomatic Research,
37,
753–762.CrossRefGoogle Scholar
Schwartz, T.L.,
Azhar, N.,
Cole, K.,
Hopkins, G.,
Nihalani, N.,
Simionescu, M.,
Husain, J., &
Jones, N.
(2004).
An open-label study of adjunctive modafinil in patients with
sedation related to serotonergic antidepressant therapy.
Journal of Clinical Psychiatry,
65,
1223–1227.CrossRefGoogle Scholar
Schwarz, R.,
Krauss, O., &
Hinz, A.
(2003).
Fatigue in the general population.
Onkologie,
26,
140–144.CrossRefGoogle Scholar
Seel, R.T.,
Kreutzer, J.S.,
Rosenthal, M.,
Hammond, M.,
Corrigan, J.D., &
Black, K.
(2003).
Depression after traumatic brain injury: A national institute of
disability and rehabilitation research model systems multicenter
investigation.
Archives of Physical Medicine and Rehabilitation,
84,
177–184.CrossRefGoogle Scholar
Sherer, M.,
Nick, T.G.,
Sander, A.M.,
Hart, T.,
Hanks, R.,
Rosenthal, M.,
High, W.M., &
Yablon, S.A.
(2003).
Race and productivity outcome after traumatic brain injury:
Influence of confounding factors.
Journal of Head Trauma Rehabilitation,
18,
408–424.CrossRefGoogle Scholar
Sherer, M.,
Sander, A.M.,
Nick, T.G.,
High, W.M.,
Malec, J.F., &
Rosenthal, M.
(2002).
Early cognitive status and productivity outcome after traumatic
brain injury: Findings from the TBI model.
Archives of physical medicine and rehabilitation,
83,
183–192.CrossRefGoogle Scholar
Shores, E.A.,
Marosszeky, J.E.,
Sandanam, J., &
Batchelor, J.
(1986).
Preliminary validation of a scale for measuring the duration of
post-traumatic amnesia.
Medical Journal of Australia,
144,
569–572.Google Scholar
Smets, E.M.,
Garssen, B.,
Bonke, B., &
de Haes, J.C.
(1995).
The multidimensional fatigue inventory (MFI): Psychometric qualities
of an instrument to assess fatigue.
Journal of Psychosomatic Research,
39,
315–325.CrossRefGoogle Scholar
Smets, E.M.,
Garssen, B.,
Schuster-Uitterhoeve, A.L.J., &
deHaes, J.C.J.M.
(1993).
Fatigue in cancer patients.
British Journal of Cancer,
68,
220–224.CrossRefGoogle Scholar
Snaith, R.P. &
Zigmond, A.S.
(1994).
The Hospital Anxiety and Depression Scale with the Irritability
Depression-Anxiety Scale and the Leeds Situational Anxiety Scale:
Manual.
Windsor, UK:
NFER-Nelson.
Spigset, O.
(1999).
Adverse reactions of selective serotonin reuptake inhibitors:
Reports from a spontaneous reporting system.
Drug Safety,
20,
277–287.CrossRefGoogle Scholar
Stuss, D.T.,
Stethem, L.L.,
Hugenholtz, H.,
Picton, T.,
Pivik, J., &
Richard, M.T.
(1989).
Reaction time after head injury: Fatigue, divided attention and
focused attention, and consistency of performance.
Journal of Neurology, Neurosurgery & Psychiatry,
52,
742–748.CrossRefGoogle Scholar
Tench, C.M.,
McCarthy, J.,
McCurdie, I.,
White, P.D., &
D'Cruz, D.P.
(2003).
Fatigue in systemic lupus erythematosus: A randomized controlled
trial of exercise.
Rheumatology,
42,
1050–1054.CrossRefGoogle Scholar
Tench, C.M.,
McCurdie, I.,
White, P.D., &
D'Cruz, D.P.
(2000).
The prevalence and associations of fatigue in systemic lupus
erythematosus.
Rheumatology,
39,
1249–1254.CrossRefGoogle Scholar
van der Naalt, J.,
van Zomeren, A.H.,
Sluiter, W.J., &
Minderhoud, J.M.
(1999).
One year outcome in mild to moderate head injury: The predictive
value of acute injury characteristics related to work complaints and
return to work.
Journal of Neurology, Neurosurgery & Psychiatry,
66,
207–213.CrossRefGoogle Scholar
van Zomeren, A.H.,
Brouwer, W.H., &
Deelman, B.G.
(1984).
Attentional deficits: The riddles of selectivity, speed and
alertness. In
D. Brooks (Ed.),
Closed head injury: Psychological, social and family
consequences (pp.
74–107).
Oxford, UK:
Oxford University Press.
van Zomeren, A.H. &
van den Burg, W.
(1985).
Residual complaints of patients two years after severe head
injury.
Journal of Neurology, Neurosurgery & Psychiatry,
48,
21–28.CrossRefGoogle Scholar
Vitaz, T.W.,
Jenks, J.,
Raque, G.H., &
Shields, C.B.
(2003).
Outcome following moderate traumatic brain injury.
Surgical Neurology,
60,
285–291.CrossRefGoogle Scholar
Wade, A.,
Crawford, G.M.,
Angus, M.,
Wilson, R., &
Hamilton, L.
(2003).
A randomized, double-blind, 24-week study comparing the efficacy and
tolerability of mirtazapine and paroxetine in depressed patients in
primary care.
International Clinical Psychopharmacology,
18,
133–141.Google Scholar
Walker, G.C.,
Cardenas, D.D.,
Guthrie, M.R.,
McLean, A., &
Brooke, M.M.
(1991).
Fatigue and depression in brain injured patients correlated with
quadriceps strength and endurance.
Archives of Physical Medicine and Rehabilitation,
72,
469–472.Google Scholar
Wessely, S.,
Chalder, T.,
Hirsch, S.R.,
Pawlikowska, T.,
Wallace, P., &
Wright, D.J.M.
(1995).
Postinfectious fatigue: Prospective cohort study in primary
care.
Lancet,
345,
1333–1338.CrossRefGoogle Scholar
Winstead-Fry, P.
(1998).
Psychometric assessment of four fatigue scales with a sample of
rural cancer patients.
Journal of Nursing Measurement,
6,
111–122.Google Scholar

Means and standard deviations for scores on the FSS, COF subscales and VAS–F subscales for TBI (N = 49) and control participants (N = 49) %*p < .01.
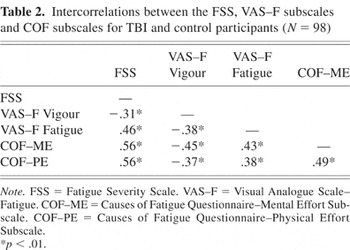
Intercorrelations between the FSS, VAS–F subscales and COF subscales for TBI and control participants (N = 98) %*p < .01.
Summary of regression analysis for individual and injury related variables predicting fatigue severity scale scores for TBI participants (N = 49)

Correlations between anxiety and depression scores, and FSS, VAS–F subscales and COF subscales for TBI participants (N = 49) %*p < .05. **p < .01.
Summary of regression analysis with addition of depression and anxiety as predictors of fatigue severity scale scores for TBI participants (N = 49) %*p < .05.
 You have
Access
- 116
- Cited by