Introduction
Potato plants are generally considered to be drought-sensitive (Weisz et al. Reference Weisz, Kaminski and Smilowitz1994) and to have inefficient phosphorus (P) uptake due to sparse root hairs and relatively shallow root systems (Yamaguchi Reference Yamaguchi2002). Maximum potato yield can only be achieved when sufficient P and water are supplied through fertilization and irrigation (Balemi Reference Balemi2009). Freeman et al. (Reference Freeman, Franz and De Jong1998) estimated that a critical Olsen P (Olsen et al. Reference Olsen, Cole, Watanabe and Dean1954) concentration of 46 mg/kg is needed to achieve 90% of maximum potato yield (cv. Russet Burbank) on Ferrosols. However, since both water and P fertilizer for plant production is often limited, sustainable methods of enhancing plant water and nutrient uptake are needed to safeguard crop productivity (White et al. Reference White, Broadley, Hammond and Thompson2005).
Deficit irrigation (DI) and partial root-zone drying irrigation (PRD) are two water-saving irrigation regimes that have been shown to increase the agronomic water use efficiency (WUE) of crops, including potatoes (Davies et al. Reference Davies, Wilkinson and Loveys2002; Ahmadi et al. Reference Ahmadi, Andersen, Plauborg, Poulsen, Jensen, Sepaskhah and Hansen2010), but even the mild water stress induced by these methods may reduce crop yield (Liu et al. Reference Liu, Shahnazari, Andersen, Jacobsen and Jensen2006). Under DI, the entire root zone of the plant is irrigated with less water than required for potential evapotranspiration (English et al. Reference English, Musick, Murty, Hoffman, Howell and Solomon1990). Partial root-zone drying irrigation is a further development of DI (Dry et al. Reference Dry, Loveys, Botting, During, Stockley, Sas, Johnstone and Lee1996) where plants receive the same quantity of water as with DI but only half of the root system is irrigated, leaving the other half to dry to a pre-determined level before shifting irrigation to the dry side (Davies & Hartung Reference Davies, Hartung, Fischer, Turner, Angus, McIntyre, Robertson, Borrell and Lloyd2004). At low soil moisture levels, not only water but also P and nitrogen (N) uptake may be severely constrained (Gahoonia et al. Reference Gahoonia, Raza and Nielsen1994). Plant P uptake is relatively inefficient due to the high reactivity of P in soil, where it tends to bind to soil constituents (Frossard et al. Reference Frossard, Condron, Oberson, Sinaj and Fardeau2000; Park et al. Reference Park, Singvilay, Shin, Kim, Chung and Sa2004). Movement of P in soil is, therefore, mainly by diffusion from soil particles to roots and is thus very slow (Schachtman et al. Reference Schachtman, Reid and Ayling1998), which affects potato plants because of their relatively limited root system. When the soil is dry, reductions can therefore be expected in the transport of N and especially P to roots. Deficit irrigation and PRD regimes may therefore lead to reductions in P and N uptake. For potato plants, Liu et al. (Reference Liu, Rubæk, Liu and Andersen2015a ) and Sun et al. (Reference Sun, Cui and Liu2015) showed that P uptake and growth are limited by both DI and PRD and low P fertilization compared with full irrigation (FI) with high P fertilization. When comparing the P uptake between DI and PRD there were no differences, but plant N uptake was higher with PRD than with DI (Wang et al. Reference Wang, Liu, Jensen, De Neergaard and Jensen2013; Liu et al. Reference Liu, Rubæk, Liu and Andersen2015a ).
To sustain crop yield under limited P and water supply, an effective rooting system is essential for plants to take up nutrients and water (Fohse et al. Reference Fohse, Claassen and Jungk1988). The symbiosis of plant roots with arbuscular mycorrhizal fungi (AMF) is one of the most ancient and widespread strategies to increase plant tolerance to environmental stress such as drought and P limitation (Brachmann & Parniske Reference Brachmann and Parniske2006). Exploiting AMF symbiosis in the DI and PRD irrigation strategies may boost P and N uptake and improve plant growth. The mycorrhizosphere formed by roots and AMF mycelium in soil effectively increases water and nutrient uptake because of its larger expanse (Smith & Smith Reference Smith and Smith2012). By AMF root colonization, the small diameter of hyphae (20–50 µm) allows access to soil pores that cannot be explored by roots and extends more than 100 mm from the root surface into the soil (Jakobsen et al. Reference Jakobsen, Abbott and Robson1992), which is a hundred times further than most root hairs. The best-known effect of AMF on plants is the improved P uptake and reduction of P fertilization requirement (by at least 25%) without any decrease in crop yield (Ceballos et al. Reference Ceballos, Ruiz, Fernandez, Pena, Rodriguez and Sanders2013). However, in higher plants and crops, N is often the most growth-limiting factor. More recent studies also elaborate that AMF are able to absorb and transfer N to host plants (Hodge & Storer Reference Hodge and Storer2015). Moreover, AMF can maintain and even improve host photosynthetic capacity (Auge Reference Auge2001; Birhane et al. Reference Birhane, Sterck, Fetene, Bongers and Kuyper2012). Arbuscular mycorrhizal fungi can further improve the regulation of abscisic acid (ABA) levels (Aroca et al. Reference Aroca, Vernieri and Ruiz-Lozano2008) and help maintain turgor pressure (Ruiz-Lozano & Azcon Reference Ruiz-Lozano and Azcon1995), consequently enhancing drought resistance (Birhane et al. Reference Birhane, Sterck, Fetene, Bongers and Kuyper2012). The beneficial effect of AMF on the growth of potato plants has been reported both in greenhouse (McArthur & Knowles Reference McArthur and Knowles1993a ; Davies et al. Reference Davies, Calderon and Huaman2005) and field studies (Black & Tinker Reference Black and Tinker1977; Douds et al. Reference Douds, Nagahashi, Reider and Hepperly2007; Hijri Reference Hijri2016). In addition, Neumann et al. (Reference Neumann, Schmid, Romheld and George2009) found that PRD (which in that study did not alternate dry-rewet sides), decreased the growth and P uptake of sweet potato to the same extent as DI. However, when the PRD included AMF inoculation, plants achieved higher growth and P uptake than with DI or FI. Nevertheless, gaps remain in knowledge about the effects of AMF on potato plants, especially their interaction with different irrigation methods and P fertilization levels.
The objective of the current study was to examine the influence of AMF on the growth of potato plants under the combined challenge of limited water and P resources. The WUE, P and N uptake and growth of potato plants as affected by AMF symbiosis were investigated with plants subjected to FI, DI and PRD regimes and grown with (P1) or without (P0) P fertilization. Arbuscular mycorrhizal fungi root colonization was evaluated and soil water-soluble P and acid phosphomonoesterase analysed to elucidate their possible connection with plant P nutrition and growth. Since functional diversity exists in AMF symbiosis with different combinations of plants and AMF species (Feddermann et al. Reference Feddermann, Finlay, Boller and Elfstrand2010), and since potato plants usually have modest AMF root colonization compared with other crops (Tarkalson et al. Reference Tarkalson, Jolley, Robbins and Terry1998), two AMF species were introduced to test for differences in plant tolerance to P and drought stress depending on the AMF species used. Rhizophagus irregularis is ubiquitous in the natural environment and it is reported to be a preferential colonizer of potato plants in agricultural systems in Italy (Cesaro et al. Reference Cesaro, van Tuinen, Copetta, Chatagnier, Berta, Gianinazzi and Lingua2008), while Glomus proliferum as described by (Declerck et al. Reference Declerck, Cranenbrouck, Dalpé, Séguin, Grandmougin-Ferjani, Fontaine and Sancholle2000) is rarely studied in potato research.
Materials and methods
Experimental procedures and design
A pot experiment was conducted from August to the middle of October 2013 in a climate-controlled greenhouse at Aarhus University, Research Centre Foulum, Denmark (56°29′N, 9°34′E, 52 m a.s.l.). The experiment had 18 treatments consisting of a combination of the three factors: two P fertilization levels (P0 and P1), three irrigation methods (FI, PRD and DI) and three inoculation treatments (M1+: R. irregularis, M2+: G. proliferum and M− control). Four replicate pots for each treatment were arranged in a randomized complete block design.
The cylindrical pots had a volume of 10 l (160 mm outer diameter, 500 mm high) and were divided into two equal vertical compartments by a plastic sheet. Thus, water exchange between the two compartments was prevented. A 50 mm wide and 100 mm high piece was cut out from the top centre of the plastic sheets for planting of the seed tubers. The bottom of the pots was covered by a 1.5 mm nylon mesh. Pots were pre-sterilized by washing with soapy water, rinsing with plain water, immersing into 20 g/l sodium hypochlorite for 3 min and rinsing thoroughly with tap water.
A sandy loam soil was collected at the experimental farm Foulumgaard at Research Centre Foulum. The soil contained 68% sand, 24.3% silt and 7.7% clay; total carbon (C) content was 16.3 g/kg, total N 1.5 g/kg, Olsen P 22.4 mg/kg (the average Olsen P for Danish soils is 46 P mg/kg, Sibbesen & Runge-Metzger Reference Sibbesen, Runge-Metzger and Tiessen1995), water-soluble P 8.74 mg/kg and pH 6.15. The field capacity and wilting points of the soil at pF [pF = log (−Matric potential in cm H2O)] 2.0 and pF 4.2 were 25.3 and 6.7% (Vol.), respectively. The water retention curve for the soil is shown in Liu et al. (Reference Liu, Rubæk, Liu and Andersen2015a ). The soil was air-dried, sieved (10 mm mesh) and heated in an oven twice for 24 h at 85 °C with an interval of 48 h at room temperature to eliminate AMF propagules. Sterilized soil characteristics were: Olsen P 26.23 mg/kg, water-soluble P 11.57 mg/kg and pH 5.95. Each pot was filled with 10.84 kg dry soil to a dry bulk density of 1.3 g/cM3 with the topsoil and subsoil layers each 220 mm deep. The topsoil was fertilized, while the subsoil was left unfertilized. Two P levels were created: P1 in which the 5.42 kg topsoil of each pot was mixed evenly with fertilizer consisting of 0.48 g/kg N, 0.52 g/kg potassium (K), 0.33 g/kg sulphur (S), 0.13 g/kg magnesium (Mg) and 0.11 g/kg P, and a control (P0) with the same amounts of N, K, S and Mg but no P. The fertilizer used was: ammonium nitrate; monopotassium phosphate; potassium sulphate; magnesium sulphate heptahydrate. The packed soil had a water content of 23.8% (v/v) at pot water-holding capacity, measured after 2 days of draining the pots on a moist, naturally drained outdoor soil surface, and 5.18% (v/v) at permanent wilting point as measured in a pressure plate apparatus.
Seed potatoes (Solanum tuberosum L. cv. Folva) of similar weights (60–70 g) were surface-sterilized with 5 ml/l hydrogen peroxide for 1 min and rinsed thoroughly with water and then pre-germinated for 1 week. Three inoculums were obtained from the Centre for Mycorrhizal Culture Collection, TERI, India: two AMF strains (M1+: R. irregularis, M2+: G. proliferum) and a control: M− (substrate without AMF strains). AMF inoculants (M1+ or M2+) were propagated in a root organ culture as described by Adholeya et al. (Reference Adholeya, Tiwari, Singh, Declerck, Strullu and Fortin2005). Briefly, AMF spores were extracted by deionization of the medium and subsequently mixed with terragreen (American aluminium oxide, Oil Dry US Special, Type IIIR, as carrier/substrate). Seed potatoes were inoculated by wetting and subsequently coating with 1 g inoculum (M1+, or M2 + or M−) on the surface. Each gram of the AMF inoculants (M1+ or M2+) contained 200 infectious propagules. The number of infectious propagules was determined prior to application according to Sharma et al. (Reference Sharma, Gaur, Bhatia and Adholeya1996) and Gaur et al. (Reference Gaur, Adholeya and Mukerji1998). Coated potatoes were placed in a dry tray in a single layer to dry for 30 min and then planted in the middle of each pot with only one sprout kept.
The pots were initially placed outside under semi-field conditions under a transparent roof. All pots were moved into the greenhouse 20 days after sowing and placed on two tables. The conditions in the greenhouse were set at: 20/10 ± 2 °C day/night air temperature, 16:8 h L:D photoperiod and >500 µmol/m2/s photosynthetic active radiation supplied by sunlight plus metal-halide lamps, and a relative humidity (average) of 63%.
Irrigation management, soil water dynamics and plant water use
Pot soil water content was monitored by a time domain reflectometer (TDR-100, Campbell, UT, USA) and 400 mm probes were inserted into the centre of each soil compartment. All plants were kept well-watered to 90% pot soil water-holding capacity during the first 44 days. Thereafter, the plants were subjected to: (1) FI, where both soil compartments were watered to water-holding capacity; (2) PRD, where half of the root system was watered to soil water-holding capacity while the other half was left to dry to a volumetric soil water content (θ) of around 8% over a period of about 6 days before the irrigation was switched to the dry section. The choice of drying to 8% (v/v) was based on the soil water characteristics curve and the suggestions in Liu et al. (Reference Liu, Song, Zhang, Shahnazari, Andersen, Plauborg, Jacobsen and Jensen2008) that the dry side should be allowed to dry to a water potential of around −80 kPa to induce relevant ABA production in potato plants; (3) DI, where the same amount of water was used as for PRD within the corresponding P and AMF treatments, but applied evenly to both soil compartments. All the pots were irrigated every second day for 30 days until the end of the experiment. The water used for irrigation was tap water with negligible concentrations of nutrients. The irrigation volume (L) was measured at each irrigation event based on the average soil water content of each treatment with two to four replicates, and was calculated as the soil volume in each pot multiplied by the difference between the volumetric water content at pot water-holding capacity and the actual volumetric water content. Average soil volumetric water content (θ) was calculated by averaging the soil water content before and after irrigation.
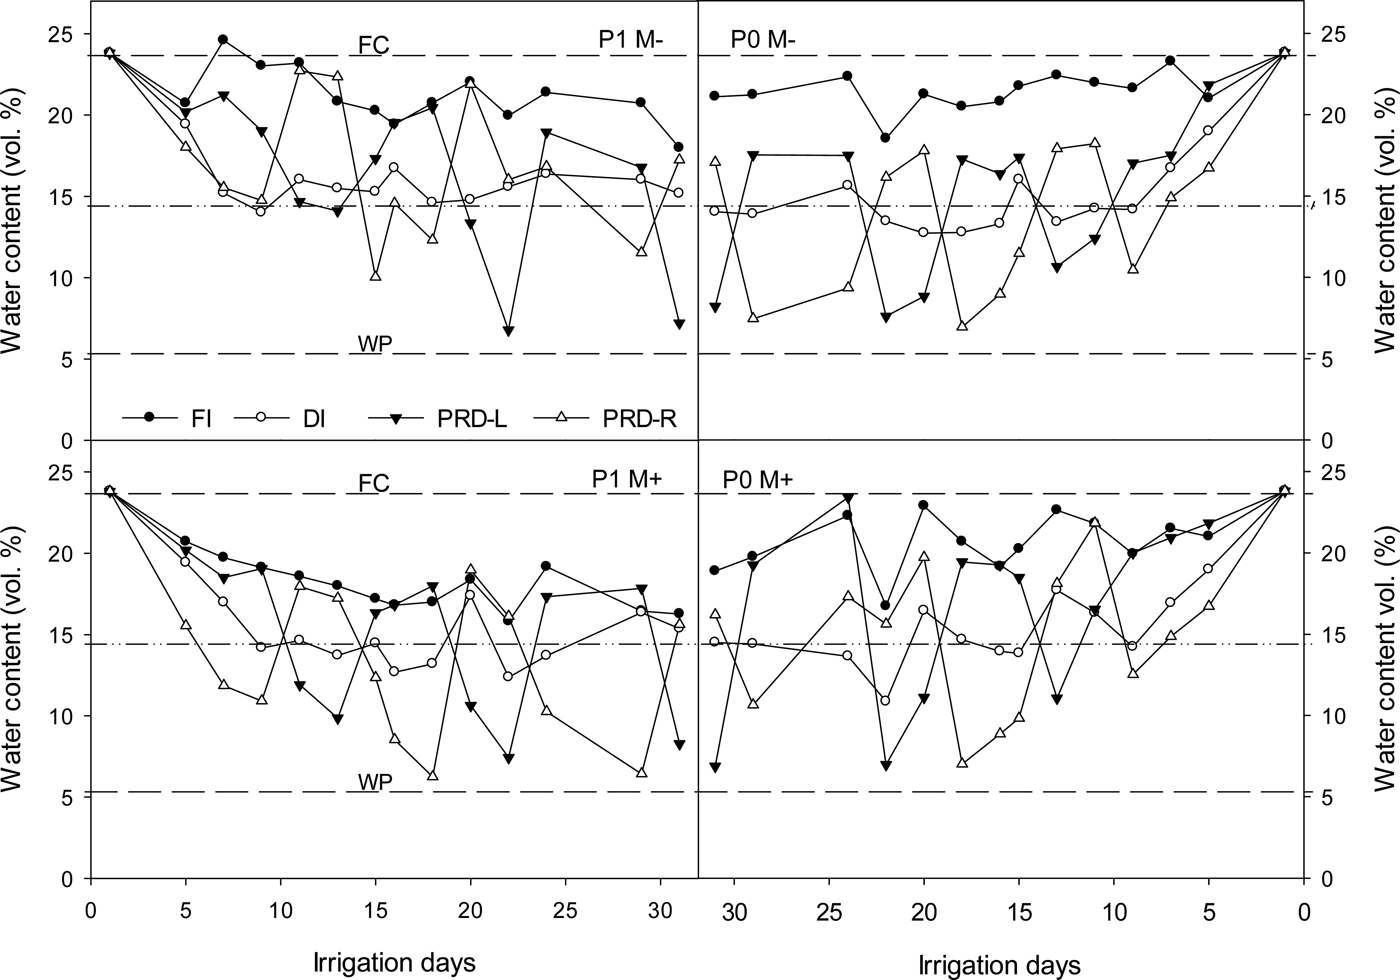
The dynamics of the average soil volumetric water content (θ) in the 0–400 mm soil profile during the irrigation treatment period under different P levels are shown in Fig. 1. Since the values of θ of M1+ and M2+ treatments were similar and the same amount of water was used for M1+ and M2+ treatments, the average θ for M1+ and M2+ was shown as M+. Plant-available water is the soil water content between water-holding capacity and wilting point, and the water between 23.8 and 14.5% was assumed to be readily taken up by plants (Fig. 1). The bare soil evaporation from the pot soil was measured and it was <1% of the total evapotranspiration in a 24-h period.
Average pot soil volumetric water content (vol. %) under P fertilization treatments (P0: without P fertilizer, P1: with P fertilizer) and inoculation treatments (M−: non-mycorrhizal control, M+: Rhizophagus irregularis or Glomus proliferum) during three irrigation treatments (FI, full irrigation; DI, deficit irrigation and PRD, partial root zone drying irrigation. PRD was measured in two soil compartments of the pots: PRD-L and PRD-R). The dashed lines show the pot water-holding capacity (FC) of 23.8% and wilting point (WP) of 5.2%; dash-dotted lines tentatively divide the plant-available water into readily and non-readily available water above and below 14.5%.

Harvest and analysis
On the 12th day after onset of the irrigation treatments, net photosynthetic rate and stomatal conductance were measured with a portable gas exchanger (Ciras-2, PP-systems, MA, USA) on the second set of fully expanded leaves measured from the top. During measurements, leaves were exposed to a carbon dioxide (CO2) concentration of 400 µmol/mol, a temperature of 25 °C, airflow through the chamber of 250 µmol/s and a light source intensity of 1000 µmol/m2/s.
On the 30th day after onset of irrigation, all plants were harvested when they were at growth stages 45–46 (50–60% of total final tuber mass reached) according to the BBCH scale (Hack et al. Reference Hack, Gall, Klemke, Klose, Meier, Stauss, Witzenberger and Meier2001). The shoots were separated into leaves and stems and the underground plant parts were separated into roots and tubers. The leaf area was measured with a leaf area meter (LI-3100C, Li-Cor, Lincoln, NE, USA). Bulk soil was sampled from an even mix of all the pot soil (topsoil and subsoil). Roots and tubers were washed with tap water and roots were cut into approximately 10 mm pieces, evenly mixed and sub-samples of approximately 1 g stored in 25 ml/l acetic acid until staining and analysis of AMF root colonization. The remaining roots, tubers, stems and leaves were dried at 70 °C to constant weight, the dry weight recorded and dried samples ground to powder. The dry weight of roots taken for analysis of AMF root colonization was calculated based on the average water content of the roots. Plant total biomass was the summed dry weights of all plant parts. The root/shoot percentage (%) and the tuber percentage (%) were calculated as root biomass/shoot biomass × 100 and tuber biomass/total biomass × 100, respectively. Water use efficiency (g/l) was calculated as the ratio of plant biomass produced to the amount of plant water used during the whole season of plant growth.
The percentage of AMF root colonization was estimated by visual observation of fungal colonization using a microscope. The root systems were stained using a modified method from Vierheilig et al. (Reference Vierheilig, Coughlan, Wyss and Piche1998), where the roots were cleaned in 100 g/l KOH in a 90 °C water bath for 30 min, rinsed and cooled down with distilled water for 3 min, stained with 50 ml/l Ink blue (Sheaffer Skrip) at 90 °C for 5 min and washed with tap water for 3 min. The root samples were subsequently placed on petri dishes marked with parallel lines and observed under a dissecting microscope (Leica microsystems Ltd. CH-9435 Heerbrugg, Type DF C450) at × 40 magnification. The percentage of AMF root colonization was estimated by examining 100 root pieces (previously stored in 25 ml/l acetic acid) crossing the line in the petri dish (Giovannetti & Mosse Reference Giovannetti and Mosse1980).
The total P concentration of the plant material was measured after ashing (450 °C) and solubilizing in 139 ml/l hydrochloric acid and 217 ml/l nitric acid by spectrophotometric analysis using a spectrophotometer at 410 nm after the addition of vanadate molybdate (Stuffins Reference Stuffins1967). The total N concentration of the plant material was measured at the final harvest (day 30) with a LECO CNS-1000 (LECO Corp., St. Joseph, MI, USA) according to ISO 13878. Plant P and N uptake (mg/plant) was calculated as plant total actual P/N concentration multiplied by plant biomass. The plant response to AMF was defined as the percentage of changes in biomass or other measured items (P or N uptake) due to M1+ or M2+ relative to M−. A corrected shoot P concentration was calculated according to Prummel & Von Barnau-Sijthoff (Reference Prummel and Von Barnau-Sijthoff1984): corrected shoot P concentration (mg/g) = actual shoot P concentration (mg/g) – 0.098 [actual shoot N concentration (mg/g)–50].
Soil water-soluble P was measured in the pooled supernatants after two sequential extractions of 1 g of fresh soil shaken with 50 ml of deionized water for 1 h at 20 °C, followed by centrifugation for 30 min at 10 733 g at 20 °C and spectrometric analysis at 890 nm after the addition of vanadate molybdate (adapted from Sissingh Reference Sissingh1971). Soil acid phosphomonoesterase activity was measured with a spectrophotometer at 420 nm (Tabatabai & Bremner Reference Tabatabai and Bremner1969) after 1 g (dry weight) fresh soil had been incubated in a universal buffer at 37 °C with p-nitrophenyl phosphate solution for 1 h. Results were calculated as weight (μg) of p-nitrophenol released per gram dry soil per hour.
Statistical analysis
Statistical analysis was conducted using a mixed model in R (R Core Team 2014) with the lme4 package (Bates et al. Reference Bates, Maechler, Bolker and Walker2014) with P fertilization levels, irrigation methods, inoculation treatments and all their interaction terms as fixed effects and blocks as a random effect. Multiple comparisons of means were carried out using Tukey's method with the lsmeans package at P ⩽ 0.05. Of the 18 treatments, two treatments had only three replicates due to stems breaking during plant growth. Three-way analyses of variances for unbalanced data (Anova, type III, with lme4 package and Satterthwaite approximation method to calculate the denominator degrees of freedom using lmerTest package) were performed to test the effects of P fertilization levels, irrigation treatments, inoculations and all their interactions. The relationships between net photosynthetic rate and stomatal conductance, total biomass and N uptake, leaf internal CO2 concentration and stomatal conductance were expressed by linear regression curves (lm package). A linear model was optimized with lm package to describe the effects of P uptake, irrigation level (I: 0 for PRD/DI and 1 for FI) and inoculations (0 for M− and 1 for M1+/M2+) and their interactions on total biomass. Variables were chosen by first including all the variables having significant effects (Table 1) on total biomass in the mixed model and then reducing the model in a backward stepwise manner. At each step it was ensured that Akaike's Information Criteria (AIC) decreased. This procedure was carried out until AIC could be reduced no further.
ANOVA table showing level of significance of main effects of phosphorus fertilization (P), irrigation method (I), inoculation treatment (M) and interaction terms for plant total biomass (TOB), shoot biomass (SB), plant biomass of underground part (UB), root biomass (RB), root/shoot percentage (R/S), tuber percentage (Tuber), AMF root colonization rate (Rate), leaf area (Area), net photosynthetic rate (Pn) and stomatal conductance (Gs), water use efficiency (WUE), total P uptake (Pup), corrected shoot P concentration (Pcon), total N uptake (Nup), soil acid phosphomonoesterase activity (APM) and soil water-soluble P (WSP)

*, ** and *** indicate significance level at P ⩽ 0.05, P ⩽ 0.01 and P ⩽ 0.001, respecively. NS, not significant.
Results
Plant growth
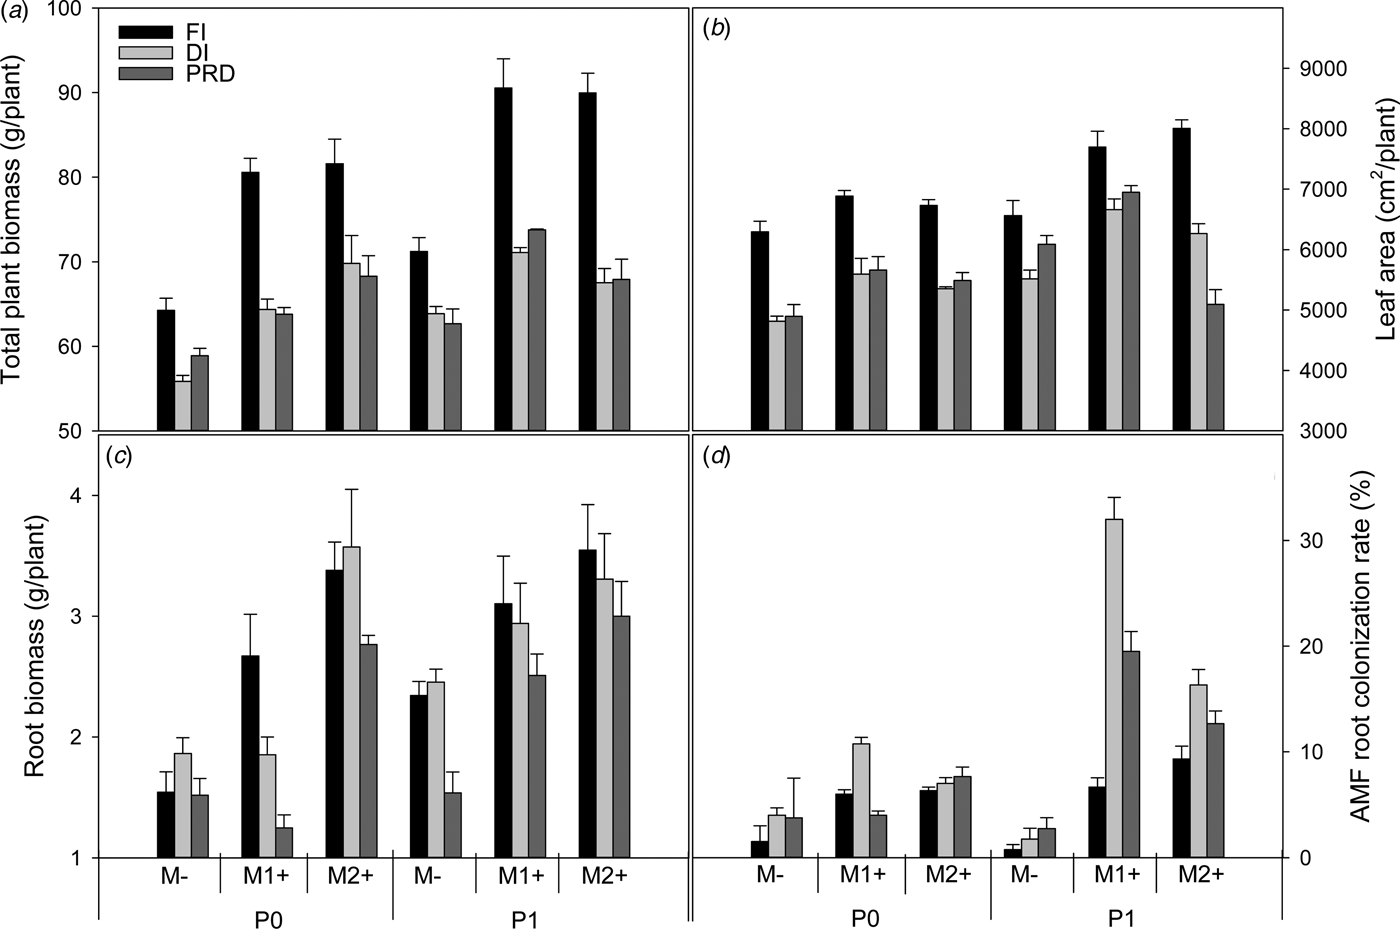
Without P fertilization, M− plants tended to have ca. 10% smaller total biomass production than at P1, but with AMF inoculation, the biomass of M1+ and M2+ plants at P0 rose to a similar or higher level than for M− plants at P1 (Fig. 2(a), Table 1). With ca. 30% less water input, DI and PRD resulted in M− plants having roughly 11% smaller total biomass production than with FI, but with AMF inoculation, the biomass under DI and PRD rose to a similar level as for the M− plants under FI. The effect of the two AMF species on plant total biomass varied for the different P fertilization levels and irrigation methods (Table 1). Generally, compared with M−, AMF increased potato total biomass in all treatments, with improvements (P < 0.05) found under FI both at P1 and P0 and both with M1+ and M2+, while improvements (P < 0.05) under DI were found only at P0 with M2+ and under PRD at P1 with M1+. In other words, the plant total biomass response to both M1+ and M2+ was larger (P < 0.05) under FI than under DI or PRD: ca. 25% increase in FI plants, against ca. 14% increase in DI and PRD plants. The total biomass of plants inoculated with M1+ was larger than for those inoculated with M2+ at P1, while the opposite was the case for P0.
(a) Total plant biomass (g/plant), (b) leaf area (cm2/plant), (c) root biomass (g/plant), (d) AMF root colonization rate (%) as affected by P fertilization level (P0: without P fertilizer, P1: with P fertilizer), irrigation treatment (FI, full irrigation; DI, deficit irrigation and PRD, partial root zone drying irrigation) and inoculation treatment (M−: non-mycorrhizal control, M1+: Rhizophagus irregularis and M2+: Glomus proliferum). Error bars indicate s.e. (n = 3–4).

Shortage of P and especially water decreased (P < 0.05) plant leaf area (Fig. 2(b), Table 1): by ca. 12% in the P0 treatment compared with P1 treatments and by 18% (average value of DI and PRD) with PRD and DI treatments compared with FI treatments in M− plants. An increase (P < 0.05) in leaf area was seen with AMF, especially under FI for both M1+ and M2+, and also under DI for M1+ at P1.
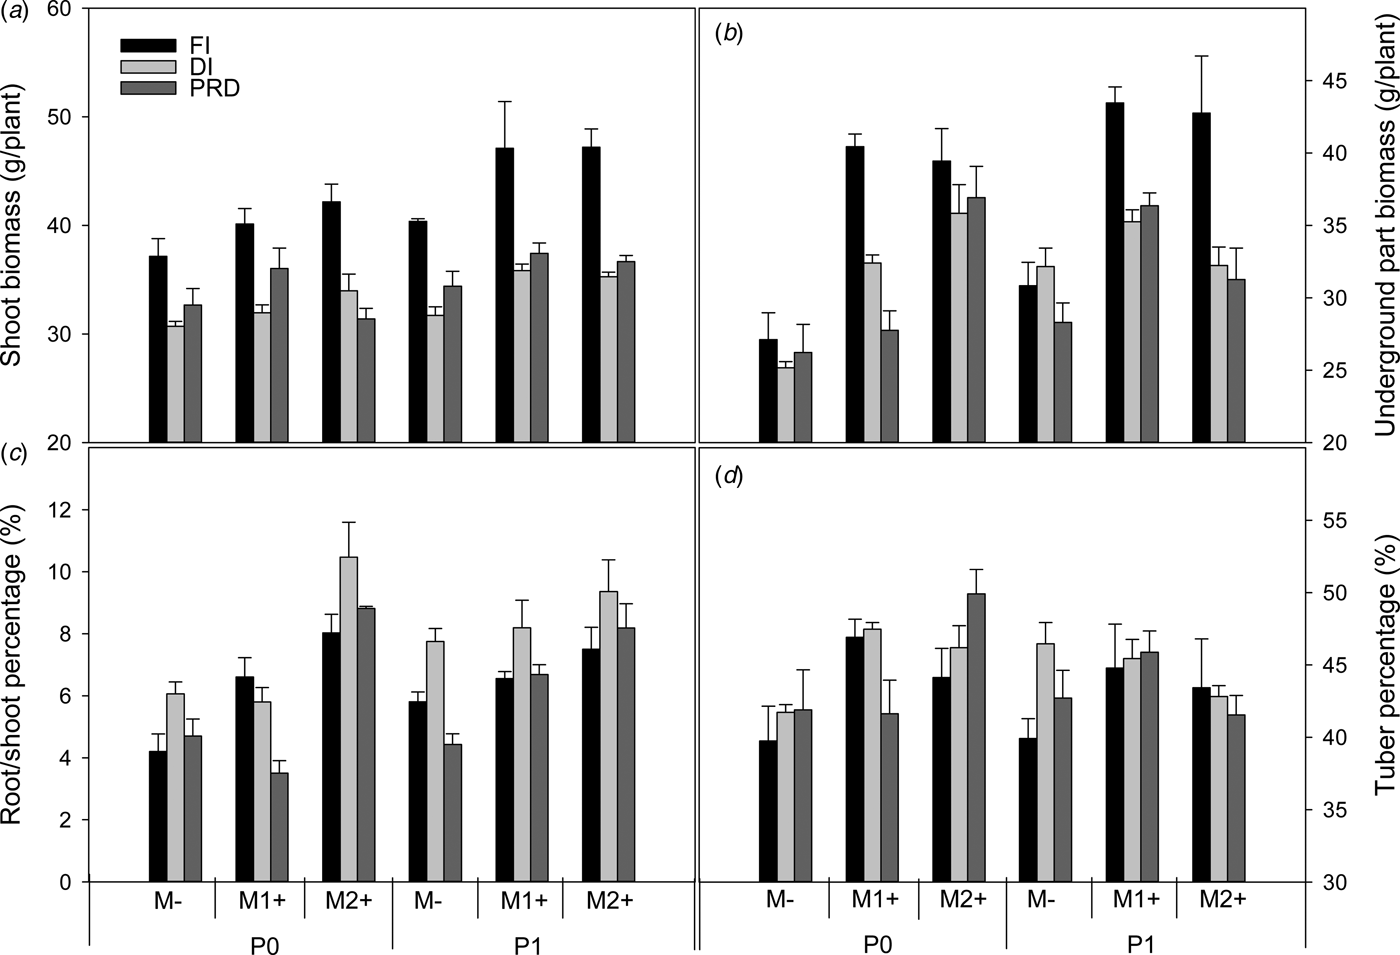
Of the biomass components, the response of shoots (Fig. 3(a), Table 1) to AMF was less pronounced compared with the response of underground parts (roots and tubers, Fig. 3(b), Table 1), indicating a greater partitioning of biomass into roots and tubers and resulting in 11 and 59% higher root/shoot in M1+ and M2+ plants, respectively (Fig. 3(c), Table 1) and 7% greater percentage of tubers in the total plant in M1+ and M2+ plants (Fig. 3(d), Table 1). Plants of PRD had less (P < 0.05) root biomass than DI and FI plants (Fig. 2(c), Table 1), resulting in higher (P < 0.05) root/shoot in DI than in PRD plants. Compared with M−, M2+ boosted the root biomass of FI and DI plants at P0 and of PRD plants at P1. Plants of M2+ had a larger root biomass than M1+ and M− plants both at P0 and P1, but the difference was more pronounced at P0 than at P1. Root biomass response to M1+ was higher at P1 than at P0, while the root biomass response to M2+ was higher at P0 than at P1.
(a) Plant shoot biomass (g/plant), (b) underground biomass (g/plant), (c) root/shoot percentage (%) and (d) tuber percentage (%) as affected by P fertilization levels (P0: without P fertilizer, P1: with P fertilizer), irrigation treatments (FI, full irrigation; DI, deficit irrigation and PRD, partial root zone drying irrigation) and inoculation treatments (M−: non-mycorrhizal control, M1+: Rhizophagus irregularis and M2+: Glomus proliferum). Error bars indicate s.e. (n = 3–4).

Arbuscular mycorrhizal fungi colonization
There was 5–10% AMF colonization in M1+ and M2+ plants at the P0 level (Fig. 2(d), Table 1), which was not significantly different from M− plants, but at P1 colonization was 10–30%, which was higher (P < 0.05) than in M−. At P1, AMF colonization was higher in M1+ plants than in M2+ plants under DI and PRD, where inoculation with M1+ in DI plants gave the overall highest level of root colonization. Generally, DI and PRD gave rise to higher (P < 0.05) AMF colonization than FI, yet no correlation was found between AMF colonization rate and plant response (biomass) to AMF.
Plant photosynthetic rate and stomatal conductance
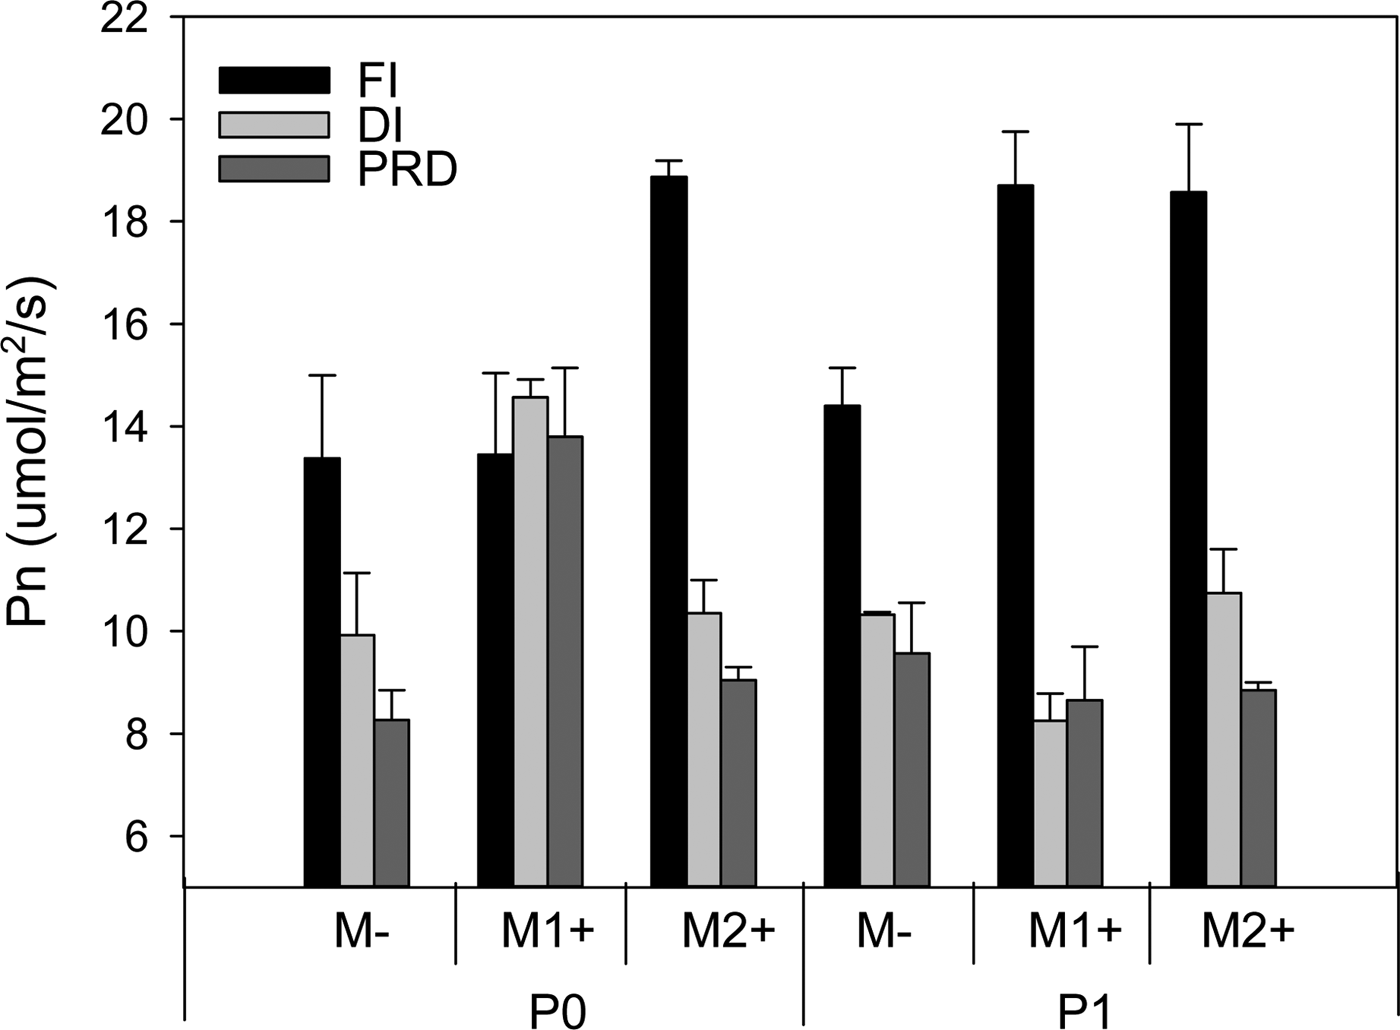
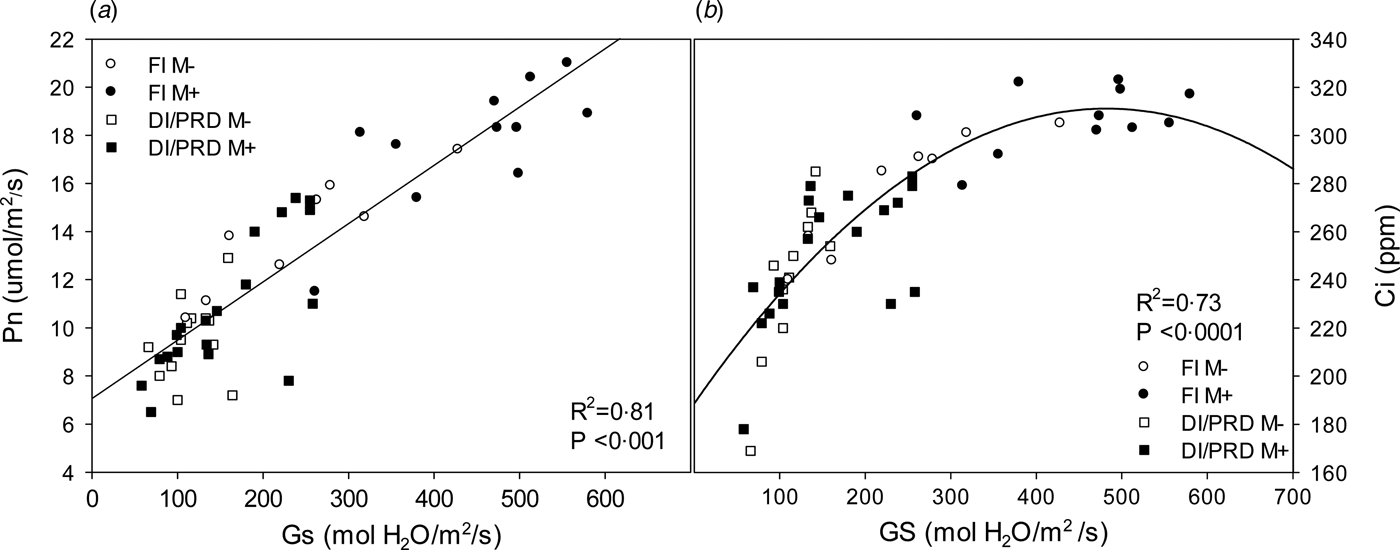
The photosynthetic rate was not affected by application of P fertilizer (Fig. 4 and Table 2). With DI and PRD, plants had lower photosynthetic rate and stomatal conductance values compared with FI, except for M1+ plants at P0. The photosynthetic rate under PRD and DI at P0 was higher in both M1+ and M2+ plants than M− plants, whereas this was not the case at P1. Under FI, the photosynthetic rate was higher (P < 0.05) in M2+ plants than M− plants at P0, whereas at P1 the photosynthetic rate tended to be higher in both M1+ and M2+ plants than M− plants (not significant). A regression of photosynthetic rate against stomatal conductance indicated that photosynthetic rate was highly correlated with stomatal conductance under all conditions (Fig. 5(a)).
Net photosynthetic rate (Pn, μmol/m2/s) as affected by P fertilization level (P0: without P fertilizer, P1: with P fertilizer), irrigation treatment (FI, full irrigation; DI, deficit irrigation and PRD, partial root zone drying irrigation) and inoculation treatment (M−: non-mycorrhizal control, M1+: Rhizophagus irregularis and M2+: Glomus proliferum). Error bars indicate s.e. (n = 2–4).

(a) Linear regression responses of Pn to stomatal conductance (Gs, mmol/m2/s). (b) Linear regression of leaf internal CO2 concentration (Ci, ppm) v. stomatal conductance (Gs, mmol/m2/s).

Water use efficiency (g/l total plant biomass/plant water use) as affected by P fertilization level (P0: without P fertilizer, P1: with P fertilizer), irrigation treatment (FI, full irrigation; DI, deficit irrigation and PRD, partial root zone drying irrigation) and inoculation treatment (M−: non-mycorrhizal control, M1+: Rhizophagus irregularis and M2+: Glomus proliferum)

Values are means ± s.e. (n = 3–4).
Water use efficiency
Plants of PRD and DI had similar WUE, which was significantly larger than FI plants (Tables 1 and 2). Inoculation with M1+ and M2+ as compared with M− increased (P < 0.05) the WUE of plants that were subjected to limited irrigation and P: DI and PRD at P0, but not of FI plants at P0. At P1, M1+ and M2+ increased (P < 0.05) the WUE of FI plants, but not of DI and PRD plants except the M1+. Plants of M2+ had higher (P < 0.05) WUE than M1+ under DI and PRD at P0, while at P1 M2+ had similar WUE as M1+, except in PRD plants.
Plant phosphorus and nitrogen uptake
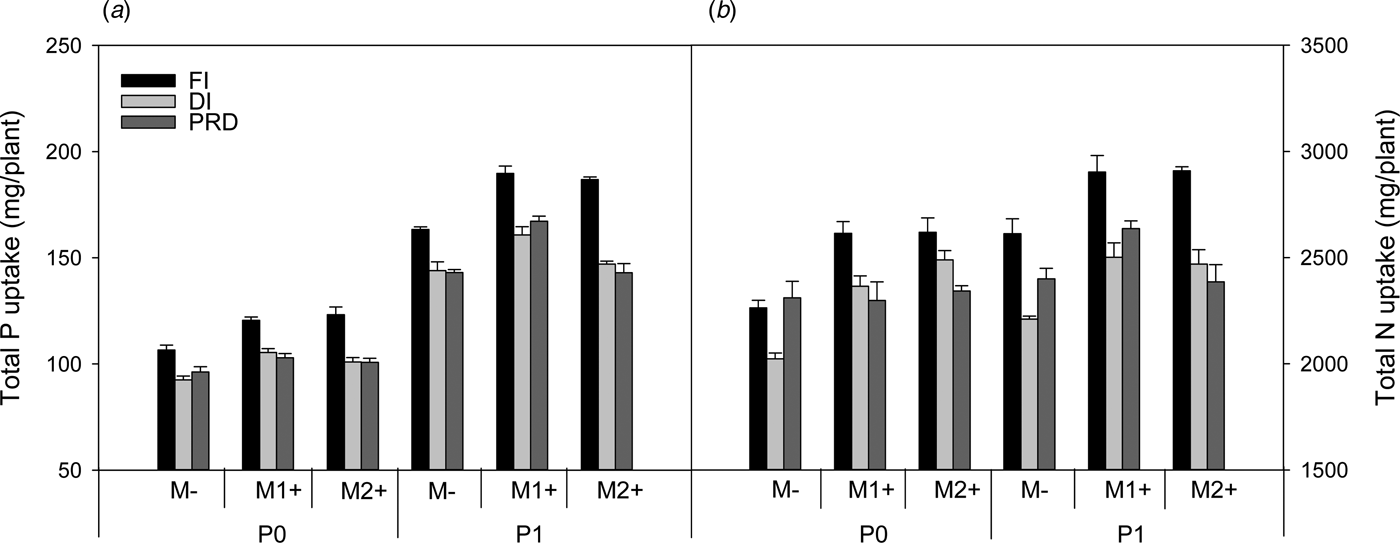
At P1, plants had a larger (P < 0.05) P uptake than at P0 (Fig. 6(a), Table 1). Plants of DI and PRD had similar total P uptakes, which were smaller than for FI plants. However, P uptake differences between DI\PRD and FI plants were larger under P1 than P0, giving rise to an interaction effect between P and irrigation. Inoculation with AMF had a significant effect on plant total P uptake, but this effect was influenced by P level and irrigation method. Generally, plant P uptake was improved by AMF: improvements (P < 0.05) were found under FI both at P1 and P0 and both with M1+ and M2+, while at P1 improvements (P < 0.05) were found only under DI and PRD with M1+. As a result, the total P uptake of M1+ plants under DI and PRD was similar to M− plants at P1 under FI. The P uptake of plants inoculated with M1+ were larger than for those inoculated with M2+ at P1, while they were similar at P0. The corrected shoot P concentration was lower (P < 0.05) in P0 plants (1.7 mg/g) than that in P1 plants (2.5 mg/g) indicating a severe P deficiency in P0 plants.
(a) Total P uptake (mg/plant) and (b) total N uptake (mg/plant) as affected by P fertilization level (P0: without P fertilizer, P1: with P fertilizer), irrigation treatment (FI, full irrigation; DI, deficit irrigation and PRD, partial root zone drying irrigation) and inoculation treatments (M−: non-mycorrhizal control, M1+: Rhizophagus irregularis and M2+: Glomus proliferum). Error bars indicate s.e. (n = 3–4).

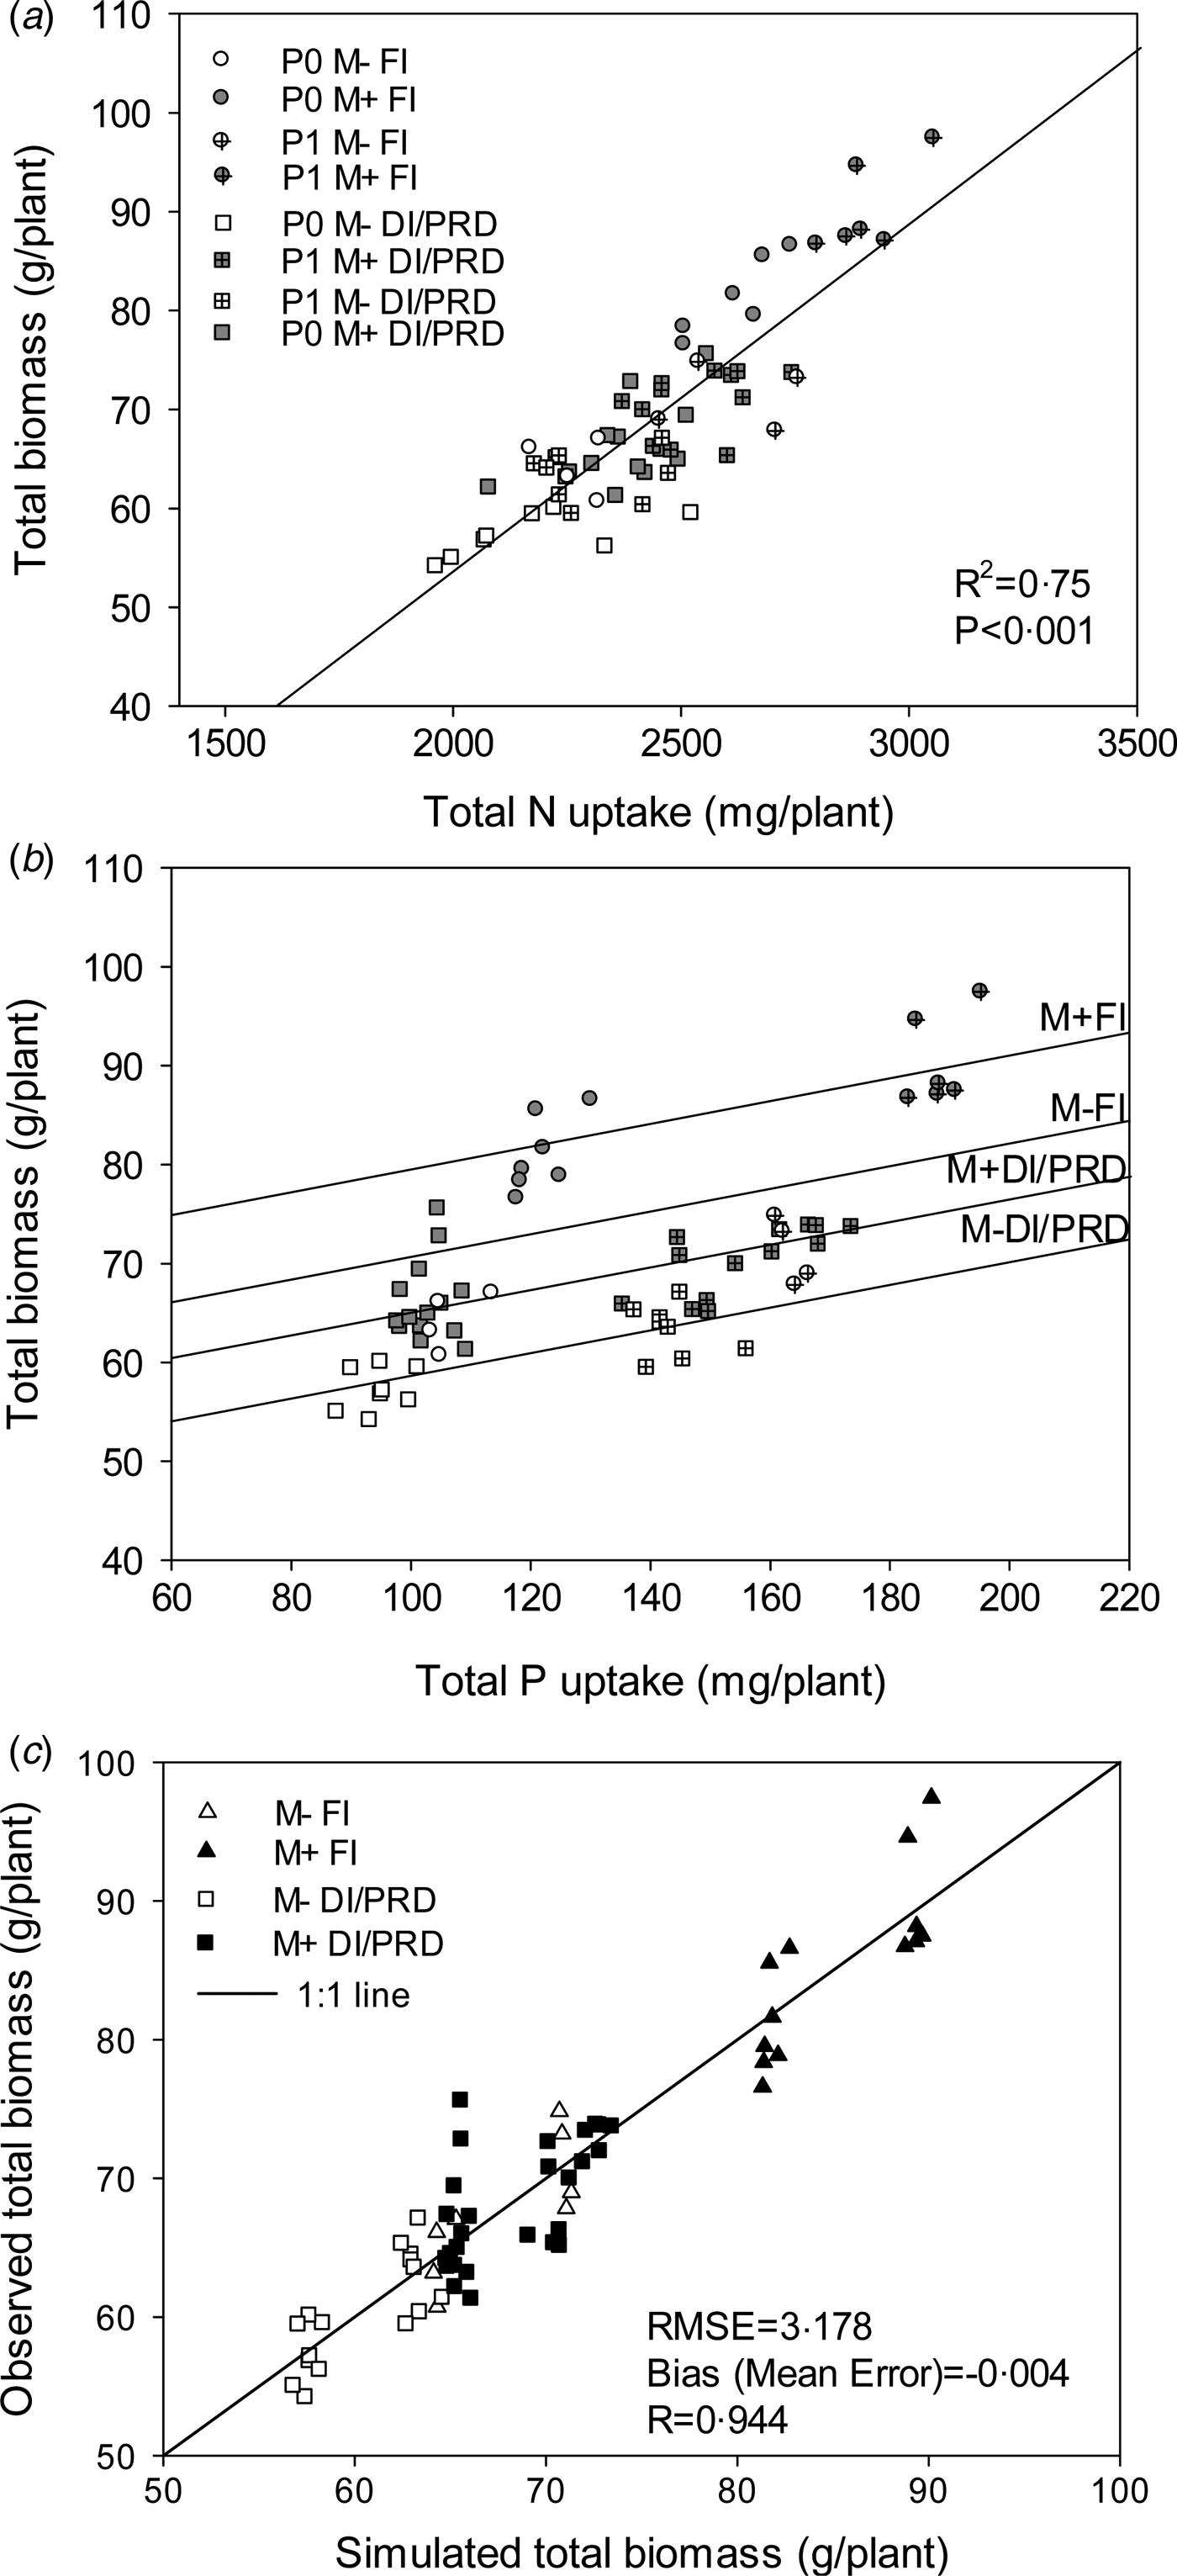
The P fertilization increased plant N uptake (Fig. 6(b), Table 1), but varied between irrigation methods. The N uptake differences between P1 and P0 plants were larger under FI than DI\PRD, giving rise to an interaction effect (P < 0.05) between P fertilization and irrigation. The DI and PRD plants generally had a smaller total N uptake than FI plants, except under PRD at P0. The N uptake of PRD plants was larger (P < 0.05) than for M− plants under DI, both at P0 and P1, but the N uptakes of PRD and DI plants were similar after inoculation with M1+ or M2+, which meant that this inoculation stimulated the N uptake in PRD plants less than in FI and DI plants. The N uptake of FI and DI plants was increased (P < 0.05) after inoculation with M1+ and M2+ relative to M−. Plant biomass was linearly related to N uptake (Fig. 7(a)), but the relation between plant biomass and P uptake formed two distinct groups with respect to the two P levels (Fig. 7(b)). Based on the factors having significant effects (Table 1) on total biomass (g/plant), a model was derived to describe the effects of P uptake (range 87–195 mg/plant), irrigation level (I: 0 for PRD/DI and 1 for FI) and inoculation treatment (M: 0 for M− and 1 for M1+/M2+) and their interactions (Fig. 7(b) and ( c)):
 $$\eqalign{\hbox{Total biomass} & = 46.8 ({\pm}1.92) + 0.11 ({\pm} 0.0 14) \times {\rm P} \,{\rm uptake} \cr & \quad + 5.6({\pm} 1.45) \times {\rm I} + 6.8({\pm} 1.05) \times {\rm M} \cr & \quad + 8.7({\pm}1.82) \times {\rm I} \times {\rm M}}$$
(a) Linear regression responses of total biomass (g/plant) to plant N (g/plant); (b) plant P (g/plant) responses to total biomass (g/plant); (c) simulated and observed total biomass estimates (g/plant, dry matter) in Eqn (1) for all the treatments. Simulation results are shown for models means. Different treatments are depicted with different symbols. The 1 : 1 line is shown, representing perfect agreement. M+ indicated inoculation of M1+ or M2+.

A term representing the interaction between P fertilization and inoculation treatment (Table 1) was found not to be significant and may have been absorbed in equation: Eqn (1) because it was chosen to base the model on plant P uptake rather than P fertilization level. The reason for this was that although the P uptake was largely determined by P fertilization level (Fig. 7(b)); in this way the effect of P uptake due to irrigation regime and AMF was also included, enabling a judgement about how big a role this played in the FI and AMF effects on growth. The unit of the coefficients of the different terms were g/plant apart from P uptake having a unitless coefficient.
Soil acid phosphomonoesterase activity and water-soluble phosphorus
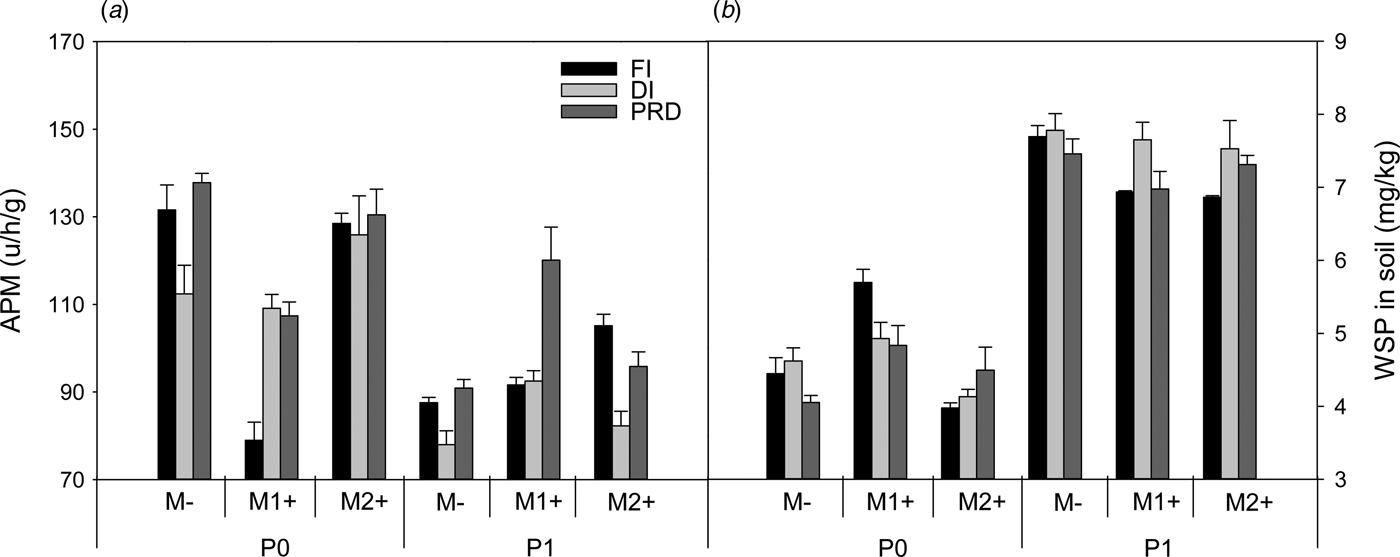
The P fertilization reduced the soil acid phosphomonoesterase activity in soil (Fig. 8(a), Table 1). Partial root-zone drying irrigation treatments generally resulted in higher soil acid phosphomonoesterase activity than DI treatments, with the exception of M1+ and M2+ plants at P0. Inoculation with AMF had significant effects on soil acid phosphomonoesterase activity, but the effects were influenced by P level and irrigation method. Soil acid phosphomonoesterase activity was lower in M1+ treatments than in M− and M2+ treatments under FI and PRD at P0, whereas it was higher in M1+ treatments than in M− and M2+ treatments under PRD at P1. Soil acid phosphomonoesterase activity was higher for M− and M1+ under PRD than under DI, but not for M2+. Inoculation with M1+ increased soil water-soluble P compared with M− at P0, while all treatments had similar water-soluble P levels at P1 (Fig. 8(b), Table 1).
(a) Soil acid phosphomonoesterase activity (APM, μg/h/g) and (b) soil water-soluble P (WSP, mg/kg) as affected by P fertilization level (P0: without P fertilizer, P1: with P fertilizer), irrigation treatment (FI, full irrigation; DI, deficit irrigation and PRD, partial root zone drying irrigation) and inoculation treatment (M−: non-mycorrhizal control, M1+: Rhizophagus irregularis and M2+: Glomus proliferum). Error bars indicate s.e. (n = 3–4).

Discussion
Stimulation of nutrient uptake and growth by arbuscular mycorrhizal fungi symbiosis
As expected, potato growth was limited by low P and water availability, which is in line with the findings of Liu et al. (Reference Liu, Rubæk, Liu and Andersen2015a ) and Sun et al. (Reference Sun, Cui and Liu2015). However, with M1+ and M2+ inoculation, plant WUE, P and N uptake and biomass yield were enhanced overall. These results have important implications for potato productions where P and water are in short supply. Furthermore, inoculation with M1+ and M2+ stimulated potato growth not only under low-P and water-stressed conditions, but also under higher P and well-watered conditions. However, plant P and N uptake and biomass response to the M1+ and M2+ treatments varied under different P and irrigation levels. These findings agree with previous studies showing that AMF can improve plant growth (Auge Reference Auge2001; Jayne & Quigley Reference Jayne and Quigley2014). Even though beneficial effects of AMF on plants under high-P or fully irrigated conditions have been reported previously (Douds et al. Reference Douds, Nagahashi, Reider and Hepperly2007; Ruiz-Sanchez et al. Reference Ruiz-Sanchez, Armada, Munoz, de Salamone, Aroca, Ruiz-Lozano and Azcon2011), most of these studies revealed larger effects of AMF usually found under water-deficient conditions (Yooyongwech et al. Reference Yooyongwech, Phaukinsang, Cha-um and Supaibulwatana2013; Jayne & Quigley Reference Jayne and Quigley2014) and in P-deficient soils (McArthur & Knowles Reference McArthur and Knowles1993b ). Surprisingly, in the current study, the highest plant P and N uptakes as well as biomass responses to M1+ and M2+ at both high and low P levels were found under FI, with plant biomass response to M1+ or M2+ almost twice as high under FI as under DI and PRD. The measured growth (biomass) responses to AMF were of a magnitude indicating that improved acquisition of water or macronutrients as P and N was probably the main cause, although the influence of any growth-promoting factors not measured in the current experiment cannot be excluded. However, the possibility of improved acquisition of water as being the main cause may be excluded because AMF treatments had an increased use of irrigation water, a higher WUE, a lower soil water content and stomatal conductance not low but even higher than M− treatments.
When comparing the N concentration adjusted shoot P concentration at P0, which was ca. 1.5 mg P/g shoot dry matter, with the critical threshold values for P deficiency in potatoes of 3–5 mg P/g shoot dry matter as described by Prummel & Von Barnau-Sijthoff (Reference Prummel and Von Barnau-Sijthoff1984), it is clear that plants at P0 were P-starved. However, P1 plants also had rather low values around 2.5 P mg/g shoot dry matter, which may explain the similar growth response to P uptake. Plants have various acclimation responses to P deficiency. Secretion of acid phosphatase has often been used as an indicator to evaluate plant P limitation and response to P starvation (Plaxton & Tran Reference Plaxton and Tran2011). The lower water-soluble P and higher level of acid phosphomonoesterase activity in P0 than P1treatments were also indicators of shortage of inorganic P in these treatments, indicating an increased use of organic P. According to Liu et al. (Reference Liu, Rubæk, Liu and Andersen2015a ), plants tend to have a higher shoot N : P ratio under PRD than DI, which would explain the increased acclimation to P deficiency and root secretion of acid phosphatase in PRD.
Causes of growth stimulation under deficit irrigation/partial root-zone drying irrigation
Treatments PRD/DI imposed drought stress on plants, as indicated by the lower photosynthetic rate and the lower soil water content under PRD/DI than FI. The reduction in net photosynthetic rate was related to a reduction in stomatal conductance and, consequently, a reduction in leaf internal CO2 concentration, indicative of limited CO2 supply (Lawlor Reference Lawlor2002). However, the lower soil moisture content in DI and PRD may also have reduced plant growth by restricting nutrient acquisition under these conditions.
According to Smith et al. (Reference Smith, Jakobsen, Gronlund and Smith2011), plants having low root: shoot ratios, slow root growth and poor development of root hairs display relatively larger growth increases after AMF inoculation. The similar biomass production in FI M− plants with DI/PRD M1+/M2+ plants indicated that the growth limitation by DI/PRD was fully compensated by inoculation of M1+/M2+. Plants inoculated with AMF both have the direct pathway via the roots and the indirect pathway via AMF hyphae (Smith & Smith Reference Smith and Smith2011) in a complex interplay between the two for P, N and water acquisition (Smith et al. Reference Smith, Jakobsen, Gronlund and Smith2011). The extraradical hyphae can absorb and transport nutrient elements to plant by extending beyond depletion zones of the rhizosphere (Wu et al. Reference Wu, Srivastava and Zou2013). Therefore, the generally larger nutrient uptake of P and N in M1+/M2+ plants under DI/PRD would certainly result in positive growth response compared with M− plants. Improved plant P uptake by AMF under P-deficit conditions and under reduced water regimes is not a novel finding (McArthur & Knowles Reference McArthur and Knowles1993b ; Neumann et al. Reference Neumann, Schmid, Romheld and George2009). While plant carbon supply to fungus can trigger fungal N uptake and transport (Fellbaum et al. Reference Fellbaum, Gachomo, Beesetty, Choudhari, Strahan, Pfeffer, Kiers and Bücking2012), this benefit through AMF is supposedly improbable under carbon limitation (Smith & Smith Reference Smith and Smith2011). The reduction of photosynthetic rate in DI and PRD plants may therefore suggest that fungal N uptake under DI and PRD was unlikely to occur. Nevertheless, stimulated N uptake was found under DI and in one instance also under PRD irrigation. This could emanate from the period before irrigation treatments were imposed or be due to the intermittent nature of DI/PRD, which relieves plant drought stress temporarily upon every irrigation event.
The model outlined indicated that growth stimulation in the experiment was due to a major effect related to P uptake (ranged from 87 to 195 mg/plant) accounting for up to ca. 15 g biomass/plant, two effects related to FI and inoculation of AMF (M1+/M2+) of 5.6 and 6.8 g biomass/plant, respectively, and an additional effect of 8.7 g biomass/plant if both AMF and FI was applied. Thus, under PRD/DI the effect of AMF on growth would be due to increased P uptake and a separate effect of AMF that could relate to improved N nutrition.
Causes of growth stimulation under full irrigation
According to the outlined model, the effect of FI in itself was not big but an interaction effect of inoculation of AMF and irrigation substantially enhanced growth under FI in addition to the individual effects of AMF and FI. Plants inoculated with AMF allocate a significant proportion of photosynthetic products to their root system to support fungal growth (Jakobsen & Rosendahl Reference Jakobsen and Rosendahl1990). The plant underground roots and tubers accounted for the majority of the biomass response to AMF in the current study, indicating that AMF changed the plant carbon allocation favouring not only roots but also tubers. The generally increased root dry weight and the root: shoot ratio after AMF inoculation is consistent with the results obtained by McArthur & Knowles (Reference McArthur and Knowles1993b ) for potatoes and Liu et al. (Reference Liu, Li, Wang, He and Tian2015b ) for rice. Previous studies have also reported changes in carbon allocation in plants by AMF (Kuo & Huang Reference Kuo and Huang1982) and that the sink strength stimulation may lead to higher net photosynthetic rate, which eventually causes larger biomass in AMF plants (Wright et al. Reference Wright, Read and Scholes1998). Low carbon sink strength may limit triose phosphate utilization, which is one of the limiting factors for leaf photosynthetic rate (Sharkey Reference Sharkey1985). The carbon demand from the stronger tuber growth may accelerate the utilization of triose phosphate for sucrose synthesis. The increase in photosynthetic rate may exceed the carbon costs of AMF symbiosis substantially, leading to a greater growth response to AMF (Kaschuk et al. Reference Kaschuk, Kuyper, Leffelaar, Hungria and Giller2009).
Factors leading to the positive growth response to AMF under FI could be the enhanced P and N uptake by AMF, where the growth response to M1+/M2+ exceeded 25%. Increased P nutrition increased leaf area, in line with Jenkins & Ali (Reference Jenkins and Ali1999). However, it did not affect photosynthetic rate, in accordance with Black et al. (Reference Black, Mitchell and Osborne2000), who found that plant P status affected photosynthetic rate only when soil P was strongly deficient. The plant P uptake also correlated with root biomass (Liu et al. Reference Liu, Rubæk, Liu and Andersen2015a ). The 15% larger P uptake in AM plants than M− plants under FI would certainly result in larger biomass yield according to Eqn (1). A stimulated P uptake by AMF under well-watered conditions has been evidenced by many studies (Aliasgharzad et al. Reference Aliasgharzad, Bolandnazar, Neyshabouri and Chaparzadeh2009; Neumann et al. Reference Neumann, Schmid, Romheld and George2009), but without being highlighted.
Nitrogen is a nutrient that becomes increasingly depleted from soil solution during the growth period (Zhao Reference Zhao2014). Irrigation in the current experiment may have displaced a considerable amount of N from the topsoil to subsoil, and the denser roots as well as AMF hyphae in AMF plants compared with M− plants may have enhanced diffusional transport of N in the lower layers where water movement was limited, as most water exchange takes place in the densely rooted topsoil (Yu et al. Reference Yu, Zhuang, Nakayama and Jin2007). Since N is a key determinant of photosynthetic rate (Paul & Foyer Reference Paul and Foyer2001), as well as leaf area (Biemond et al. Reference Biemond, Vos and Struik1995), it is conceivable that the higher growth, which is a product of photosynthesis and leaf area, was also related to the higher N uptake of AMF plants. That AMF is capable of absorbing and transferring N to their host plants is supported by an increasing body of evidence (Hodge & Storer Reference Hodge and Storer2015; Zhu et al. Reference Zhu, Song, Liu and Liu2016). It occurs in the form of nitrate (NO3 −) (Bago et al. Reference Bago, Vierheilig, Piché and Azcón-Aguilar1996) and ammonium (NH4 +) (Hawkins et al. Reference Hawkins, Johansen and George2000) via the extraradical hyphae, which could also be the case in the current study. Moreover, the increased plant P nutrition can improve potato root biomass and N acquisition (Liu et al. Reference Liu, Rubæk, Liu and Andersen2015a ), so in line with Zhu et al. (Reference Zhu, Song, Liu and Liu2016), it is possible that the enhanced N uptake by AMF may partially come from the positive influence of AMF on P uptake and root biomass. Thus, the interaction effect of AMF and irrigation Eqn (1), which substantially enhanced plant growth under FI could partly be explained by enhanced N uptake, as a similar interaction was found for N uptake and it was evident that growth was closely correlated to N uptake.
Arbuscular mycorrhizal fungi root colonization and functional diversity of the symbiosis under abiotic stress
The degree of AMF root colonization was not correlated to the mycorrhizal growth or nutrient responses. Low colonization is not necessarily an indication of a moderate growth response (Smith et al. Reference Smith, Smith and Jakobsen2004). Potato plants usually have modest AMF colonization, but even trace levels have been reported to enhance plant growth (Niemira et al. Reference Niemira, Safir, Hammerschmidt and Bird1995). In the current study, 4–32% root colonization was found and was greatly affected by soil moisture and P level. Higher root colonization was found in DI and PRD plants grown at high P rather than low P level. High soil P availability is usually reported to reduce AMF root colonization (McArthur & Knowles Reference McArthur and Knowles1993a ; Balzergue et al. Reference Balzergue, Puech-Pages, Becard and Rochange2011). However, soil P availability does not necessarily suppress or control fungal activity (Smith et al. Reference Smith, Jakobsen, Gronlund and Smith2011). Colonization of roots by AMF may rather be a result of the balance between the rate of root growth and AMF root infection, so that the low colonization in M2+ plants may still harbour the possibility of significant AMF biomass inside roots compared with M− plants under DI and PRD at P0. Neumann et al. (Reference Neumann, Schmid, Romheld and George2009) and Birhane et al. (Reference Birhane, Sterck, Fetene, Bongers and Kuyper2012) found that the duration and timing of soil dryness or wetness of the soil moisture regime affected AMF root colonization. The stimulating effect of soil drying on AMF root colonization in the current work was consistent with the work of Schreiner et al. (Reference Schreiner, Tarara and Smithyman2007) and Boyer et al. (Reference Boyer, Brain, Xu and Jeffries2015). However, the alternating partial drying of the root zone did not have the same stimulating effects as the constant drying of the root zone. The explanation could be that the drying and rewetting of the soil profile under PRD causes microbial death and cell lysis (Turner et al. Reference Turner, Driessen, Haygarth and Mckelvie2003), hence reducing the size of the microbial biomass (Gordon et al. Reference Gordon, Haygarth and Bardgett2008; Liu et al. Reference Liu, Rubæk, Liu and Andersen2015a ; Reference Liu, Liu, Ravnskov, Rubæk, Sun and Andersen2017) including AMF. Despite the greater plant response to AMF than to M−, there was still an average 2.4% AMF root colonization rate in M− plants indicating an incomplete sterilization process of the soil and allowing original soil AMF to infect M− plants.
Functionality of the AMF symbiosis with plants depends on the different fungal species and plant genotypes involved and the environment they inhabit (Feddermann et al. Reference Feddermann, Finlay, Boller and Elfstrand2010). In accordance with Zhou et al. (Reference Zhou, Ravnskov, Jiang and Wollenweber2014), functional diversity of AMF symbiosis was found for M1+ and M2+ in plant P/N uptake and growth when exposed to abiotic stress caused by P and water shortage. For example, the biomass responses to M1+ were greater than to M2+ at P1, while the opposite was found at P0; the P uptake responses to M1+ at P1 were as great as at P0, while the P uptake responses to M2+ were modest. The functional diversity of AMF symbiosis highlights the importance of preserving a functionally diverse population of AMF species to maintain sustainable potato production. Although promising results were achieved, plants grown in pots under climate-controlled conditions in sterilized soil may differ from plants grown in the field where root distribution, soil microbiota interaction and the size of tubers and shoots could be different. Moreover, it is difficult to achieve physiological maturity with plants in pot experiments, since tuber growth is restricted. Further experiments are therefore needed to verify the results on plant growth under field conditions.
Conclusion
Inoculation of AMF is potentially a good agronomic practice in sustainable potato production. The current work showed that P and water shortage inhibited potato growth. However, the AMF symbiosis, which facilitated plant P and N uptake under most circumstances, could fully offset this negative effect caused by DI/PRD and low P fertilization further increase the WUE under low-P conditions. The functional diversity of AMF symbiosis, which varied between M1+ and M2+ in its abiotic stress alleviation, highlights the importance of preserving a functionally diverse population of AMF species to maintain sustainable potato production. Moreover, potato growth response to AMF under FI was significantly stronger than with DI or PRD. The strong growth response to AMF inoculation, particularly under FI might relate to the larger net photosynthesis and leaf area, apparently resulting from a higher plant P and N uptake and carbon partitioning towards roots and tubers. The plant growth response to AMF inoculation was not related to the percentage of AMF root colonization.
Acknowledgements
The authors thank Alok Adholeya (TERI: The Energy and Resources Institute, Darbari Seth Block, IHC Complex, Lodhi Road, New Delhi 110 003) for providing the mycorrhizal inoculation products. The authors also thank Finn Henning Christensen, Mette Nielsen and Anne Pia Larsen for technical assistance and Zhenjiang Zhou and Zhencai Sun for their help. The Graduate School of Science and Technology (GSST), Aarhus University contributed with funding for the project.