INTRODUCTION
A complex life cycle is defined by abrupt ontogenetic changes in morphology and/or ecology. Such life cycles are characteristic of many familiar organisms: tadpoles become frogs, caterpillars metamorphose into butterflies and planktonic larvae settle to become sea stars, to name a few. Numerous parasite taxa also have complex life cycles in which more than one host is infected before reproducing. Some authors have considered metamorphosis a necessary part of a complex life cycle (Wilbur, Reference Wilbur1980), whereas others think that ontogenetic shifts in the niche are sufficient to call a cycle complex (Werner, Reference Werner, Ebenman and Persson1988). Parasitic nematodes, for example, may move between different niches (i.e. intermediate to definitive host) without dramatic changes in morphology, yet we generally consider multi-host nematodes to have a complex life cycle. It has been estimated that ‘perhaps 80% of animal species undergo a metamorphosis during the life cycle’ (Werner, Reference Werner, Ebenman and Persson1988) and many more exhibit ontogenetic niche shifts without metamorphosis. Thus, complex life cycles are very common, regardless of the exact definition.
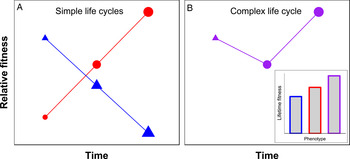
This ubiquity does not reflect frequent evolutionary transitions from simple to complex cycles. Rather, complex life cycles appear to be the ancestral state in several species rich clades [e.g. holometabolous insects (Wheeler et al. Reference Wheeler, Whiting, Wheeler and Carpenter2001; Wiegmann et al. Reference Wiegmann, Trautwein, Kim, Cassel, Bertone, Winterton and Yeates2009), amphibians (Reiss, Reference Reiss2002), cestodes and trematodes (Park et al. Reference Park, Kim, Kang, Kim, Eom and Littlewood2007; Perkins et al. Reference Perkins, Donnellan, Bertozzi and Whittington2010)], suggesting that complex life cycles may be so prevalent because they affect diversification rates (Yang, Reference Yang2001). The transition from a simple to a complex cycle has occurred independently in multiple phyla and such cycles have persisted over long-time spans, so there must be associated evolutionary advantages (Moran, Reference Moran1994). A leading idea for why complex life cycles evolved is the adaptive decoupling hypothesis (Fig. 1). Every individual organism is faced with a few vital tasks: growth, survival, dispersal, reproduction, offspring provisioning, etc. The adaptive decoupling hypothesis posits that a complex life cycle allows separate stages to specialize on different tasks. The idea was first raised in the context of ontogenetic changes in resource use (Istock, Reference Istock1967). Werner and Gilliam (Reference Werner and Gilliam1984) noted that as animals get bigger, what they can and do consume changes, and they suggested that switching from one resource to another evolves to maximize energy acquisition and overall growth rates. They also recognized that predation risk changes with body size, which would also influence niche shifts. The body plan that is most effective for exploiting one resource as a small juvenile need not correspond closely to the phenotype needed to feed on a different resource as a larger adult. Ebenman (Reference Ebenman1992) suggested that in this situation, selection should break apart the genetic correlations across ontogenetic stages, such that larval and adult feeding apparatuses could evolve independently in response to divergent selection pressures. The elimination of such design constraints is at the core of the adaptive decoupling hypothesis, and the idea extends beyond resource specialization. When different phenotypes are needed for different functions (i.e. feeding, dispersal, reproduction, etc.), a complex life cycle with metamorphosis is advantageous.
The adaptive decoupling hypothesis. The relative fitness of different phenotypes is plotted over time. In (A), there are two phenotypes with simple life cycles; they grow in size over time, but there is no major restructuring of the phenotype. The ‘triangle’ phenotype performs better as a small juvenile but is then outperformed by the ‘circle’ phenotype later in life. The fitness of a given phenotype can vary over time for many reasons, such as a change in foraging ecology (e.g. the optimal prey differs for small juveniles and larger adults), in predator risk or type (e.g. large sizes may provide a ‘size refuge’), or in required tasks (e.g. reproduction later in life or dispersal at the end of a season). This tradeoff between the phenotypes optimal for juveniles and those optimal for adults favours a complex life cycle. In (B), there is metamorphosis from the ‘triangle’ to the ‘circle’ phenotype, which maximizes lifetime fitness (inset). In order to produce distinct phenotypes in succession, the genetic and ontogentic covariance between life phases is broken apart, thereby allowing different stages to respond independently to unique selective pressures, i.e. they are adaptively decoupled.

The adaptive decoupling hypothesis may lead to the idea that what happens in one life cycle stage is irrelevant for other stages. However, the transition between life cycle stages, even when accompanied by a radical morphological transformation, does not represent a new beginning (Pechenik, Reference Pechenik2006; Brodin, Reference Brodin2009; Crean et al. Reference Crean, Monro and Marshall2011; Marshall and Morgan, Reference Marshall and Morgan2011; Stoks and Cordoba-Aguilar, Reference Stoks and Cordoba-Aguilar2012). The conditions experienced by larvae often have subtle and long-lasting effects on the adult phenotype. A variety of environmental variables have been shown to induce such carryover effects, including food quantity and quality (e.g. Twombly et al. Reference Twombly, Clancy and Burns1998; Phillips, Reference Phillips2002; Tigreros, Reference Tigreros2013), temperature (e.g. Álvarez and Nicieza, Reference Álvarez and Nicieza2002; Reim et al. Reference Reim, Teuschl and Blanckenhorn2006), density (e.g. Goater, Reference Goater1994; Alto et al. Reference Alto, Lounibos, Higgs and Juliano2005; Bouchard et al. Reference Bouchard, Leary, Wargelin, Charbonnier and Warkentin2016) and the presence of predators (e.g. Relyea, Reference Relyea2007; Stamper et al. Reference Stamper, Downie, Stevens and Monaghan2009). A number of life history models explore how environmental conditions affect when and at what size to transition between stages (Werner, Reference Werner1986; Rowe and Ludwig, Reference Rowe and Ludwig1991; Abrams and Rowe, Reference Abrams and Rowe1996; Abrams et al. Reference Abrams, Leimar, Nylin and Wiklund1996; Day and Rowe, Reference Day and Rowe2002; Rudolf and Rödel, Reference Rudolf and Rödel2007). An assumption here is that size and age are the traits to be optimized, because they predict success in the next habitat. The links between size, age and fitness, however, can be weak and context-dependent (Marshall and Keough, Reference Marshall and Keough2004; Rolff et al. Reference Rolff, de Meutter and Stoks2004; Van Allen et al. Reference Van Allen, Briggs, McCoy and Vonesh2010). For example, the size and age of emergence of larval damselflies predicts adult reproductive success, but less so than whether or not larvae were raised under nutritional or time constraints (De Block and Stoks, Reference De Block and Stoks2005). This tells us that, even with the massive tissue remodelling of metamorphosis, there are still links between life cycle stages, they are dependent on the environment, and they may not be reflected by the emergent life history traits of size and age at the transition between stages.
The goal of this review is to examine the connections between the different stages in parasite life cycles. Are they tightly integrated or essentially autonomous? The review is divided into two broad sections. First, how evolutionarily independent are parasite life cycle stages? The adaptive decoupling hypothesis suggests that parasite stages performing different functions in different hosts should be quite independent. Second, how ecologically independent are stages? The conditions experienced by a larval parasite in one host may still have consequences after transmission to subsequent hosts. Throughout, I draw on the larger literature from free-living organisms to inform expectations with parasites. My focus is often on trophically transmitted helminths, but the ideas generally apply to other parasites and types of transmission.
EVOLUTIONARY LINKS BETWEEN LIFE CYCLE STAGES
Genetic links between stages
Although the separate stages in a complex life cycle can occupy distinct niches and have radically different morphologies, they are still encoded by the same genome. Under the adaptive decoupling hypothesis, the genes shaping the phenotype of one stage should not have major effects on other stages, so that different stages can undergo independent evolutionary change. However, complete genetic decoupling between stages is unrealistic. For example, experimental selection for increased starvation resistance in adult Drosophila melanogaster negatively affects larval development and viability (Chippindale et al. Reference Chippindale, Chu and Rose1996), which shows that there are genetic correlations between traits expressed at different life stages. A genetic correlation is the covariance between two traits that is attributable to genetic factors (usually restricted to additive genetic effects; Roff, Reference Roff1997). Genetic correlations are caused either by linkage disequilibrium, i.e. the non-random association of alleles between loci that may result from drift, admixture, physical linkage and/or selection, or by pleiotropy, where a single gene affects multiple traits. Pleiotropy is thought to be more relevant as a long-term constraint, as linkage disequilibrium decays over time through recombination (Roff, Reference Roff1997).
Genetic correlations shape the phenotypic response to selection, a relationship that is formalized in the multivariate breeder's equation (Lande, Reference Lande1979):
 $$\eqalign{& \left[ {\matrix{ {z_1} \cr {z_2} \cr}} \right] = \left[ {\matrix{ {G_1} & {G_{12}} \cr {G_{12}} & {G_2} \cr}} \right]\left[ {\matrix{ {\beta _1} \cr {\beta _2} \cr}} \right]\,{\hbox {or generalizing beyond}} \cr & \quad \,{\hbox {the bivariate case}},\,\Delta \bar z = G\beta} $$
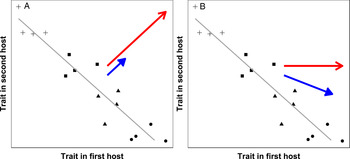
where z is the change in the value of traits 1 and 2 after one generation, β is the selection gradient on each trait, and G represents the additive genetic variance of each trait (G 1 and G 2) along with the genetic covariance between the traits (G 12). Two examples in Fig. 2 demonstrate how the phenotypic response to selection is influenced by the traits’ underlying genetic architecture, G. When the genetic covariance does not align with the direction of selection, evolutionary change will be slowed (Fig. 2A) or biased (Fig. 2B). In the context of complex life cycles, genetic correlations between stages are expected to be low and smaller than the genetic correlations within stages, because within a stage certain combinations of trait values will presumably optimize performance, e.g. the association of wings and large flight muscles in adult insects (Marden, Reference Marden2000). Nonetheless, significant genetic correlations across the metamorphic boundary have been detected in frogs (Watkins, Reference Watkins2001), fishes (Johnson et al. Reference Johnson, Christie, Moye and Hixon2011), marine invertebrates (Aguirre et al. Reference Aguirre, Blows and Marshall2014) and insects (Moran, Reference Moran1991; Fellous and Lazzaro, Reference Fellous and Lazzaro2011), but there are also cases in which stages appear genetically independent (Hilbish et al. Reference Hilbish, Winn and Rawson1993; Phillips, Reference Phillips1998). This mixed evidence suggests that the extent of genetic coupling between life cycle stages may depend on the species and the specific traits studied.
The effect of genetic covariance on the phenotypic response to selection. Symbols represent different genetic groups (e.g. clones, full-sibs, maternal half-sibs, etc.; the exact genetic relationships are important for calculating and interpreting genetic correlations, but not for demonstrating the concept). A parasite trait expressed in the first host is negatively genetically correlated with a trait measured in the second host. In (A), selection (red vector, open arrow) favours high values of both traits, such as if the traits were the infection rate in each of the two hosts. As selection is orthogonal to the genetic covariance, there will be a slow and limited response to selection (blue vector, closed arrow). In (B), there is only selection on the trait in the first host, but because of the genetic correlation, there will be an indirect, correlated response to selection in the trait in the second host.

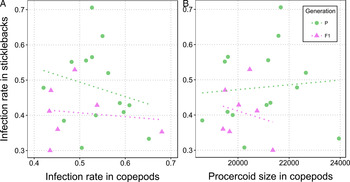
Controlled breeding and the production of genetically well-defined groups is logistically challenging for most parasites, so very few studies have quantified genetic correlations between stages in different hosts. Nonetheless, significant cross-stage genetic correlations have been reported. In the tapeworm Schistocephalus solidus, genetic sibships that had high infectivity and grew large in the copepod first host induced a lower innate immune response (respiratory burst) in the stickleback second host (Hammerschmidt and Kurtz, Reference Hammerschmidt and Kurtz2005a ). One explanation for this is that some genotypes are superior in avoiding or suppressing the innate immune response of both copepods and fish, perhaps via changes in the composition of the surface tegument, which is also genetically variable (Hammerschmidt and Kurtz, Reference Hammerschmidt and Kurtz2005b ). Traits more directly related to fitness (infectivity and growth), though, were not genetically correlated across hosts (Hammerschmidt and Kurtz, Reference Hammerschmidt and Kurtz2005a ). Another recent study followed several S. solidus full sib families through multiple generations, and while it did not explicitly test for genetic correlations, the data are suited to do so (Benesh et al. Reference Benesh, Weinreich, Kalbe and Milinski2014b ). Looking at just the outcrossed worms from that experiment (i.e. not inbred), there were not significant genetic correlations between performance in copepods and infectivity in sticklebacks (Fig. 3). The lack of a genetic correlation between growth in copepods and infection in fish is noteworthy (Fig. 3B), because a previous study found that larger worms in copepods are more likely to infect fish (Benesh et al. Reference Benesh, Weinreich and Kalbe2012). This inconsistency implies that non-genetic environmental factors underlie the size-infectivity relationship. In other words, big worms are not more likely to infect fish because of their genes. Instead, they may simply have been in higher-quality copepods, which enabled both a large size and high infectivity.
Genetic correlations across hosts in the tapeworm Schistocephalus solidus. Each point is the mean for a family of full siblings. Fourteen families were in the parental generation (P), and they were used to infect copepods, the first intermediate host, and then sticklebacks, the second intermediate host. These 14 families were then crossed in vitro to produce another seven families that constituted the F1 generation. There were no significant family-level correlations between (A) infection rates in copepods and fish (Pearson correlations, P generation: r = −0·22, P = 0·44, F1 generation: r = −0·13, P = 0·79) or (B) between growth in copepods and infectivity to fish (P generation: r = 0·09, P = 0·77, F1 generation: r = −0·22, P = 0·64). This can be attributed to the low heritability of infection rates (broad-sense H 2 = 0·01 to 0·03 for copepod and <0·01 for fish infection rates). The average sample sizes for calculating family means were 195 for copepod infection rate, 24 for size in copepods, and 25 for fish infection rate. Data from Benesh et al. (Reference Benesh, Weinreich, Kalbe and Milinski2014b ).

While there is some genetic integration across stages in S. solidus (Hammerschmidt and Kurtz, Reference Hammerschmidt and Kurtz2005a ), there do not seem to be tradeoffs between successive hosts, where genotypes that perform well in one host do poorly in the next host. Such tradeoffs have been identified in other parasites. Davies et al. (Reference Davies, Webster, Woolhous and Woolhouse2001) created five inbred strains of Schistosoma mansoni and found that strains performing better in snails (higher infectivity, higher cercarial production) performed worse in mice (lower infectivity, fewer miracidia produced). This tradeoff was confirmed by experimentally selecting S. mansoni for higher and lower cercarial production for three generations (Gower and Webster, Reference Gower and Webster2004). By the end of that experiment, worms in the ‘high’ lines produced more cercaria in snails but fewer miracidia in mice; the opposite was true of the ‘low’ lines (Gower and Webster, Reference Gower and Webster2004). Two strains of Fasciola hepatica also seem to trade off cercarial vs egg production (Walker et al. Reference Walker, Hoey, Fletcher, Brennan, Fairweather and Trudgett2006).
Tradeoffs in parasite performance between hosts are also relevant for applied issues, like the evolution of virulence. Selection for higher virulence in one host may be counteracted if this negatively affects the parasite in the next host (Gandon, Reference Gandon2004). This scenario has been investigated in rodent malaria. Ferguson et al. (Reference Ferguson, Mackinnon, Chan and Read2003) examined seven clones of Plasmodium chabaudi that varied in how strongly they decreased both mice and mosquito condition (i.e. how virulent they were). There was no genetic correlation between virulence in these two hosts; clones that were very virulent in mice were not those most detrimental to mosquitoes. Nonetheless, serial passage experiments suggest that mosquito transmission impedes the escalation of malaria's virulence in mammals (Mackinnon and Read, Reference Mackinnon and Read2004; Spence et al. Reference Spence, Jarra, Lévy, Reid, Chappell, Brugat, Sanders, Berriman and Langhorne2013). This demonstrates interdependence between consecutive life cycle stages, even though it is not caused by genetic covariance.
Additional studies are needed to assess the generality of cross-stage genetic correlations in parasite life cycles, but the limitations of such studies must also be recognized. The presence or absence of genetic correlations may be highly dependent on the traits studied and the context in which they are measured. For example, Louhi et al. (Reference Louhi, Karvonen, Rellstab and Jokela2013) noted a positive genetic correlation between the activity of eye fluke cercariae and their infectivity to fish, but the trend was transient (in just one of three time points) and context-dependent (only present when snail hosts fed ad libitum). Another concern with genetic correlations is their interpretation as evolutionary constraints (Houle, Reference Houle1991; Blows and Hoffmann, Reference Blows and Hoffmann2005; Roff and Fairbairn, Reference Roff and Fairbairn2007). In fact, the breeder's equation is only valid for predicting short-term evolutionary change, because selection alters the underlying genetic architecture (Lynch and Walsh, Reference Lynch and Walsh1998). Moreover, genetic effects may be extremely variable in parasites, because the relative performance of a parasite genotype frequently depends on the host genotype it infects (e.g. Webster and Woolhouse, Reference Webster and Woolhouse1998; Lively and Dybdahl, Reference Lively and Dybdahl2000; Grech et al. Reference Grech, Watt and Read2006; Lambrechts et al. Reference Lambrechts, Fellous and Koella2006; Wolinska and King, Reference Wolinska and King2009; Luijckx et al. Reference Luijckx, Ben-Ami, Mouton, Du Pasquier and Ebert2011). Genotype-by-genotype interactions imply that the presence or absence of a genetic correlation across parasite stages could be contingent on which host genotypes are infected.
It has become increasingly possible to examine how genes are transcribed throughout an organism's life, and in complex life cycle organisms many genes are expressed in stage-specific fashion (e.g. Arbeitman et al. Reference Arbeitman, Furlong, Imam, Johnson, Null, Baker, Krasnow, Scott, Davis and White2002; Hall et al. Reference Hall, Karras, Raine, Carlton, Kooij, Berriman, Florens, Janssen, Pain, Christophides, James, Rutherford, Harris, Harris, Churcher, Quail, Ormond, Doggett, Trueman, Mendoza, Bidwell, Rajandream, Carucci, Yates, Kafatos, Janse, Barrell, Turner, Waters and Sinden2005; Wygoda et al. Reference Wygoda, Yang, Byrne and Wray2014). For example, in the schistosome S. mansoni about 10% of the genes assayed with a microarray were significantly enriched in a particular developmental stage (Jolly et al. Reference Jolly, Chin, Miller, Bahgat, Lim, DeRisi and McKerrow2007). Sporocysts overexpress genes for protein synthesis as they build cercariae, the cercariae then primarily express genes involved in energy utilization, and finally adults overexpress genes needed for sexual differentiation, immune evasion and egg production (Jolly et al. Reference Jolly, Chin, Miller, Bahgat, Lim, DeRisi and McKerrow2007). Changes to the sequence or regulation of these stage-specific genes may primarily impact one stage and not others. While this is suggestive of decoupling, transcriptomic studies also indicate that a substantial number of genes are not preferentially expressed in a particular stage. Also, variation in transcript levels has a genetic component (Gilad et al. Reference Gilad, Rifkin and Pritchard2008; Mackay et al. Reference Mackay, Stone and Ayroles2009), so individuals with a genetic propensity to overexpress certain genes as larvae could differentially express the same or other genes as adults (i.e. through some level of co-regulation). Thus, stage-specific gene expression does not necessarily imply the absence of genetic correlations between stages.
One plausible route for reducing pleiotropy and decoupling life cycle stages is gene duplication followed by developmental specialization of different copies (Li et al. Reference Li, Yang and Gu2005; Auld and Tinsley, Reference Auld and Tinsley2015). For example, in Trypanosoma cruzi, the causative agent of Chagas disease, about 10% of paralogous genes exhibit stage-specific expression, in some cases with a clear divergence between stages in mammals and those in the insect vector (Minning et al. Reference Minning, Weatherly, Atwood, Orlando and Tarleton2009). A subfamily of surface glycoproteins has diversified in the genus Leishmania, presumably in response to the acquisition of a vertebrate host in addition to the insect vector (Jackson, Reference Jackson2010). Malaria parasites traverse host cells when invading both mammals and mosquitoes, generally using conserved molecular mechanisms (Kariu et al. Reference Kariu, Ishino, Yano, Chinzei and Yuda2006; Baum et al. Reference Baum, Gilberger, Frischknecht and Meissner2008), but different-yet-related membrane-disrupting proteins are critical for this process in each host (Kadota et al. Reference Kadota, Ishino, Matsuyama, Chinzei and Yuda2004). The expression of copies of two protease families (capthesin L and B) in F. hepatica changes as the trematode migrates from the intestine to the liver in accordance with the different substrates that need to be disrupted (Cwiklinski et al. Reference Cwiklinski, Dalton, Dufresne, La Course, Williams, Hodgkinson and Paterson2015). A family of heat-shock proteins (hsp70) has expanded in tapeworms and particular gene copies are mainly expressed in either intermediate or definitive host (Tsai et al. Reference Tsai, Zarowiecki, Holroyd, Garciarrubio, Sanchez-Flores, Brooks, Tracey, Bobes, Fragoso, Sciutto, Aslett, Beasley, Bennett, Cai, Camicia, Clark, Cucher, De Silva, Day, Deplazes, Estrada, Fernández, Holland, Hou, Hu, Huckvale, Hung, Kamenetzky, Keane and Kiss2013; Zheng et al. Reference Zheng, Zhang, Zhang, Zhang, Li, Lu, Zhu, Wang, Huang, Liu, Kang, Chen, Wang, Chen, Yu, Gao, Jin, Gu, Wang, Zhao, Shi, Wen, Lin, Jones, Brejova, Vinar, Zhao, McManus, Chen and Zhou2013). These studies suggest gene duplication and differential regulation of paralogues may be a common way for parasites to independently adapt to different hosts in the life cycle.
Interspecific trait correlations across stages
Over long-time spans, the genetic architecture connecting different life cycle stages can be disrupted as recombination erodes linkage disequilibrium and selection and mutation alter pleiotropic effects (Roff, Reference Roff1997). If each life cycle stage can evolve relatively freely in response to its own unique selection pressures, we may expect traits expressed in different stages to be uncorrelated on a phylogenetic scale. A clear case of such decoupling can be found in echinoderms; there have been radical and repeated changes in larval morphology (i.e. the loss of feeding larvae) with little consequence for adult morphology (Wray, Reference Wray1992; McEdward and Miner, Reference McEdward and Miner2001).
Parasite body size is central to models of life cycle evolution (Parker et al. Reference Parker, Chubb, Roberts, Michaud and Milinski2003a , Reference Parker, Chubb, Ball and Roberts b , Reference Parker, Ball and Chubb2009a ; Iwasa and Wada, Reference Iwasa and Wada2006; Ball et al. Reference Ball, Parker and Chubb2008). It can also be easily measured in multiple stages, and a few studies have examined the interspecific correlations between the sizes of different parasite stages. In trematodes (Poulin and Latham, Reference Poulin and Latham2003), acanthocephalans (Poulin et al. Reference Poulin, Wise and Moore2003a ; Benesh and Valtonen, Reference Benesh and Valtonen2007a ), and some cestodes (Benesh et al. Reference Benesh, Chubb and Parker2013), species with large larvae also have large adults. Does this apparent coupling reflect constraint, where a developmental trajectory producing large adults invariably produces large larvae? Or might life cycles that favour large adults also favour large larvae? There are ecological factors that could promote a correlation in body sizes between stages. When a trophically transmitted parasite infects a relatively large intermediate host, the next host is likely to be relatively large too, because predator and prey sizes tend to be positively correlated (Brose et al. Reference Brose, Jonsson, Berlow, Warren, Banasek-Richter, Bersier, Blanchard, Brey, Carpenter, Blandenier, Cushing, Dawah, Dell, Edwards, Harper-Smith, Jacob, Ledger, Martinez, Memmott, Mintenbeck, Pinnegar, Rall, Rayner, Reuman, Ruess, Ulrich, Williams, Woodward and Cohen2006; Bersier and Kehrli, Reference Bersier and Kehrli2008). This could simultaneously favour both large larvae and large adults, as big hosts commonly facilitate parasite growth (Morand et al. Reference Morand, Legendre, Gardner and Hugot1996; Arneberg et al. Reference Arneberg, Skorping and Read1998; Poulin et al. Reference Poulin, Wise and Moore2003a ; Trouvé et al. Reference Trouvé, Morand and Gabrion2003; Randhawa and Poulin, Reference Randhawa and Poulin2009; Benesh et al. Reference Benesh, Chubb and Parker2013).
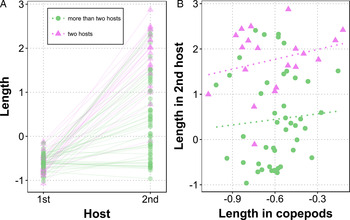
To help interpret these body size correlations, we can look for a case where adaptive decoupling is expected, i.e. parasites experience similar selective pressures on body size in one host, but divergent pressures in the subsequent host. Helminths that exploit similar trophic links tend to have similar size and age at infectivity, and those transmitted from copepods to fish, in particular, seem to have a common phenotype (Benesh et al. Reference Benesh, Chubb and Parker2011). Cestode species that infect copepods as first host exhibit consistently small larval sizes, but the size achieved in their next host is quite variable (Fig. 4A) and it is uncorrelated with size in copepods (Fig. 4B). Much of the size variation in the second host is explained by the host's role in the life cycle. If the second host is the definitive host, species tend to grow substantially, whereas if it is another intermediate host, species may or may not grow (Fig. 4). This example demonstrates that conditions in one host may favour a predictable body size, but this does not impose limits on the size attainable in the next host. Observing decoupling when it is expected is suggestive that body size correlations across stages at least partially reflect adaptation and not constraint.
The body length (in mm on a log10 scale) of 65 tapeworm species in their copepod first host and their vertebrate second host. Species are grouped according to whether they have a two-host life cycle (second host is definitive host) or a longer life cycle (second host is an intermediate host). In (A), the sizes of individual species are connected by lines. Note how the size variation in copepods is restricted compared with that in the next host. In (B), the relationship between worm size in the copepod host and in the second host is plotted. It was not significant (non-phylogenetic Pearson correlations, two hosts: r = 0·13, P = 0·58, more than two hosts: r = 0·10, P = 0·52). (D. P. Benesh, unpublished observation)

A few comparative studies have hinted at tradeoffs between different parasite stages. Tradeoffs at a phylogenetic scale suggest that some constraints are not easy to overcome, even on a geological timescale, and there are limits to the decoupling of life cycle stages. In the Taeniid tapeworms, species that undergo asexual reproduction as larvae, producing multiple infective individuals, go on to have smaller adults than species that do not (Trouvé et al. Reference Trouvé, Morand and Gabrion2003). A key caveat here is that a single asexual larva, e.g. a hydatid cyst containing hundreds of thousands of protoscoleces, can end up producing many clonal adults, which may in sum have a very large adult size (Moore, Reference Moore1981). Mammalian schistosome species that produce more cercariae in snails have lower rates of egg production as adults (Loker, Reference Loker1983). Though this tradeoff must be interpreted cautiously given the small sample size (five species), it has been supported by studies at the intraspecific level (Davies et al. Reference Davies, Webster, Woolhous and Woolhouse2001; Gower and Webster, Reference Gower and Webster2004).
Non-life-history traits like host specificity may also covary across stages. Parker et al. (Reference Parker, Ball and Chubb2015a , their box 4) showed how the range of intermediate hosts used by a parasite should expand if it increases transmission, whereas the range of definitive hosts should increase if it improves the expected fecundity. In both cases, the fitness boost must outweigh the ‘costs of generalism’ associated with the ability to exploit additional hosts. On the one hand, the different criteria for adding hosts at different life cycle stages highlight the potential for decoupling. On the other hand, their analysis also indicates the interdependencies of host range across stages. For example, if a trophically transmitted parasite gains the ability to use a certain species as intermediate host, it may then become favourable to be able to infect the predators of this new host. Moreover, ‘generalism costs’ may vary between stages. A larval stage that simply encysts likely has fewer hurdles to overcome when infecting novel hosts than a stage that interacts more intimately with its host. Thus, how host range should vary over the course of a life cycle is not obvious.
Palm and Caira (Reference Palm and Caira2008) found that trypanorynch tapeworms infected a wider range of hosts as larvae than as adults, a pattern that might apply to many fish helminths (Bellay et al. Reference Bellay, de Oliveira, Almeida-Neto, Lima Junior, Takemoto and Luque2013). They did not explicitly test the correlation between larval and adult host specificity, but noted ‘the degree of host specificity exhibited by the adult of a species was similar to, or greater than, that of its corresponding final larval stage’. Accordingly, when I analysed their data I observed a positive correlation (n = 63, Pearson correlation, P = 0·001); generalists tend to be generalists at both the larval and adult stage of the life cycle. The scatter in the data was considerable though (r 2 was just 0·16) and it was revealing. Some species were extreme generalists as larvae but highly host specific as adults, but the opposite scenario, generalist adults and specialized larvae, was rare. Perhaps reproduction limits host range expansion in adult trypanorynchs. An interesting analogue is found in aphids. Some aphids have complex life cycles where they switch between primary host plants, where sexual reproduction occurs, and secondary host plants, where they just feed. In one group of aphids (subfamily Aphidinae), evolving a complex life cycle is associated with evolving a wider range of host plants, presumably because aphids are freed from constraints associated with sexual reproduction on secondary plants and may thus be able to exploit more of them (Hardy et al. Reference Hardy, Peterson and von Dohlen2015). In contrast to trypanorhynchs and aphids, digeneans seem more host specific as larvae than as adults (mollusc intermediate hosts vs fish definitive hosts) (Cribb et al. Reference Cribb, Bray and Littlewood2001), so sex need not limit host ranges to be smaller for adults than for larvae. Similar to trypanorhynchs, though, digenean families that have been reported from a broader taxonomic range of molluscs also infect a wider range of fish families (n = 32, Pearson correlation r = 0·61, P < 0·01; data from Table 1 in Cribb et al. Reference Cribb, Bray and Littlewood2001), though study effort is an important confounding variable here (partial correlation with the number of studied trematode species in each family as a control variable, r = 0·38, P = 0·035). These studies raise many questions. Do host range expansions at one stage concomitantly favour expansions at other stages? Are the mechanisms used to infect hosts at different life stages the same? If so, this might lower the ‘generalism costs’ associated with expanding the host range at multiple stages simultaneously. And how important are sampling biases, where widespread, frequently sampled parasites may be reported from more hosts as both larvae and adults (e.g. Poulin, Reference Poulin1992)?
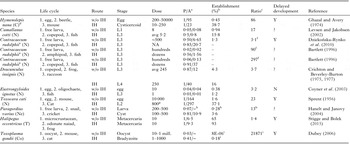
Studies on how transmission with or without an intermediate host (IH) affects establishment probability and development

The two transmission routes compared are indicated by the ‘life cycle’ column; transmission to the target host (3) occurs either via a facultative intermediate host (2→3) or without it (1→3).
a P, prevalence; A, abundance.
b The percent of infective stages given that successfully established in the target host.
c The ratio of establishment probabilities. It is the fold increase in establishment probability associated with transmission via the facultative intermediate host.
d C, Cestoda; N, Nematoda; Ne, Nematomorpha; T, Trematoda; Co, Coccidea.
e The two studies on Contracaecum rudolphii in all likelihood involve different cryptic species.
f Exact doses were not given, so establishment probabilities could not be calculated. These values are the ratio of abundances, which implicitly assumes that the dose was the same in both groups. The infection dose given via the intermediate host was probably lower, though, perhaps up to an order of magnitude lower, so these values presumably underestimate the boost in establishment associated with the intermediate host route and should be considered minimums.
g The number of L2s given was not quantified exactly. Two infected mice were given to each cat, and this is the average expected dose based on infection rates in 11 mice.
h The only worms obtained via the direct route were degraded as a consequence of host death, so abundance could not be calculated. Establishment probability was thus calculated assuming infection intensities were the same in both groups. This most likely overestimates the establishment rate by direct infection.
i Calculated assuming that each patent infection arose from a single infective stage. If multiple infectious propagules established, this would increase the establishment probabilities, and perhaps alter the ratio.
Comparative studies of traits measured in different parasite stages are still rare, but it is worth mentioning that the transition from one host to the next is often not accompanied by major phenotypic changes. For example, the proboscises of acanthocephalans (Crompton and Nickol, Reference Crompton and Nickol1985) and the tentacles of trypanorhynchs (Palm, Reference Palm2004) are unchanged from the larval to the adult stage, such that even larval stages can be identified to species using these attachment structures. Noting the coupling of larval and adult morphology in such cases feels almost frivolous, yet it raises the question of how to interpret it. In this example, the congruence of larval and adult morphology is probably advantageous (i.e. larvae have the exact morphology needed to successfully attach to the next host's gut the moment they are transmitted), but it could also be neutral (i.e. producing these structures is of little consequence for larvae) or even disadvantageous (i.e. decoupling is favoured but constrained for some reason).
Loss of life cycle stages
Severing the genetic and ontogenetic linkages between life cycle stages could make it easier to eliminate a stage, as this need not have major ramifications for other stages (Moran, Reference Moran1994). However, adaptive decoupling could also hamper stage loss in some circumstances (see subsection ‘Functional constraints on stage loss’). Among free-living animals, there are many examples of stages being dropped from complex life cycles. Numerous salamanders never leave their larval habitat (dropped the adult stage) (Wiens et al. Reference Wiens, Bonett and Chippindale2005) and there are frogs that develop directly (dropped the larval tadpole stage) (Elinson and del Pino, Reference Elinson and del Pino2012). The majority of echinoderms have planktonic larvae, but a few skip this stage and develop directly into adults (McEdward and Miner, Reference McEdward and Miner2001). In hydrozoan cnidarians, the sexual medusa stage has been lost multiple times (Govindarajan et al. Reference Govindarajan, Boero and Halanych2006; Cartwright and Nawrocki, Reference Cartwright and Nawrocki2010) and there are also cases of the larval polyp stage being eliminated (Collins, Reference Collins2002; Collins et al. Reference Collins, Bentlage, Lindner, Lindsay, Haddock, Jarms, Norenburg, Jankowski and Cartwright2008).
Life cycle truncation has also occurred in various parasitic taxa. In cestodes, the life cycle has been condensed to a single host a few times, but this reduction has happened in different ways (Mackiewicz, Reference Mackiewicz1988). The dwarf tapeworm Hymenolepis nana (syn. Vampirolepis nana) can forgo infecting its first host, a beetle, and directly infect its final host, a mouse (Hunninen, Reference Hunninen1935). By contrast, worms in the genus Archigetes mature and produce eggs in what would normally be their intermediate host, an oligochaete, and can thus bypass the final fish host (Calentine, Reference Calentine1964; Kennedy, Reference Kennedy1965). Precocious egg production is also found in some spathebothrid tapeworms that infect gammarids (Sandeman and Burt, Reference Sandeman and Burt1972). Similarly, a few nematodes precociously reproduce in what is normally an intermediate host (Anderson, Reference Anderson1988; Yoshinaga et al. Reference Yoshinaga, Ogawa and Wakabayashi1989; Appy and Butterworth, Reference Appy and Butterworth2011). Others are capable of directly infecting the final vertebrate host without an intermediate host. For example, the nematode Camallanus cotti can directly infect fish in aquaria, a setting where copepods, the usual first hosts, are lacking (Levsen and Jakobsen, Reference Levsen and Jakobsen2002). Additional nematode species capable of this type of life cycle truncation can be found in the capillarids (Moravec et al. Reference Moravec, Prokopic and Shlikas1987), ascarids (Sprent, Reference Sprent1958; Kazacos, Reference Kazacos, Samuel, Pybus and Kocan2001), and metastrongylids (Dunsmore and Spratt, Reference Dunsmore and Spratt1979). Trematodes have dropped hosts from their life cycles on numerous occasions; Poulin and Cribb (Reference Poulin and Cribb2002) estimated that some form of life cycle truncation has occurred at least 20 times in their evolutionary history. Progenesis, production of eggs in an intermediate host, is the most common way trematode life cycles have been shortened, and this truncation may or may not be facultative (Smythe and Font, Reference Smythe and Font2001; Lefebvre and Poulin, Reference Lefebvre and Poulin2005). Vertebrate predators are the usual definitive hosts of sarcocystid coccidians, but they have been dropped from some life cycles (Matuschka and Bannert, Reference Matuschka and Bannert1987; Koudela and Modrý, Reference Koudela and Modrý2000; Slapeta et al. Reference Slapeta, Modry, Votypka, Jirku, Koudela and Lukes2001). The coccidian Toxoplasma gondii has an especially flexible life cycle. It can be transmitted from one intermediate host to another, a feature that has perhaps shaped its recent evolutionary history (Su et al. Reference Su, Evans, Cole, Kissinger, Ajioka and Sibley2003), but it can also be transmitted directly between feline definitive hosts without an intermediate host (Frenkel and Dubey, Reference Frenkel and Dubey2000).
Although the above examples demonstrate the lability of complex life cycles, such changes have occurred against a background of stability (Moran, Reference Moran1994). In many groups, particular stages have never been eliminated from the life cycle. For instance, there are no frogs known to reproduce as tadpoles (Elinson and del Pino, Reference Elinson and del Pino2012), and a starkly reduced larval phase in holometabolous insects is very rare (Denlinger and Ma, Reference Denlinger and Ma1974). All acanthocephalans require an intermediate host (Schmidt, Reference Schmidt, Crompton and Nickol1985), and though some achieve an advanced state of sexual development in the intermediate host (Crompton, Reference Crompton, Crompton and Nickol1985; Benesh and Valtonen, Reference Benesh and Valtonen2007a ), none are known to shorten the life cycle by progenesis. Assuming life cycle simplification is advantageous for a given species, what prevents it? Next, I discuss constraints on life cycle simplification resulting: (i) from the coupling of stages through ontogeny and (ii) from the decoupling of functions among stages.
Developmental constraints on stage loss
From an ontogenetic perspective, the tissues in young, larval stages become those of older adult stages, so that passing through a larval phase may be a necessary step on the way to producing a functional reproductive adult. For this reason, modifying early life stages was once thought to be more problematic than modifying adult stages (e.g. ‘ontogeny recapitulates phylogeny’; Haeckel, Reference Haeckel1868). This orthodoxy has long since been discarded (Gould, Reference Gould1977). For example, elimination of the larval phase in sea urchins has involved considerable reorganization of early development, including when, where and how strongly different regulatory genes are expressed (Raff and Byrne, Reference Raff and Byrne2006). Nonetheless, the complete subjugation and/or replacement of larval features may still be an obstacle to simplifying a life cycle. Frog metamorphosis is dependent on thyroid hormone (Denver and Middlemis-Maher, Reference Denver and Middlemis-Maher2010), and in direct-developing species that have eliminated the tadpole stage, many of the hormone-dependent pathways are still essential for ontogenesis (‘cryptic metamorphosis’; Callery et al. Reference Callery, Fang and Elinson2001). Similar recapitulation seems to occur in some parasites. When H. nana eggs are ingested by a mouse, the hatched worms penetrate into intestinal villi and develop into cysticercoids, the stage normally found in the beetle intermediate host. They then re-emerge in the gut to reproduce (Hunninen, Reference Hunninen1935). The extensive tissue migration of some nematodes in vertebrates has also been interpreted as legacies of life cycle modification (discussed by Sukhdeo et al. Reference Sukhdeo, Sukhdeo, Black and Vrijenhoek1997). Migrators are larger than their non-migrating relatives (Read and Skorping, Reference Read and Skorping1995), suggesting tissue migration may be beneficial in terms of growth (Parker et al. Reference Parker, Ball and Chubb2009b ) or immune evasion (Mulcahy et al. Reference Mulcahy, O'Neill, Fanning, McCarthy and Sekiya2005) and not simply a historical contingency. The retention of larva-specific developmental pathways and the production of larval phenotypes, even after this stage has been reduced or eliminated, hints at the ontogenetic integration between successive life cycle stages.
To shift sexual reproduction to the larval stage, i.e. to drop the adult stage, the timing of maturation needs to be adjusted. When to mature is regulated by factors both extrinsic (temperature, photoperiod, humidity) and intrinsic (size, age, condition) to an organism. The trigger for the tapeworms S. solidus and Ligula intestinalis to mature is the elevated temperature associated with moving from an ectothermic fish intermediate host (rarely in waters warmer than 20°C) to an endothermic bird definitive host (40°C) (Smyth, Reference Smyth1949, Reference Smyth1952; Cooper et al. Reference Cooper, Crites and Sprinkle-Fastkie1978 gives a comparable nematode example). Other trophically transmitted helminths require exposure to bile salts (Moorthy, Reference Moorthy1938; Berntzen and Mueller, Reference Berntzen and Mueller1964; Graff and Kitzman, Reference Graff and Kitzman1965; De Rycke and Berntzen, Reference De Rycke and Berntzen1967; Jakobsen et al. Reference Jakobsen, Scharsack, Hammerschmidt, Deines, Kalbe and Milinski2012) or digestive proteases (Iglesias et al. Reference Iglesias, Valero, Benítez and Adroher2001; Espinoza et al. Reference Espinoza, Galindo, Bizarro, Ferreira, Zaha and Galanti2005) in the gut of their next host to stimulate further development. In these cases, the proximate stimuli for maturation are simply not present in the intermediate host, and precocious reproduction would seem to require substantial changes to how maturation is initiated.
Many precociously reproducing trematodes do so facultatively, providing an opportunity to examine the stimuli for reproduction in what is ordinarily a larval stage. The trematode Coitocaecum parvum can reproduce in an amphipod, normally the second intermediate host, or in a fish, the usual definitive host. The decision to reproduce precociously in the second host is affected by a variety of factors, several of which would plausibly also affect maturation in the fish host [e.g. temperature (Poulin, Reference Poulin2003), resource availability (Lagrue and Poulin, Reference Lagrue and Poulin2007, Reference Lagrue and Poulin2008; Daniels et al. Reference Daniels, Beltran, Poulin and Lagrue2013), worm age (Lagrue and Poulin, Reference Lagrue and Poulin2009a )]. The trematode also suppresses progenesis when exposed to kairomones from the definitive host (Poulin, Reference Poulin2003; Lagrue and Poulin, Reference Lagrue and Poulin2007, Reference Lagrue and Poulin2009a ). The mechanisms by which worms perceive these chemical signals are unknown, but it is not obvious that the same cues would exist in the gut of the fish definitive host, raising the possibility that this trematode has adopted novel cues for deciding whether to reproduce in an intermediate host. In contrast, chemical signals from the definitive host do not affect progenesis in another trematode, Stegodexamene anguillae (Herrmann and Poulin, Reference Herrmann and Poulin2012). In this species, progenesis varies seasonally and increases with temperature (Herrmann and Poulin, Reference Herrmann and Poulin2011a , Reference Herrmann and Poulin b ), and such environmental factors conceivably affect worm maturation in both the intermediate host (small fish, such as bullies) and the definitive host (eels). Where S. anguillae encysts in the intermediate host has a major effect on whether or not a worm will be progenetic (Poulin and Lefebvre, Reference Poulin and Lefebvre2006; Herrmann and Poulin, Reference Herrmann and Poulin2011a ), and it would be interesting to know if this site-dependence is underpinned by stimuli unique to the intermediate host or whether the same factors also operate in the gut of the definitive host.
Functional constraints on stage loss
The adaptive decoupling hypothesis posits that the separation of functions among stages is a major advantage of complex life cycles. However, functional decoupling can strongly constrain life cycle simplification, because a stage adapted for one function may be unable to easily take over the functions of a reduced or eliminated stage. For helminths, there are obstacles to moving reproduction from definitive to intermediate hosts. Larval worms are usually found in the tissues of their intermediate host instead of the gut lumen (Chubb et al. Reference Chubb, Ball and Parker2010), presumably because this microhabitat is better for growth and survival (Read and Skorping, Reference Read and Skorping1995; Parker et al. Reference Parker, Ball and Chubb2009b ). However, this limits the ability of worms to reproduce, because they are faced with the problem of how to release eggs into the external environment. One solution is to rely on intermediate host death, often via predation, to liberate gravid worms stuck in the tissues (Pampoulie et al. Reference Pampoulie, Lambert, Rosecchi, Crivelli, Bouchereau and Morand2000; McLaughlin et al. Reference McLaughlin, Marcogliese and Kelly2006), another is to migrate into the host's gut (Corkum and Beckerdite, Reference Corkum and Beckerdite1975). Progenetic individuals of the aforementioned trematode S. anguillae occupy the gonads of its fish host and are released into the environment when the fish spawn (Herrmann and Poulin, Reference Herrmann and Poulin2011a ). Even if the egg release problem is overcome, the potential for sexual reproduction and genetic admixture is likely lower in intermediate hosts compared with definitive hosts (Brown et al. Reference Brown, Renaud, Guegan and Thomas2001; Rauch et al. Reference Rauch, Kalbe and Reusch2005; Keeney et al. Reference Keeney, Waters and Poulin2007; Lagrue et al. Reference Lagrue, Poulin and Keeney2009; Gorton et al. Reference Gorton, Kasl, Detwiler and Criscione2012; Herrmann et al. Reference Herrmann, Poulin, Keeney and Blasco-Costa2014; Kasl et al. Reference Kasl, McAllister, Robison, Connior, Font and Criscione2015). Though inbreeding has its advantages (Fisher, Reference Fisher1941), and for some parasites it may not even be costly in the short-term (Lagrue and Poulin, Reference Lagrue and Poulin2009b ), it is likely to have negative long-term consequences. Poulin and Cribb (Reference Poulin and Cribb2002) noted that trematode lineages in which sex is impaired by life cycle abbreviation (e.g. worms are encysted and forced to self-fertilize) have not diversified extensively, presumably because they are more likely to go extinct (e.g. Goldberg et al. Reference Goldberg, Kohn, Lande, Robertson, Smith and Igić2010). Life cycle simplifications that reduce sex or gene flow have also been presumed to affect lineage diversification and persistence in cnidarians (Leclere et al. Reference Leclere, Schuchert, Cruaud, Couloux and Manuel2009), aphids (Hardy et al. Reference Hardy, Peterson and von Dohlen2015), gastropods (Jablonski and Hunt, Reference Jablonski and Hunt2006) and urchins (McMillan et al. Reference McMillan, Raff and Palumbi1992; Jeffery and Emlet, Reference Jeffery and Emlet2003).
Dropping an intermediate host from a parasite life cycle also involves overcoming functional constraints. Major growth and development often takes place in intermediate hosts, with parasites forming the structures needed to establish in the next host (e.g. suckers, tegumental changes, mitochondria proliferation, etc.) and accumulating energy reserves (Hopkins, Reference Hopkins1952; Heyneman and Voge, Reference Heyneman and Voge1957; Archer and Hopkins, Reference Archer and Hopkins1958; Vickerman, Reference Vickerman1965). Presumably, there is a threshold level of resources or development that must be attained in order to successfully deal with the challenges of infecting a new host. In other words, growth and development in the intermediate host serves, to some degree, to pay the ‘overhead costs’ (Day and Rowe, Reference Day and Rowe2002) associated with establishing in the next host. One line of evidence for such costs is that some trophically transmitted parasites have higher infection rates when they are directly injected into their preferred site than when they are orally inoculated, presumably because they need not expend energy avoiding digestion, migrating through the host and/or evading intestinal immune responses (Froyd and Round, Reference Froyd and Round1960; Brandt and Eberhard, Reference Brandt and Eberhard1990; Smith et al. Reference Smith, Elarifi, Wootten, Pike and Burt1990; Verástegui et al. Reference Verástegui, González, Gilman, Gavidia, Falcón, Bernal and Garcia2000; but see Lackie, Reference Lackie1972). Parasites that facultatively skip an intermediate host appear less able to pay these overhead costs, as they often have dramatically lower establishment rates, and in some cases slower development, when they are not transmitted via an intermediate host (Table 1). A simplified life cycle may even just be viable when the hurdles to infection have been lowered. For example, the bile duct tapeworm, Hymenolepis microstoma, can complete a direct life cycle without its beetle first host only when the rodent definitive host is immunodeficient (Andreassen et al. Reference Andreassen, Ito, Ito, Nakao and Nakaya2004). These studies demonstrate that even though intermediate hosts may not be obligating for a given parasite species, they certainly can be beneficial in terms of putting the machinery in place to infect the next host.
In free-living animals, the process of metamorphosis is energetically expensive (e.g. Pandian and Marian, Reference Pandian and Marian1985; Bryan, Reference Bryan2004; Geffen et al. Reference Geffen, van der Veer and Nash2007; Merkey et al. Reference Merkey, Wong, Hoshizaki and Gibbs2011) and can increase the risk of mortality (Wassersug and Sperry, Reference Wassersug and Sperry1977), i.e. they also face overhead costs associated with the transition from the larval to the adult niche. Eliminating a larval stage implies that these costs must be covered by the earlier life stage, generally the eggs. Accordingly, a reduced larval stage is associated with the evolution of larger eggs in amphibians (Wake and Hanken, Reference Wake and Hanken1996; Callery et al. Reference Callery, Fang and Elinson2001; Elinson and del Pino, Reference Elinson and del Pino2012) and marine invertebrates (Thorson, Reference Thorson1950; Marshall et al. Reference Marshall, Krug, Kupriyanova, Byrne and Emlet2012). Fitting this trend, trematode species have larger cercariae if they encyst on a substrate instead of infecting an invertebrate second intermediate host (Koehler et al. Reference Koehler, Brown, Poulin, Thieltges and Fredensborg2012). However, cercariae encysting on substrates are still smaller than those targeting vertebrate hosts (Koehler et al. Reference Koehler, Brown, Poulin, Thieltges and Fredensborg2012). The tapeworm H. nana does not need to infect a beetle first host, but its eggs are not conspicuously bigger than those of other hymenolepid tapeworms in rodents [H. nana eggs: 45–58 µm in diameter (Kriska, Reference Kriska1993), combined range for four related species: 44–98 µm (Joyeux and Baer, Reference Joyeux and Baer1936; Dvorak et al. Reference Dvorak, Jones and Kuhlman1961; Tenora and Murai, Reference Tenora and Murai1970; Tinkle, Reference Tinkle1972; Hunkeler, Reference Hunkeler1974; Casanova et al. Reference Casanova, Santalla, Durand, Vaucher, Feliu and Renaud2001)]. The association between parasite propagule size and the reduction of larval stages deserves more attention, because it is unclear whether parasite propagules, eggs in particular, can easily increase in size to the point that they compensate for a lost larval phase (Jennings and Calow, Reference Jennings and Calow1975).
The distribution of paratenicity within helminth life cycles also hints at the dependencies between growth, development, and the ability to drop an intermediate host from the life cycle. By definition, no parasite development occurs in paratenic hosts (Roberts et al. Reference Roberts, Janovy and Nadler2013), and for this reason paratenic hosts are usually considered facultative. Tangentially, classifying a host as paratenic is not straightforward. Some of the facultative hosts in Table 1 have been considered paratenic (Crichton and Beverley-Burton, Reference Crichton and Beverley-Burton1977; Stigge and Bolek, Reference Stigge and Bolek2015), but infecting them clearly increases establishment in the target host, suggesting some level of cryptic, yet important development occurs. Thus, in terms of physiological necessity for parasites, intermediate hosts occur along a continuum, from ‘obligate’ on one end (i.e. typical intermediate host) through ‘non-obligate but beneficial’ to ‘facultative with no physiological benefit’ (i.e. classic paratenic host) on the other end. Paratenic hosts tend to occur in the middle of parasite life cycles rather than at the beginning, as second or third host instead of the first (Chubb et al. Reference Chubb, Ball and Parker2010). Helminths often enter the first host as small, undifferentiated propagules, so some growth and morphogenesis may be required to be able to infect the next host (Parker et al. Reference Parker, Ball and Chubb2015b ). As a consequence, parasites typically arrive in second hosts at a larger size and more advanced state of development, perhaps making it feasible for them to forego such hosts altogether. In other words, by producing a functional, infective larva in the first host (i.e. paying the overhead costs), parasites are able to treat the second intermediate host as paratenic and facultative. This could be tested by looking at whether paratenicity is more common when parasites enter an intermediate host at a larger size or a more developed state. It should be noted, though, that there are additional factors besides size at infection that are thought to affect paratenicity, like intensity, host mortality, parasite-induced host mortality and parasite growth prospects (Parker et al. Reference Parker, Ball and Chubb2009a ).
In complex life cycles, it is common to find stages with reduced, yet specialized functionality. Consider paratenic hosts. Parasites forgo growth and development in them, but they are often still crucial for transmission, hence their reputation as transport hosts or ecological bridges (Morand et al. Reference Morand, Robert and Connors1995; Parker et al. Reference Parker, Ball and Chubb2009a ). Presumably, this function, transportation, cannot be easily re-allocated to other life cycle stages (Choisy et al. Reference Choisy, Brown, Lafferty and Thomas2003; Benesh et al. Reference Benesh, Chubb and Parker2014a ), and this contributes to the retention of paratenic hosts in parasite life cycles. Another example is the short-lived, non-feeding stages found in a wide range of taxa [e.g. the larvae of many marine invertebrates (Thorson, Reference Thorson1950), adult mayflies (Brittain, Reference Brittain1982), the phoretic stage of astigmatid mites (Walter and Proctor, Reference Walter and Proctor2013), some parasitic copepods (Hendler and Dojiri, Reference Hendler and Dojiri2009); see Moran, Reference Moran1994 and Benesh et al. Reference Benesh, Chubb and Parker2013 for additional references]. Some pseudophyllidean tapeworms (Schistocephalus, Ligula and relatives) are a particularly counterintuitive case. When they arrive in their definitive hosts, piscivorous birds, they mature within a few days and then spend 1–2 weeks reproducing without any growth (Dubinina, Reference Dubinina1980), even though they presumably have access to an abundance of nutrients in a bird's gut. These worms attain a massive larval size and Benesh et al. (Reference Benesh, Chubb and Parker2013) provided comparative evidence that they have achieved or even surpassed an optimal size for reproduction already in their intermediate host. In essence, the larval niche (the body cavity of a fish) is so conducive to growth that additional growth in the adult niche (bird gut) may be maladaptive, given the associated delay in reproduction. Although worms forgo growth, infecting a bird may still serve other essential functions, such as aiding dispersal (Stefka et al. Reference Stefka, Hypsa and Scholz2009; but see Sprehn et al. Reference Sprehn, Blum, Quinn and Heins2015), finding mates (Schjørring, Reference Schjørring2004) or simply allowing the parasite to excrete its eggs into the external environment. The evolutionary maintenance of highly specialized life cycle stages supports the notion of adaptive decoupling, in that different stages are adapted for different tasks, but it also suggests that stage loss and life cycle simplification may be strongly checked by this specialization.
Summary
Evidence for the adaptive decoupling hypothesis can be sought at multiple scales. On a microevolutionary scale, genetic correlations can couple parasite life cycle stages, in that selection on a stage in one host may result in correlated evolutionary changes to stages in later hosts. At a macroevolutionary scale, comparative analyses can assess whether traits expressed in different hosts are correlated, which, given the longer time frame, suggests rather persistent coupling between stages. Nonetheless, it can be difficult to decipher whether interspecific correlations represent constraint or adaptation (Revell et al. Reference Revell, Harmon and Collar2008). At both intra- and interspecific scales, there are examples for and against the notion of decoupled traits. The evolutionary loss of life cycle stages has occurred in numerous parasite taxa. Life cycle simplification is presumably facilitated by having stages that are genetically and developmentally independent. However, the functional specialization of decoupled stages can also hinder stage loss, as a stage adapted for one function may be unable to subsume another stage's functions. A key decision when testing the adaptive decoupling hypothesis is choosing which traits to investigate. The most obvious traits to measure are growth, survival and reproduction, because they are fitness components and because they are emergent properties of many other traits that affect, e.g. resource acquisition and allocation. However, more proximate traits may also be interesting, particularly traits that are homologous from host to host (e.g. outer tegument) but face different selection pressures (e.g. different immune systems). Traits manifested in just one stage should also not be overlooked, as it is still possible for them to be linked to other traits expressed later in the life cycle.
ECOLOGICAL LINKS BETWEEN LIFE CYCLE STAGES
Skipping a life cycle stage is often a facultative strategy and dependent on environmental conditions. The environment can also affect complex life cycle organisms more subtly, in that the conditions experienced as a larva can have long-lasting effects on the next life cycle stage. These are called latent or carryover effects (O'Connor et al. Reference O'Connor, Norris, Crossin and Cooke2014). In free-living organisms, a wide range of larval stressors, including temperature, salinity, pollutants, density and resource quantity/quality, have been shown to impact adults in a myriad of ways (reviews by Pechenik, Reference Pechenik2006; Marshall and Morgan, Reference Marshall and Morgan2011). Thus, despite drastic morphological changes, metamorphosis is not a reset button and a poor start in life can carry over into later life stages. From a parasite's perspective, is transmission a new beginning? Or does being in a poor-quality intermediate host have consequences for later stages in the life cycle? Clearly, not every aspect of a parasite is renewed upon transmission. Variation in energy reserves, physiological damage, pollutant accumulation or epigenetic modifications could all persist and affect a parasite in its next host.
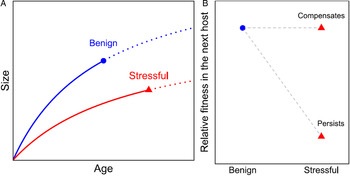
In life history models, carryover effects are assumed to be predicated by size and age at metamorphosis (e.g. Rowe and Ludwig, Reference Rowe and Ludwig1991; Abrams et al. Reference Abrams, Leimar, Nylin and Wiklund1996; Day and Rowe, Reference Day and Rowe2002; Parker et al. Reference Parker, Chubb, Roberts, Michaud and Milinski2003a ; Iwasa and Wada, Reference Iwasa and Wada2006). Individuals that transition at small sizes and/or old ages are likely to have been in poorer larval conditions, and are thus expected to experience negative carryover effects as adults (Fig. 5). However, how well size/age reflect larval stress is unclear, given that different types of stressors can affect growth and development in different ways (Rolff et al. Reference Rolff, de Meutter and Stoks2004; De Block and Stoks, Reference De Block and Stoks2005; Van Allen et al. Reference Van Allen, Briggs, McCoy and Vonesh2010). The detection of carryover effects may also depend on when adult traits are measured (Podolsky and Moran, Reference Podolsky and Moran2006). For example, if adult parasite traits like fecundity are measured shortly after transmission to the definitive host, the lingering effect of the larval environment may be prominent. As more time passes after transmission, parasites presumably have more opportunity to compensate for a poor start in life (Fig. 5). Below, I describe some environmental factors affecting larval parasite phenotypes, focusing mainly on growth and development, given the presumed fitness-relevance of those traits. Then, I note whether stressful conditions have been shown to have short- or long-term effects in the next host, as well as whether such effects are related to size and age at transmission.
(A) Hypothetical growth trajectories of a parasite in its intermediate host. Growth is slower and the development of infectivity (where the curves transition from solid to dotted) is delayed under stressful conditions. This is a common response to nutritional stress, such as a crowded infection or a starved host, but numerous other factors could stress larval parasites, including e.g. thermal stress, pollutants or host immunity, and these stressors need not affect growth and development in the same way. (B) The negative effects of being in a poor quality intermediate host can persist into the next host, i.e. there are carryover effects. It is also possible that once parasites are in a new host, they compensate for a stressful larval period, particularly if the trait of interest is measured long after transmission.

Resource availability – crowding
In numerous helminths, sharing an intermediate host with conspecifics results in smaller larval sizes (see Benesh, Reference Benesh2011 and references therein; Weinersmith et al. Reference Weinersmith, Warinner, Tan, Harris, Mora, Kuris, Lafferty and Hechinger2014 gives a counterexample). Such crowding effects are generally thought to be caused by competition for nutrients or even space (Parker et al. Reference Parker, Chubb, Roberts, Michaud and Milinski2003a ), but they could also be mediated by a density-dependent host response or by interference competition among parasites. Crowding may also occur between species, where infection with one parasite species reduces the growth of another (e.g. Dezfuli et al. Reference Dezfuli, Giari and Poulin2001; Fredensborg and Poulin, Reference Fredensborg and Poulin2005). When short on resources, larval parasites may make strategic allocation decisions. For example, in the rat tapeworm Hymenolepis diminuta, the size of the cercomer shrinks markedly when resources are limited, whereas the dimensions of the scolex are rather invariant, implying the latter is the more critical structure (Shostak et al. Reference Shostak, Walsh and Wong2008). This indicates that larval parasites can be subject to limiting resources, potentially resulting in carryover effects in the next host, but it also suggests that any negative effects of larval resource limitation could be somewhat buffered by phenotypic plasticity.
There are short-term consequences of larval crowding in some cases, as individuals from heavy infections in the intermediate host are worse at infecting the next host (Rosen and Dick, Reference Rosen and Dick1983; Steinauer and Nickol, Reference Steinauer and Nickol2003). Crowding also affects the fecundity of precocial worms that reproduce shortly after transmission to the definitive host. Fredensborg and Poulin (Reference Fredensborg and Poulin2005) excysted trematode metacercariae in vitro and found that their fecundity was lower when worms came from crab intermediate hosts with high-intensity infections (Brown et al. Reference Brown, De Lorgeril, Joly and Thomas2003 reported a similar finding in a different trematode species) and when worms co-infected the intermediate host with an acanthocephalan species (see Wang et al. Reference Wang, Renaud and Thomas2002 for a comparable result). Thus, both inter- and intraspecific interactions can carry over to affect fecundity.
While these studies suggest that crowding-induced reductions in larval parasite size can portend poorer fitness in the next host, this need not always be the case. The infectivity of H. diminuta cysticercoids to rats remains constant across a wide range of intensities in the beetle intermediate host (up to 60), despite a decrease in cysticercoid size with intensity (Keymer, Reference Keymer1981; Chandler et al. Reference Chandler, Read and Nicholas1950 reported that H. diminuta infectivity decreases with cysticercoid size but in a much smaller experiment). In the nematode Gnathostoma spiniferum, the length of infective L3s in copepods decreases by ~20–25% in heavy infections (intensity up to 13) compared with single infections, yet this does not reduce infectivity to the next host, a mouse (Janwan et al. Reference Janwan, Intapan, Sanpool, Sadaow, Thanchomnang and Maleewong2011). The tapeworm S. solidus exhibits a crowding effect in sticklebacks (Heins et al. Reference Heins, Baker and Martin2002), which should be quite costly, because the worm reproduces shortly after transmission from sticklebacks to birds and its fecundity is proportional to body size (Schärer et al. Reference Schärer, Karlsson, Christen and Wedekind2001). However, worms taken from singly- vs multiply-infected sticklebacks exhibit different patterns of size-dependent egg production, and fascinatingly, small worms from multiple infections actually produce more eggs than comparably sized worms from single infections (Dörücü et al. Reference Dörücü, Wilson and Barber2007) and those eggs seem more likely to hatch (Schjørring and Lüscher, Reference Schjørring and Lüscher2003).
Few studies have addressed whether the effects of larval crowding linger long after transmission. Small nematodes (G. spiniferum) from high-intensity infections in copepods grew to the same size as larger worms that had been alone in copepods 30 days after transmission to mice (Janwan et al. Reference Janwan, Intapan, Sanpool, Sadaow, Thanchomnang and Maleewong2011). Small cystacanths of Leptorhynchoides thecatus from crowded infections in amphipods were worse at infecting fish, but those that established went on to reach the same adult size as larger cystacanths (Steinauer and Nickol, Reference Steinauer and Nickol2003). Thus, these two studies suggest deficient growth in the intermediate host can be compensated for in the next host.
Resource availability: host size and diet
Parasites commonly grow larger in larger intermediate hosts (Valkounova, Reference Valkounova1980; Shostak et al. Reference Shostak, Rosen and Dick1985; Wyatt and Kennedy, Reference Wyatt and Kennedy1988; Dezfuli et al. Reference Dezfuli, Giari and Poulin2001; Poulin et al. Reference Poulin, Nichol and Latham2003b ; Benesh and Valtonen, Reference Benesh and Valtonen2007b ). The quantity and quality of food consumed by the intermediate host can also affect parasite growth and production (Shostak and Dick, Reference Shostak and Dick1986; Pugh, Reference Pugh1987; Keas and Esch, Reference Keas and Esch1997; Kollien and Schaub, Reference Kollien and Schaub1998; Sandland and Minchella, Reference Sandland and Minchella2003; Johnson et al. Reference Johnson, Chase, Dosch, Hartson, Gross, Larson, Sutherland and Carpenter2007; Seppälä et al. Reference Seppälä, Liljeroos, Karvonen and Jokela2008; Benesh, Reference Benesh2010; Labaude et al. Reference Labaude, Cézilly, Tercier and Rigaud2015). Intermediate host size is obviously relevant for parasites reproducing precociously in the next host. In the case of S. solidus, big sticklebacks harbour big tapeworms (Barber, Reference Barber2005; Quinn et al. Reference Quinn, Kendall, Rich and Chasco2012) that tend to produce more eggs in vitro (Schärer et al. Reference Schärer, Karlsson, Christen and Wedekind2001; see Tierney and Crompton, Reference Tierney and Crompton1992 for in vivo). The in vitro production of eggs by non-progenetic trematodes may (Fredensborg and Poulin, Reference Fredensborg and Poulin2005) or may not (Brown et al. Reference Brown, De Lorgeril, Joly and Thomas2003) increase with intermediate host body size.
Intermediate host size can also cause parasites to take alternative developmental pathways, as seen in the marine nematode Hysterothylacium aduncum (Køie, Reference Køie1993). It reproduces in eelpout, a fish, and infects various crustaceans as first intermediate host. In the smallest crustaceans (harpacticoid copepods), worms do not grow much and they do not survive when transmitted to fish; an additional invertebrate host is required. In larger intermediate hosts (calanoid copepods), worms are bigger and are able to infect fish, but their fate in fish depends on their size. When longer than 3 mm at transmission to fish, worms moult, mature and reproduce, otherwise they encyst and await ingestion by a piscivorous fish. When transmitted to fish via even larger crustaceans (amphipods, isopods and mysids), they forgo encystment and reproduce. Parasite size thresholds triggering different developmental strategies may be common in marine anisakid nematodes (Køie and Fagerholm, Reference Køie and Fagerholm1995). This plasticity, in which the parasite's strategy in one host is contingent on its previous host, could be quite beneficial in traversing the long trophic chains exploited by these parasites.
Carryover effects due to intermediate host size and diet have been investigated in some detail in S. solidus transmitted between copepods and sticklebacks. When in a small copepod, S. solidus grows smaller (Wedekind et al. Reference Wedekind, Christen, Schärer and Treichel2000; Michaud et al. Reference Michaud, Milinski, Parker and Chubb2006; Benesh, Reference Benesh2010), but being transmitted by a small copepod does not clearly reduce the probability of establishing in sticklebacks or of growing to a large size in fish (Benesh et al. Reference Benesh, Weinreich and Kalbe2012). By contrast, when copepods are on a low-food diet, S. solidus procercoids are smaller (Benesh, Reference Benesh2010; Hafer and Benesh, Reference Hafer and Benesh2015) and less likely to infect fish (Benesh and Hafer, Reference Benesh and Hafer2012). Regardless of the diet of their copepod host, parasites reached the same weight after ~4 weeks in fish, but energy reserves (glycogen content) remained slightly lower in worms transmitted by copepods on a restricted diet, suggesting some relatively persistent effects of larval stress (Benesh and Hafer, Reference Benesh and Hafer2012).
Ontogenetic variation at transmission to fish seems to be key in S. solidus. Worms transmitted at a young age, when infectivity is just developing, grew much slower in fish; even after 2 months they had not caught up to the size of worms that were transmitted when more fully developed (Hammerschmidt et al. Reference Hammerschmidt, Koch, Milinski, Chubb and Parker2009). When transmitted to fish at the same age, individuals that developed slowly in copepods were less likely to establish successfully and they grew to a smaller size in fish with fewer energy reserves after a month (Benesh and Hafer, Reference Benesh and Hafer2012). A long-lasting effect of early transmission has also been noted in the tapeworm Spirometra, where worms that are transmitted just a few days early have retarded growth even after three months in mice (Mueller, Reference Mueller1966), in the tapeworm Ophiotaenia filaroides, where transmission 1 or 2 days early seems to necessitate a tissue phase that substantially delays reproduction (Mead and Olsen, Reference Mead and Olsen1971), and in the nematode Acuaria anthuris, where early-transmitted larvae have longer prepatent periods (Rietschel, Reference Rietschel1973). Premature transmission can thus have an enduring negative effect on parasites, though it is unclear why. Is there irreversible damage done when transmitted early? How? And what are the relevant changes between an early- and a late-stage infective parasite? In any case, the costs of being transmitted when not-yet-fully-developed suggest that larval resource scarcity could cause carryover effects by delaying development. Larval ontogeny in cestodes, though, is only weakly affected by resource deprivation (Benesh, Reference Benesh2010), perhaps exactly because sacrificing development is so costly.
Temperature
Temperature has a profound effect on biological rates such as growth, development, maturation and senescence (Brown et al. Reference Brown, Gillooly, Allen, Savage and West2004). However, some rates are more temperature sensitive than others (Dell et al. Reference Dell, Pawar and Savage2011; Forster et al. Reference Forster, Hirst and Woodward2011). Much research on the effects of temperature on parasites focuses on its dual impact on development and mortality. At high temperatures, parasites develop faster but their hosts (or their free infectious stages) have higher mortality, so there may often be a temperature that balances these opposing forces and is optimal for parasite transmission (e.g. Thieltges and Rick, Reference Thieltges and Rick2006; Studer et al. Reference Studer, Thieltges and Poulin2010; Mordecai et al. Reference Mordecai, Paaijmans, Johnson, Balzer, Ben-Horin, de Moor, Mcnally, Pawar, Ryan, Smith and Lafferty2013). Temperature can also have subtler effects on complex life cycle organisms. For example, tadpoles raised at low temperatures have longer developmental periods, but they accumulate more lipids which are then available as adults (Álvarez and Nicieza, Reference Álvarez and Nicieza2002). Frog limb morphology can also be permanently modified by larval rearing temperature (Gomez-Mestre et al. Reference Gomez-Mestre, Saccoccio, Iljima, Collins, Rosenthal and Warkentin2010). Thus, temperature may affect complex life cycle organisms not only by speeding up or slowing down certain processes but also by coupling the adult phenotypes with the larval environment.
There are several ways for temperature to induce carryover effects in parasites. The first and simplest is that temperature accelerates metabolism and energy use. Variation in condition is often thought to underlie carryover effects (Pechenik, Reference Pechenik2006; O'Connor et al. Reference O'Connor, Norris, Crossin and Cooke2014), so the interplay between temperature and energy use certainly could have consequences beyond transmission. The rapid depletion of fixed energy reserves at high temperatures can negatively affect the infectivity of free-living transmission stages (Pechenik and Fried, Reference Pechenik and Fried1995; Pietrock and Marcogliese, Reference Pietrock and Marcogliese2003), though the relationship between infection and temperature is complex and clearly depends on more than just energy use (e.g. contact rates, thermal effects on the target host, etc.; Paull et al. Reference Paull, Lafonte and Johnson2012; Studer and Poulin, Reference Studer and Poulin2014; Morley and Lewis, Reference Morley and Lewis2015). Glycogen levels in some cysticercoids seem unaffected by rearing temperature (Heyneman and Voge, Reference Heyneman and Voge1957), so higher temperatures need not always lead to lower-energy stores in transmission stages.
A second way that larval temperature may have long-lasting consequences is through its effect on size and age at transmission. A very common observation is that at high temperatures, organisms reach maturity or undergo metamorphosis at younger ages and smaller sizes, i.e. the so-called temperature-size rule (Atkinson, Reference Atkinson1994). The pattern suggests that warm temperatures accelerate development more than growth, but to what degree the temperature-size rule reflects adaptation or biophysical constraints is still contested, the answer perhaps often being taxon-specific (van der Have and de Jong, Reference van der Have and de Jong1996; Angilletta et al. Reference Angilletta, Steury and Sears2004; Walters and Hassall, Reference Walters and Hassall2006; Arendt, Reference Arendt2011; Forster et al. Reference Forster, Hirst and Atkinson2012; Zuo et al. Reference Zuo, Moses, West, Hou and Brown2012; Ghosh et al. Reference Ghosh, Testa and Shingleton2013). Examples of the temperature-size rule are rare in larval parasites. Despite the copious number of studies documenting the temperature-dependence of helminth development (Benesh et al. Reference Benesh, Chubb and Parker2011), I found just one explicitly stating that larval size decreased with temperature (Freeman, Reference Freeman1952). The repercussions of temperature-induced phenotypic variation are also little investigated but potentially important. For instance, high larval rearing temperature speeds development but reduces size and lipid stores in a parasitoid wasp, with the result that emergent females have a shorter lifespan and lower fecundity (Colinet et al. Reference Colinet, Boivin and Hance2007).
Temperature can also be a cue for taking alternative developmental pathways. In nematodes of grazing mammals, the temperature experienced by the free L3 larvae often affects whether worms will arrest development after infection or proceed to mature and reproduce (Michel, Reference Michel1974; Gibbs, Reference Gibbs1986). Here, developmental arrest is considered an adaptation to synchronize parasite reproduction with appropriate seasonal conditions and the availability of susceptible, newborn hosts. Although this example is taken from worms with simple, one-host life cycles, it nonetheless demonstrates that parasites can ‘record’ their thermal environment at one stage (free-living infective larvae) and use this information to adjust the phenotype at a later stage (development of adults in the gut).
Finally, thermal stress may cause carryover effects. Every organism has a range of temperatures that it can tolerate. At temperatures outside this range, an organism is stressed, particularly by high temperatures, where the damage due to protein denaturation is generally irreversible. Larval parasites can be subject to thermal stress. For example, acanthocephalan cystacanths increase the production of protective heat shock proteins at high temperatures (Sures and Radszuweit, Reference Sures and Radszuweit2007). The harm done by extreme temperatures is also indicated by severe reductions in the viability of infective stages (e.g. Voge and Heyneman, Reference Voge and Heyneman1958; Evans, Reference Evans1985; Arene, Reference Arene1986; Morley and Lewis, Reference Morley and Lewis2015). When a larval parasite is subjected to temperatures outside its tolerable range, the damage may remain relevant after transmission to a new host. On the other hand, hosts can protect parasites from thermal stress through behavioural thermoregulation, and this ‘shelter effect’ could even favour the incorporation of intermediate hosts into life cycles (Molnár et al. Reference Molnár, Dobson and Kutz2013). The benefits of host thermoregulation would increase if the detrimental effects of temperature stress on parasites are persistent and carry over into the next host.
Other environmental factors
Pollutants can accumulate in the tissues of larval parasites (Sures and Radszuweit, Reference Sures and Radszuweit2007) and reduce energy storage (Gismondi et al. Reference Gismondi, Beisel and Cossu-Leguille2012). Extreme salinities can be harmful to parasites (Lei and Poulin, Reference Lei and Poulin2011), as can UV-radiation (Perrot-Minnot et al. Reference Perrot-Minnot, Gaillard, Dodet and Cézilly2011; Studer et al. Reference Studer, Cubillos, Lamare, Poulin and Burritt2012). Host immunity, a stressor unique to parasites, can slow larval parasite growth and development (Baron and Tanner, Reference Baron and Tanner1976; Kurtz et al. Reference Kurtz, Kalbe, Aeschlimann, Häberli, Wegner, Reusch and Milinski2004). Although factors such as pollution, salinity, UV and immunity could all plausibly affect parasites even after transmission to a new host, I am not aware of any studies documenting such effects.
Summary
A variety of environmental factors can affect parasites as larvae and then beyond into the next host. In this regard, resource availability is the best studied stressor, but different sources of resource restriction (i.e. crowding or being in small or poorly fed host) need not have the same consequences going into the next host. This, combined with a paucity of studies, suggests it is too soon to make general conclusions about the long-term costs to parasites of low food as a larva. Experiments examining temperature-induced carryover effects in parasites are also needed, especially given the concern about the impact of climate change on disease. A fair number of studies have found that stressful larval environments can have rather immediate consequences for parasites in the next host, like decreased infection rates and lower fecundity in precocious species. It is debatable whether these should be considered carryover effects, because the effect of larval stress may not persist. Few studies have followed parasites long after transmission to see whether they compensate for a poor larval phase. Ideally, carryover effects would be predictable from easily measured variables such as size and age at transmission. Larval size and age have been shown to be fitness correlates in some studies, but it is important to realize that their relationship with success in the next host can be modified by environmental factors, e.g. a change in larval size due to temperature may have different consequences than one due to resource constraints. It seems reasonable to expect that carryover effects are widespread in parasites, given the varied mechanisms that can produce them and their ubiquitousness in free-living organisms. Nonetheless, more work is needed to assess how much of a ‘larval legacy’ a parasite carries with it into later life cycle stages.
Transgenerational effects
Somewhat analogous to carryover effects from larvae to adults, the environment experienced by reproductive adults can affect offspring phenotypes. Phenotypic links between a parent and its offspring that are not directly attributable to genetic inheritance are called maternal effects, or more generally parental effects as they need not be maternally derived (Rossiter, Reference Rossiter1996; Mousseau and Fox, Reference Mousseau, Fox, Mousseau and Fox1998). Parental effects can arise through variation in parental condition, offspring provisioning, cytoplasmic transfer and/or epigenetics. Parasite reproductive traits, such as sex allocation and egg number and size, are often affected by extrinsic factors, such as parasite density, host immunity or host condition (e.g. Dobson, Reference Dobson1986; Trouvé et al. Reference Trouvé, Jourdane, Renaud, Durand and Morand1999; Pollitt et al. Reference Pollitt, MacGregor, Matthews and Reece2011). But do parasite offspring that were produced under dissimilar conditions differ in meaningful ways? Cases of transgenerational plasticity are known from free-living complex life cycle organisms, in which parents adaptively adjust the phenotype of their offspring in response to their own experiences (Marshall, Reference Marshall2008; Richter-Boix et al. Reference Richter-Boix, Orizaola and Laurila2014). A striking parasitic example of this phenomenon is the nematode Strongyloides ratti. It reproduces in rats, and the immune status of rats influences both the sex and the developmental strategy (free-living or infectious) of excreted nematode larvae (Harvey et al. Reference Harvey, Gemmill, Read and Viney2000). By contrast, the immunocompetence of a definitive host can affect egg production without affecting the viability of the resultant offspring (Davies and McKerrow, Reference Davies and McKerrow2003; Lambert et al. Reference Lambert, Pathak and Cattadori2015). The virulence of a gregarine parasite in mosquitoes depends not only on the food intake of its current host, but also on whether or not its parents’ host was well fed (Tseng, Reference Tseng2006). Comparable observations have been made in a Daphnia–bacteria system (Little et al. Reference Little, Birch, Vale and Tseng2007). In some tapeworms, eggs kept at constant temperatures but produced in different seasons can differ more than 2-fold in the rate of embryogenesis (Hanzelová and Zitnan, Reference Hanzelová and Zitnan1986; Scholz, Reference Scholz1997). The existence of parental effects, where parasite phenotypes depend on the environment in which their parents reproduced, further accentuates the linkages between successive life cycle stages. Thus, neither transmission nor reproduction is necessarily a fresh start for parasites.
Concluding remarks
Are the successive stages in parasite life cycles autonomous or integrated? Arguments can be made for both. Evidence for autonomy includes the lack of genetic correlations across stages (e.g. Fig. 3), stage-specific patterns of gene expression, the absence of interspecific correlations (e.g. Fig. 4), the independent and repeated loss of stages in various taxa, and the compensation for poor larval conditions once in a new host. Integration, on the other hand, is suggested by genetic tradeoffs between traits expressed in different hosts, significant species-level correlations across stages (e.g. positive correlations between larval and adult body sizes and host ranges), recapitulation of larval stages even after they are reduced or made facultative, hefty ‘overhead’ costs associated with skipping intermediate hosts, obstacles to reproduction when dropping definitive hosts, and the various ways that the larval environment carries over to affect performance in the next host.
The adaptive decoupling hypothesis is a very useful heuristic for contemplating why complex life cycles arose and persisted, yet at its extreme, the idea that different parasite life stages are completely independent from one another, it is clearly false. Stages may be linked through genetics (all stages share a genome), ontogeny (larval tissues become those of adults), selection (beneficial changes in one stage can favour correlated changes in others) and the environment (carryover and parental effects). Thus, the relevant question is the magnitude of decoupling/integration among stages occurring via different mechanisms. There are multiple opportunities for advancement. The pervasiveness of genetic correlations across successive life stages is little studied, and combining quantitative genetic and transcriptomic approaches would be fruitful in gauging the genetic decoupling of stages. Additional cross-species comparative analyses can explore which traits are associated across stages and examine their environmental correlates to hypothesize why. The obstacles to dropping either intermediate or definitive hosts can be further investigated in parasites with flexible life cycles. Examining the different ways that environmental factors affect parasites not just in their current host but also in subsequent hosts may provide insight into the primary determinants of performance in downstream hosts. In conclusion, I encourage holistic thinking about parasites with complex life cycles and emphasize that what happens in one stage is potentially highly relevant for later stages.
ACKNOWLEDGEMENTS
I graciously acknowledge the editor's invitation to write this review, and I thank the ecological parasitology group at UCSB and two anonymous reviewers for feedback on the ideas presented here.
FINANCIAL SUPPORT
I was supported by a DFG Fellowship (BE 5336/1–1).