Introduction
This paper is concerned with the social divisions of later life, those that separate working from post-working life as well as those that differentiate among people within the retired population. Contemporary social science has focused upon class, gender, and, more recently, sexuality and disability as major sources of division, but has either neglected differences between older people or has seen them from the perspectives of these other categories (Cronin Reference Cronin, Daatland and Biggs2005; Formosa and Higgs Reference Formosa, Higgs, Formosa and Higgs2015; Hearn and Wray Reference Hearn, Wray, Twigg and Martin2015; Walker Reference Walker, Cann and Dean2009). The argument presented here is that the division between the fit and the frail in later life has as much if not more salience than have those conventional lines of fracture. While differences in income and wealth once marked old age, if not as a class, at least as a distinct social category, these have become less marked in contemporary society. Old age has ceased to be the marginalised social category it once was to become itself a site of diversity. Even the chronological age at which retirement begins has been regularly revised in the United Kingdom (UK) and internationally (Organisation for Economic Co-operation and Development (OECD) 2007). Before the Second World War, age, poverty and the lifecourse were considered intimately connected to one another. This paradigm formed the basis of the work of such notable British reformers as Charles Booth and Seebohm Rowntree (Booth Reference Booth1887; Rowntree Reference Rowntree1901). In current circumstances this conflation has become less of a concern and has been replaced by what Angela O'Rand has described as a concern for understanding ‘stratification over the life course’ in distinction to the ‘stratification of the life course’ (O'Rand 1996: 188–9). In short, our aim is to focus on the divisions within later life, on the grounds that as old age has been transformed into later life, retirement in and of itself has lessened as the crucial line of fracture in the adult lifecourse.
We would argue that it is in the distinction between the fit and the frail, between those who are and those who are not ‘ageing successfully’, where one of the greatest social divisions of later life is now realised. In making this argument, we draw on the way that studies of social inequalities as the source of social divisions have been transformed into debates about the nature of social exclusion. This development has been one of the consequences of accepting that the factors that now contribute to the effects of social divisions are much more complex than was previously acknowledged. We therefore posit that an approach based on social exclusion and the role of ‘capacities’ can provide important insights on and outcomes for the contemporary social divisions of later life.
From poverty to social exclusion
In order to contextualise this debate it is important to understand the history of the concept of social exclusion. Social exclusion has become a generic term ‘applied to more and more types of social disadvantage … [encompassing] new social groups and problems, increasingly applied to those whom economic development appeared to have forgotten’ (Silver Reference Silver1994: 532–3). Levitas has pointed to its role in redefining debates over poverty (Levitas Reference Levitas1996: 7). For Silver, as for Levitas, a number of social policy and social science perspectives exist which tend to emphasise either ‘social solidarity’ or ‘material deprivation’ as the central feature of social exclusion. The former ‘Durkheimian’-inspired approach has been concerned with the risks facing various groups who become ‘excluded’ from ‘mainstream’ society. The latter position sees poverty as extending beyond household income to include – whether as cause or consequence – limits to participation in everyday life. A seminal debate occurred between Peter Townsend and Amartya Sen, where the former used the concepts of ‘relative poverty’ and ‘relative deprivation’ to identify those whose standard of living was below that of the majority of the population. The poverty model of exclusion thus became one of multiple deprivations, expanding beyond purely material deprivations (like not having a television, telephone or car) to incorporate cultural and social deprivations such as not being able to entertain friends or family. Sen took issue with Townsend and argued that focusing upon relative degrees of poverty ignored the fundamental nature of poverty which he thought of as the capability to function (Sen Reference Sen1983). He gave the example of a society where most are starving. While only a proportion of these will be recognised as poor based upon relative measures, common-sense informs us that all those who are starving are poor. Likewise, having a car or a bicycle might seem to represent an absence of deprivation but impairment and paralysis may render both the bicycle and the car without value in ameliorating a lack of mobility. For Sen, an individual's standard of living could be better conceptualised as a combination of what he called ‘functions’ and ‘capabilities’. It is the impoverishment of people's capabilities and functions, he argued, that should provoke most concern and not relative income or relative material possessions. While we would endorse Sen's position, indicators of access to common material and social goods and services have dominated attempts to measure exclusion; for now we have to rely upon such measures, despite their limitations (Scharf Reference Scharf, Walsh, Carney and Ní Léime2015: 128).
Discussions about absolute and relative poverty overlap with debates on the divisions created by social class and the extent to which such classes are distinguished by individuals’ occupational position, in contrast to their access to social and cultural ‘capital’ (cf. Atkinson Reference Atkinson2009; Bennett et al. Reference Bennett, Savage, Silva, Warde, Gayo-Cal and Wright2009; Devine et al. Reference Devine, Savage, Scott and Crompton2005). Just as retirement from paid labour (or positions of ownership) might seem to remove older people from the nexus of class relations (viewed in purely occupational terms), it might similarly be argued that retirement also removes the older person from ‘inclusion’ within the social relations of production – in effect guaranteeing their social exclusion irrespective of their previous class position. While it may seem excessive to equate retirement with social exclusion, given the large numbers of retired people who do not seem to be ‘unfree’, it is equally unrealistic to treat retired people as still classed or classified by the nature of their last job. Though unemployment may serve as a major risk for social exclusion and hence as a potential social divide, this might be only true for individuals of working age. It is ill suited to people of retirement age. In this sense there is a positional relativity to the exercise of capabilities, and hence of social exclusion. To avoid treating retirement as ‘social exclusion’ because by definition it represents exclusion from ‘the integrative function of paid work’ (Levitas Reference Levitas2005: 22), a more multifaceted approach to defining exclusion is required in order to identify and explain divisions between the ‘included’ and the ‘excluded’ within the retired population (Keating and Scharf Reference Keating, Scharf, Scharf and Keating2012: 169).
Retired people differ in many ways from the working-age population, in terms of the social and cultural capital that they possess as well as in their consumer preferences and capabilities to access a variety of resources, including income (Jones et al. Reference Jones, Hyde, Victor, Wiggins, Gilleard and Higgs2008; Scherger, Nazroo and Higgs Reference Scherger, Nazroo and Higgs2011). But the process of retiring from work (whether as a paid employee, running a business or as a self-employed person) may not automatically lead to social exclusion in the way it so often does during working life. Equally, restrictions to paid employment through retirement policies may not necessarily create exclusion (or poverty). Numerous writers have identified intrinsic links between poverty and old age (Ginn Reference Ginn, Ridge and Wright2008; Phillipson Reference Phillipson, Walker, Sinfield and Walker2011; Walker Reference Walker1981). Most evidence suggests that across the world's developed economies this is no longer the case. While pockets of poverty undoubtedly exist within the older population, the extent of income inequality in later life remains less than during working life; nor are there signs of any specific worsening of income inequality in later life despite the general increase in income inequality (Brown and Prus Reference Brown and Prus2006; Goudswaard et al. Reference Goudswaard, van Vliet, Been and Caminada2012).
The social divide between working age and old age that existed for much of the modern period was based upon access to, versus exclusion from, paid employment (Phillipson Reference Phillipson1982). In Europe this led 19th-century state officials to define old age by the term ‘impotent through age’. This distinction became less salient by the late 20th century, in the context of a changed set of social relations that Ulrich Beck has termed ‘second modernity’ (Beck, Bonss and Lau Reference Beck, Bonss and Lau2003). In second modernity, retirement, whether chosen or compelled, has ceased to be a major risk for destitution, and arguably, has also ceased to restrict the opportunities of older people to engage in society (Gilleard and Higgs Reference Gilleard and Higgs2005). What is now more clearly revealed, we would argue, is a divide not in income but in health, between the impotent (disabled) and the able bodied, a divide that seems to grow wider with increasing age (Prus Reference Prus2007).
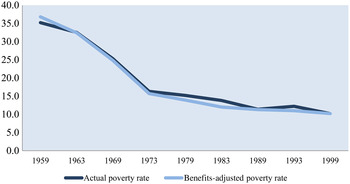
Is there evidence that the working age/retirement age divide no longer determines relative poverty or deprivation, or that a divide between able-bodied and disabled older people has replaced it? Changes in rates of income and consumption-based poverty across the lifespan can provide us with a long-term perspective on the issue. The measurement of income poverty is complicated. One long-running study in the United States of America (USA) estimated that over the last three decades of the 20th century, about one half of all Americans between the ages of 25 and 75 experienced at least one spell of poverty, defined as the inflation-adjusted official US poverty rate, at the same time as a similar proportion experienced a spell of affluence, defined as a household income ten or more times the official poverty rate (Rank and Hirschl Reference Rank and Hirschl2001). They found that the chances of experiencing affluence rather than poverty rises with age (up to the age of 45), plateaus and then declines after age 75 (Rank and Hirschl Reference Rank and Hirschl2001: 663). Despite the caveats necessary for this kind of analysis, such as a reliance on cross-sectional, single point-in-time measures of income poverty, quasi-longitudinal measures using similar criteria over time confirm that at least in the USA, major reductions in poverty have been experienced among older (60 or 65 years and over) groups. Figure 1 illustrates this decline by charting change in US official and ‘benefits-adjusted’ poverty rates among people aged 65 and over during the course of the second half of the 20th century.
Poverty rates (%) of the 65+ population of the United States of America, 1959–99.

More than one in three of the US population aged 65 and over were designated officially poor in the 1950s. By the end of the 20th century that figure had dropped to one in ten. This compares with a drop in official poverty rates for adults aged 18–64 years. Starting around 17 per cent in 1959, half the rate of that among the over 65s, it dropped to 10 per cent in 2000, the same rate as that of the over 65s (Proctor and Dalaker Reference Proctor and Dalaker2002: 4). US data on ‘near poverty’ incomes indicate a similar pattern. In 1966, some 11 per cent of Americans over 65 years were in ‘near poverty’. By 2012, this figure had more than halved to 5 per cent. By comparison, ‘near poverty’ income among adults aged 18–64 years fell from 5 per cent to 4 per cent (Hokayem and Heggeness Reference Hokayem and Heggeness2014).
In another US study of income and consumption-based indices of poverty, Meyer and Sullivan (Reference Meyer and Sullivan2007) observed even greater declines in US official poverty rates among the over 65s when alternative measures of consumption-based poverty are compared. Drawing upon data collected annually from 1980 by the Consumer Expenditure Interview Survey, these authors observed steeper declines in consumer poverty among the over 65s, up to 2004, than in income poverty, whether ‘near’ poverty, ‘official’ poverty or ‘deep’ poverty rates were used (Meyer and Sullivan Reference Meyer and Sullivan2007: 26, table 1). In short, whichever approach was used the poverty divide between those of working age and those of retirement age had more or less disappeared in the USA during the second half of the twentieth century.
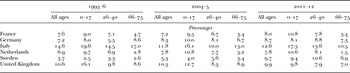
Relative poverty rates by age group: selected European Union countries, 1995–2012

Source: Eurostat (2015) People at risk of poverty or social exclusion by age and sex. European Commission, Brussels (http://ec.europa.eu/eurostat/web/income-and-living-conditions/data/database) Accessed 7th June 2015 and again 5th May 2016).
Few other countries have quite the same long-term consistency of data as those found in the USA. One cross-national comparison of poverty rates among the young and the old that was conducted in the 1980s suggested that other countries also experienced a ‘crossover’ in poverty rates, with the young more likely and the old less likely to be classed ‘poor’ (Smeeding, Torrey and Rein Reference Smeeding, Torrey and Rein1987). In other countries, including the UK, the old remained more likely than other age groups to still be poor (Smeeding, Torrey and Rein Reference Smeeding, Torrey and Rein1987: 12, table 2). Since the 1980s, however, a ‘catch-up’ decline in rates of ‘pensioner poverty’ has been witnessed in many countries, including the UK (Leicester, O'Dea and Oldfield Reference Leicester, O'Dea and Oldfield2009). Table 1 illustrates the changing poverty rates, calculated net of taxes and transfers, for 1995–6, 2004–5 and 2011–12, by age group, for a number of core European Union (EU) countries.
Despite initial overall rates of poverty varying from 4 to 15 per cent across these six countries, and despite the recession of 2008–9, during this period and most clearly by 2011–12, poverty rates among new pensioner cohorts (ages 66–75 years) were lower than those of the general population. By 2011–12 these ‘new pensioners’ were less poor than either the young (0–18 years) or ‘prime age’ (25–40 years) groups of adults.
Age, deprivation and hardship
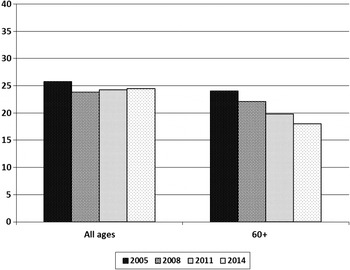
A major part of our argument is that social exclusion understood as exclusion from participation in ‘common and popular social experiences, groups and pastimes’ (Alcock Reference Alcock, Ridge and Wright2008: 44) has a greater potential for understanding the social divisions of later life than earnings or income. It is therefore important to identify how the concept has been used in relation to old ageFootnote 1 . While poverty rates – variously measured as income or expenditure – continue to be collected and analysed since the 1990s, alternative measures of ‘social exclusion’ now feature in cross-national statistical surveys. Statistics on income and on living conditions have incorporated measures of material deprivation and financial hardship into the EU-SILC instrument from 2003 (see Eurostat, http://ec.europa.eu/eurostat/web/income-and-living-conditions/overview). Annual data on social exclusion, housing, labour, education and health, as well as income and poverty, have been collected across all EU countries. Comparable data are also being gathered from Iceland, Norway, Switzerland and, most recently, Serbia and Turkey. These measures continue to conceptualise social exclusion in terms of economic–structural exclusion, ignoring the socio-cultural dimensions of exclusion (Jehoel-Gijsbers and Vrooman Reference Jehoel-Gijsbers and Vrooman2008: 8). Nevertheless, they do enable examination of the social divide between younger and older adults in terms of material deprivation and financial hardship as well as relative income poverty. Figure 2 illustrates recent trends in the percentage of people at risk of poverty and/or social exclusion, for all age groups and for those aged 60 and over, across the 27 EU countries from 2005 to 2014.
Percentage of people at risk of poverty and/or social exclusion, by age group, for the 27 European Union countries, 2005–14.

In 2014, approximately one in four citizens of the 27 EU countries was at risk of poverty and/or material deprivation. For citizens aged 60 and over, however, that figure was one in six. As with the OECD data on income poverty, there seems little evidence of a social divide in poverty, material deprivation or financial hardship between working and post-working life across the EU. If one selects other measures of relative poverty or varies the particular level of material deprivation or hardship, similar patterns can be observed.Footnote 2
Of course, even if there are fewer signs of a social divide in rates of poverty or material deprivation between younger and older adults, it might still be the case that older people have less ‘disposable’ overall income compared with younger people. As part of the same EU-SILC programme, comparisons can be made of the relative income of people aged over and under 60 years. The ratios of median income of people aged 60+ to that of people aged 0–59 have been available for the 27 EU countries from 2005. These figures demonstrate a broad and (slowly) rising comparability between the median incomes of the young and those of the old over the last decade, with the income of the old rising from 89 to 96 per cent of that of the young, across the EU as a whole.Footnote 3 In the majority (16 out of 27) of EU countries, older people's median incomes were at least 90 per cent those of younger people's and in only one country, Estonia, was the figure below 75 per cent. This reinforces a point made in an earlier OECD report that ‘in most [developed] countries people experience almost no or only a minor reduction in their standard of living when moving from later working life to retirement’ (OECD 2001 report, cited in Gilleard and Higgs Reference Gilleard and Higgs2005: 8).
Similar comparisons can be drawn using the absence of material deprivation as an indicator of ‘social inclusion’.Footnote 4 Drawing again on the EU-SILC database, in 2005 48.2 per cent of the population of the 27 EU countries reported no financial difficulties and that they were not lacking any of the resources constituting the social exclusion measure. An almost identical percentage (48.9%) of those aged over 65 years were also free of any such hardship. By 2013, there had been a small drop in the proportion of the overall population free of any hardship, to 47.0 per cent. For those over 65, however, slightly more (51.4%) were now in such a fortunate position. In short, whether framed in purely monetary terms, in terms of relative rates of poverty, or in terms of material deprivation and hardship, there seems no longer to be any significant social divide between chronologically defined working and post-working life in much of the developed world.
Age, chronology and the body
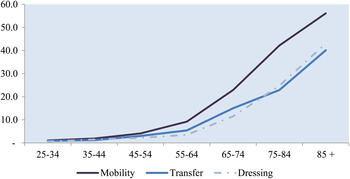
Many conventional approaches in social gerontology have defined old age primarily by its relationship to working life (Estes Reference Estes, Minkler and Estes1999; Phillipson Reference Phillipson1982; Townsend Reference Townsend1981). With increasing age come other changes, not least an exponential risk of serious chronic illnesses and illness-related disabilities. Drawing upon a Belgian health interview survey that was conducted in 1997 assessing physical disability and functional limitations, Figure 3 illustrates how the presence of moderate and severe impairments in walking (mobility), sitting down and getting up from a chair (transfer), and getting dressed and undressed without help (dressing) increases for each adult age group (Ethgen et al. 2003).
Prevalence of physical disabilities in women (%), by age group, Belgium, 1997.

What this and other cross-sectional surveys indicate is that ageing is associated with increasing physical limitations. While there is evidence that overall rates of disability in later life are changing – with relative decreases in successive cohorts of older people observed in most developed countries (Chatterji et al. Reference Chatterji, Byles, Cutler, Seeman and Verdes2015) – there is no evidence that there is any change to the pattern of exponentially rising rates of disability with increasing age (Berlau, Corrada and Kawas Reference Berlau, Corrada and Kawas2009). This leads to the question: to what extent does this loss of ‘health’ or ‘embodied’ capital rather than the loss of earnings associated with the transition from working to post-working life form the more profound social divide within later life?
Although physical disability is more common among retired people, a significant number of people of ‘working age’ also report physical disabilities. Is physical disability per se a more profound source of social exclusion than age, employment or income? Over a century ago, when the alms-house/workhouse provided the principal source of ‘indoor relief’ for the most destitute in society, alongside and often scarcely distinguished from the aged pauper were the ‘ageless’ chronic sick. From the establishment of the Poor Law unions in 1834–8, the poor law commissioners of the British Isles annually reported the numbers of paupers receiving indoor and outdoor relief. These were invariably grouped by gender, by their able-bodied status and also by their ‘sanity’, with age being reported only in relation to the division between pauper children and pauper grown-ups. As the numbers of able-bodied, child and insane paupers gradually declined, a ‘residuum’ remained of largely undifferentiated aged and infirm persons. Only as debates over an old-age pension began was attention paid to singling out ‘the aged’ from the ‘chronic sick’ through the chronological defining of old age (Roebuck Reference Roebuck1979). After this point the numbers of paupers aged over 60 or over 65 began to appear in Local Government Board reports (e.g. House of Commons Parliamentary Papers 1900). Even so, the confounding of age and infirmity within the broad category ‘chronic sick’ continued to characterise the poor law administration through to the Second World War (Fairfield Reference Fairfield1943).
While the workhouse along with its more modern equivalents in the shape of long-stay psychiatric, geriatric and psycho-geriatric hospitals as well as old people's homes has all but disappeared, most national governments continue to monitor the numbers of adults of working age with physical disabilities. These figures and the provisions for those so designated are kept separate from the figures and provisions for pensioners and unemployed persons. Hence it should be possible to compare the living standards of these three potentially marginal sub-populations with the ‘general’ population. As noted earlier, there are few differences between the living standards of pensioners and those of the general population in the majority of developed nations. After the age of 60 or 65, the official status of ‘disabled adult’ no longer applies so it is difficult to compare the social circumstances of disabled people of ‘retirement age’ with the living standards and social circumstances of either ‘working-age’ disabled people or able-bodied people of retirement age.Footnote 5
There is a considerable body of research demonstrating links between severity of disability and extent of poverty, but such studies focus upon people of working age, leaving the relative poverty or social exclusion status of disabled people over age 65 unclear because it remains largely unexamined (Braithwaite and Mont Reference Braithwaite and Mont2008; Brault Reference Brault2012; Palmer Reference Palmer2011). Within epidemiology and social gerontology, the focus has been on demonstrating the effect of past and present living standards, as well as income and wealth, on health and disability status in later life (Jones and Higgs Reference Jones, Higgs, Formosa and Higgs2015; Prus Reference Prus2007). One US study, having carefully demonstrated links between the presence of ‘functional limitations’ in later life and income, made the imputation that it is a person's income that determines his or her functional status (Minkler, Fuller-Thomson and Guralnik Reference Minkler, Fuller-Thomson and Guralnik2006). As many before and since have observed, it could equally be argued that functional impairment itself has immediate and long-term effects on a person's (and on a household's) income (Smith and Kington Reference Smith and Kington1997: 167). Other longitudinal US research has concluded that while there is clearly a pattern of association between income, wealth and ill health, the evidence is generally against direct causal links from socio-economic status to the incidence of chronic disease in old age, once variation in initial health status is controlled for (Adams et al. Reference Adams, Hurd, McFadden, Merrill and Ribeiro2003; Meer, Miller and Rosen Reference Meer, Miller and Rosen2003). Subsequent work done by Smith (Reference Smith and Wise2005) on the impact of episodes of ill health on household income among the ‘near elderly’ is particularly critical, finding that ten years after a health event, household wealth was about US $40,000 lower as a result of lower earnings and fewer hours working – a finding which, as David Cutler (Reference Cutler and Wise2005: 238) has observed, ‘will not be easily overturned’.
If socio-economic status during working life is a potential cause of disability or ‘functional impairment’ which further reduces one's earnings, it could also be the case that those developing long-standing impairments in mid-life will start off more disadvantaged in later life/retirement – with perhaps greater outlays and less chance of saving, a history of lower income and hence lower occupational or earnings-related pensions and so forth – compared with those who develop such impairments only after they have retired. To the best of our knowledge, the necessary comparisons have not been made. However, there is evidence that the development of chronic illness diminishes the ‘marginal utility’ of consumption – implying that the ‘capabilities’ one can afford at certain levels of wealth or income matter less once one's health has deteriorated (Finkelstein, Luttmer and Notowidigdo Reference Finkelstein, Luttmer and Notowidigdo2013). The longer a person has experienced such diminished marginal utilities, the more excluded and impoverished they may well become. The prospect that chronic illness and its related disabilities contribute at all levels of income and wealth to a less valuable, less capable (in Sen's terms) old age seems at least worth investigation.
Age, health capital and social exclusion
If the divide in income, material resources and wealth between people over and under 60 or 65 years of age is less than it has ever been, what evidence is there that the divisions within later life between the fit and the frail, the able-bodied and the disabled have become more critical? Assuming that, in the context of continuing chronic illness and related disability, income and wealth offer progressively less utility in later life, it is at least plausible to assume that the divisions between the fit and the frail, the able-bodied and the disabled will make for a deeper divide than the working/past-working social division that characterised the historical divides of first modernity.
We need, perhaps, at this point to re-consider our use of terms. Thus far, we have employed the terms ‘fit’, ‘able-bodied’, ‘disabled’, ‘frail’ and ‘infirm’ in a common-sense fashion. These distinctions represent the difference between someone who more or less owns their body and someone who, while having a body, does not feel they own it, let alone that they are it. Gilleard and Higgs have referred to this distinction as that between ‘embodiment’ and ‘corporeality’, with the former conceptualising the body as a source of agency and identity while the latter refers to its material presence (Gilleard and Higgs Reference Gilleard and Higgs2013: ix). In this sense, disability or infirmity can be considered aspects of the body's corporeality. In most gerontological research, disability is defined operationally by the presence of limitations in performing such necessary activities of daily living as dressing, eating, walking and washing or activities concerned with household maintenance such as budgeting, cleaning, cooking and shopping (McNeil Reference McNeil2001). Any difficulty in performing these tasks compromises one's health and one's status as an independent adult. In the absence of unusual developmental circumstances, most adults will have acquired the necessary communicative mental and motor skills to perform these activities. It requires some illness or infirmity to the body (including the brain) to disrupt these skills. Adult disability is concerned not simply with the absence but the loss of those acquired communicative mental and motor skills. Infirmity – or frailty as it is more frequently called – is related to, but some have argued can be separated from disability on the grounds that frailty refers primarily to slowness, weakness and a general loss of power rather than the loss of particular skills (Fried et al. Reference Fried, Ferrucci, Darer, Williamson and Anderson2004).Footnote 6 In that sense frailty comes nearer to the 19th-century idea of becoming ‘impotent through age’ than does disability.
Granted the considerable evidence that a person's social and economic circumstances (their education, occupation, neighbourhood and financial wealth) are linked to the presence and extent of frailty and later-life disabilities, there is less clarity how or why that might be so. In a review of the social origins of health inequalities, Mackenbach raised the question why, given developments in post-war welfare policy and wide variation in the extent of ‘redistributive’ policies across nations, there is no evidence of any reduction in socially mediated health inequalities in adulthood nor of any significant co-variation between rates of welfare provision and health inequalities (Mackenbach Reference Mackenbach2012). This lack of evidence, he argues, means that growing inequalities in health cannot be accounted for through mechanisms associated with the distribution of specific resources. This leads him to consider one of two alternative positions – either that rising levels of ‘social selection’ have resulted in the least healthy doing least well at school, in college and at work or that human capital has increased in value, leading the better educated and more culturally resourceful to be more able than in the past to use information, resources and services to maximise their potential to reduce the risks of ill health (Mackenbach Reference Mackenbach2012: 766). Evidence of secular increases in health inequalities in later life associated with educational difference might seem to support this latter hypothesis (Mirowsky and Ross Reference Mirowsky and Ross2008; Montez et al. Reference Montez, Hummer, Hayward, Woo and Rogers2011).
Other authors, however, have argued that ‘while disease (particularly chronic disease) and injury are often related to disability, they are neither sufficient nor necessary causes’ (Kennedy and Minkler Reference Kennedy, Minkler, Minkler and Estes1999: 92). They suggest that past and present socio-economic circumstances can influence disability independently of any putative links with illness, e.g. through limited resilience or reduced self-efficacy arising from socio-economic disadvantage. Consistent differences in self-reported health and wellbeing by social status or social capital might suggest such a pathway (Read, Grundy and Foverskova Reference Read, Grundy and Foverskova2016). Attempts to explore ‘deeper’ influences of past and present socio-economic status on such ‘biological’ indicators of ageing as telomere length or neurodegenerative changes have proved unconvincing (Brayne et al. Reference Brayne, Ince, Keage, McKeith, Matthews, Polvikoski and Sulkava2010; Robertson et al. Reference Robertson, Batty, Der, Fenton, Shiels and Benzeval2012). Might this mean that the social mediation of disability and ill health occurs primarily at a higher, more systemic level of corporeality – affecting biological ageing least, physiological dysfunction somewhat and reported disabilities most of all?
Research to clarify such possibilities is generally lacking. The problem seems to be that mid- and later-life health inequalities between and within developed nations are rising alongside declining rates of poverty. Health is largely treated as an outcome of other processes, whether of biological, psychological or social origin. Examining it as a social division or status variable itself has rarely been undertaken (Schafer Reference Schafer2016). Such reverse reasoning is evident in economics where health has been found to be a more powerful influence on economic development than other sources of human capital, including education (Knowles and Owen Reference Knowles and Owen1995; McDonald and Roberts Reference McDonald and Roberts2002). Within the social sciences, the causal direction of travel remains from socio-economic status (often seen as synonymous with class) to health status. It is time to consider other paths.
There is some qualitative evidence that ‘corporeal capital’ is deployed as a source of social distinction in later life (Furman Reference Furman1997) and some suggestion that its deployment may be expanding ‘attack[ing] all citizens regardless of age, gender, class, ethnicity or sexual preference’ (Hurd Clarke Reference Hurd Clarke2011: 138). Similar observations have been made in relation to frailty and its use as a source of distinction – or division – in later life (Hörder, Frändin and Larsson Reference Hörder, Frändin and Larsson2013; Puts et al. Reference Puts, Shekary, Widdershoven, Heldens and Deeg2009; Warmoth et al. Reference Warmoth, Lang, Phoenix, Abraham, Andrew, Hubbard and Tarrant2015). Such studies suggest that disability and/or frailty may mark a conscious social exclusion within later life. There is also some evidence that later-life disability/ill health provides an objective basis for social-material exclusion (Jehoel-Gijsbers and Vrooman Reference Jehoel-Gijsbers and Vrooman2008). Although disability per se is associated with greater costs, lower income and social exclusion (Zaidi and Burchardt Reference Zaidi and Burchardt2005), there are still very few studies that have examined how late-life disability results in social exclusion. A Dutch study of later-life social exclusion in EU countries and a UK study based on the English Longitudinal Study of Ageing (ELSA), for example, employed subjective measures of health rather than specific disability markers in their examination of the correlates of social exclusion, while including within their ‘old’ subjects people still of working age – i.e. in their fifties (Barnes et al. Reference Barnes, Blom, Cox, Lessof and Walker2006: 28; Jehoel-Gijsbers and Vrooman Reference Jehoel-Gijsbers and Vrooman2008: 38).
A recent study conducted with data on the presence and severity of disability from the 2001 Living in Ireland Survey provides an exception (Cullinan, Gannon and O'Shea Reference Cullinan, Gannon and O'Shea2013). These authors found that social exclusion, measured by the absence/presence of six key material goods (central heating, microwave, video, freezer, dishwasher and if taken a holiday), increased with the severity of disability and declined with the number of people in the household. The most ‘excluded’ were single pensioners with severe disability (Cullinan, Gannon and O'Shea Reference Cullinan, Gannon and O'Shea2013: 179–80). Given the exclusion of many of the most disabled (people in their eighties and nineties, residing not in the community but in nursing homes) from such studies, it seems probable that, as long as community rather than population studies dominate the field, the full impact of later-life disability/infirmity as a source of social exclusion will continue to be under-estimated (Peeters, Debels and Verpoorten Reference Peeters, Debels and Verpoorten2013).
Data from ELSA Wave 6 provide some indirect evidence, at least, of the impact of health on measures of inclusion, despite using self-rated health rather than objective indicators of impairment, and despite excluding those residents in institutions. In a report outlining some of the main findings from this wave of the study, those in excellent health were reported to be six times more likely to have a high level of social/civic engagement and 5.6 times as likely to have high levels of cultural engagement as those in the poorest health. While they were only 1.5 times more likely to have a high level of consumption than those in poor health, those in excellent health were 14.5 times as likely to have high levels of physical activity (Matthews et al. Reference Matthews, Demakakos, Nazroo, Shankar, Banks, Nazroo and Steptoe2014: 83).
Conclusions
The argument put forward in this paper is that issues of corporeality underpin some of the major social divisions of later life in contemporary ageing societies. It is the limitations of bodies, not bank accounts, that prevent so many people from realising what Sen might call their ‘capabilities’ in later life. Those ‘impotent through age’ have long been recognised as forming some of the poorest, most vulnerable people in society. While this ‘impotence’ was once framed as an inability to engage in paid work, compounded by lifelong levels of poor or no wages preventing the accumulation of savings as a financial bulwark, improvements in the standard of living during and after working life have meant that such ‘class’-based impotence, though not irrelevant, no longer serves as the powerful source of social exclusion it once did. In its place has come another equally material marker of impotence, that of later-life infirmity. If a third age culture has emerged allowing many retired people to do things once unthinkable to their predecessors even 50 years ago, the corporeality of a putative ‘fourth age’ poses a more profound challenge to those growing old in the 21st century. The corporeality of age divides those who are simply ‘older’ from those who are ‘too old’, those who are capable (still) of performing as agentic subjects and embodied consumers from those who, constrained by their lack of health or physical capital, are exposed to the limitations of their body that not only confine and constrain but also potentially render the person ‘alien’ to his- or herself.
This is not a divide that emerges as the necessary product of the relations of production, whose origins lie concealed by ideological discourse. It is open, evident and experienced daily by older people themselves, realised both in the fear of frailty and the associated abjection and shame of revealing a failing body (Cantegreil-Kallen and Pin Reference Cantegreil-Kallen and Pin2012; Gilleard and Higgs Reference Gilleard and Higgs2011a ; Kessler Tempel and Wahl Reference Kessler, Tempel and Wahl2014; McKee and Gott Reference McKee, Gott, Gilbert and Miles2002). The nursing home has replaced the workhouse as the institutional representation of those fears and health, rather than income, provides the main protection from its realisation. To treat this division as the realisation of economic and social forces, the outcome of a life of poor pay or limited education, is to imagine that the ageing body is no more than a depositary of other earlier social inequalities and the accumulation of age little more than the epiphenomenon of financial resources. The proponents of the cumulative disadvantage thesis, the social gradient thesis and the weathering hypothesis seem implicitly to accept this view (Blane Reference Blane, Marmot and Wilkinson1999; Crystal and Shea Reference Crystal and Shea1990; Geronimus et al. Reference Geronimus, Hicken, Keene and Bound2006). It is a position that has had much cogency throughout the ‘silver age’ of the post-war welfare state (Taylor-Gooby Reference Taylor-Gooby2002) when savings were scarce, earnings limited and post-working life the culmination of a life lived with constant difficulty and unending hardship. Booth and Rowntree had already recognised this ‘life cycle’ model of poverty by the turn of the 20th century; Townsend elaborated and modified it at mid-century. In the 21st century, we suggest, it no longer provides an adequate representation of later life, at least not in the ageing societies of the 21st century.
The limitations of the body accumulate with age now just as they did in the mid-20th century, even if corporeal loss starts a little later and proceeds at a somewhat slower rate than before (Costa Reference Costa2000; Chatterji et al. Reference Chatterji, Byles, Cutler, Seeman and Verdes2015). In the absence of the generalised poverty that characterised old age a century ago, the corporeality of frailty has, we have argued, emerged as a major source of fracture in later life. No doubt creating and compounding those other divisions, it now plays a central role in shaping what could be called a new ‘abject class’ in old age (Higgs and Gilleard Reference Higgs and Gilleard2015). Chronology and corporeality combine; the older a person is, the greater the risk of frailty and irremediable illnesses. The greater the risk of frailty and illness, the harder it is to escape being assigned an abject position within a class who are united by having failed to ‘age well’. The corporeality of ageing, we would argue, should become the focus in addressing, understanding and ameliorating the social divisions of later life; divisions that otherwise are fast fashioning their own insidious form of exclusion, epitomised by the symbolic role of the nursing home. While studies of income inequality do not show growing disparities with increasing age, inequalities in health do show the precise opposite. By continuing to focus upon socio-economic indicators, their lifelong antecedents and their health-related differences, opportunities for improving the actual circumstances of today's oldest and frailest risk being missed in the search for a solution that will take decades to come to possible fruition.