





Introduction
Rabies is a viral zoonosis of public and animal health importance. It is caused by viruses belonging to the Lyssavirus genus of the Rhabdoviridae family and affects mammals, including humans. Of the 18 currently recognized species of Lyssavirus [1], the classic rabies virus (Lyssavirus rabies or RABV as short name) is the most widespread and is mainly found in domestic carnivores [2]. Dog rabies has been eliminated from France at the beginning of the 19th century, and despite several documented importations of rabid dogs and cats from rabies-enzootic countries, France remained free of dog rabies. Then, from 1968 to 1998, fox rabies (or sylvatic rabies) became a major health threat in mainland France, but oral vaccination campaigns targeting red foxes (Vulpes vulpes) led to its elimination, with the last case of fox rabies reported in 1998 [Reference Aubert, King AA and Aubert3]. Since 2001, France has been officially declared free of classical rabies in non-flying mammals, according to the ministerial decree of 30 April 2001 [4]. However, this favourable epidemiological situation is regularly challenged by the importation of domestic animals (dogs and cats) from enzootic countries.
Now in mainland France, only bat rabies remains enzootic, with indigenous cases regularly reported throughout the country [Reference Picard-Meyer5]. The peculiarity of lyssaviruses other than classical rabies virus lies in their bat reservoir, and their transmission dynamics are often only poorly understood. In Europe, seven species of bat lyssavirus (EBLV-1, EBLV-2, BBLV, WCBV, LLEBV, KBLV, Divača Bat Lyssavirus) have been identified so far (Divača Bat Lyssavirus being not yet officially recognized) [1]. In France, as in Europe, rabies in bats is mainly caused by the European Bat Lyssavirus 1 (EBLV-1, Lyssavirus hamburg), which is mainly found in dead or sick common serotine bats, Cnephaeus ( Eptesicus ) serotinus (Picard-Meyer et al., 2014). The first nucleotide sequence of EBLV-1 in France was obtained from a C. serotinus in 1992 [Reference Bourhy6] but it rapidly appeared that two variants of EBLV-1, namely EBLV-1a and EBLV-1b, were circulating in Europe and in particular in France [Reference Amengual7]. While the EBLV-1a variant is predominantly found in Central and Eastern Europe (France, the Netherlands, Denmark, Germany, and Poland), EBLV-1b has been reported in Spain, France, south-western Germany, and central Poland [Reference Vázquez-Morón8–Reference Van Der Poel12]. EBLV-1 is a zoonotic virus that has been occasionally implicated in spillovers in non-flying animals [Reference Dacheux13] and in fatal human cases [Reference Regnault14, Reference Kuzmin15].
In mainland France, EBLV-1a and EBLV-1b are the two predominant variants of bat rabies virus detected since the implementation of the French national rabies passive surveillance system in bats in 1989. EBLV-1a variant has been detected in south-western France, while the EBLV-1b variant has been mainly found in the centre and north of the country, with little overlap between their distributions (i.e. parapatric distribution), suggesting a possible geographical segregation. However, the factors underlying this apparent parapatric distribution remain undetermined. In ecology, sharp distribution limits between two species often coincide with marked environmental gradients that correspond to the limits of each species’ tolerance to abiotic factors, or influence parameters of biotic interactions such as competitive abilities [Reference Barton and Hewitt16, Reference Case17].
Bats from temperate regions, including the common serotine, which is present all over metropolitan France, have a biological cycle that is based on environmental conditions [Reference Arthur and Lemaire18]. Their annual life cycle is indeed divided into several phases, each dedicated to specific activities with specific habitats and changes in bat physiological parameters. During winter, with cold temperatures and decline in insect availability, bats enter hibernation. In spring, from March-April onwards, bats become active again. The end of spring and summer are dedicated to the birth and growth of juveniles, while late summer and fall are dedicated to the swarming and mating period. Bats have the specificity of being heterothermic animals, meaning that their body temperature is not always constant. Depending on activity and environmental conditions, they can enter into torpor (a physiological state lasting hours to days, characterized by reduced metabolic activity and lowered body temperature) or hibernation. As global reference values, it seems that temperatures below 0 °C and up to 11 °C are outside the optimal range for bat hibernation in France [Reference Arthur and Lemaire18]. Such optimal ambient temperatures for hibernation are probably the reason why bats seek out humid places with stable temperatures where they can stay throughout the winter [Reference Nagel and Nagel19]. Indeed, emerging from hibernation is very energy-intensive for the body, and the repetition of such an event could be harmful to the animal [Reference Jonasson and Willis20].
As temperature largely influences their life cycle and physiology, it also potentially has cascading effects on bat pathogen persistence and replication, infection dynamics, and viral transmission. The body temperature of bats, which is linked to environmental temperatures, may indeed be one of the key factors underlying their unusual ability to coexist with viruses, as well as their distinctive physiology regarding viral persistence and asymptomatic carriage. Indeed, temperature fluctuations between euthermy and torpor enable robust control of viral infections by promoting quasi-periodic immune dynamics that limit viral replication without excessive inflammation. During torpor, bats exhibit slowed immune activity, reducing energy expenditure but allowing viral persistence, while arousal phases then reactivate antiviral responses [Reference Fumagalli, Zapperi and La Porta21]. In this context, such physiological traits may have population-level consequences at large spatial scales, potentially shaping virus distribution ranges. This raises the question of whether climatic factors, through distinct differences in climatic niches or, alternatively, through the overlapping of climatic niches combined with biotic factors such as interspecific competition, could explain the apparently distinct distribution areas of EBLV-1a and EBLV-1b in France. The current biogeographic pattern, where two phylogenetic clades occupy adjacent but largely non-overlapping geographic ranges, could indeed be maintained by competition of the clades within the host populations (virological factors) and/or competition between host groups (ecological factors).
In this study, we used generalized linear models (GLM) to identify the climatic factors (temperature, precipitation) that influenced EBLV-1a and EBLV-1b. Then, we used a species distribution modelling (SDM) approach to estimate the potential habitat suitability of the EBLV-1a and EBLV-1b variants in France based on climatic factors, and to visualize potential areas of sympatry in the geographical space.
Materials and methods
Lyssavirus dataset
Two sets of epidemiological data, all issued from the passive French national surveillance plan of Lyssaviruses. Dataset 1 consisted of positive and negative cases of rabies diagnosed in bats between 2001 and 2024 by the French National Reference Laboratory (NRL) for Rabies, that is, the ANSES Nancy Laboratory for Rabies and Wildlife. It took into account confirmed EBLV-1a and EBLV-1b positive and unconfirmed positive cases diagnosed in bats of the species Cnephaeus (Eptesicus) serotinus, commonly named the common serotine (Figure 1). Cases involving other bat species (Vespertillionidae, Myotis, etc.) were excluded from the analysis, since these species are not the reservoir of EBLV-1. Inconclusive cases, mostly due to samples impossible to analyse because of putrefaction, were discarded from the dataset.
Distribution of negative (black dots), EBLV-1a (red dots), and EBLV-1b (blue dots) cases detected in the common serotine in metropolitan France representing Dataset 1. Background is illustrated by one of the 19 variables of the WorldClim dataset (BIO1: mean annual temperature).

Figure 1. Long description
Map of metropolitan France displaying the spatial distribution of common serotine bat records included in Dataset 1. Negative cases are shown as black dots, EBLV-1a cases as red dots, and EBLV-1b cases as blue dots. The points are overlaid on a climatic raster layer from WorldClim version 2.1 representing BIO1 (annual mean temperature). The figure illustrates the geographic distribution of virus variants in relation to climatic conditions across France.
Dataset 2 included all positive EBLV-1 cases detected in mainland France between 1989 and 2024. It combined positive cases diagnosed by the ANSES National Reference (NRC) Laboratory and by the Institut Pasteur National Reference Centre (IPP). Consequently, Dataset 2 contained all positive cases from Dataset 1 together with additional positive records unavailable in Dataset 1.
All diagnoses were performed using Fluorescent Antibody Test as first-intention test, and using the Rabies Tissue Culture Infection Test or RT-PCR, or real-time RT-PCR as confirmatory tests for positive samples, according to techniques described in the WOAH manual [22].
For both datasets, geographical localization of the cases was considered as the centroid of the municipality.
Climatic dataset
The climatic dataset came from the WorldClim database (version 2.1) [Reference Fick and Hijmans23], which is widely used in spatial ecology and biogeography studies [Reference Freeman24–Reference Shabani26]. These are raster data derived from high-resolution interpolated climate observations (~2.5 arc minutes, or approximately 4.5 km), covering the reference period 1970 to 2000. The source files included a set of 19 standardized climatic variables, coded from BIO1 to BIO19. These climatic variables relate to temperature and rainfall measured over this period. The selection of the climatic variables were the followings:
BIO1 = Annual Mean Temperature
BIO5 = Max Temperature of Warmest Month
BIO6 = Min Temperature of Coldest Month
BIO7 = Temperature Annual Range (BIO5-BIO6)
BIO8 = Mean Temperature of Wettest Quarter
BIO9 = Mean Temperature of Driest Quarter
BIO10 = Mean Temperature of Warmest Quarter
BIO11 = Mean Temperature of Coldest Quarter
BIO12 = Annual Precipitation
BIO13 = Precipitation of Wettest Month
BIO14 = Precipitation of Driest Month
BIO16 = Precipitation of Wettest Quarter
BIO17 = Precipitation of Driest Quarter
BIO18 = Precipitation of Warmest Quarter
BIO19 = Precipitation of Coldest Quarter
They covered a broad spectrum of climatic dimensions that could potentially influence the distribution of the viruses studied. Climatic values were extracted for each occurrence point using the geographical coordinates of French municipalities, thus enabling biological observations to be linked to local environmental conditions.
Statistical analysis
Multinomial logistic regression models explaining the probability of occurrence of EBLV1a, EBLV1b and negative cases among analysed samples
In order to assess the influence of climatic variables on the presence of EBLV-1a, EBLV-1b, and on negative cases, a multinomial generalized linear model was adjusted using the multinom function of the nnet package of R software [27]. This model was applied to dataset 1, in which the response variable consisted of three categories: positive cases for EBLV-1a (34 cases), positive cases for EBLV-1b (55 cases) and negative cases (485 cases). None of the municipalities recorded both EBLV-1a and EBLV-1b cases during the study period.
In order to prevent any biased estimation of regression coefficients, multicollinearity between climatic explanatory variables was checked by analysing their correlation coefficients. This first check highlighted four sets of variables exhibiting marked collinearity (Supplementary Material). Each of these sets was integrated separately into four sub-models based on their biological sense in order to assess their respective influence while preserving the robustness of the results. On this basis, four sets of non-collinear variables, with absolute Pearson correlation coefficients < 0.6, were defined and tested as candidate models:
Modmult1: Average annual temperature (BIO1), annual temperature range (BIO7), annual rainfall (BIO12).
Modmult2: Maximum temperature of the hottest month (BIO5), minimum temperature of the coldest month (BIO6), rainfall of the wettest month (BIO13), rainfall of the driest month (BIO14).
Modmult3: Average temperature of the wettest quarter (BIO8), average temperature of the driest quarter (BIO9), average temperature of the hottest quarter (BIO10), rainfall of the wettest quarter (BIO16), rainfall of the driest quarter (BIO17).
Modmult4: Average temperature of the wettest quarter (BIO8), average temperature of the coldest quarter (BIO11), rainfall of the warmest quarter (BIO18), rainfall of the coldest quarter (BIO19).
For each model set, candidate sub-models derived from the global model were automatically generated with the dredge function in the MuMIn package, and the best model was selected based on the corrected Akaike information criterion (AICc), meaning the model with the fewest explanatory variables and a ΔAICc < 2 [Reference Burnham and Anderson28]. Each best model of the four sets was then compared subsequently, and the best final model was again selected based on AICc [Reference Burnham and Anderson28]. Diagnostics of the final selected model were assessed using the DHARMa package.
Binomial generalized linear models explaining the probability of occurrence of EBLV-1a and EBLV-1b among positive cases
To better evaluate the discrimination between EBLV‑1a and EBLV‑1b, and given the higher number of positive cases in dataset 2 (which combines ANSES and IPP positive results) compared to dataset 1 (without available negative cases), we used GLM with a binomial distribution to analyse the relationship between the response variable ‘presence of EBLV-1a’ (n = 48) or ‘presence of EBLV-1b’ cases (n = 89) within positive cases and climatic variables. As this model considered only positive cases, it therefore analysed the links between climatic variables and the presence of the EBLV-1a variant in relation to the presence of the EBLV-1b variant, making it a relevant tool for understanding the relative distribution of these two viral lineages, with P(EBLV-1b) = 1 – P(EBLV-1a) among positive cases.
The explanatory climatic variables were grouped together after studying multicollinearity to form sub-models. This resulted in four subsets of models with the same factors as for the multinomial model:
ModGlm1: BIO1+ BIO7 + BIO12
ModGlm2: BIO5+ BIO6+ BIO13 + BIO14
ModGlm3: BIO8 + BIO9 + BIO10 + BIO16 + BIO17
ModGlm4: BIO8+ BIO11 + BIO18 + BIO19
As for the multinomial modelling, the four candidate sub-models for logistic regression were derived from the four global models using the dredge function implemented in the MuMIn package. As a second step, the best‐performing model was selected from among the four final candidate models. All model selections relied on the corrected Akaike Information Criterion (AICc), and model adequacy was evaluated using diagnostic tools provided by the DHARMa package.
SDM to estimate habitat suitability of EBLV-1a and EBLV-1b variants
We used SDMs [Reference Elith and Leathwick29] to estimate habitat suitability of EBLV-1a and EBLV-1b variants across metropolitan France, based on environmental variables of climatic origin. This approach is based on the relationship between observed occurrences and spatialized climatic variables, in order to describe the conditions favourable to the presence of the viruses.
The 15 bioclimatic variables were processed in R using the terra, raster, and geodata libraries [27].
Positive cases of dataset 2 were used. To address the absence of negative cases, we used 1000 pseudo-absence localizations for each EBLV-1 variant [Reference Barbet-Massin30], which were randomly generated within metropolitan France— that is, the documented distribution range of the common serotine [Reference Arthur and Lemaire18]. The corresponding climatic values were extracted for these points and then combined with those of the presence points to form a complete dataset. Prior to modelling, the climatic variables were centred and reduced, then subjected to principal component analysis (PCA) using the FactoMineR package [Reference Lê, Josse and Husson31] to reduce collinearity while retaining the full set of information. A PCA was performed for each EBLV-1 variant, and a composite variable based on the four principal components explaining more than 89% of the total variance was derived from the leading components to capture the major sources of variance within the climatic dataset.
Modelling (10 replicates) was performed using the MaxEnt algorithm (Maximum Entropy, maxnet package) and applied separately to the two variants. Each model was replicated ten times to assess the stability and robustness of the predictions. For each replicate, performance was evaluated using the area under the ROC curve and the True Skill Statistic (TSS), indicators of the model’s discriminatory power and overall accuracy, respectively. AUC, with values ranging from 0.5 to 1 (1 indicating perfect prediction), assessed the model’s overall ability to discriminate presence from absence, while TSS, ranging from 0 to 1 (1 being perfect prediction), evaluated accuracy at a specific threshold by combining sensitivity and specificity.
Optimal classification thresholds were derived from the ROC curves, selecting the cut-off that maximizes Youden’s J statistic to convert continuous probabilities into presence/absence. Sensitivity and specificity were then calculated using the resulting confusion matrix. The calibrated models were projected across metropolitan France using the composite variable, enabling maps of habitat suitability to be generated for each variant. The ten replicates were then averaged to obtain a final map representing the average habitat suitability of EBLV-1a and EBLV-1b.
Results
Analysis of the relationship between climatic variables and the presence or absence of EBLV-1a and EBLV-1b
Based on AICc values,the best-supported model was ‘Modmult2’ (Table 1). Modmult2 incorporated maximum temperature of the hottest month (BIO5), minimum temperature of the coldest month (BIO6), precipitation of the wettest month (BIO13), and precipitation of the driest month (BIO14) as predictors.The final model retained (Modmult2) BIO6 and BIO14 as significant predictors.
Comparison of fitted selected generalized linear models to explain the link between climatic factors and EBLV-1a and EBLV-1b; final selected models are in bold

Table 1. Long description
Table comparing the final candidate models used to assess relationships between climatic variables and EBLV-1 variants. For the multinomial analysis including positive and negative samples, Modmult2 (BIO5, BIO6, BIO13 and BIO14) had the lowest AICc value (548.57), indicating the best fit among tested models. Other multinomial models showed higher AICc values: Modmult1 = 555.40, Modmult3 = 557.38 and Modmult4 = 569.28. For the logistic analysis restricted to positive samples, ModGlm3 (BIO8, BIO9, BIO10, BIO16 and BIO17) had the lowest AICc value (55.2), followed by ModGlm1 (57.7), ModGlm2 (66.3) and ModGlm4 (137.5). Lower AICc values indicate better model performance.
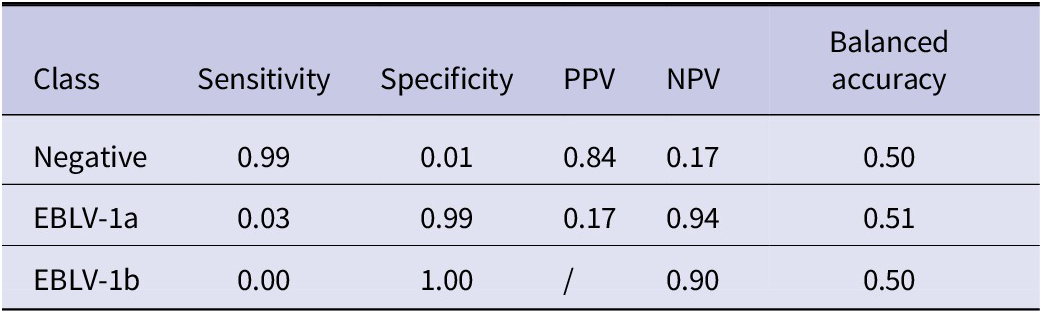
The performance of the selected multinomial model (Modmult2) was evaluated by comparing the predictions and observed presence/absence records for each variant (Table 2).
Characteristic performance of the selected model

Table 2. Long description
Table summarizing the predictive performance of the selected multinomial model for three classes: Negative, EBLV-1a and EBLV-1b. For negative samples, sensitivity was 0.99, specificity 0.01, positive predictive value (PPV) 0.84, negative predictive value (NPV) 0.17 and balanced accuracy 0.50. For EBLV-1a, sensitivity was 0.03, specificity 0.99, PPV 0.17, NPV 0.94 and balanced accuracy 0.51. For EBLV-1b, sensitivity was 0.00, specificity 1.00, PPV was not estimable, NPV was 0.90 and balanced accuracy was 0.50. Overall, the model showed high specificity but very low sensitivity for detecting EBLV-1a and EBLV-1b cases.
Class: Category being predicted (here: Negative, EBLV‑1a, and EBLV‑1b); Sensitivity: True Positive Rate (proportion of actual positives correctly identified); Specificity: True Negative Rate (proportion of actual negatives correctly identified); PPV: Positive Predictive Value (proportion of predicted positives that are true positives); NPV: Negative Predictive Value (proportion of predicted negatives that are true negatives); Balanced Accuracy: Average of Sensitivity and Specificity, accounting for imbalanced classes.
The results indicated an overall accuracy of 0.83 (95% CI: 0.80–0.86), suggesting that the model correctly predicted approximately 83% of the observations. However, the Kappa coefficient value (0.007) indicated a very low concordance between observed and predicted values beyond chance, reflecting limited performance in discriminating between different diagnostic classes.
The ‘Negative’ class was the one for which the model performed best, with a sensitivity of 0.99 and a positive predictive value of 0.84. This meant that the model correctly identified the majority of negative cases, although it tended to predict this class dominantly (high prevalence of ‘Negative’ in the data).
In contrast, the ‘EBLV-1a’ and ‘EBLV-1b’ classes were poorly recognized, with sensitivities of 0.029 and 0.00, respectively, and high specificity (> 0.98). These results reflected an under-representation of positive cases in the predictions, as the model had difficulty differentiating between the two viral variants due to the imbalance between the classes and a probable climatic similarity between their areas of occurrence. Overall, these results suggested that, although the model correctly reproduced the dominant distribution of negative cases, its discriminatory power remained limited for positive diagnoses of the EBLV-1a and EBLV-1b types.
EBLV-1a (vs negative)
The occurrence of EBLV-1a compared to negative cases was mainly influenced by two climatic variables (Table 3). BIO6 (minimum temperature of the coldest month) showed a significant positive effect (p < 0.001), indicating that milder cold months (i.e. January or February) increased the probability of a positive EBLV-1a case compared to negative cases. BIO14 (rainfall of the driest month) was also positively associated (p = 0.015), suggesting that wetter conditions during the driest month favoured the positivity of cases for EBLV-1a. In contrast, no significant effect of BIO5 (maximum temperature of the hottest month) and BIO13 (rainfall of the wettest month) on the presence of EBLV-1a was detected.
Estimates for the multinomial model regression Modmult2

Table 3. Long description
Table presenting parameter estimates from the selected multinomial model (Modmult2) assessing associations between climatic variables and EBLV-1 variants. Compared with negative cases, EBLV-1a occurrence was positively associated with BIO6 (minimum temperature of the coldest month; p < 0.001) and BIO14 (precipitation of the driest month; p = 0.015), while BIO5 and BIO13 were not significant. Compared with negative cases, EBLV-1b occurrence was positively associated with BIO5 (maximum temperature of the hottest month; p = 0.037) and BIO14 (p = 0.001), and negatively associated with BIO6 (p = 0.002). When EBLV-1b was used as the reference category, EBLV-1a was positively associated with BIO5 and BIO6 and negatively associated with BIO13 (precipitation of the wettest month). These results indicate distinct climatic preferences between the two viral variants.
The bold values have a p-value less than 0.05.
EBLV-1b (vs negative)
For EBLV-1b, three variables were statistically significant (Table 3): BIO5 presented a moderate positive effect (p = 0.037), indicating that high temperatures in hotter months (i.e. July or August) increased the probability of EBLV-1b occurrence compared to negative cases. BIO6 showed a significant negative effect (p = 0.002), suggesting that this variant was associated with areas experiencing colder winter temperatures—opposite to EBLV-1a. BIO14 revealed a positive effect (p = 0.001), implying that precipitation during the driest month also promoted the presence of EBLV-1b, but to a lesser extent than shown for EBLV-1a. The effect of BIO13 was not significant.
EBLV-1a (vs EBLV-1b)
The occurrence of EBLV-1a in reference to EBLV-1b was mainly influenced by three climatic variables (Table 3). BIO5 (maximum temperature of the hottest month) and BIO6 (minimum temperature of the coldest month) showed a significant positive effect (p < 0.001), indicating that milder cold months (i.e. January or February) and high temperatures in the hottest month (i.e. July or August) increased the probability of detecting EBLV-1a. BIO13 (rainfall of the wettest month) was negatively associated (p = 0.001), suggesting that precipitation during the wettest month (i.e. October or November) did not favour this variant. This estimation has to be taken with caution, considering the lower performance of the model in discriminating EBLV-1b from EBLV-1a.
In summary, the occurrence of EBLV-1 cases, relative to negative cases, was influenced by mild temperatures during January/February, high temperatures during July/August, and higher precipitation during the driest months (Figure 2). The two variants, however, exhibit distinct climatic preferences, with EBLV-1a being more likely detected than EBLV-1b in milder January/February and warmer July/August, whereas EBLV-1b was favoured by higher precipitation during October/November.
Influence of bioclimatic factors (BIO6 and BIO14) on the expected probability and interval confidences of EBLV-1a, EBLV-1b and negative cases among tested samples.

Figure 2. Long description
Figure showing the influence of two climatic variables, BIO6 (minimum temperature of the coldest month) and BIO14 (precipitation of the driest month), on the predicted probabilities of negative cases, EBLV-1a cases and EBLV-1b cases. The curves represent model-predicted probabilities and the shaded areas or error bands represent confidence intervals. Increasing BIO6 values are associated with a higher probability of EBLV-1a occurrence and a lower probability of EBLV-1b occurrence. Increasing BIO14 values are associated with higher probabilities of both viral variants relative to negative cases. The figure illustrates contrasting climatic responses of EBLV-1a and EBLV-1b, particularly with respect to winter temperature, while both variants tend to be associated with wetter conditions during the driest month.
Analysis, among positive samples, of the relationship between climatic variables and the presence of EBLV-1a or of EBLV-1b
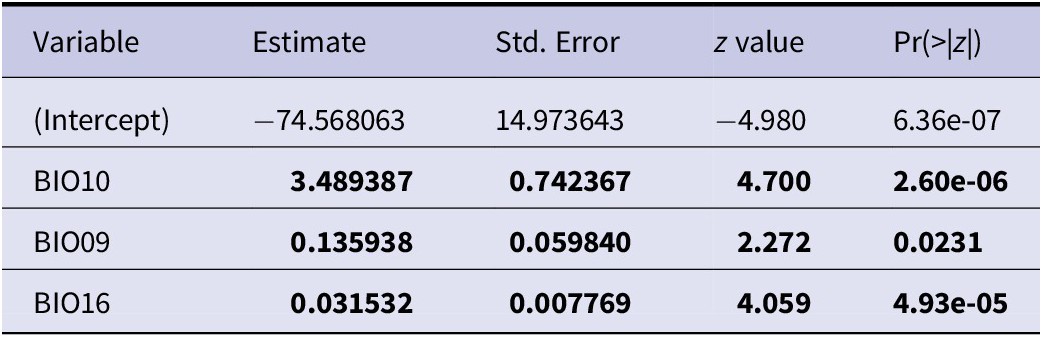
Among the four logistic models tested, the model (ModGlm3) was selected as the most suitable for analysing the distribution of EBLV-1a versus EBLV-1b, based on the AIC values (Table 3). The explanatory variables of the ModGlm3 model were the average temperature of the warmest quarter (BIO10), average temperature of the driest quarter (BIO09), and precipitation of the wettest quarter (BIO16), indicating that all three variables were important predictors for the model (Table 4).
Parameter estimates for the logistic regression (ModGlm3) explaining links between climatic factors and presence of EBLV-1a regarding EBLV-1b

Table 4. Long description
Table presenting parameter estimates from the selected logistic regression model (ModGlm3) comparing EBLV-1a and EBLV-1b among positive samples. Three climatic variables were significantly associated with EBLV-1a occurrence relative to EBLV-1b. BIO10 (mean temperature of the warmest quarter) had the strongest positive effect (estimate = 3.489, p < 0.001). BIO09 (mean temperature of the driest quarter) also showed a positive association (estimate = 0.136, p = 0.023). BIO16 (precipitation of the wettest quarter) was positively associated with EBLV-1a occurrence (estimate = 0.032, p < 0.001). These results indicate that warmer summer temperatures, warmer dry-season temperatures and higher precipitation during the wettest quarter increase the probability of detecting EBLV-1a relative to EBLV-1b.
The bold values have a p-value less than 0.05.
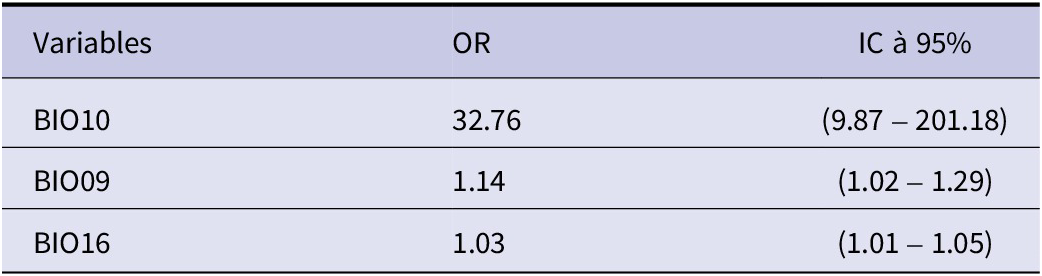
For EBLV-1a, an increase of one unit in the average temperature of the warmest quarter (BIO10), while holding the average temperature of the driest quarter (BIO09) and precipitation in the wettest quarter (BIO16) constant, multiplied the odds of detecting an EBLV-1a case by approximately 32.76 compared to EBLV-1b. However, the confidence interval (CI: 9.87–201.18) was very wide, indicating a significant positive but imprecise effect. BIO10, BIO09, and BIO16 were respectively associated with 32.76 fold (CI: 9.87 – 201.18), 1.14-fold (CI: 1.02–1.29), and 1.03 fold (CI: 1.01–1.05) increase in the detection probability of EBLV-1a compared to EBLV-1b, reflecting a strong and significant positive effect of the warmer quarter (summer) temperature average, a moderate effect of the mean temperature of driest quarter, and of precipitation in the wettest quarter on the occurrence of EBLV-1a among positive cases (Table 5). Thus, based on the predicted values, EBLV-1a became more likely than EBLV-1b in positive samples when the average temperature of the summer in the locality of case detection was above 18.6 °C, when the average temperature of the summer was above 20.5 °C, and when the amount of precipitation in the wettest quarter was above 294.3 mm (Figure 3). The evaluation of ModGlm3 with the DHARMa package indicated a good performance of the model.
Odds ratio of ModGlm3 and their confidence intervals (CI)

Table 5. Long description
Table summarizing odds ratios and 95% confidence intervals derived from the selected logistic regression model (ModGlm3). BIO10 (mean temperature of the warmest quarter) showed the strongest effect, with an odds ratio of 32.76 (95% CI: 9.87–201.18), indicating a substantial increase in the probability of EBLV-1a occurrence relative to EBLV-1b as temperature increases. BIO09 (mean temperature of the driest quarter) had an odds ratio of 1.14 (95% CI: 1.02–1.29), while BIO16 (precipitation of the wettest quarter) had an odds ratio of 1.03 (95% CI: 1.01–1.05). All confidence intervals excluded one, supporting significant positive associations.
Influence of bioclimatic factors (BIO9, BIO10, and BIO16) on the expected probability and interval confidences of EBLV-1a (Green) and EBLV-1b (Blue) infection among positive samples.

Figure 3. Long description
Figure showing the effects of three climatic variables on the predicted probabilities of EBLV-1a (green) and EBLV-1b (blue) among positive samples. The curves represent model-predicted probabilities and the shaded areas or error bands represent confidence intervals. Increasing values of BIO10 (mean temperature of the warmest quarter), BIO09 (mean temperature of the driest quarter) and BIO16 (precipitation of the wettest quarter) are associated with a higher probability of EBLV-1a relative to EBLV-1b. Based on model predictions, EBLV-1a becomes more likely than EBLV-1b when the mean temperature of the warmest quarter exceeds approximately 18.6 °C, when the mean temperature of the driest quarter exceeds approximately 20.5 °C, and when precipitation during the wettest quarter exceeds approximately 294.3 mm. The figure illustrates climatic conditions that favour EBLV-1a compared with EBLV-1b among positive cases.
Exploring the French distribution of the EBLV-1a and EBLV-1b variants based on climatic datasets
The calibrated models were projected across metropolitan France using the composite variable representing the four principal components of PCAs. Ten replicated models were then averaged for each variant to obtain a final map representing the average probability of EBLV-1a and EBLV-1b presence (Figure 4a,b). The models obtained showed satisfactory performance for EBLV-1a with mean Area Under the Curve (AUC) values of 0.90 (with standard deviation SD of 0.008), and mean TSS values of 0.71 (SD = 0.023), indicating good predictive performance and consequently a good compromise between sensitivity and specificity. Regarding EBLV-1b, the mean AUC was approximately 0.81 with a low standard deviation (SD = 0.009), also indicating good predictive performance with high stability across replicates. The mean TSS was around 0.51 with limited variability (SD = 0.019), confirming that the model exhibits good discriminatory power and consistent predictions. Habitat suitability maps were binarized using the threshold maximizing the TSS, providing an optimal balance between sensitivity and specificity; the value was 0.24 for EBLV-1a and 0.42 for EBLV-1b. Modelling with binary outcome indicated almost no overlapping of EBLV-1a and EBLV-1b suitable habitats (Figure 5).
Habitat suitability estimated for A) EBLV-1a and B) EBLV-1b based on climatic factors using MaxEnt.

Figure 4a. Long description
Map of metropolitan France showing habitat suitability for EBLV-1a predicted using a MaxEnt species distribution model based on climatic variables. Habitat suitability is represented by a colour gradient ranging from light green (lowest suitability, probability below 0.05) to red (highest suitability, probability between 0.7 and 0.8). The highest suitability values are concentrated in south-western France, particularly near the Atlantic coast and the Pyrenean region. Moderately suitable areas occur across parts of southern France and locally in south-eastern regions. Most of northern, north-eastern and central France display low suitability values represented by green and yellow colours. The map indicates a clear south-west to north-east gradient in predicted habitat suitability, suggesting that climatic conditions favourable to EBLV-1a are concentrated in the warmest and relatively humid regions of metropolitan France.

Figure 4b. Long description
Map of metropolitan France showing habitat suitability for EBLV-1b predicted using a MaxEnt species distribution model based on climatic variables. Habitat suitability is represented by a colour gradient ranging from light green (lowest suitability, probability below 0.05) to red (highest suitability, probability between 0.7 and 0.8). The highest suitability values are concentrated in northern, north-central and north-western France, extending through a broad band from western regions toward the north-east. Moderate suitability is observed across much of central France. In contrast, suitability decreases markedly in south-western France, along the Mediterranean coast and in parts of south-eastern France, where green colours dominate. Compared with the EBLV-1a suitability map, the spatial pattern is largely complementary, indicating that climatic conditions favourable to EBLV-1b differ from those favouring EBLV-1a. The map highlights a predominance of suitable habitat in cooler and less Mediterranean climatic regions of metropolitan France.
Combined visualization of binary habitat suitability of EBLV-1a (green) and EBLV-1b (blue).

Figure 5. Long description
Map of metropolitan France showing binary habitat suitability predictions for EBLV-1a and EBLV-1b derived from MaxEnt models. Areas unsuitable for both variants are shown in light grey. Areas suitable only for EBLV-1a are shown in dark green and are concentrated mainly in south-western France, extending from the Atlantic coast toward the Pyrenean region, with a few isolated patches elsewhere. Areas suitable only for EBLV-1b are shown in blue and cover much of northern, central and north-eastern France. Areas suitable for both variants are shown in purple and are restricted to a few small, localized patches, mainly at the margins of the larger suitable regions. The map demonstrates a strong spatial segregation between EBLV-1a and EBLV-1b suitable habitats, with very limited overlap, supporting the hypothesis that the two variants occupy distinct ecological niches in metropolitan France.
Discussion
Our study revealed a strong link between temperature and precipitation on EBLV-1a and EBLV-1b distribution in metropolitan France. Among analysed samples, the occurrence of EBLV-1 cases was influenced by mild temperatures during January–February (winter), high temperatures during warmest month (summer), and elevated rainfall during the typically dry months. EBLV-1a had a stronger relationship than EBLV-1b with higher rainfall during the driest month, suggesting an association with more humid summer conditions. The average temperature of the summer also emerged as the strongest factor, increasing the probability of detecting EBLV-1a cases by a factor of 33 compared to EBLV-1b among positive cases. This indicates that, in metropolitan France, areas experiencing warmer and more humid summers tend to favour the presence of EBLV-1a over EBLV-1b. Furthermore, SDMs integrating multiple climatic factors predicted EBLV-1a occurrence mainly in the south-west and south-east regions, known to be the hottest metropolitan French areas with more humid seasons. Binary habitat mapping presented almost no overlapping of EBLV-1a and EBLV-1b suitable habitats, supporting the hypothesis that the two variants occupy partly distinct ecological niches. To date, no study has formally established a link between climatic conditions and the distribution of European bat lyssavirus variants. Although the first case of EBLV-1a and EBLV-1b in France, probably undetected, may have appeared sporadically within the host’s geographic range, the subsequent spread of the two variants resulted in a spatial pattern that currently appears non-random and linked to the climatic conditions.
Because temperature and humidity modulate viral replication, host immune responses to viral infections, and lifestyle of hosts, they have been shown to be key components in viral infection occurrence and transmission rates [Reference Moriyama, Hugentobler and Iwasaki32]. The heterothermic nature of bats, their ability to fly, combined with their specific immune mechanisms – particularly allowing them to host viruses – questioned the impact of human society, including climatic change, on bat virus emergence [Reference Calisher33, Reference Plowright34]. From the smallest to the broadest perspective, studies are trying to better characterize the relationship between bat viruses and environmental and climatic conditions. Several studies have indeed shown a link between temperature and the distribution or emergence of pathogens such as the Hendra virus, Nipah virus, SARS-CoV-1, etc., in bat populations [Reference Latinne and Morand35, Reference Eby36]. McKee et al. [Reference McKee37] suggested that nectarivorous bat populations fragmented in response to periods of food scarcity (low flowering), leading to an increased use of agricultural and urban areas in winter, resulting in Hendra virus spills-over. El Niño events were always followed by food shortages for bats, even if other events also occurred outside this period. In South America, climate and more specifically climatic change has already been cited as a potential driver of the northward expansion of the species Desmodus rotundus, reservoir of Lyssavirus rabies, associated with an increase in detected rabies cases in livestock [Reference Gohlke and Escobar38].
The occupation of distinct environmental niches by EBLV‑1a and EBLV‑1b may be explained by two scenarios: one in which environmental factors alone drive their distribution, and another in which temperature‑dependent fitness interacts with competitive dynamics between the two variants. In the first hypothesis, temperature alone could shape the relative fitness of the two variants, with each one being favoured under specific thermal conditions. However, because both variants occur in countries with diverse climatic profiles,this explanation alone may be insufficient. In the second hypothesis, variant fitness would instead reflect a combination of temperature‑dependent effects and competitive interactions, driven by both virological factors (intrinsic traits of each variant) and ecological factors (host conditions, environmental context, and transmission dynamics).
From a pathogen perspective, the fitness of each variant may be optimized under different environmental conditions, as viral replication could respond variably to host body temperature, which is itself shaped by the bat’s thermoregulatory capacity and surrounding climatic conditions. At the cellular level, a study demonstrated the absence of a cellular response to EBLV-1 infection under hibernation-like temperatures (5 °C vs. 37 °C), suggesting that hibernation may temporarily halt viral replication and contribute to the seasonal cyclicity of infection [Reference Harazim39]. Also, cross-protective immunity, coupled with limited opportunities for new viral introductions, may have shaped the spatial distribution of the two variants by preventing one variant from establishing where the other is present.
From a host perspective, limited connectivity between the two host populations of the common serotine could have accounted for this spatial pattern; however, a previous research showed that host genetic variation did not explain the spatio-temporal distribution of European bat lyssavirus 1, implying the absence of distinct host populations or restricted viral circulation [Reference Troupin40].
This parapatric distribution could also be the result of the geographical distribution of other bat species that would constitute the real primary host of EBLV-1a and EBLV-1b; C. serotinus being only a species particularly vulnerable to EBLV-1 infection, a kind of sentinel species revealing the presence of the circulation of the virus and dying from the infection. This hypothesis is consistent with data from laboratory surveillance showing a predominance of C. serotinus being found dead and sick due to EBLV-1 infection. It is also supported by many serological evidence showing the circulation of EBLV-1 in different European insectivorous bat species that survive from the infection [Reference Amengual7, Reference Serra-Cobo41–Reference López-Roig43] and by mathematical modelling trying to explain the persistence of EBLV-1 in natural colonies of bats and showing that it relies on: i) host spatial structure through the migratory nature of other bat species such as Miniopterus schreibersii, ii) cross-species mixing with other bat species such as Myotis myotis, and iii) survival of infected animals followed by temporary immunity [Reference Amengual44, Reference Pons-Salort45].
Climate change and habitat loss will alter the distribution and functional diversity of bats in Europe, with impacts on ecosystems [Reference Fialas46], and potentially on the geographical distribution of their pathogens. EBLV-1b has been recently detected for the first time in the United Kingdom [Reference Folly47], while previous studies highlighted the risk of such introduction, based on population genetic studies, due to the detection of serotine movement to the United Kingdom from the European continent [Reference Moussy48]. Also, temperature is known to directly affect the survival of bats. Serotines have indeed been shown to maintain roost temperatures of around 22 °C during gestation and lactation, and mortality of young was observed after a period of low temperature and/or rain during the night, and correspondingly reduced insect activity [Reference Harbusch and Racey49]. Inversely, too high temperatures could contribute to higher mortality, as observed in several bat species [Reference Russo50, Reference Merone51]. By acting as a physiological stressor, inappropriate environmental conditions may also further increase susceptibility to infection [Reference Gonzalez52].
This study highlighted the relationship between climatic factors and the distribution of EBLV-1 variants in bats, which are highly sensitive to climatic conditions throughout their life cycle. Further research is needed to clarify the roles of virological and ecological factors in shaping EBLV‑1 distribution. The observed patterns are inherently dependent on the cases detected, and increasing case detection would likely provide a clearer understanding of the distribution. Expanding studies to broader regions, for example at the European level, could help to better identify suitable habitats for these variants. The finding of a strong association of these variants distribution with climatic factors suggests that climate change may influence the future circulation and geographic range of EBLV‑1 variants, while simultaneously raising questions about potential changes in human exposure risk.
The interpretation of these results should nevertheless take into account the passive nature of the surveillance system. Detection probability is likely heterogeneous across metropolitan France because submission rates may vary according to human population density, public awareness, and local surveillance effort. Although such bias is unlikely to fully explain the observed parapatric pattern, it may influence the apparent distribution of detected cases.
Data availability statement
The data analysed in this work originate from a national surveillance system and are not publicly accessible. Access to these data requires authorization from the competent authority. Requests can be directed to the data holder, subject to institutional and legal requirements.
Acknowledgements
We are grateful to the SFEPM network, naturalist associations, wildlife rescue centres, citizens, veterinarians, Departmental Directorate for Population Protection services, and all those who submitted common serotines for rabies diagnosis. Also, we would like to thank the Ministry of Ecology for authorizations of bat collection and transport, and all the ANSES Nancy and IPP laboratory and administrative staff who have been involved in bat rabies diagnosis process during the study period. AI tool was used solely for language assistance (rephrasing and enhancing the clarity and fluency of the English text). No scientific content was generated by AI.
Author contribution
Conceptualization: E.M.P.A., E.P., A.S., L.B., E.R.; Data curation: E.M.P.A., E.P., A.S., P.P., H.B.; Formal analysis: E.M.P.A., E.P., A.S., P.P., H.B., E.R.; Investigation: E.M.P.A., E.P., A.S., P.P., H.B., E.R.; Methodology: E.M.P.A., L.B., E.R.; Validation: E.M.P.A., E.P., A.S., L.B., P.P., H.B., E.R.; Visualization: E.M.P.A., E.P., A.S., L.B., H.B., E.R.; Writing - original draft: E.M.P.A., A.S., L.B., H.B., E.R.; Supervision: E.P., E.R.; Writing - review & editing: E.R.






 Open access

