INTRODUCTION
Growth rates among sea urchin species vary and are often linked to differences in life history strategies (Ebert, Reference Ebert1975; Lawrence & Bazhin, Reference Lawrence and Bazhin1998). Ruderal species (r strategists) will invest energy in somatic growth and in achieving reproductive viability at a relatively young age (Lawrence & Bazhin, Reference Lawrence and Bazhin1998). Alternatively, longer-lived species (k strategists) that grow more slowly and may be more stress tolerant (Ebert, Reference Ebert1975; Lawrence & Bazhin, Reference Lawrence and Bazhin1998) invest more energy in maintenance and reach sexual maturity at an older age.
Sea urchin species, like other organisms, also exhibit intrinsic variations in growth rates among individuals within a single species. Pawson & Miller (Reference Pawson, Miller and Lawrence1982) reported considerable variation in growth rates among Lytechinus variegatus (Lamarck) spawned from wild-caught parental populations from two sites (Florida and Bermuda). Extrinsic factors affecting growth include availability and nutrient content, bioavailability of nutrients (Lawrence & Lane, Reference Lawrence, Lane, Jangoux and Lawrence1982), habitat (Ebert, Reference Ebert1968; Agatsuma, Reference Agatsuma and Lawrence2007; Andrew & Byrne, Reference Andrew, Byrne and Lawrence2007), population density (Siikavuopio et al., Reference Siikavuopio, Dale and Mortensen2007; Richardson et al., Reference Richardson, Lawrence and Watts2011), competition (Grosjean et al., Reference Grosjean, Spirlet and Jangoux1996), osmotic condition (Giese & Farmanfarmaian, Reference Giese and Farmanfarmaian1963), and temperature (Moore et al., Reference Moore, Jutare, Bauer and Jones1963; Agatsuma, Reference Agatsuma and Lawrence2007). Intraspecific variability in sea urchin growth rates may also be related to genetic variation, genomic expression, or epigenetic influences, some of which have been described in sea urchins (Liu et al., Reference Liu, Chang, Xiang, Song and Cao2003, Reference Liu, Chang, Xiang and Cao2005; Zhang et al., Reference Zhang, Zhao, Chen, Chang, Song and Luo2012).
It is difficult to study growth rates of urchins in wild populations. Investigators cannot determine if wild-caught individuals are comparable, since age, nutritional condition, genetic variability and environmental history cannot be easily established. Vadas et al. (Reference Vadas, Smith, Beal and Dowling2002) reports a bimodal growth pattern among wild caught Strongylocentrotus droebachiensis (Müller), suggesting that individuals can be classified as either fast growing or slow growing. However, the basis (growth rings) of this difference in growth morphologies (fast versus slow) may have an alternative explanation not related to growth strategies (Russell & Meredith, Reference Russell and Meredith2000). Grosjean et al. (Reference Grosjean, Spirlet and Jangoux1996) reported variation in growth among juvenile Paracentrotus lividus (Lamarck). However, when juvenile P. lividus were sorted by size, growth rates among slow-growing individuals increased and they attained similar size to fast-growing urchins (Grosjean et al., Reference Grosjean, Spirlet and Jangoux1996). This suggests crowding, competition, and/or increased biomass resulted in compensatory growth among slow-growing individuals. Genetic contribution to growth variation was not evaluated in this study. However, Liu et al. (Reference Liu, Chang, Xiang, Song and Cao2003, Reference Liu, Chang, Xiang and Cao2005) and Zang et al. (2012) suggested a genetic basis for growth among juvenile Strongylocentrotus intermedius (A. Agassiz). Zang et al. (2012) observed a significant environmental influence as well.
Considerable growth variation is observed among other phyla. Contrasting growth rates among altricial and precocial bird species (Gebhardt-Henrich & Richner, Reference Gebhardt-Henrich, Richner, Starck and Ricklefs1998), juvenile poultry (Sewalem et al., Reference Sewalem, Morrice, Law, Windsor, Haley, Ikeobi, Burt and Hocking2002), cattle (Nkrumah et al., Reference Nkrumah, Sherman, Li, Marques, Crews, Bartusiak, Murdoch, Wang, Basarab and Moore2007), and sheep (Baker & Manwell, Reference Baker and Manwell1977) are attributed, in part, to genetic diversity among individuals. Among invertebrates, juvenile barnacles exhibit a great deal of variation in individual growth capacity, but it is unclear if these differences have a genetic basis or are simply a result of environmental influences (Jarrett & Pechenik, Reference Jarrett and Pechenik1997). Variable growth rates among conspecific oysters occur as a direct result of genetic heterozygosity at multiple loci, specifically those that are involved in the regulation of maintenance metabolism (Singh & Zouros, Reference Singh and Zouros1978; Zouros et al., Reference Zouros, Singh and Miles1980; Kohen & Gaffney, Reference Koehn and Gaffney1984).
Feed conversion ratio (or similar efficiency estimates) is an important metric in evaluating the capacity of individuals to convert feed into body mass (assimilation). Variations in feed conversion ratio in cattle (Robinson & Oddy, Reference Robinson and Oddy2004; Schenkel et al., Reference Schenkel, Miller and Wilton2004; Barendse et al., Reference Barendse, Reverter, Bunch, Harrison, Barris and Thomas2007), poultry (Emmerson, Reference Emmerson1997; Van Kaam et al., Reference Van Kaam, Groenen and Bovenhuis1999) and rabbits (Piles et al., Reference Piles, Gomez, Rafel, Ramon and Blasco2004) are linked to genetic variation among conspecific individuals. Typically, individuals exhibiting a lower feed conversion ratio grow faster (per unit feed consumed) than those with high feed conversion ratio. These data suggest that, in the absence of nutritional differences, feed conversion ratio variability among sea urchins could follow a genetic pattern of inheritance. However, no studies linking feed conversion ratio and genetic inheritance in sea urchins have been reported.
To effectively study growth rates among sea urchins, fertilization dates and life histories should be known. Spawning and rearing urchins in a laboratory allows control of the environment, thus minimizing variation in extrinsic factors that may differentially influence growth of individuals. Gibbs (Reference Gibbs2011) and Jones (Reference Jones2011) evaluated the effects of dietary nutrients (lipids and vitamin C, respectively) on growth demographics in juvenile L. variegatus. These studies were performed concurrently using the same population of juveniles which had known age as well as defined environmental and nutritional histories. In these studies, high variation in growth rates within treatments was observed and could not be explained by diet alone. Consequently, we combined these data to form the basis of the current analyses. We modelled using the age an individual was introduced into the respective study without regard to dietary treatment. Our analysis shows that fast-growing individuals within a population retain high rates of growth even when held at identical conditions and fed the same diets as slow-growing individuals. The differences in growth rates are related to differences in feed conversion ratios and dry matter production efficiencies.
MATERIALS AND METHODS
Collection of adults
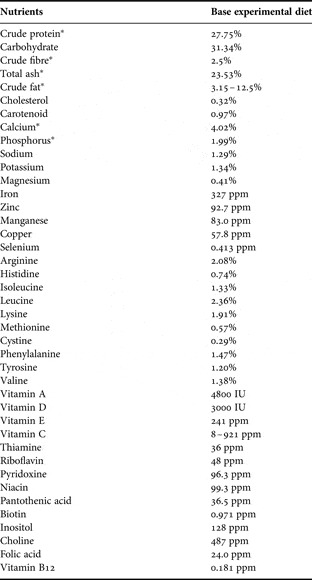
Adult Lytechinus variegatus were collected from Saint Joseph Bay, FL, USA (30°N85.5°W) in February 2009 and transported to the University of Alabama at Birmingham, Birmingham, Alabama, USA. Sea urchins were housed for 12 weeks in a 4000 l recirculating, artificial seawater (Instant Ocean, Cincinnati, OH, USA, 32 ± 1 ) aquaria system equipped with a Polygeyser DF-3 biological filter (Aquaculture Systems Technologies, L.L.C., New Orleans, LA, USA), followed in series with a SMART high-output 80 W UV sterilizer (Emperor Aquatics Inc., Pottstown, PA, USA) and a TF500 double-venturi protein skimmer (Top Fathom, Hudsonville, MI, USA) used for foam fractionation. The system comprised 36 interconnected 80 l glass aquaria. Water was pumped to each aquarium at an exchange rate of ~1800% day−1 and returned to the filter by a central rear standpipe. Total ammonia nitrogen, nitrite, nitrate, and alkalinity levels were checked weekly using saltwater test kits from Aqua Pharmaceuticals, LLC (Malvern, PA, USA) for ammonia and nitrogen and La Motte Company (Chestertown, MD, USA) for alkalinity. A YSI pH10 Pen (YSI Incorporated, Yellow Springs, OH, USA) was used to measure the pH level weekly. Photo-period and temperature were both held constant (12:12 light:dark, 23–25°C). Sea urchins (N = 30) were fed a formulated diet ad libitum (Table 1).
Calculated nutrient levels on an ‘as fed’ basis for the base experimental diet.

*,empirically derived levels by Eurofins Scientific, Inc., Des Moines, IA, USA. All diets contain approximately 4% animal ingredients, 28% marine ingredients, 29.1% plant ingredients, 0.5% crude fat, 1.7% carotenoids, 0.7% vitamin premix, 21.76% mineral premix, and 4.2% binder + antioxidant. All values were based on dry weights. Crude fat was adjusted by supplementation with menhaden or soy oil (described in Gibbs, Reference Gibbs2011). Vitamin C was adjusted by supplementation with Stay-C (ascorbyl polyphosphate: Jones, Reference Jones2011).
Spawning
After 12 weeks, six sea urchins were randomly selected and induced to spawn by injecting (27 G 1/2 needle with 1 cc syringe) 1 ml of 0.1 M acetylcholine solution in autoclaved artificial seawater (Instant Ocean Sea Salt, 32 ± 1) through the peristomial membrane into the coelomic cavity (modified from Hinegardner, Reference Hinegardner1969). Eggs were collected separately from three females, combined into a 250 ml plastic beaker and washed with artificial seawater to remove debris. Sperm was collected dry from three males into separate 1.5 ml micro centrifuge tubes and placed on ice. Approximately 50 µl of concentrated sperm from each individual were mixed and diluted in 250 ml of artificial seawater. The egg mixture was divided evenly between eight glass finger bowls (22 cm ID) containing approximately 1 l of artificial seawater each. 6 ml of diluted sperm mixture were added to each finger bowl and stirred gently to promote fertilization. When embryos reached the four-cell stage, they were transferred to one of eight static larval-rearing jars containing 4 l of conditioned (previously exposed to adult L. variegatus) artificial seawater and 2 l of unconditioned (freshly made) artificial seawater. Developing larvae were maintained at a concentration of two to three larvae ml−1. Larvae were fed twice daily (in the morning and in the afternoon) a unicellular algal diet at a rate of ~3000 cells ml−1 of a combined mixture of Isochrysis galbana (Parke), Rhodomonas salina (Wislouch) and Dunaliella tertiolecta (Butcher). Larval jars were cleaned once daily, and water was exchanged at a rate of ~10% volume per day. Photo-period was maintained on a 12:12 light:dark cycle, and temperature was held at 22°C. Sea urchins began to settle and metamorphose 15 days after spawning. As they metamorphosed, juvenile urchins were collected once daily over a three day period and transferred to a 160 l glass aquarium containing cultures of the benthic diatom Amphora helenensis (Giffen), which supports growth and development in newly-metamorphosed L. variegatus (Powell et al., Reference Powell, Watts and Lawrence2008). As urchins reached 1 to 1.5 mm in diameter (approximately three months), they were transferred to one of eight 4 l aquaria and fed a mixed-taxa algal biofilm (MTAB), which supports growth and survival of juvenile (≥1.5 mm diameter) L. variegatus (Taylor, Reference Taylor2006). Once juveniles reached 5 mm in diameter they were stocked into growth trials.
Growth trials
INITIAL MEASUREMENTS AND CULTURE SYSTEM
When individual juveniles reached the appropriate entry size (~5 mm diameter, 0.07–0.10 g wet weight) they were randomly assigned to one of twenty-three dietary treatments (Gibbs, Reference Gibbs2011; Jones, Reference Jones2011). Growth rates were highly variable among newly-metamorphosed individual urchins despite all being cultured in identical environmental conditions, and the time elapsed from the first individual of appropriate size (0.07–0.10 g wet weight, ~5 mm) entering the growth trials to the last individual of appropriate size entering the growth trials was 121 days. Therefore, individuals entering the study early had a faster rate of growth as compared to those that entered the study at a later time, which had a slower rate of growth.
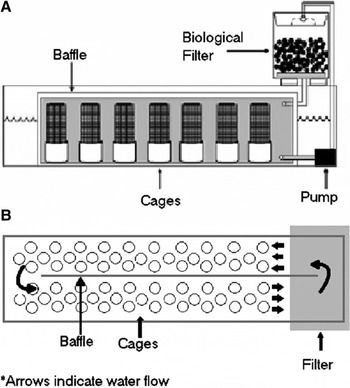
Juveniles entering the study were placed individually into plastic, cylindrical cages (~8.5 cm diameter, 25 cm high, with 3 mm open mesh on sides, a 3 mm open mesh bottom secured by plastic cable-ties, and a 2 mm open mesh circle over-laid on bottom). The mesh enclosures were fitted into 8.7 cm ID PVC couplings. The floor of the mesh enclosure was ~5.5 cm from the bottom of the raceway. Each coupling was fitted on the bottom with three small Tygon® spacers (~0.5 cm thick) to allow water circulation underneath. Cages were coded so that each individual could be tracked over the course of the study. In these cages, feed pellets were retained, but faeces fell through the mesh. Sixty cages were randomly placed in each of three raceways (235 cm × 53 cm × 31 cm, length × width × height, Figure 1, as described by Taylor, Reference Taylor2006). A 160 × 23 cm (length × height) centre baffle in the centre of each raceway allowed for recirculating water flow by an in-line utility pump (Supreme® Mag Drive Utility Pump, Danner Mfg, Inc., Islandia, NY, USA, 700 gallons of water/hour) (Figure 1; Taylor, Reference Taylor2006). The utility pump removed saltwater from the raceway on one side of the baffle. Water was then passed through a mechanical and biological filter and returned to the raceway on the opposite side of the baffle. The flow rate of the resulting current was approximately 9.7–12.6 cm s−1. Water depth was maintained at 15 cm. Each week, cages were rotated within and among raceways to prevent bias due to cage position. Every two weeks, cages were cleaned to remove potential bacterial growth.
Schematic of recirculating system: (A) side view of the three fibreglass raceways (235 cm × 53 cm × 31 cm, length × width × height) with a 160 × 23 cm (length × height) centre baffle and 60 individual flow-through cages; (B) top view of the fibreglass raceway (schematic is not drawn to scale. Arrows indicate water flow).

Juveniles were fed once daily at a limited ration for five weeks (from the time of initial stocking). If uneaten feed remained at 24 hours, the quantity remaining was visually estimated and removed from the cage by siphon (over 90% consumed all feed daily). Faeces were removed by siphon each week, and raceway water was exchanged with fresh artificial seawater at a rate of 10% volume/week−1. Culture conditions were maintained daily as previously described for adults.
DIET PREPARATION AND FEEDING
Twenty-three semi-purified diets with varying lipid levels (Gibbs, Reference Gibbs2011) or varying vitamin C levels (Jones, Reference Jones2011) were prepared (Table 1). The direct effects of these specific nutrients are not addressed in this study and are presented in the aforementioned citations. Sea urchins were fed daily a sub-satiation ration based on body weight (2.5–5% total average body weight), found previously to support weight gain (Heflin et al., Reference Heflin, Gibbs, Powell, Makowsky, Lawrence, Lawrence and Watts2012a). Sub-satiation feeding allows a direct measurement of feed intake (Heflin et al., Reference Heflin, Gibbs, Powell, Makowsky, Lawrence, Lawrence and Watts2012a). Feed rations were adjusted biweekly to maintain ration as a proportion of body size. Despite increasing the daily ration, sub-satiation was maintained for a majority of individuals (occasionally an individual did not consume the ration in its entirety, but this occurred less than 10% of the time). Total dry feed intake (mg individual−1, as fed) over the five-week study period was calculated by:
(1) total feed proffered (mg dry weight) – total feed uneaten (mg dry weight)
GROWTH AND PRODUCTION
The wet weight of each individual was recorded at initial stocking and at two, four and five weeks from the time of entry into the growth trials. Individuals were blotted on paper towels for 10 to 20 seconds to remove excess water and were weighed on a Mettler-Toledo PG503-S balance (Mettler-Toledo International, Inc., Columbus, OH, USA) to the nearest mg. Wet weight gain over the five-week study period was calculated by:
(2) final wet weight (g) – initial wet weight (g)
Feed conversion ratio (FCR) was calculated by:
(3) total feed intake (mg, as fed)/wet weight gain (mg)
At the end of five weeks, individuals were weighed as described previously and were then dissected. A circular incision around the peristomial membrane allowed the oral surface (including Aristotle's lantern) of the sea urchin to be separated from the body. The oesophagus was cut at the Aristotle's lantern, and the lantern was separated from the oral surface of the test. The coelomic cavity was checked for the presence of measurable gonad tissue, but no notable gonad tissue was observed for these individuals. The complete test with spines, Aristotle's lantern, and gut were rinsed in de-ionized water to remove excess surface salt, and each transferred to pre-weighed aluminium weigh pans. Organs were dried to constant dry weight (~72 hours) in a forced air oven at 50°C.
Throughout the study, appropriately-sized (~5 mm diameter, 0.07–0.10 g wet weight) juveniles were randomly selected and dissected for initial population demographics. Wet weights were recorded as described previously. Individuals were then dipped briefly in de-ionized water to remove excess salt, placed in pre-weighed aluminium weigh pans, and dried in a forced air oven at 50°C to constant dry weight (72 hours). The average total dry weight of the initial sample population was used for later calculations of dry matter production. Estimated total dry matter production was calculated by:
(4) final dry weight (mg) – average initial dissection dry weight (mg)
Production efficiency (PE) was calculated as:
(5) [estimated total dry matter production (mg)/dry feed intake (mg)] × 100%
Lantern/test index was calculated as:
(6) final dry weight of lantern (mg)/final dry weight of test (mg)
Statistics
Growth rate data from both studies were combined and statistical analyses of growth parameters were performed in R 2.11.1 (www.r-project.org) using the general linear models and correlation functions. P values ≤ 0.05 were considered significant. Outcomes examined were feed intake, wet weight gain, (FCR), dry matter production, production efficiency, and lantern/test index. Each outcome was compared to the age of individuals when they entered the feeding studies. The assumptions for all models were checked by examining the residuals for normality and homoscedasticity.
RESULTS
Growth demographics
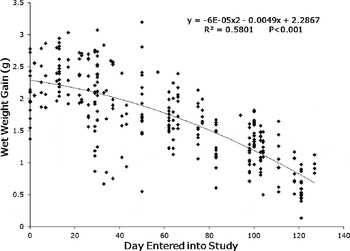
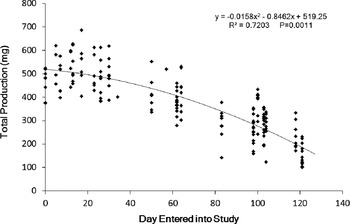
After five weeks, total wet weight gain ranged from 0.13 to 3.19 g among individuals, representing a 3- to 47-fold increase in wet weight. Wet weight gain was negatively correlated with the time an individual entered into the study (P < 0.0001, R2 = 0.5801, Figure 2). Dry matter production ranged from 101.83 to 687 mg after five weeks and was inversely correlated with the time an individual was entered into the study (P = 0.0011, R2 = 0.7203, Figure 3).
Relationship between total wet weight gain (g) and day entered into the study of individual Lytechinus variegatus.

Relationship between total production (mg) and day entered into the study of individual Lytechinus variegatus.

Growth efficiencies
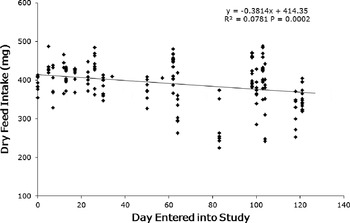
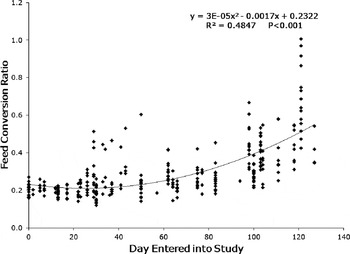
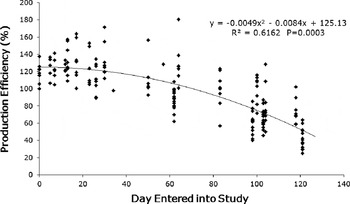
Feed intake was slightly (but significantly) less in individuals who entered the study at a later time (P = 0.0002, R2 = 0.0781, Figure 4), although all individuals were proffered equivalent rations. FCR ranged from 0.12 to 1.01 and was positively correlated with the time an individual entered into the study (P < 0.0001, R2 = 0.4847, Figure 5). Comparatively, PE was indirectly correlated with the time an individual entered into the study (P = 0.0003, R2 = 0.6162, Figure 6). PE values ranged from 25.17 to 180.52%, with those entering the study earlier having higher values compared to those entering the study later.
Relationship between dry feed intake (mg) and day entered into the study of individual Lytechinus variegatus.

Relationship between feed conversion ratio and day entered into the study of individual Lytechinus variegatus.

Relationship between production efficiency (%) and day entered into the study of individual Lytechinus variegatus.

Organ allometry
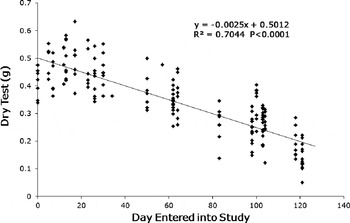
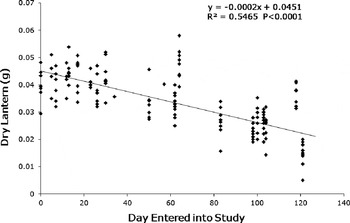
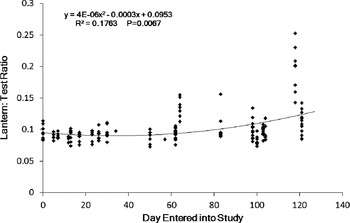
Dry test weight decreased with time entered into the study (P < 0.0001, R2 = 0.7044, Figure 7). The weight of the Aristotle's lantern also decreased with time entered into the study (P < 0.0001, R2 = 0.5465, Figure 8). However, weight of the Aristotle's lantern relative to the test with spines (lantern: test index) increased with time entered into the study (P = 0.0067, R2 = 0.1763, Figure 9). Lantern:test indices ranged between ~7 and 25%, with individuals who entered the study early having a relatively smaller lantern:test index compared to those entering the study later.
Relationship between dry test weight (g) and day entered into the study of individual Lytechinus variegatus.

Relationship between dry lantern weight (g) and day entered into the study of individual Lytechinus variegatus.

Relationship between lantern:test ratio and day entered into the study of individual Lytechinus variegatus.

DISCUSSION
Water quality
Water quality parameters maintained in this study were within the ranges acceptable for sea urchins (Basuyaux & Mathieu, Reference Basuyaux and Mathieu1999). This is supported by the observed high (100%) survivorship and weight gain in all urchins in the study.
Growth demographics
Variation in growth rate among conspecifics with similar life histories has been reported in vertebrates and invertebrates, including sheep (Baker & Manwell, Reference Baker and Manwell1977), cattle (Robinson & Oddy, Reference Robinson and Oddy2004; Schenkel et al., Reference Schenkel, Miller and Wilton2004; Barendse et al., Reference Barendse, Reverter, Bunch, Harrison, Barris and Thomas2007), poultry (Emmerson, Reference Emmerson1997; Van Kaam et al., Reference Van Kaam, Groenen and Bovenhuis1999), rabbits (Piles et al., Reference Piles, Gomez, Rafel, Ramon and Blasco2004), birds (reviewed by Gebhardt-Henrich & Richner, Reference Gebhardt-Henrich, Richner, Starck and Ricklefs1998), barnacles (Jarrett & Pechenik, Reference Jarrett and Pechenik1997), and oysters (Singh & Zouros, Reference Singh and Zouros1978; Zouros et al., Reference Zouros, Singh and Miles1980; Fujio, Reference Fujio1982; Koehn & Gaffney, Reference Koehn and Gaffney1984). Among sea urchin species, Pawson & Miller (Reference Pawson, Miller and Lawrence1982) and Grosjean et al. (Reference Grosjean, Spirlet and Jangoux1996) compared variations in growth rates in laboratory-reared Paracentrotus lividus and Lytechinus variegatus, respectively. Experimental populations of sea urchins in these studies had a defined fertilization date and were held under identical physical and nutritional conditions respective to each study. Both studies reported variations in diameters, indicating intrinsic variability in growth rates. However, Grosjean et al. (Reference Grosjean, Spirlet and Jangoux1996) reported that, when separated based on size, smaller urchins (slow growers) exhibited compensatory growth and attained similar size to larger urchins (fast growers) by 30 months of age, suggesting that removal of the larger individuals promoted higher growth rates in smaller individuals. Alternatively, it is possible that P. lividus exhibits determinate growth, and that intrinsic variation in growth rate persisted until maximal (asymptotic) size was attained by 30 months. In both studies, urchins were held in mass cultures, so competitive interactions among individuals cannot be eliminated as causative factors affecting growth rates (also suggested by Grosjean et al., Reference Grosjean, Spirlet and Jangoux1996). Compensatory growth was not observed in L. variegatus in the five-week study period and a competition effect (post-stocking) on growth was not possible in the present study since urchins were held individually throughout the study period.
Similar to Pawson & Miller (Reference Pawson, Miller and Lawrence1982) and Grosjean et al. (Reference Grosjean, Spirlet and Jangoux1996), sea urchin eggs in the present study were fertilized in the laboratory (obtained from different wild-caught parents and, thus, with presumably different genotypes) and cultured under identical conditions throughout larval and juvenile stages. Despite these conditions, varying growth rates observed during early post-metamorphic growth persisted among individuals throughout the growth trial. Individuals who entered into the study early (younger age) had a faster initial growth rate than those who entered the study at a later time (same size at entry, but at an older age). Moreover, urchins that were stocked early continued to grow faster than urchins that were stocked at a later time, regardless of diet. Similar differences in growth rates found in other organisms are usually attributed to differences in genetic heterozygosity at specific loci (Baker & Manwell, Reference Baker and Manwell1977; Singh & Zouros, Reference Singh and Zouros1978; Zouros et al., Reference Zouros, Singh and Miles1980; Fujio, Reference Fujio1982; Koehn & Gaffney, Reference Koehn and Gaffney1984; Jarrett & Pechenik, Reference Jarrett and Pechenik1997; reviewed by Gebhardt-Henrich & Richner, Reference Gebhardt-Henrich, Richner, Starck and Ricklefs1998), often those loci suggested to be linked to metabolic rate or energy allocation (Baker & Manwell, Reference Baker and Manwell1977; Fujio, Reference Fujio1982; Koehn & Gaffney, Reference Koehn and Gaffney1984). Genetic analysis was not performed on urchins used in this study or in the Pawson & Miller (Reference Pawson, Miller and Lawrence1982), Grosjean et al. (Reference Grosjean, Spirlet and Jangoux1996) or Vadas et al. (Reference Vadas, Smith, Beal and Dowling2002) studies. However, recent studies indicate that differences in intrinsic growth rates in this study may be attributed to genetic variability (Liu et al., Reference Liu, Chang, Xiang, Song and Cao2003, Reference Liu, Chang, Xiang and Cao2005; Zhang et al., Reference Zhang, Zhao, Chen, Chang, Song and Luo2012).
Although feed intake of urchins that were stocked later (slower-growing) was slightly less than that of urchins that were stocked early (faster-growing), small variations in feed intake could not explain large differences in wet weight gain or dry matter production among urchins in this study. However, differences in both food conversion ratio (FCR) and dry matter production efficiency (PE) were strongly correlated to growth rates. Urchins that were stocked early (faster-growing) had much lower FCR values than those that were stocked later (slower-growing). Similarly, PE values were higher in those with high growth rates. These data indicate that individuals that grew faster were much more efficient at converting ingested food to body mass than slower-growing urchins (despite similar feed and/or energy intake), suggesting differential allocation of energy in growth versus maintenance. Since the environment was controlled, we hypothesize that the differences observed in efficiencies represent variation in those genes affecting growth and/or metabolism. We do not know if these differences represent variability among individuals or variability among sibling populations. An alternative explanation would suggest that culture pressures observed in early post-metamorphic culture (canalization resulting from intraspecific interactions) led to epigenetic alterations of growth potential, with no compensatory growth once the pressure (mass culture) was removed.
Heflin & Watts (Reference Heflin and Watts2012) reported that populations of juvenile L. variegatus held at high densities exhibited compensatory growth when transferred to lower densities, indicating compensatory growth was dependent on removal of a selective pressure (in this case, high density). In the case of Grosjean et al. (Reference Grosjean, Spirlet and Jangoux1996) the pressure on P. lividus was not density, but may have been biomass (larger urchins provide a higher biomass per unit area). However, the present study indicates no compensation for slow growing L. variegatus when held as individuals. Although we did not rigorously quantify post-metamorphic density, we estimate that it was low and did not exceed ~500 juveniles/m2 (these individuals were less than 5 mm in test diameter and the ratio of open space to urchin was approximately 300 to 1). Consequently, we hypothesize that genetic variation in growth rates is persistent throughout the lifespan of a population of L. variegatus; however, reduced or compensatory growth can occur within these phenotypes (both slow and fast growers) when selective pressures are applied or removed, (Richardson, Reference Richardson2010; Heflin & Watts, Reference Heflin and Watts2012).
Ebert (Reference Ebert1975) and Lawrence & Bazhin (Reference Lawrence and Bazhin1998) linked variations in growth rates among sea urchins species to differences in life history strategies as related to survival. Based on the present study, we suggest that survival strategies can also vary within a species. In the wild, sea urchins are often found in barrens where food availability is limited. We suggest that polygenic differences in conspecific growth rate may have evolved in response to selective pressures related to quantity and quality of food. We hypothesize that genetic variation among conspecific urchins may induce some individuals within the population to grow faster and reach sexual maturity at a younger age when food is plentiful. Other conspecifics may grow more slowly and, thus, be better adapted to low food conditions. Such a variation in growth patterns, induced by genetic morphotypes, may increase fitness of the individual as it adapts to a changing environment. We further hypothesize that genetic variation (or genomic expression) is related to those processes involved in nutrient processing and allocation.
Fast growing urchins in this study had PE values higher than 100%. Much of the dry matter of these juvenile urchins is calcite (incorporated within the test, spines, and lantern), indicating that individuals absorbed significant amounts of minerals such as calcium and magnesium from the seawater. To our knowledge, this level of PE has not been reported in other sea urchin species.
Organ allometry
When sea urchins are held under food limiting conditions, the Aristotle's lantern has been reported to be larger relative to the test than when food is plentiful (Ebert, Reference Ebert1968, Reference Ebert1980; Black et al., Reference Black, Codd, Hebbert, Vink and Burt1984; Levitan, Reference Levitan1991; Fernandez & Boudouresque, Reference Fernandez and Boudouresque1997; McShane & Anderson, Reference McShane and Anderson1997; Hagen, Reference Hagen2008; Lau et al., Reference Lau, Lau, Qian and Qiu2009). Lantern:test index may also vary with specific nutrient levels and availability (Jones et al., Reference Jones, Powell, Gibbs, Hammer, Lawrence, Fox, Lawrence and Watts2010; Heflin et al., Reference Heflin, Gibbs, Powell, Makowsky, Lawrence, Lawrence and Watts2012b) or with increased feed hardness (Hagen, Reference Hagen2008). There are multiple hypotheses as to the selective advantage(s) of a comparatively large lantern in an individual, including altered resource allocation and increased capacity for durophagy (Ebert, Reference Ebert1968; Black et al., Reference Black, Codd, Hebbert, Vink and Burt1984; Levitan, Reference Levitan1991), and it has been suggested that this is a plastic response that increases the fitness of an individual (Ebert, Reference Ebert1980, Reference Ebert1996; Black et al., Reference Black, Codd, Hebbert, Vink and Burt1984; Minor & Scheibling Reference Minor and Scheibling1997; Lau et al., Reference Lau, Lau, Qian and Qiu2009). However, it is unlikely that differences in lantern:test indices of urchins in the current study were in any way related to increased fitness of the individual or to food quality and availability. Food proffered to individuals did not vary in quantity, shape, distribution, size, or hardness, and differences in lantern:test index could not be attributed to differences in nutritional content among the dietary treatments (Gibbs, Reference Gibbs2011; Jones, Reference Jones2011). We suggest that the differences among lantern indices between fast and slow growers are attributed to intrinsic differential resource allocation to the test and lantern, although a genetic component could not be excluded. Those with a higher PE (lower FCR) allocated relatively more nutrients to the test, whereas those with a lower PE (higher FCR) allocated relatively more to the lantern.
Variations in growth rate among sea urchins will have implications in our understanding of basic organismal ecology and in applied aquaculture. Currently, most sea urchin studies conducted in laboratory conditions involve an initial collection of urchins from the wild. Individuals within a size-class are generally assumed to have a similar growth rate and age. The results of this study suggest that these may be incorrect assumptions: growth rates may vary greatly among similarly-aged individuals, regardless of extrinsic conditions. We found that for many growth outcomes, the intrinsic growth rates account for over 60% of the variability seen, despite the fact that the animals were part of experiments where variable diets increased the overall variability (Gibbs, Reference Gibbs2011; Jones, Reference Jones2011). Consequently, knowledge about growth rate variation may allow sea urchin culturists to select for fast-growing, efficient individuals, thus, decreasing time to market size and potentially increasing yield and profitability. Finally, it is now possible to use laboratory-reared populations of juvenile urchins to evaluate differences in fitness and stress tolerance in relation to growth strategy.
ACKNOWLEDGEMENTS
The authors thank Jeff Barry, Mickie Powell, Lacey Dennis, Matthew Snead and Kate Kohlenberg for providing technical support for this study. We also thank Dr John Lawrence and Dr Michael Russell for comments on the manuscript. This report was approved by S.A.W. under award NA07OAR4170449 from the University of Alabama at Birmingham, US Department of Commerce. R. Makowsky was funded through the post-doctoral training grant T32 HL072757. The statements, findings, conclusions, and recommendations are those of the authors' and do not necessarily reflect the views of NOAA or the US Department of Commerce.