I. INTRODUCTION
Conventional dealloying is applied to crystalline foils of Au–AgReference Ding, Kim and Erlebacher1 or Au–CuReference Morrish, Dorame and Muscat2 alloys to form porous, coarse-grained gold. A network of interconnected ligaments and pores results from percolation of an electrolyte which removes less noble elements while the Au atoms rearrange by surface diffusion.Reference Erlebacher, Aziz, Karma, Dimitrov and Sieradzki3,Reference McCue, Benn, Gaskey and Erlebacher4 By contrast, dealloying of Au-based metallic glasses, produced in the form of ribbons by rapid solidification, generates ligaments made of numerous nanocrystals germinated from the amorphous phase.Reference Scaglione, Celegato, Rizzi and Battezzati5,Reference Paschalidou, Celegato, Scaglione, Rizzi, Battezzati, Gebert, Oswald, Wolff, Mihaylov and Spassov6 Ligaments are more defective and their surface is rougher than that of dealloyed crystalline alloys, which is attractive for electrocatalytic and spectroscopic applications.Reference Xue, Scaglione, Rizzi and Battezzati7,Reference Qiu, Wang, Liu, Wang and Chen8 However, a long dealloying time, required especially to dealloy tens of microns thick ribbons, may cause coarsening of ligaments and grains due to surface diffusion,Reference Erlebacher9 reducing the specific surface area of the nanoporous gold (NPG). Optimizing the morphology of dealloyed products requires either the tuning of the dealloying conditions such as acid concentration, temperature, and dealloying time or the modification of the precursor composition.Reference Morrish, Dorame and Muscat2,Reference Xue, Scaglione, Rizzi and Battezzati7,Reference Gupta, Thorp, Mara, Dattelbaum, Misra and Picraux10–Reference Li, Qiu, Wang and Wang12 In metallic glasses, however, the choice of the composition is restricted to the range where the alloy presents a good glass forming ability,Reference Ding, Liu, Li, Liu, Sohn, Walker and Schroers13 requiring the use of a different strategy to optimize the dealloying product. Nanoglass is a new class of material formed of amorphous regions separated by amorphous interfaces of lower density.Reference Gleiter14,Reference Gleiter15 In nanoglasses, the size of the amorphous clusters and the density of the interfaces can be tailored to modify the material properties. To date, nanoglasses have been produced by different techniques such as inert gas condensationReference Fang, Vainio, Puff, Würschum, Wang, Wang, Ghafari, Jiang, Sun, Hahn and Gleiter16 and magnetron sputteringReference Wang, Chen, Liu, Wang, Louzguine-Luzgin, Chen and Perepezko17 achieving attractive magnetic,Reference Witte, Feng, Fang, Fischer, Ghafari, Kruk, Brand, Wang, Hahn and Gleiter18 mechanical,Reference Wang, Jiang, Hahn, Li, Gleiter, Sun and Fang19 and catalytic properties.Reference Chen, Frank, Asao, Louzguine-Luzgin, Sharma, Wang, Xie, Ishikawa, Hatakeyama, Lin, Esashi, Yamamoto and Inoue20 We investigated whether we can tailor the nanoglass microstructure to decrease the dealloying time and limit the coarsening of the grains and ligaments in our material.
Here, we present the synthesis of Au-based nanoglasses as thin films deposited by magnetron sputtering with controlled nanograined or nanocolumnar microstructure and investigate their dealloying and coarsening behaviour. The dealloying of the films is compared to that of homogeneous glassy thin films and ribbons. It is highlighted that the nanoglass thin films can be properly dealloyed and have a high dealloying rate with respect to homogeneous metallic glasses of the same composition. Additionally, the ligaments are shown to be constituted of crystalline domains of only a few nanometers in size. The dealloyed thin films are shown to be active to the methanol electrooxidation and can be used as a catalyzer for this reaction.
II. MATERIALS AND METHODS
Metallic glass thin films were deposited from a 5 cm diameter crystalline target with nominal composition Au40Cu28Pd5Ag7Si20 (at.%). This composition was selected for its high glass-forming ability, among the highest for the Au-based alloys.Reference Guo, Zhang, Qin, Qiang, Chen and Inoue21 The master alloy was induction melted and the target was cast in a graphite mold at PX Services, La Chaux-de-Fonds (CH), Switzerland. Thin films were deposited by DC magnetron sputtering with a working distance of 4.5 cm and a discharge power of 30 W. Before deposition, a background pressure below 10−4 Pa was reached in the sputtering chamber. The substrates were cover glasses of dimension 24 × 24 mm. An intermediate adhesive layer of Cr, around 5 nm thick, was deposited on the substrate. An Au layer, around 50 nm thick, was then deposited on top of the Cr layer to prevent the corrosion of Cr during dealloying. Finally, the metallic glass was deposited on top of the Au layer. The films were deposited for 5 min at 0.4 Pa (sample A), 4 Pa (sample B), and 10 Pa (sample C) of Ar working pressure, respectively, to reach a thickness of around 350 nm. The metallic glass thin films have the same composition as the target, as confirmed by energy dispersive X-ray spectroscopy (EDX) measurements performed on the as-deposited thin films. To know the composition on the top surface of the as-sputtered thin films, XPS measurements were performed using Mg Kα (1253.6 eV) radiation (PHI 5800 MultiTechnique ESCA System, Physical Electronics, Eden Prairie, Minnesota), with a detection angle of 45°, using pass energies at the analyzer of 29.35 and 93.9 eV for detail and survey scans, respectively. The thin films were dealloyed by free corrosion in a HNO3 electrolyte solution, with a concentration of 2 M at 70 °C, during different times.
The structure of the material before and after dealloying was characterized by glancing angle X-ray diffraction (GAXRD, Philips PW3830, Philips, Amsterdam, the Netherlands), measured with a glancing angle of 0.8° under Cu Kα radiation at 40 kV. The microstructure of the thin films, before and after dealloying, was observed on the top and cross-sectional (after cleaving) views by scanning electron microscopy (SEM). Moreover, for the purpose of transmission electron microscopy (TEM) only, nanocolumnar thin films were deposited on a glass substrate without Au and Cr intermediate layers at a working pressure of 10 Pa, and then were dealloyed for 10 min and 1 h in a 2 M HNO3 solution at 70 °C. These samples were easily removed from the glass substrate during dealloying and used for TEM observation. The samples were placed on a Cu grid without any thinning and examined using a JEOL JEM3010 high-resolution TEM (JEOL, Tokyo, Japan) at 300 kV accelerating voltage employing a LaB6 electron gun source. Oxford EDX equipment (Oxford Instruments, Abingdon, United Kingdom) was used for chemical analyses. The electrochemical behavior of the thin films was studied with electrochemical polarization curves using a typical three-electrode electrochemical cell. The sputtered thin films were used as the working electrode, with Ag/AgCl as the reference electrode and a platinum sheet as the counter electrode. The measurements were performed in 2 M HNO3 solution at 70 °C, immediately after immersion of the films in the electrolyte, to compare the corrosion kinetics at the initial stage of dealloying. The potentiodynamic polarization curves were recorded at a linear scan rate of 5 mV/s from −150 to 500 mV versus Ag/AgCl versus the open circuit potential. The electrocatalytic activity of the dealloyed samples for the methanol (MeOH) electrooxidation reaction was tested at room temperature. Before testing, the working electrodes were scanned at a sweeping rate of 20 mV/s in a 0.5 M KOH solution from −0.1 to 0.5 V versus Ag/AgCl and the active electrochemical surface area was calculated for every working electrode from the area of the reduction peak of the Au oxide species.Reference Xiao, Xiao, Hu, Yuan, Wang, Qian and Liu22 Cyclic voltammetry (CV) was performed for 300 cycles in the same potential range for all the samples in a solution of 0.5 M KOH and 5 M CH3OH at room temperature with the same scan rate of 20 mV/s. All current densities were normalized with respect to the electrochemical active surface area of the electrodes.
III. RESULTS AND DISCUSSION
A. As-sputtered thin films characterization
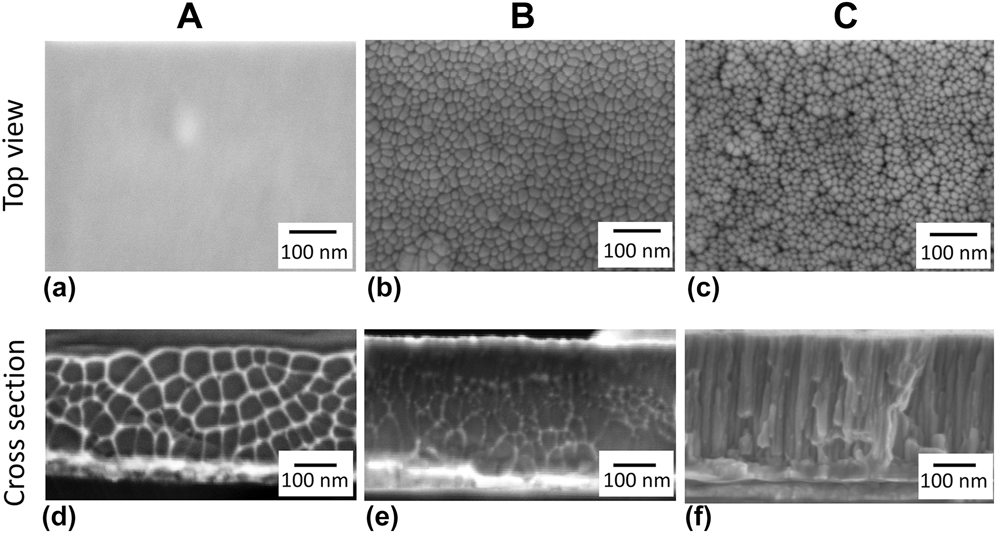
The metallic glass thin films, deposited under different working pressures of Ar in the sputtering chamber, have a composition close to the one of the targets, as confirmed by EDX measurements (Table SI). The microstructure of the thin films was investigated by SEM measurements (Fig. 1). The measurements were repeated at least 5 times at different locations to confirm the good representability of the dealloying products. Top views show that sample A, deposited at 0.4 Pa, has homogeneous microstructure [Fig. 1(a)] and sample B, deposited at 4 Pa, is nanograined with clusters having an average diameter of 18 nm, separated by less dense interfaces [Fig. 1(b)]. Both corresponding cross-sectional views [Figs. 1(d) and 1(e)] display a vein pattern characteristic of the metallic glass fracture surface.Reference Suh, Dale Conner, Paul Kim, Demetriou and Johnson23 The fracture was induced by cleaving the glass substrate of the film. The evidence of the plastic deformation mechanism inherent to metallic glasses is taken as an additional proof of the amorphous structure of the film. Sample C, deposited at 10 Pa, contains grouped clusters with an average diameter of 14 nm, separated by less dense interfaces and voids [Fig. 1(c)]. Its cross section [Fig. 1(f)] reveals that the voids observed on the top view form the boundaries between nanocolumns along which fracture progresses. The nanograined and nanocolumnar thin films present different variations of the new materials termed nanoglasses.Reference Chen, Frank, Asao, Louzguine-Luzgin, Sharma, Wang, Xie, Ishikawa, Hatakeyama, Lin, Esashi, Yamamoto and Inoue20,Reference Sniadecki, Wang, Ivanisenko, Chakravadhanula, Kübel, Hahn and Gleiter24 The transition from dense to nanocolumnar thin films with an increase in Ar working pressure is well known for crystalline thin films.Reference Thornton25,Reference Thornton26 The present results suggest that a similar transition occurs in amorphous thin films. The smaller nanocluster size in sample C with respect to sample B originates certainly from a reduction of the surface diffusivity of the deposited atoms with an increase of Ar working pressures.Reference Thornton26,Reference Chan and Teo27 It was indeed reported that the size of the nanoclusters is controlled by a diffusion process.Reference Chen, Frank, Asao, Louzguine-Luzgin, Sharma, Wang, Xie, Ishikawa, Hatakeyama, Lin, Esashi, Yamamoto and Inoue20
SEM top views and cross-sectional views of Au-based metallic glass thin films deposited under different working pressures of Ar. Sample A was deposited under 0.4 Pa, sample B under 4 Pa, and sample C under 10 Pa. Top views of samples (a) A, (b) B, and (c) C. Cross-sectional views of samples (d) A, (e) B, and (f) C.

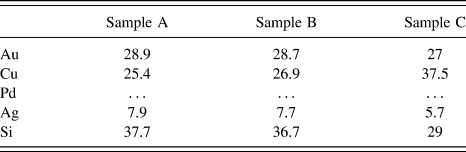
XPS measurements were performed to compare the composition at the surface of the three samples (Table I). Pd could not be detected, due to the fact that its main peaks are weak and overlapped by Au and O peaks with higher intensity.Reference Kaciulis, Mezzi, Fiore, Ichim, Battezzati and Rizzi28 We measured a lower concentration of Au and a higher concentration of Si at the top surface of the samples, in respect of the nominal composition of the alloy. This is in good agreement with previous results obtained for amorphous ribbons of the same composition.Reference Paschalidou, Celegato, Scaglione, Rizzi, Battezzati, Gebert, Oswald, Wolff, Mihaylov and Spassov6 Interestingly, the concentration of Cu at the surface of sample C was higher than that of the other samples. The Cu enrichment on this sample seems to go along with a Si depletion since Si was less abundant on the surface of this sample while the concentration of Au remained approximately the same. The enrichment in Cu2O at the surface of Au-based metallic glasses is actually well referenced as it is responsible for tarnishing the material, which is detrimental to the visual aspect researched by the jewellery industry.Reference Eisenbart, Klotz, Busch and Gallino29 Our measurements indicate that sample C is more prone to tarnish than the other two tested samples.
Concentration in at.% measured by XPS at the surface of the as-sputtered samples A, B, and C. O and C were not considered in the calculation of the concentrations.

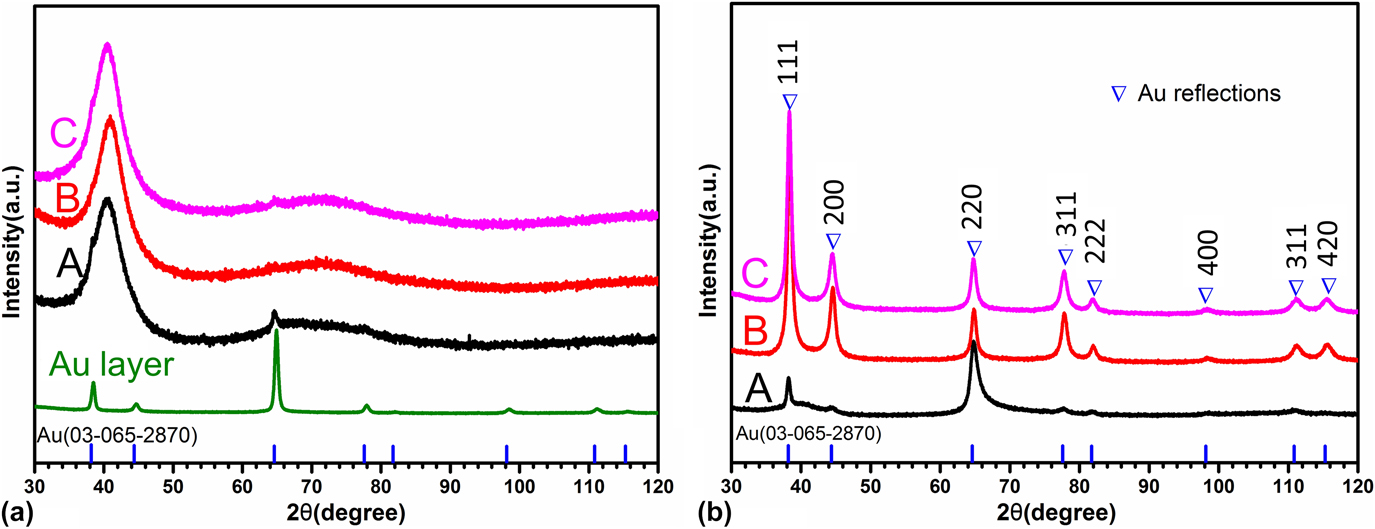
Glancing angle XRD patterns of all films show broad diffraction halos due to the respective amorphous phase [Fig. 2(a)]. However, reflections of low intensity associated with Au in a face-centered cubic lattice can be found overlapped by the amorphous halos. The formation of small crystals is probably favoured by the underneath Au layer. In fact, in both the intermediate Au layer and the Au-based thin films, the (220) diffraction peak has the highest intensity [Fig. 2(a)] while it should be (111) in polycrystalline Au without preferential orientations.
Glancing angle XRD patterns of samples A, B, and C (a) before and (b) after dealloying for 1 h in a 2 M HNO3 solution at 70 °C. In (a), the glancing angle XRD pattern of the Au intermediate layer is also shown. The positions of the Au reflections in a face-centered cubic lattice are also indicated.

B. Progression of dealloying
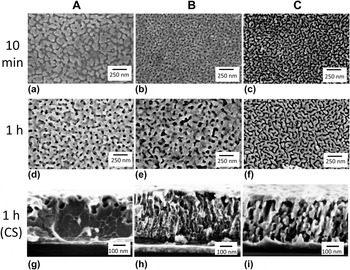
Previous studies with amorphous ribbons indicated that dealloying involves various steps: germination of crystalline islands of nanometer size, formation of mounds and their undercutting, development of a mixed crystal-amorphous region tens of nanometer thick, and formation of ligaments by crystal impingement.Reference Paschalidou, Celegato, Scaglione, Rizzi, Battezzati, Gebert, Oswald, Wolff, Mihaylov and Spassov6 With this guideline, experiments were performed to reveal the mechanism operative in amorphous thin films. Figure 3 shows the top view of films A, B, and C after immersion in 2 M HNO3 solution for 10 min and 1 h at 70 °C. Relatively large pores and islands of around 50 nm in diameter are seen in sample A after 10 min [Fig. 3(a)] while after 1 h, finer continuous ligaments with an average width of 35 nm at their necks are formed [Fig. 3(d)]. The microstructure of sample B is definitely finer after 10 min, with ligaments of around 30 nm in width and pores around 20 nm in diameter [Fig. 3(b)]. After 1 h, the size of both ligaments and pores increased, with ligament necks around 70 nm in width and pore diameter ranging from tens to hundreds of nanometers [Fig. 3(e)]. In sample C, fine crystalline islands of around 20 nm in width started evolving into ligaments after 10 min while the pores formed a continuous network surrounding the crystals [Fig. 3(c)]. After 1 h, the ligaments became continuous by coarsening and reached a width of 30 nm [Fig. 3(f)]. The interconnected pores in between the ligaments had a width of around 25 nm in average.
SEM images (top and cross section views) of samples A, B, and C after dealloying 10 min and 1 h in a 2 M HNO3 solution at 70 °C. Top view after 10 min dealloying of samples (a) A, (b) B, and (c) C. Top view after 1 h dealloying of samples (d) A, (e) B, and (f) C. Cross-sectional view after 1 h dealloying of samples (g) A, (h) B, and (i) C.

Images of the cross sections show large pores with a width of up to 50 nm in the top part of sample A while the internal part fractured as a bulk metallic glass with vein patternsReference Suh, Dale Conner, Paul Kim, Demetriou and Johnson23 proving it was still not dealloyed [Fig. 3(g)]. Broad diffraction halos were found in the XRD pattern confirming this statement [Fig. 2(b)]. Sample B was dealloyed in its whole thickness [Fig. 3(h)]. Sample C was fully dealloyed with ligaments and pores of constant width, elongated in the vertical direction, vestiges of the original columnar microstructure [Fig. 3(i)]. The XRD patterns of dealloyed samples B and C [Fig. 2(b)], containing only reflections associated with Au in a face-centered cubic lattice, confirms the complete dealloying of the films.
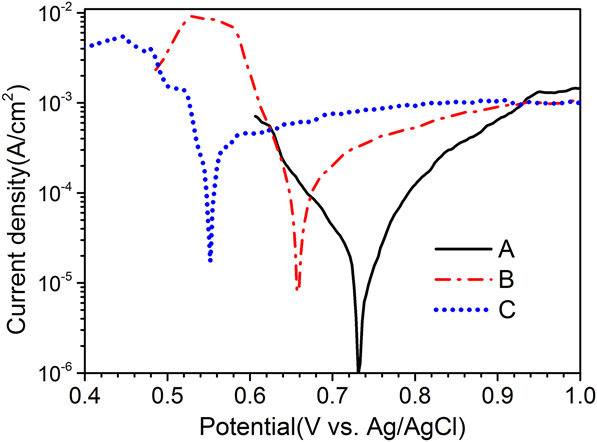
The corrosion potential and current density obtained in polarization curves (Fig. 4) explain the different dealloying behaviors of the films. For sample A, they are 0.73 V and 1.7 × 10⁻⁵ A/cm2, respectively, reproducing values obtained for amorphous ribbons with the same composition.Reference Paschalidou, Celegato, Scaglione, Rizzi, Battezzati, Gebert, Oswald, Wolff, Mihaylov and Spassov6 The potential decreases to 0.65 V for sample B and 0.55 V for sample C while the current density increases to 9.9 × 10⁻⁵ A/cm2 and 2.6 × 10⁻⁴ A/cm2, respectively. The approximately 15 times increase in current density with respect to sample A, accompanied by the decrease in corrosion potential, suggests faster corrosion kinetics in nanoglass films with respect to homogeneous samples.
Potentiodynamic polarization curves for samples A, B, and C obtained with a scan rate of 5 mV/s in a 2 M HNO3 aqueous solution at 70 °C. The anodic branch refers to oxidation of less noble elements (Si and Cu) and the cathodic one refers to reduction of nitrate ions to nitrite. The corrosion current density (j corr) was calculated using the Tafel extrapolation of the cathodic branch at zero overvoltage.

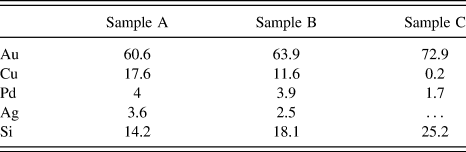
EDX measurements were performed on the samples after 1 h dealloying in 2 M HNO3 (Table II). The measurements were performed on three different spots of dimension 500 × 500 μm per sample, with a depth probed by EDX estimated at 300 nm. The concentration of Cu is the largest in sample A (17.6 at.%). This concentration is reduced in sample B but still reaches 11.6 at.%. In sample C, however, only a small amount of Cu could be detected. Samples A and B contain a small amount of Pd and Ag after dealloying. The Pd concentration is further reduced in sample C and Ag was not in sufficient quantity to be detected in this sample. The presence of residual Pd is considered beneficial to the ligament stability against coarsening in NPG.Reference Lang, Guo, Chen and Kudo30 On the other hand, the concentration of Au was the highest in sample C. It suggests a better dissolution of the less noble elements in the nanoglass thin films in respect of the homogeneous thin film. Si was also detected in all the samples, in relatively large quantities. This reproduces the finding of SiO2 patches in the case of chemically dealloyed Au–Si metallic glass ribbonsReference Scaglione, Rizzi, Celegato and Battezzati31 which were shown to originate from Si oxidation. The silica particles are placed at random in between the ligaments when they are not released into the electrolyte. They do not appear to hinder the electrolyte from penetrating into the pores of the material.
Concentration in at.% measured by EDX in samples A, B, and C dealloyed in 2 M HNO3 at 70 °C for 1 h. The concentration of Ag in sample C was too low to be detected.

The etching of sample A is slow in comparison with the other films because it is constituted of a fully dense amorphous phase in contact with the electrolyte only through its external surface. The resulting microstructure both in the early stage and after prolonged dealloying is akin to that found with bulk amorphous ribbons of the same composition whose dealloying mechanism was elucidated earlier.Reference Paschalidou, Celegato, Scaglione, Rizzi, Battezzati, Gebert, Oswald, Wolff, Mihaylov and Spassov6 In short, crystalline mounds are formed first by spontaneous germination and surface diffusion of Au atoms freed from less noble nearest neighbors. Ligaments form later when the mounds are undercut by electrolyte penetration. After 1 h dealloying, porosities could only be observed on the top of the film. The crystal growth in this film is influenced by the presence of fine crystals, as it has been demonstrated with bulk metallic glasses.Reference Gebert, Buchholz, Leonhard, Mummert, Eckert and Schultz32–Reference Mihailov, Redzheb and Spassov34 Here, the enhanced intensity of the (220) diffraction peak after dealloying suggests that crystals with (220) orientation originally embedded in the amorphous phase constitute heterogeneous seeds for growth of Au crystals with preferential orientation (Fig. 2).
Sample C has less dense interfaces and voids at boundaries in between nanocolumns where the electrolyte can percolate initiating corrosion at multiple sites, not only from the top but also laterally, resulting in an increased dealloying rate. The identical ligament morphology across the thickness suggests indeed that the whole film was dealloyed simultaneously [Fig. 3(i)]. In addition, the higher concentration of Cu at the top surface can facilitate the initiation of dealloying (Table I). The intercolumnar voids present in the as-sputtered state may also hamper the diffusion of Au across nanocolumns, limiting coarsening of the ligaments in the early stages of dealloying. The ligaments become finally interconnected after 1 h, but their thickness is still limited [Fig. 3(f)]. As a comparison, the size of the ligaments is around 8 times lower than that of Au-based glassy ribbons of the same composition as the film which were dealloyed at 70 °C for the same amount of time.Reference Paschalidou, Scaglione, Gebert, Oswald, Rizzi and Battezzati35 The presence of residual Cu, Ag, and Pd is also less in this sample than it is in samples A and B (Table II).
Sample B is an intermediate case in that it has no voids but interfaces of lower density in between nanoclusters which apparently provide preferential sites for corrosion, as shown by the formation of thin ligaments and pores after 10 min of dealloying [Fig. 3(b)]. However, the electrolyte did not penetrate immediately in the film, at variance with sample C which has intercolumnar voids. It is observed that the pores near the top of film B could reach up to 80 nm in width when those at the bottom did not exceed 20 nm in width [Fig. 3(h)], suggesting that dealloying and coarsening occurred progressively across the film section. At variance with sample A, in samples B and C, the crystals germinated without preferential orientation directly from the amorphous phase as testified by the normal ratio of the intensity of the diffraction peaks [Fig. 2(b)]. They grew to a limited extent and then impinged on each other forming ligaments.
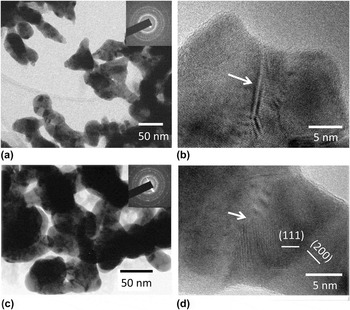
Images of sample C deposited for TEM observation are reported in Fig. 5 after dealloying for 10 min (a and b) and 1 h (c and d). The presence of less noble elements was confirmed by EDX analyses. Their atomic percentages after 10 min were measured to be 4.5 ± 1.8 for Pd, 0.9 ± 0.6 for Ag, and 21.4 ± 2.0 for Si; and after 1 h, 2.1 ± 0.5 for Pd, 0.7 ± 0.4 for Ag, and 21.5 ± 0.7 for Si. Cu was not considered since the sample holder was a Cu grid. Figure 5 shows the 10 min dealloyed columns evolving into ligaments and the final ligament network. Ligaments are constituted by crystals with an average size below 10 nm. Their surface is rough with kinks and necks, especially at grain boundaries. Necks result from impingement of ligaments during growth. High-resolution images of portions of ligaments reveal the Au-based crystals, clearly identified from the lattice fringes of {111} and {200} planes [Figs. 5(b) and 5(d)]. Amorphous portions of the material can be distinguished locally, attached to the ligaments. They are identified with EDX analysis as silica patches which are usually obtained in dealloying Au–Si-based metallic glasses. Atomic steps are clearly visible on the surface of ligaments with favorable orientation. Atomic steps and surface defects were evidenced on dealloyed rapidly solidified ribbons and were shown to constitute active sites for catalytic reactions.Reference Fujita, Guan, McKenna, Lang, Hirata, Zhang, Tokunaga, Arai, Yamamoto, Tanaka, Ishikawa, Asao, Yamamoto, Erlebacher and Chen36 TEM studies of Au-based amorphous ribbons showed the occurrence of fine ligaments as those reported in Fig. 5 only in the interlayer between the still glassy region and the region with grown ligaments.Reference Paschalidou, Celegato, Scaglione, Rizzi, Battezzati, Gebert, Oswald, Wolff, Mihaylov and Spassov6 It is apparent that dealloying thin films from both the surface and internal channels provide a mean to obtain a fine microstructure which is seen in ribbons only in a transition zone.
TEM images of sample C after dealloying (a and b) 10 min and (c and d) 1 h in a 2 M HNO3 solution at 70 °C. The samples were deposited employing the same sputtering parameters as for other samples of type C but without the Cr and Au adhesion layers to detach them easily from the glass substrate after dealloying and observe them in TEM without cutting or thinning. (a and c) In bright field images, ligament size and shape are consistent with SEM observations. On HRTEM images, arrows evidence a (b) twin boundary and a (d) grain boundary.

C. Electrochemical properties
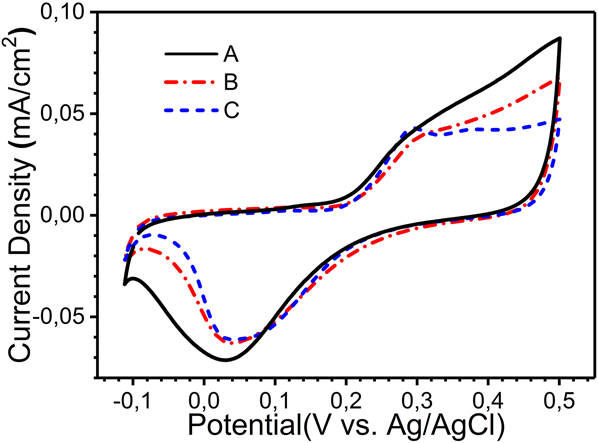
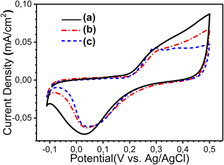
After dealloying for 1 h in 2 M HNO3 at 70 °C, CV scans were performed in 0.5 M KOH aqueous solution for 15 cycles to explore the electrochemical surface status of the A, B, and C dealloyed samples (Fig. 6). Current densities are reported with respect to the effective surface area obtained from I–V plot.Reference Xiao, Xiao, Hu, Yuan, Wang, Qian and Liu22 The effective surface area is 0.98, 3.75, and 5.87 cm2 for samples A, B, and C, respectively, with a geometrical surface of 0.5 cm2 for all the samples. The results suggest the occurrence of various processes due to their different microstructure and amount of less noble elements. As a comparison, the CV scans of a standard gold sample are given in Fig. S3(b). The formation of Au oxides at around 0.25 VReference Lang, Guo, Chen and Kudo30,Reference Paschalidou, Scaglione, Gebert, Oswald, Rizzi and Battezzati35,Reference Zhang, Liu, Ma and Ding37,Reference Borkowska, Tymosiak-Zielinska and Shul38 [Fig. S3(b)] is apparent from a current peak only in the case of sample C. For samples A and B, the total current density comes not only from the Au redox couple but also from the redox states of the remaining less noble elements overlapping the peak of Au oxidation. In fact, the literature reports that Cu,Reference Heli, Jafarian, Mahjani and Gobal39,Reference Khouchaf, Takky and El Mahi Chbihi40 Ag,Reference Abd El Rehim, Hassan, Ibrahim and Amin41,Reference Wan, Wang, Liu, Li, Sun and Wang42 and PdReference Jeong43,Reference Grden, Lukaszewski, Jerkiewicz and Czerwinski44 form oxide species from −0.1 to 0.5 V versus Ag/AgCl (details in the Supplementary Material). We confirmed these results by performing CV experiments in 0.5 M KOH solution with Ag, Cu, and Pd electrodes. The highest current density from 0.3 to 0.5 V is observed on sample A, suggesting a larger presence of Cu, Ag, and Pd, oxidizing in this range. The substantial presence of Cu on this sample was indeed confirmed by EDX measurements (Table II). For sample B, the current density also increased in this range but less than in sample A. This is consistent with the lower Cu concentration measured in this sample (Table II). A negative current peak was observed for all the samples at around 0.05 V. This peak can be associated with the reduction of Au oxide.Reference Lang, Guo, Chen and Kudo30,Reference Zhang, Liu, Ma and Ding37,Reference Borkowska, Tymosiak-Zielinska and Shul38 However, the lower current density of sample A in this range suggests that the reduction of residual Ag and Pd contributes as well to the signal with this sample,Reference Zhang, Liu, Ma and Ding37–Reference Khouchaf, Takky and El Mahi Chbihi40 whereas sample C is closer to the pure NPG state.
CV cycles in 0.5 M KOH solution with a scan rate of 20 mV/s for samples A, B, and C dealloyed in 2 M HNO3 at 70 °C for 1 h.

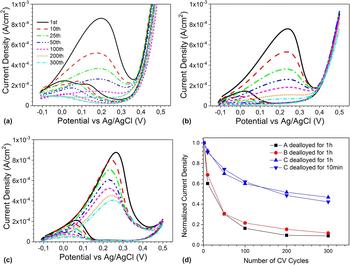
Figure 7 shows CV scans performed in 0.5 M KOH + 5 M CH3OH (MeOH) solution in the presence of samples A, B, and C, after 1 h dealloying. As a comparison, the CV scans of a nanoporous Au ribbon containing only Au is given in Fig. S3(c). The first cycle with sample C has a current density peak of 0.9 mA/cm2 at 0.27 V [Fig. 7(c)], consistent with the assignment of MeOH electrooxidation catalyzed by NPG to formate ions expected in the potential range from −0.1 to 0.4 V.Reference Zhang, Liu, Ma and Ding37,Reference Borkowska, Tymosiak-Zielinska and Shul38,Reference Assiongbon and Roy45 As a comparison, the maximum current density of a dealloyed Au–Ag foil measured by chronoamperometry was at the maximum in the order of 0.1 mA/cm2.Reference Graf, Haensch, Carstens, Wittstock and Weissmüller46 A small increase in current density is detected above 0.45 V, consistent with the MeOH electrooxidation to carbonates expected above this potential.Reference Zhang, Liu, Ma and Ding37,Reference Borkowska, Tymosiak-Zielinska and Shul38 Scanning the potential back to −0.1 V, a current density peak appears in the range from 0.25 V to −0.1 V due to oxidation of MeOH on Au after the occurrence of Au oxide reduction during the reverse scan at around 0.25 V. The first cycles for samples A and B give broader current peaks associated with MeOH electrooxidation below 0.4 V [Figs. 7(a) and 7(b)]. It is believed that the less noble elements both residual and redeposited in these films, present in their oxidized or metallic state on the exposed surface, lead to a broader potential range for MeOH electrooxidation.Reference Paschalidou, Scaglione, Gebert, Oswald, Rizzi and Battezzati35 The increase in current density at 0.35 V in Fig. 7 is described as a result of the methanol electrooxidation, not only on Au oxidesReference Zhang, Liu, Ma and Ding37,Reference Borkowska, Tymosiak-Zielinska and Shul38 but also on Cu oxides.Reference Heli, Jafarian, Mahjani and Gobal39,Reference Khouchaf, Takky and El Mahi Chbihi40 Residual Cu is both trapped in ligaments and contained in the remaining amorphous phase, particularly in sample A.
Electrocatalytic performance of dealloyed samples (a) A, (b) B, and (c) C for 1 h in 2 M HNO3 at 70 °C. The samples were tested for 300 cycles with a scan rate of 20 mV/s in 0.5 M KOH + 5 M CH3OH. (d) Maximum current density in the selected CV scans is normalized with respect to the maximum value of the first scan and reported as a function of the number of cycles.

The electrochemical stability of the samples dealloyed for 1 h in 2 M HNO3 at 70 °C was investigated by performing multiple CV cycles. For samples A and B, the normalized current density decreased rapidly and reached values below 0.1 after 300 cycles [Fig. 7(d)] because of the progressive coverage of Au active sites by oxidized species of less noble elements, especially Cu, formed during the upward scan.Reference Paschalidou, Scaglione, Gebert, Oswald, Rizzi and Battezzati35 For sample C, the concentration in less noble elements is reduced and the normalized current density is still 0.48 after 300 CV cycles. A sample C dealloyed for only 10 min in 2 M HNO3 at 70 °C showed a normalized current density of 0.42 after 300 cycles (Fig. S1), demonstrating the good stability of this thin film, even after short dealloying time. Finally, it is remarked that the ligament morphology and size is retained after the electrocatalysis experiments for the two C samples (Fig. S2).
IV. CONCLUSION
In summary, Au-based glassy thin films prepared by magnetron sputtering were carefully tailored to obtain homogeneous, nanograined, and nanocolumnar microstructures. The films were dealloyed by free corrosion obtaining a range of behavior according to their defect content (i.e., interfaces and voids). The homogeneous thin film was partially dealloyed; the nanograined film was dealloyed on its whole thickness obtaining a range of pore sizes not completely interconnected; the nanocolumnar thin film was fully dealloyed forming a nanoporous material where thin ligaments are separated from each other by interconnected nanopores. Polarization curves demonstrate that the dealloying rate of the nanocolumnar thin film is around 15 times higher than that of the homogeneous thin film under the same conditions. Voids and lower density regions at the interfaces between nanocolumns provide sites for electrolyte penetration, allowing dealloying not only from the top but also from lateral sides. The resulting NPG contains a higher Au concentration than the other two dealloyed thin films while keeping the ligament width finer. This work shows a novel strategy to produce nanoporous materials in a short time, starting from nanoglass precursors, to limit coarsening of the grains and ligaments, and therefore increase the specific surface area of the NPG. The resulting nanoporous films are catalytically active for methanol electrooxidation with good stability of the dealloyed nanocolumnar thin film.
Supplementary Material
To view supplementary material for this article, please visit https://doi.org/10.1557/jmr.2018.176.
ACKNOWLEDGMENTS
This work was supported by the funding scheme of the European Commission, Marie Curie Actions-Initial Training Networks (ITN) in the frame of the project VitriMetTech-Vitrified Metals Technologies and Applications in Devices and Chemistry, 607080 FP7-PEOPLE-2013-ITN. We would like to thank PX Services, La Chaux-de-Fonds (CH), for providing the material and the equipment necessary for the casting of the Au-based target.