
1. Introduction
Described by physicist Pierre-Gilles de Gennes as ‘another animal in soft matter physics’, the Janus particle – often a spherical particle with a hydrophobic and a hydrophilic hemisphere – exhibits complex aggregate, clustering and self-assembly into mesoscopic and macroscopic structures that are relevant to a wide range of applications in biology and bioengineering (de Gennes Reference de Gennes1991). Whether it is surface chemistry or polarity under an external field, the dynamics of Janus particles (JP) in a viscous solvent is inevitably the combination of long-range hydrodynamics interactions with both short- and intermediate-range particle–particle interactions. Such multiscale nature of Janus particle dynamics underlies the richness of a Janus particle suspension, as de Gennes (Reference de Gennes1991) suggested by the example of a ‘thin film of Janus grains’ that can breathe due to the interstices between particles.
Recently, Fu et al. (Reference Fu, Ryham, Klöckner, Wala, Jiang and Young2020) illustrated that the hydrophobic interactions between JP in a viscous solvent can be used as a coarse-grained model to capture the mechanics of an elastic bilayer membrane of amphiphilic macromolecules such as lipids. Depending on their total number and geometry, JP suspensions can aggregate to form a micelle, a patch of bilayer membrane with open ends, and a self-enclosed bilayer membrane, referred to as a JP vesicle. Using a hybrid continuum model for the interactions between amphiphilic particles in a viscous solvent and with a boundary integral formulation, Fu et al. (Reference Fu, Ryham, Klöckner, Wala, Jiang and Young2020) showed that the granularity of membrane remodelling, as occurs during fusion and fission of bilayers, can be accurately captured by the coarse-grained model.
In the present work, we extend the hybrid continuum model in Fu et al. (Reference Fu, Ryham, Klöckner, Wala, Jiang and Young2020) for suspensions to incorporate the collective hydrodynamics of a JP suspension under various flows. The JP vesicles in our simulations replicate well known vesicle hydrodynamics such as tank-treading and interleaflet slippage in a shear flow and migration in Poiseuille flow from continuum models. Furthermore, we use the hybrid continuum model to investigate permeability as well as rupture of a bilayer membrane due to an imposed flow. Finally, we compare a pair of interacting JP vesicles with a continuum model of a pair of vesicles.
To simulate the hydrodynamics of JP in Stokes flow, we require a numerical method to avoid unphysical contact between rigid JP. Optimization-based contact methods introduce constraints, such as enforcing a non-positive space–time interference volume (Lu, Rahimian & Zorin Reference Lu, Rahimian and Zorin2017; Bystricky, Shanbhag & Quaife Reference Bystricky, Shanbhag and Quaife2020; Yan et al. Reference Yan, Corona, Malhotra, Veerapaneni and Shelley2020). These methods do not introduce stiffness, but do require solving potentially expensive nonlinear complementarity problems at each time step. Repulsion-based contact methods, which we employ, introduce an artificial repulsion force that increases in strength as two particles approach one another (Glowinski et al. Reference Glowinski, Pan, Hesla, Joseph and Périaux2001; Feng & Michaelides Reference Feng and Michaelides2004; Kabacaoğlu, Quaife & Biros Reference Kabacaoğlu, Quaife and Biros2018). Strong repulsion forces can introduce numerical stiffness, but with the presence of the hydrophobic forces, we maintain contact-free suspensions with a relatively soft repulsive force compared with the short-range repulsion that diverges in the Lennard-Jones potential.
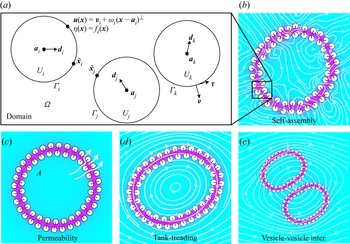
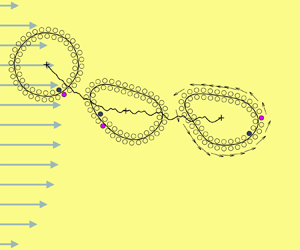
The paper is organized as follows. In § 2 we present the formulation for the JP in a viscous fluid in the zero-Reynolds number regime (figure 1a). In § 3, we extend the hybrid continuum model for a Janus suspension to include the effects of a far-field flow via the mobility problem formulation. In § 4, we validate our model and present simulation results for a single JP vesicle (figure 1d) and for a pair of JP vesicles (figure 1e) under various flowing conditions. Finally we provide discussion and outlook for future directions in § 5.
Panel (a) illustrates the domain and boundary conditions for the mobility problem. The colourmap in panels (b–e) is the solution  $\eta$ of (2.7). Magenta is for
 $\eta = 1$ and turquoise is for
 $\eta = 0$. Particles self-assemble into vesicle bilayers (see panel b) and eventually arrange along inner and outer leaflets. In panel (c),
 $A$ is the enclosed area. Initially stretched vesicles relax to equilibrium with fluid flow across the bilayer. The study considers a single vesicle in background flows such as shear flow (see panel d) and hydrodynamic vesicle–vesicle interactions (see panel e).

2. Governing equations
2.1. Mobility problem
The objective of this work is to study the hydrodynamics of JP vesicles in background flows. We consider an  $N_b$-many-body collection of JP suspended in a two-dimensional unbounded domain
 $\varOmega$. The boundary of each particle is denoted by
 $\varGamma _i$ so that
 $\partial \varOmega = \varGamma _1 \cup \varGamma _2 \cup \cdots \cup \varGamma _{N_b}$ (figure 1a). Assuming the inertial terms are negligible, the governing equations are
 $$\begin{gather} -\mu \Delta \boldsymbol{u} + \boldsymbol{\nabla} p = \boldsymbol{0}, \quad \boldsymbol{x} \in \varOmega, \end{gather}$$
 $$\begin{gather}\boldsymbol{\nabla}\boldsymbol{\cdot} \boldsymbol{u} = 0, \quad \boldsymbol{x} \in \varOmega, \end{gather}$$
 $$\begin{gather}\boldsymbol{u} - \boldsymbol{u}_\infty \to \boldsymbol{0}, \quad |\boldsymbol{x}| \to \infty, \end{gather}$$
where  $\boldsymbol {u}$ is the velocity,
 $p$ is the pressure,
 $\boldsymbol {u}_\infty$ is the background velocity and
 $\mu$ is the constant viscosity. Since each particle
 $\varGamma _i$ with centre
 $\boldsymbol {a}_i$ is a rigid body, its velocity satisfies the no-slip boundary condition
 \begin{equation} \boldsymbol{u}(\boldsymbol{x}) = \boldsymbol{v}_i + \omega_i (\boldsymbol{x} - \boldsymbol{a}_i)^{{\perp}}, \quad \boldsymbol{x} \in \varGamma_i, \end{equation}
where  $\boldsymbol {v}_i$ is its translational velocity and
 $\omega _i$ is its angular velocity. Here,
 $\langle x, y \rangle ^{\perp } = \langle -y, x \rangle$.
To determine the translational and angular velocities of each particle, we define imposed forces  $\boldsymbol {F}_i$ and torques
 $T_i$ acting on each particle. Since the small particles are inertialess, force and torque balance gives
 $$\begin{gather} \boldsymbol{F}_i - \int_{\varGamma_i} \boldsymbol{\sigma} \boldsymbol{\cdot} \boldsymbol{\nu} \, \mathrm{d} s = \boldsymbol{0}, \quad i=1,\ldots,N_b, \end{gather}$$
 $$\begin{gather}T_i - \int_{\varGamma_i} (\boldsymbol{x} - \boldsymbol{a}_i)^{{\perp}} \cdot (\boldsymbol{\sigma} \cdot \boldsymbol{\nu}) \, \mathrm{d} s = 0, \quad i=1,\ldots,N_b, \end{gather}$$
where  $\boldsymbol {\sigma } = -p \boldsymbol{\mathsf{I}} + \mu (\boldsymbol {\nabla } \boldsymbol {u} + \boldsymbol {\nabla } \boldsymbol {u}^{\rm T})$ is the hydrodynamic stress tensor (pressure tensor) and
 $\boldsymbol {\nu }$ is the particle outward normal. The process of finding the translational and angular velocities given the forces and torques is referred to as the mobility problem.
2.2. Imposed forces
The imposed forces and torques contain two parts: hydrophobic attraction and repulsion. The hydrophobic attraction potential (HAP) was introduced by Fu et al. (Reference Fu, Ryham, Klöckner, Wala, Jiang and Young2020) and is responsible for forming particle aggregates that sequester their hydrophobic surface regions (figure 1b). We model hydrophobic attraction by solving the screened Laplace equation boundary value problem
 $$\begin{gather} -\rho^{2} \Delta \eta + \eta =0,\quad \boldsymbol{x} \in \varOmega, \end{gather}$$
 $$\begin{gather}\eta (\boldsymbol{x}) = f_i(\boldsymbol{x}),\quad \boldsymbol{x} \in \varGamma_i,\; i=1,\ldots,N_b, \end{gather}$$
 $$\begin{gather}\eta \to 0,\quad |\boldsymbol{x}| \to \infty, \end{gather}$$
where  $0 \leq f_i \leq 1$ is a material label with
 $f_i = 0$ (respectively,
 $1$) representing hydrophilic (respectively, hydrophobic) portions of the surface. We assume that both
 $f_i$ and
 $\varGamma _i$ are smooth. The parameter
 $\rho > 0$ is the decay length of attraction. The forces and torques of attraction are
 \begin{equation} \boldsymbol{F}_i^{{hydro}} = \int_{\varGamma_i} \boldsymbol{\mathsf{T}}\boldsymbol{\cdot} \boldsymbol{\nu} \, \mathrm{d} s, \quad T_i^{{hydro}} = \int_{\varGamma_i} (\boldsymbol{x} - \boldsymbol{a}_i)^{{\perp}} \boldsymbol{\cdot} (\boldsymbol{\mathsf{T}} \boldsymbol{\cdot} \boldsymbol{\nu}) \,\mathrm{d} s, \end{equation}
where
 \begin{equation} \boldsymbol{\mathsf{T}} =
\gamma\rho^{{-}1}\eta ^{2} \boldsymbol{\mathsf{I}} + 2\rho\gamma
(\tfrac{1}{2}|\boldsymbol{\nabla} \eta |^{2} \boldsymbol{\mathsf{I}}
- \boldsymbol{\nabla} \eta \boldsymbol{\nabla} \eta ^{\rm
T}) \end{equation}
is the hydrophobic stress tensor and  $\gamma > 0$ is the interfacial tension.
The second part of the imposed forces and torques comes from repulsion between proximal particles. Given a pair of particles indexed with  $i$ and
 $j$, we find the two points
 $\tilde {\boldsymbol {x}}_i \in \varGamma _i$ and
 $\tilde {\boldsymbol {x}}_j \in \varGamma _j$ that are closest to one another (figure 1a). We then define the repulsion force and torque as
 $$\begin{gather} \boldsymbol{F}_i^{{repul}} = \frac{M}{\rho_0} \sum_{j \neq i} \frac{\tilde{\boldsymbol{x}}_i - \tilde{\boldsymbol{x}}_j} {|\tilde{\boldsymbol{x}}_i - \tilde{\boldsymbol{x}}_j|} P'\left(\frac{|\tilde{\boldsymbol{x}}_i - \tilde{\boldsymbol{x}}_j|}{\rho_0}\right), \end{gather}$$
 $$\begin{gather}T_i^{{repul}} = \frac{M}{\rho_0} \sum_{j \neq i} (\tilde{\boldsymbol{x}}_i - \boldsymbol{a}_i)^{{\perp}} \boldsymbol{\cdot} \frac{\tilde{\boldsymbol{x}}_i - \tilde{\boldsymbol{x}}_j} {|\tilde{\boldsymbol{x}}_i - \tilde{\boldsymbol{x}}_j|} P'\left(\frac{|\tilde{\boldsymbol{x}}_i - \tilde{\boldsymbol{x}}_j|}{\rho_0}\right). \end{gather}$$
The repulsion profile  $P(r/\rho _0)$ is set to zero for distances
 $r$ larger than a repulsion length scale
 $\rho _0$. As such, (2.12) and (2.13) ignore particles outside a
 $\rho _0$-tubular neighbourhood of
 $\varGamma _i$. For
 $0 \leq r < \rho _0,$ we use
 $P(r) = 1 - \sin ({\rm \pi} r/2)$. Then, the total imposed force and torque are
 \begin{equation} \boldsymbol{F}_i = \boldsymbol{F}_i^{{hydro}} + \boldsymbol{F}_i^{{repul}},\quad T_i = T_i^{{hydro}} + T_i^{{repul}}, \quad i=1,\ldots,N_b. \end{equation}
The high-order interpolation-based quadrature rule used to compute the nearly singular integrals has been shown to accurately capture the lubrication hydrodynamics in the narrow space between boundaries when the repulsive potential  $P$ gives a large steric force (Quaife & Biros Reference Quaife and Biros2014). In the simulations we adjust the spatial resolution on the particle boundary to ensure that the lubrication hydrodynamics is well resolved as in Quaife, Veerapaneni & Young (Reference Quaife, Veerapaneni and Young2019) and Quaife, Gannon & Young (Reference Quaife, Gannon and Young2021).
3. Integral equation method
Computing the HAP and the particle forces and torques requires the solution of elliptic partial differential equations (PDEs) in an unbounded complicated domain. We recast both these PDEs as boundary integral equations (BIEs). We discretize each BIE at  $N$ points on each of the
 $N_b$ particles with a collocation method. All derivatives are computed with spectrally accurate Fourier differentiation. Integrals that are smooth are computed with the spectrally accurate trapezoid rule, and nearly singular integrals, caused by close contact between two particles, are computed with a high-order interpolation-based quadrature rule (Quaife & Biros Reference Quaife and Biros2014). After discretizing and applying quadrature, the resulting linear system is solved with a matrix-free generalized minimal residual method (GMRES), and we guarantee that the number of GMRES iterations is mesh-independent by using second-kind BIEs.
3.1. HAP BIE
Similar to the previous work (Fu et al. Reference Fu, Ryham, Klöckner, Wala, Jiang and Young2020), we represent the HAP as a double-layer potential
 \begin{equation} \eta (\boldsymbol{x}) = \frac{1}{2{\rm \pi}} \int_{\partial\varOmega} \left(\frac{\partial {}}{\partial {\boldsymbol{\nu}_{\boldsymbol{y}}}} {\rm K}_0 \left(\frac{|\boldsymbol{x} - \boldsymbol{y}|}{\rho}\right)\right) \sigma(\boldsymbol{y}) \, \mathrm{d} s_{\boldsymbol{y}}, \quad \boldsymbol{x} \in \varOmega, \end{equation}
where  ${\rm K}_0$ is the zeroth-order modified Bessel function of the first kind and the integral is taken in the sense of principle value whenever
 $\boldsymbol {x} \in \partial \varOmega$. By requiring that the density function
 $\sigma$ satisfies the second-kind integral equation
 \begin{equation} f(\boldsymbol{x}) = \frac{1}{2}\sigma(\boldsymbol{x}) + \frac{1}{2{\rm \pi}}\int_{\partial\varOmega} \left(\frac{\partial {}}{\partial {\boldsymbol{\nu}_{\boldsymbol{y}}}} {\rm K}_0 \left(\frac{|\boldsymbol{x} - \boldsymbol{y}|}{\rho}\right)\right) \sigma(\boldsymbol{y}) \, \mathrm{d} s_{\boldsymbol{y}}, \quad \boldsymbol{x} \in \partial\varOmega, \end{equation}
the HAP double-layer potential (3.1) satisfies the screened Laplace equation (2.7)–(2.9). After discretizing (3.2), the result is an  $NN_b \times NN_b$ linear system that is solved with block-diagonal preconditioned GMRES.
To calculate the hydrophobic force and torque, the gradient of the double-layer potential (3.1) must be computed on the boundary of each particle. The resulting integrands are singular, and specialized quadrature would be necessary to approximate such integrals. Alternatively, in § 3.3, we show how the force and torque calculations can be expressed in terms of non-singular integrals.
3.2. Mobility problem BIE
Following the previous work of Bystricky et al. (Reference Bystricky, Shanbhag and Quaife2020), we use the velocity representation of Power & Miranda (Reference Power and Miranda1987). In particular, we write the velocity as the sum of a double-layer potential and  $N_b$-many Stokeslets and rotlets
 \begin{equation} \boldsymbol{u}(\boldsymbol{x}) = \boldsymbol{u}_\infty(\boldsymbol{x}) + \mathcal{D}[\boldsymbol{\eta}](\boldsymbol{x}) + \sum_{i=1}^{N_b} \left(\boldsymbol{\mathsf{S}}(\boldsymbol{x},\boldsymbol{a}_i) \boldsymbol{\cdot} \boldsymbol{F}_i + \boldsymbol{R}(\boldsymbol{x},\boldsymbol{a}_i) T_i\right), \quad \boldsymbol{x} \in \varOmega. \end{equation}
The double-layer potential is
 \begin{equation} \mathcal{D}[\boldsymbol{\eta}](\boldsymbol{x}) = \frac{1}{\rm \pi} \int_{\partial\varOmega} \frac{\boldsymbol{r} \boldsymbol{\cdot} \boldsymbol{\nu}}{|\boldsymbol{r}|^{2}} \frac{\boldsymbol{r} \otimes \boldsymbol{r}}{|\boldsymbol{r}|^{2}} \boldsymbol{\cdot} \boldsymbol{\eta}(\boldsymbol{y}) \, \mathrm{d} s_{\boldsymbol{y}}, \end{equation}
where  $\boldsymbol {r} = \boldsymbol {x} - \boldsymbol {y}$. The Stokeslets and rotlets centred at
 $\boldsymbol {a}_i$ are
 $$\begin{gather} \boldsymbol{\mathsf{S}}(\boldsymbol{x},\boldsymbol{a}_i) \boldsymbol{\cdot} \boldsymbol{F}_i = \frac{1}{4{\rm \pi}} \left(-\log |\boldsymbol{r}|\boldsymbol{\mathsf{I}} + \frac{\boldsymbol{r} \otimes \boldsymbol{r}}{|\boldsymbol{r}|^{2}}\right) \boldsymbol{\cdot} \boldsymbol{F}_i, \end{gather}$$
 $$\begin{gather}\boldsymbol{R}(\boldsymbol{x},\boldsymbol{a}_i) T_i= \frac{1}{4{\rm \pi}} \frac{\boldsymbol{r}^{{\perp}}}{|\boldsymbol{r}|^{2}} T_i, \end{gather}$$
respectively, where  $\boldsymbol {r} = \boldsymbol {x} - \boldsymbol {a}_i$. The Stokeslet (3.5) is torque-free and has force
 $\boldsymbol {F}_i$ while the rotlet (3.6) is force-free and has torque
 $T_i$. Therefore, the velocity (3.3) satisfies the total force (2.5) and torque (2.6) conditions if the double-layer potential
 $\mathcal {D}[\boldsymbol {\eta }]$ is force- and torque-free. Matching the limit of (3.3) with the rigid body motion, the density function
 $\boldsymbol {\eta }$, translational velocity
 $\boldsymbol {v}_i$ and angular velocity
 $\omega _i$ satisfy
 $$\begin{align} &\boldsymbol{v}_i + \omega_i (\boldsymbol{x} - \boldsymbol{a}_i)^{{\perp}} = \boldsymbol{u}_\infty(\boldsymbol{x}) -\frac{1}{2} \boldsymbol{\eta}(\boldsymbol{x}) + \mathcal{D}[\boldsymbol{\eta}](\boldsymbol{x}) \nonumber\\ &\quad + \sum_{j=1}^{N_b} \left(\boldsymbol{\mathsf{S}}(\boldsymbol{x},\boldsymbol{a}_j) \boldsymbol{\cdot} \boldsymbol{F}_j + \boldsymbol{R}(\boldsymbol{x},\boldsymbol{a}_j) T_j\right), \quad \boldsymbol{x} \in \varGamma_i,\ i=1,\ldots,N_b, \end{align}$$
 $$\begin{gather}\int_{\varGamma_i} \boldsymbol{\eta} \, \mathrm{d} s = \boldsymbol{F}_i, \quad i = 1,\ldots,N_b, \end{gather}$$
 $$\begin{gather}\int_{\varGamma_i} \boldsymbol{\eta} \boldsymbol{\cdot} (\boldsymbol{x}-\boldsymbol{a}_i)^{{\perp}} \, \mathrm{d} s = T_i, \quad i = 1,\ldots,N_b. \end{gather}$$
After discretizing and applying appropriate quadrature rules, the result is a  $(2NN_b + 3N_b) \times (2NN_b + 3N_b)$ linear system that we solve with block-diagonal preconditioned GMRES. Other BIE formulations of the mobility problem use single-layer potentials (Rachh & Greengard Reference Rachh and Greengard2016; Corona et al. Reference Corona, Greengard, Rachh and Veerapaneni2017) or a combination of single- and double-layer potentials (Corona & Veerapaneni Reference Corona and Veerapaneni2018).
We validated our solver for (3.7)–(3.9) using a single elliptical particle suspended in a background shear flow (see § 4.2.1). Hydrophobic attraction and repulsion are zero for a single particle (see Fu et al. Reference Fu, Ryham, Klöckner, Wala, Jiang and Young2020, equation 2.13). The angle of the ellipse's major axis coming from the integral equation method agreed with the theoretical, Jeffery orbit time-course (Jeffery Reference Jeffery1922).
3.3. Main theoretical result: calculating the hydrophobic force
Once (3.2) has been solved for  $\sigma$, we need to evaluate the integrals (2.10) which are the HAP forces and torques. These integrals involve the stress (2.11) which contains a singular integral for the gradient of the double-layer potential. To avoid singular integrals, we first define
 \begin{equation} w_i(\boldsymbol{x}) = \eta (\boldsymbol{x}) - \eta _i(\boldsymbol{x}), \end{equation}
where
 \begin{equation} \eta _i(\boldsymbol{x}) = \frac{1}{2{\rm \pi}} \int_{\varGamma_i} \left(\frac{\partial {}}{\partial {\boldsymbol{\nu}_{\boldsymbol{y}}}} {\rm K}_0 \left(\frac{|\boldsymbol{x} - \boldsymbol{y}|}{\rho}\right)\right) \sigma(\boldsymbol{y}) \, \mathrm{d} s_{\boldsymbol{y}}, \quad \boldsymbol{x} \in \mathbb{R}^{2}. \end{equation}
That is,  $w_i(\boldsymbol {x})$ is the double-layer potential (3.1) with
 $\varGamma _i$ excluded from
 $\partial \varOmega$. Having defined
 $w_i$, we prove
Theorem 3.1
 \begin{equation} \boldsymbol{F}_i^{{hydro}} = \int_{\varGamma_i} \boldsymbol{J}_i \,\mathrm{d} s,\quad T_i^{{hydro}} = \int_{\varGamma_i} (\boldsymbol{x} - \boldsymbol{a}_i)^{{\perp}} \boldsymbol{\cdot} \boldsymbol{J}_i \,\mathrm{d} s, \end{equation}
where
 \begin{equation} \boldsymbol{J}_{i} = 2\gamma\rho^{{-}1} \sigma w_i \boldsymbol{\nu} + 2\gamma\rho \frac{\mathrm{d} \sigma}{\mathrm{d} s} \frac{\mathrm{d} w_i}{\mathrm{d} s} \boldsymbol{\nu} - 2\gamma\rho \frac{\mathrm{d} \sigma}{\mathrm{d} s} \frac{\mathrm{d} w_i}{\mathrm{d} \boldsymbol{\nu}} \boldsymbol{\tau}. \end{equation}
The symbols  $\boldsymbol {\tau }$ and
 ${\mathrm {d} }/{\mathrm {d} s}$ are the unit tangent and arclength derivative for
 $\varGamma _i$, respectively (figure 1a). The result is valid for any smooth particle shape or boundary condition. The advantage of using (3.12) over using (2.10) is that the components
 $\sigma$,
 $w_i$,
 ${\mathrm {d} \sigma }/{\mathrm {d} s}$ and
 ${\mathrm {d} w_i}/{\mathrm {d} s}$ of
 $\boldsymbol {J}_i$ are smooth functions, whereas the components of (2.11) are singular integrals.
To prove (3.12), let
 \begin{align} \boldsymbol{\mathsf{T}} &=
\boldsymbol{\mathsf{S}}(\eta _i,\eta _i) +(\boldsymbol{\mathsf{S}}(\eta
_i,w_i) +\boldsymbol{\mathsf{S}}(w_i,\eta _i))
+\boldsymbol{\mathsf{S}}(w_i,w_i) \nonumber\\ &= \boldsymbol{\mathsf{T}}_1 +
\boldsymbol{\mathsf{T}}_2 + \boldsymbol{\mathsf{T}}_3 \end{align}
where we introduce the bilinear form
 \begin{equation} \boldsymbol{\mathsf{S}}(\eta ,v)
= \gamma\rho^{{-}1} \eta v \boldsymbol{\mathsf{I}} + \gamma\rho
\boldsymbol{\nabla} \eta \boldsymbol{\cdot}
\boldsymbol{\nabla} v \boldsymbol{\mathsf{I}} - 2 \gamma \rho
\boldsymbol{\nabla} \eta \boldsymbol{\nabla} v^{\rm T}.
\end{equation}
Using the fact that  $\eta$,
 $\eta _i$ and
 $w_i$ solve the screened Laplace equation (2.7), and that
 $\boldsymbol{\mathsf{T}}$,
 $\boldsymbol{\mathsf{T}}_j$,
 $j = 1, 2, 3$ are symmetric, it is straightforward to verify that
 \begin{equation} \boldsymbol{\nabla}
\boldsymbol{\cdot} \boldsymbol{\mathsf{T}}_j = 0, \quad
\boldsymbol{\nabla} \boldsymbol{\cdot}
((\boldsymbol{x}-\boldsymbol{a}_i)^{{\perp}}
\boldsymbol{\cdot} \boldsymbol{\mathsf{T}}_j) = 0, \quad j = 1, 2,
3. \end{equation}
Let  $U_i$ be the interior of the particle indexed by
 $i$. For
 $\boldsymbol {x}_0 \in \varGamma _i$ and an arbitrary function
 $g(\boldsymbol {x})$, the notation
 \begin{equation} [\![ {g} ]\!](\boldsymbol{x}_0) = \lim_{\substack{\boldsymbol{x} \to \boldsymbol{x}_0 \\ \boldsymbol{x} \in U_i^{c}}}g(\boldsymbol{x}) - \lim_{\substack{\boldsymbol{x} \to \boldsymbol{x}_0 \\ \boldsymbol{x} \in U_i}}g(\boldsymbol{x}), \end{equation}
denotes the jump of the limits of  $g(\boldsymbol {x})$ taken from the outside to the inside of
 $\varGamma _i$.
Lemma 3.2
 \begin{equation}
\boldsymbol{F}_i^{{hydro}} = \int_{\varGamma_i} [\![
{\boldsymbol{\mathsf{T}}_2 \boldsymbol{\cdot} \boldsymbol{\nu}}
]\!] \, \mathrm{d} s,\quad T_i^{{hydro}} =
\int_{\varGamma_i} (\boldsymbol{x} -
\boldsymbol{a}_i)^{{\perp}} \boldsymbol{\cdot} [\![
{\boldsymbol{\mathsf{T}}_2 \boldsymbol{\cdot} \boldsymbol{\nu}}
]\!] \, \mathrm{d} s.
\end{equation}
Proof. To show (3.18), we expand (2.10) as
 \begin{equation} \boldsymbol{F}_i =
\int_{\varGamma_i} \left(\boldsymbol{\mathsf{T}}_1
\boldsymbol{\cdot} \boldsymbol{\nu} + \boldsymbol{\mathsf{T}}_2
\boldsymbol{\cdot} \boldsymbol{\nu} + \boldsymbol{\mathsf{T}}_3
\boldsymbol{\cdot} \boldsymbol{\nu} \right) \,\mathrm{d} s.
\end{equation}
By (3.10) and (3.16), we have that  $\eta _i$ is smooth and
 $\boldsymbol {\nabla } \boldsymbol {\cdot } \boldsymbol{\mathsf{T}}_1 = \boldsymbol {0}$ in
 $\mathbb {R}^{n} {\setminus} \overline{U}_i$. Similarly,
 $w_i = \eta - \eta _i$ is smooth and
 $\boldsymbol {\nabla } \boldsymbol {\cdot } \boldsymbol{\mathsf{T}}_3 = \boldsymbol {0}$ in
 ${U}_i$. By the divergence theorem,
 \begin{align} \int_{\varGamma_i}
\boldsymbol{\mathsf{T}}_1 \boldsymbol{\cdot} \boldsymbol{\nu}
\,\mathrm{d} s ={-}\int_{\mathbb{R}^{n} \setminus \overline{U}_i}
\boldsymbol{\nabla} \boldsymbol{\cdot} \boldsymbol{\mathsf{T}}_1
\,\mathrm{d} \boldsymbol{x} = \boldsymbol{0},\quad
\int_{\varGamma_i} \boldsymbol{\mathsf{T}}_3 \boldsymbol{\cdot}
\boldsymbol{\nu}\,\mathrm{d} s = \int_{U_i}
\boldsymbol{\nabla} \boldsymbol{\cdot} \boldsymbol{\mathsf{T}}_3
\,\mathrm{d} \boldsymbol{x} = \boldsymbol{0}.
\end{align}
Finally,  $\eta _i$ and
 $w_i$ are smooth and
 $\boldsymbol {\nabla } \boldsymbol {\cdot } \boldsymbol{\mathsf{T}}_2= 0$ in
 $U_i$. This gives
 \begin{equation} \boldsymbol{0} = \int_{U_i} \boldsymbol{\nabla} \boldsymbol{\cdot} \boldsymbol{\mathsf{T}}_2 \, \mathrm{d} \boldsymbol{x} = \int_{\varGamma_i} (\boldsymbol{\mathsf{T}}_2 \boldsymbol{\cdot} \boldsymbol{\nu})^{-}\,\mathrm{d} s, \end{equation}
where the superscript denotes the limit taken from in  $U_i$. Combining the above gives the first equation in (3.18). The derivation for the second equation in (3.18) is identical.
We have the following jump relations for (3.10):
 \begin{equation} [\![ {\eta _i} ]\!] = \sigma, \quad [\![ {w_i} ]\!] = 0, \quad [\![ {\boldsymbol{\nabla} \eta _i} ]\!] = \frac{\mathrm{d} \sigma}{\mathrm{d} s}\boldsymbol{\tau},\quad [\![ {\boldsymbol{\nabla} w_i} ]\!] = \boldsymbol{0}, \end{equation}
on  $\varGamma _i$ (see, e.g. Klöckner et al. Reference Klöckner, Barnett, Greengard and O'Neil2013). Therefore,
 \begin{align} [\![ {\boldsymbol{\mathsf{T}}_2
\boldsymbol{\cdot} \boldsymbol{\nu}} ]\!] &= [\![
{\boldsymbol{\mathsf{S}}(\eta _i,w_i) \boldsymbol{\cdot}
\boldsymbol{\nu} + \boldsymbol{\mathsf{S}}(w_i,\eta _i)
\boldsymbol{\cdot} \boldsymbol{\nu}} ]\!]\nonumber\\ &=
\left[\!\left[ \left( 2\gamma\rho^{{-}1} \eta _i w_i
\boldsymbol{\mathsf{I}} + 2\gamma\rho \boldsymbol{\nabla} \eta _i
\boldsymbol{\cdot} \boldsymbol{\nabla} w_i \boldsymbol{\mathsf{I}} -
2\gamma\rho \boldsymbol{\nabla} \eta _i \boldsymbol{\nabla}
w_i - 2\gamma\rho \boldsymbol{\nabla} w_i
\boldsymbol{\nabla} \eta _i\right) \boldsymbol{\cdot}
\boldsymbol{\nu} \right]\!\right] \nonumber\\ &=
2\gamma\rho^{{-}1} \sigma w_i \boldsymbol{\nu} +
2\gamma\rho \frac{\mathrm{d} \sigma }{\mathrm{d}
s}\frac{\mathrm{d} w_i }{\mathrm{d} s} \boldsymbol{\nu} -
2\gamma\rho \ \frac{\mathrm{d} \sigma }{\mathrm{d} s}
\frac{\mathrm{d} w_i }{\mathrm{d} \boldsymbol{\nu}}
\boldsymbol{\tau} = \boldsymbol{J}_i.
\end{align}
3.4. Time marching
To summarize, the proposed algorithm aims to obtain the JP velocities  ${\boldsymbol v}_i$ and
 $\omega _i$. After calculating the imposed forces
 $\boldsymbol {F}_i$ and torques
 $T_i$, two density functions
 $\sigma$ and
 $\boldsymbol {\eta }$ are solved in the second-kind integral equations involving the HAP (3.2) and the mobility problem (3.7)–(3.9) via GMRES. Moreover, a second-order Adams–Bashforth scheme updates the particle positions and orientations. By including the repulsion force (2.12), particle collisions can be avoided by setting the time step sizes comparable to the characteristic time.
4. Numerical results
4.1. Model parameters
Fu et al. (Reference Fu, Ryham, Klöckner, Wala, Jiang and Young2020) studied physical quantities for static JP vesicles and empirically deduced realistic bending moduli, stretching moduli and tilt moduli under reasonable assumptions for the input parameters. In the present work, we study JP vesicles in various background flows. We also perform parametric studies of effective properties of the JP vesicles as a function of particle size and interaction strength.
The particles are circular disks with centres  $\boldsymbol {a}_i$ and unit-length directors
 $\boldsymbol {d}_i$ (figure 1a). The simulations use the reference length
 $l_0 = 2.5$ nm representing the thickness of a lipid monolayer. The boundary conditions (2.8) are
 $f_i(\boldsymbol {x}) = (1 + \cos \theta _i)/2$ where
 $\theta _i$ is the angle between
 $\boldsymbol {x} - \boldsymbol {a}_i$ and
 $\boldsymbol {d}_i$. We non-dimensionalize the PDE systems (2.1)–(2.14) problem through the change of variables
 $t \mapsto t\,\text {ns}$,
 $\boldsymbol {x} \mapsto \boldsymbol {x}\,\text {nm}$,
 $\boldsymbol {u} \mapsto \boldsymbol {u}\,\text {nm}\,\text {ns}^{-1}$ and
 $p \mapsto p\,\text {pN}\,\text {nm}^{-2}$. The numerical time step size is
 $\Delta t=0.2$.
The base case is a single JP vesicle consisting of  $N_b = 58$ particles with
 $c = 0.5 l_0$ for particle radius,
 $\rho = 2 l_0$ for decay length,
 $\gamma = 4.1\,\text {pN}\,\text {nm}^{-1}$ for interfacial tension. The parameter
 $\mu = 1\,\text {cP} = 1\,\text {pN}\,\text {ns}\,\text {nm}^{-2}$ is viscosity of room-temperature water. We select
 $M=2.0\,\text {pN}$ and
 $\rho _0 = 0.2l_0$ so that (2.12) prevents particle collisions and is comparable to hydrodynamic lubrication. With a slight modification, the appendix of Cawthorn & Balmforth (Reference Cawthorn and Balmforth2010) provides the asymptotic expression
 $F_{{lubr}} = -\tfrac {3}{2}{\rm \pi} \mu \dot \epsilon (c/\epsilon )^{3/2}$ for the lubrication force between two cylinders in the distance of separation
 $\epsilon \to 0$. For our choice of simulation parameters,
 $F_{{lubr}}$ and (2.12) are comparable because the particle gaps are comparable to the particle radius and the relative velocities
 $\dot \epsilon$ between particles are of the order of a nanometre per nanosecond.
To reach consistent simulation outcomes, we first solve for a baseline JP vesicle that is suitably close to equilibrium. We start with an assumed configuration of  $N=58$ JP in the form of two, circular, apposing monolayers of approximately
 $8$ nm in radius. The norms of the translational and rotational velocities vanish exponentially with an approximate decay rate
 $\sim 4.6\,\mathrm {\mu }{\rm s}^{-1}$. An equilibrium configuration is therefore rapidly attained, as illustrated by supplementary movie 1 (available at https://doi.org/10.1017/jfm.2022.290). This equilibrium configuration serves as the initial data in the subsequent background flow simulations.
For a single JP vesicle, we consider background flows for a shear flow (§ 4.2.1), a parabolic flow (§ 4.2.4) and a quiescent flow (§ 4.2.4). In addition to observing the familiar tank-treading motion, the shear flow studies yield a friction coefficient for intermonolayer slip and a critical rupture shear rate. Permeability coefficients and stretching moduli arise from analysing stretched JP vesicles in the quiescent background flow case.
4.2. Tank-treading vesicles
4.2.1. Vesicle in a shear flow
Our simulation studies begin by showing, for the first time, that a JP suspension with hydrophobic attraction behaves as a tank-treading vesicle (Finken et al. Reference Finken, Lamura, Seifert and Gompper2008; Zhao & Shaqfeh Reference Zhao and Shaqfeh2011). The centroid of the baseline,  $58$-body JP vesicle lies at the origin and the background shear flow
 \begin{equation} \boldsymbol{u}_{\infty}(\boldsymbol{x}) = \dot\gamma (\boldsymbol{x} \boldsymbol{\cdot} \boldsymbol{e}_y) \boldsymbol{e}_x, \end{equation}
is applied for shear rate  $\dot \gamma$, and orthogonal unit vectors
 $\boldsymbol {e}_x$ and
 $\boldsymbol {e}_y$ for the horizontal and vertical directions, respectively. We use the dimensionless shear rate
 $\chi = \dot \gamma$ ns.
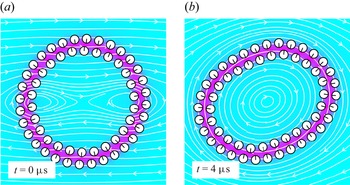
Figure 2 shows snapshots of the JP vesicle in the shear flow with  $\chi =0.0025$. Under the background flow, the rigid-body boundary condition (2.4) causes the particle suspension to elongate. This perturbation disrupts the preferred particle orientations and exposes the hydrophobic core to bulk water (figure 2, magenta region). In response, hydrophobic attraction (2.10) causes the particles to reorient and form a somewhat elliptically shaped suspension. Figure 2(a) shows the initial configuration and figure 2(b) shows the later, fully formed, clockwise tank-treading motion. The JP suspension maintains its bilayer structure throughout the simulation. (See supplementary movie 2 for tank-treading vesicle with
 $\chi =0.005$.) To extract physical quantities, let
 $A^{*} = 4{\rm \pi} A/L^{2}$ be the reduced area and
 $\varDelta =L/\sqrt {A/{\rm \pi} } - 2{\rm \pi}$ the excess length of the bilayer structure (Finken et al. Reference Finken, Lamura, Seifert and Gompper2008). Here,
 $A$ is the enclosed area and
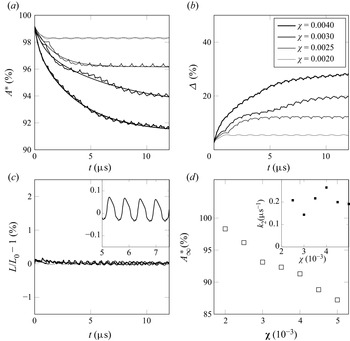
 $L$ is the total length of the JP vesicle (figure 1c). Figure 3 shows the evolution of the area and length for various shear rates. Figure 3(a,b) show that
 $A^{*}$ decreases and
 $\varDelta$ increases with time, respectively, and that the rate of decrease/increase grows with shear rate. The total arclength, however, remains constant for all time for all four shear rates (figure 3c). We conclude that the JP vesicle loses area and that the bilayer behaves as a permeable membrane.
The JP vesicles undergo tank-treading in shear flow. In panel (a), the initial, 58-body vesicle is circular and the black arrows point in the direction of the hydrophobic side of the JP. In panel (b), the JP suspension rotates and deforms with the shear flow. The colourmap is for the solution  $\eta$ of (2.7). The white curves are the streamlines of
 $\boldsymbol {u}.$ The shear rate is
 $\chi =0.0025$.

The JP vesicles lose enclosed area but conserve length in a shear flow. Panel (a) gives the reduced area over time for four different shear rates. The monotonic curves are a two-exponential best fit. There is a commensurate increase in excess length (see panel b), but the arclength of the midplane curve is more or less constant for all shear rates (see panel c). The inset in panel (c) is for shear rate 0.003. The legend in panel (b) applies to panels (a–c). Panel (d) plots the steady-state reduced area and the decay rate  $k_2$ (inset) coming from the fitting data in panel (a).

Since the starting configuration is nearly circular, the reduced area decreases from an initial value close to  $1$ and tends to a steady-state value
 $A^{*}_{\infty }$. The data in figure 3(a) are fit to the model
 $A^{*} = A^{*}_{\infty } + a_1 \exp (-k_1t) + a_2 \exp (-k_2t),$
 $0 < k_2 < k_1$. Figure 3(d) shows that
 $A^{*}_{\infty }$ decreases with the shear rate. The JP vesicle achieves a steady-state reduced area earlier when the shear rate is low, but the decay rate
 $k_2$ is more or less constant for higher shearer rates (inset).
The time courses contain oscillations due to the granularity of the JP vesicle. The curve for  $\chi = 0.003$ in figure 3(a), for example, has a low-frequency oscillation with a period around
 $0.7\,\mathrm {\mu }$s, and a high-frequency oscillation with a period four times smaller. The JP vesicle is somewhat hexagonal (see, e.g. figure 4a) and the low-frequency oscillations corresponds to the tank-treading of a polygon, rather than smooth, curve. The higher frequency oscillations come from the tank-treading of individual particles, that is they correspond to the rate of passage of particles through a fixed-angle axis about the vesicle centre. The inset of figure 3(c) zooms-in on the arclength data for the shear rate
 $\chi = 0.003$. It shows that the curves are smooth and well-resolved by our second-order Adams–Bashforth scheme.
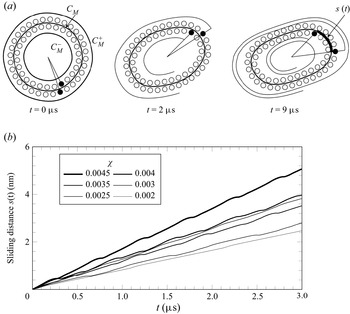
Intermonolayer slip is present in the JP vesicle tank-treading motion at all shear rates. Panel (a) tracks a pair of particles (filled circles). The shear rate is  $\chi =0.005$ and in the right figure, the particle in the outer monolayer will complete two and a quarter revolutions in the same time the particle in the inner monolayer completes two revolutions. The curves in panel (b) are the distance the outer leaflet has slid past the inner leaflet. The slopes of the curves give the slip velocity. Slip velocity is generally monotonic in the shear rate. The case
 $\chi = 0.003$ is an exception.

We point out that the range of values for  $\chi$ where we measured for tank-treading correspond to shear rates
 $\dot \gamma = O(10^{6}$ s
 $^{-1}$) which gives fluid velocities
 $O$(m s
 $^{-1}$) in the vicinity of the vesicle. While large, these orders of magnitude are identical to ones used in prior molecular dynamics (MD) studies (Brandner et al. Reference Brandner, Timr, Melchionna, Derreumaux, Baaden and Sterpone2019) and are a consequence of the fact that large shear rates are required to produce the viscous stresses needed to appreciably deform small vesicles.
4.2.2. Intermonolayer friction
We observe intermonolayer slip in the tank-treading, JP vesicle at all shear rates. Since they are not bound, the two leaflets of the vesicle are able to slide past one another. Monolayer slip effects have been incorporated in continuum models (Schwalbe, Vlahovska & Miksis Reference Schwalbe, Vlahovska and Miksis2010). In the present setting, slip is limited by viscous friction of the aqueous gaps between particles and by the constant unbinding and binding of particle pairs in apposing leaflets.
Figure 4(a) illustrates intermonolayer slip by tracking the distances travelled by a pair of particles along the midplane curve. In the left-hand image, two particles indicated by filled circles lie next to each other. In the right-hand image, the particle in the outer monolayer has travelled farther than the particle in the inner monolayer. This suggests that the outer tangential velocity, obtained by projecting the velocity of the outer leaflet onto the midplane curve, is larger than that of the inner leaflet (see supplementary movie 3).
From the data, we obtain an intermonolayer friction coefficient
 \begin{equation} b = \frac{\langle F \rangle}{\langle L U \rangle} , \end{equation}
where  $F$ is the tangential force jump,
 $L$ is the length of the midplane
 $C_M$ (figure 4a) and
 $U$ is the slip velocity. The time average
 $\langle \boldsymbol {\cdot } \rangle$ is taken over the intervals where
 $U$ lies in the 10th percentile of positive slip velocities.
The tangential force jump  $F$ equals the tangential shear force on the outer leaflet minus the tangential shear force on the inner leaflet. To calculate
 $F$, we first let
 \begin{equation} F_h = \int_{\mathcal{C}_M^{+}} \boldsymbol{\tau} \boldsymbol{\cdot} \sigma \boldsymbol{\cdot} \boldsymbol{\nu} \,\mathrm{d} s - \int_{\mathcal{C}_M^{-}} \boldsymbol{\tau} \boldsymbol{\cdot} \sigma \boldsymbol{\cdot} \boldsymbol{\nu} \,\mathrm{d} s, \end{equation}
where  $C_M^{+}$ and
 $C_M^{-}$ are target curves obtained by projecting the midplane curve
 $C_M$ a distance
 $h$ outward (respectively, inward) along its unit normal vector field (figure 4a). We sample
 $F_h$ for
 $h = {\pm }1.3, {\pm }1.5, {\pm }1.7, {\pm }1.9$ times the particle radius and define
 $F$ by extrapolating to zero distance. This avoids integrating along a curve passing directly through the particles.
To calculate  $U$, we let
 $u_+(\boldsymbol {x})$ and
 $u_-(\boldsymbol {x})$ be the tangential velocity of the outer (respectively, inner) leaflet. Then
 \begin{equation} U = \frac{1}{L}\int_{C_M}\left(u_+(\boldsymbol{x})(1 - \delta \kappa) - u_-(\boldsymbol{x})(1 + \delta \kappa)\right) \, {\rm d}s, \end{equation}
where  $\delta$ is the distance from the leaflet centres to the midplane and
 $\kappa$ is the curvature. The factors
 $\pm \delta \kappa$ are needed to project the leaflet velocities, defined on the particle centres, onto the midplane curve. Finally, the function
 $s(t) = \int _0^{t} \,{\rm d}U$ records the distance one leaflet has slid past the other. Figure 4(b) plots the sliding distance for various shear rates.
Table 1 provides a series of numerical friction coefficients  $b$ and the baseline number of particles is
 $N_b = 58$. With the fixed total length of the JP vesicle, we change parameters related to the length scale, for instances,
 $\rho$,
 $\rho _0$ and the radius of particles. With
 $-5\,\%$,
 $5\,\%$ and
 $10\,\%$ adjustments in these parameters, the resulting numbers of particles are
 $N_b=\{61,56,53\}$, respectively. The trends in table 1 suggest that
 $b$ decreases with decreasing
 $\rho$,
 $\rho _0$ and particle radius. Overall, the values for
 $b$ are in good quantitative agreement with values previously reported in the literature. Atomistic studies have also considered intermonolayer slip in lipid bilayers. Wohlert & Edholm (Reference Wohlert and Edholm2006) and den Otter & Shkulipa (Reference den Otter and Shkulipa2007) reported
 $b = 0.7 \times 10^{6}$ Pa m
 $^{-1}$ s
 $=0.7$ pN ns nm
 $^{-3}$ and
 $b = 2.4$ pN ns nm
 $^{-3}$ for dipalmitoylphosphatidylcholine (known as DPPC) membranes simulated by MD, respectively. Using a more recent version of the Martini force field, Zgorski, Pastor & Lyman (Reference Zgorski, Pastor and Lyman2019) gives
 $b = 5.5$ pN ns nm
 $^{-3}$ for shear rates 0.4 ns
 $^{-1}$ and higher. It is understandable that there is uncertainty in the friction coefficients of table 1. The scatter in our data, however, is fully consistent with that calculated from MD simulations, cf. the transient rise in values of table 1 and in Zgorski et al. (Reference Zgorski, Pastor and Lyman2019, figure 10) for low shear rates.
Friction coefficients  $b$ (pN ns nm
 $^{-3}$).

4.2.3. Membrane ruptures
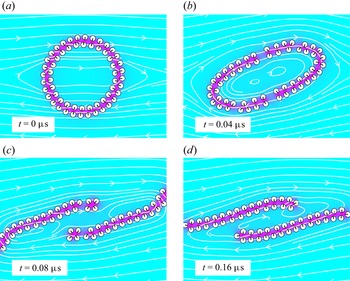
A temporary fissure or a complete membrane rupture can occur at large shear rates. Figure 5 demonstrates how a vesicle can rupture when suspended in a shear flow. For  $\chi = 0.1$, starting with a circular shape (figure 5a), the vesicle is stretched by the background flow and fissures appear in the bilayer structure in multiple locations (figure 5b). In figure 5(c), the ruptured vesicles form two planar micelles which are eventually carried off by the flow (figure 5d). An empirical numerical study found that for the baseline parameter set, the dimensionless, critical shear rate is
 $\chi _*=0.0655$ so that the membrane ruptured whenever
 $\chi > \chi _*$ and did not rupture whenever
 $\chi < \chi _*.$ Supplementary materials movie 4 shows the membrane rupture at the critical shear rate. To further quantify the competition between shear and attraction, we found that a
 $5\,\%$ relative increase in the parameters
 $\gamma$ and
 $M$ resulted in a
 $4.24\,\%$ relative increase in
 $\chi _*$, from
 $0.0655$ to
 $0.0688$. A
 $5\,\%$ decrease in the particle radius
 $c$, screening length
 $\rho$ gave a
 $-9.55\,\%$ decrease,
 $5.0\,\%$ increase, respectively, in
 $\chi _*$. Finally, a
 $10\,\%$ increase in resting length
 $L_0$ gave a
 $20.61\,\%$ decrease in critical shear rate
 $\chi _*$. These relative changes suggest that there is dimensionless number
 $K$ given by
 \begin{equation} \mu \dot\gamma_* = K \frac{\gamma c^{2}}{\rho L^{2}} \end{equation}
that relates hydrophobic attraction to the dimensional critical shear rate  $\dot \gamma _* = \chi _*\,\text {ns}^{-1}$. Assuming a characteristic velocity
 $L\dot \gamma _*$, the number
 $K$ relates to the vesicle's capillary number
 ${Ca} = K c^{2}/(\rho L)$. Based on the above data,
 ${Ca}$ would be approximately
 $1.8$ so that surface forces are comparable to viscous forces. There is a related elastic capillary number
 $\widetilde {{Ca}} = \mu \dot {\gamma } R_0^{3}/K_B$ used to characterize rheological properties of lipid bilayer membranes where
 $R_0$ is vesicle radius
 $K_B$ is bending rigidity (Vlahovska, Podgorski & Misbah Reference Vlahovska, Podgorski and Misbah2009; Keller & Skalak Reference Keller and Skalak1982). Setting
 ${Ca}$ and
 $\widetilde {{Ca}}^{\vphantom{1}}$ equal, we can derive
 \begin{equation} K_B = \frac{\mu \dot \gamma_* R_0^{3}}{{Ca}} \end{equation}
which yields  $K_B \approx 100$ pN
 $\text {nm}$. Albeit somewhat large, the resulting bending modulus is reasonable considering the assumptions made.
Tank-treading leads to membrane rupture for large shear rates.

4.2.4. Vesicle in a parabolic flow
Finally, we consider the parabolic background flow
 \begin{equation} \boldsymbol{u}_\infty = v_{max}\left[ 1 - \left( \frac{\boldsymbol{x} \boldsymbol{\cdot} \boldsymbol{e}_y}{wR_0}\right)^{2} \right]\boldsymbol{e}_x, \end{equation}
where  $v_{max}$ is the flow strength. The parameter
 $R_0$ is the radius of the JP vesicle at
 $t=0$ and
 $w$ sets the width of the profile. Kaoui, Biros & Misbah (Reference Kaoui, Biros and Misbah2009), Coupier et al. (Reference Coupier, Kaoui, Pokgorski and Misbah2008) and Danker, Vlahovska & Misbah (Reference Danker, Vlahovska and Misbah2009) have shown that the behaviour of a vesicle in this unbounded flow includes vertical migration, and depending on the flow rate and reduced area, the steady-state shape can be either a symmetric parachute or an asymmetric slipper.
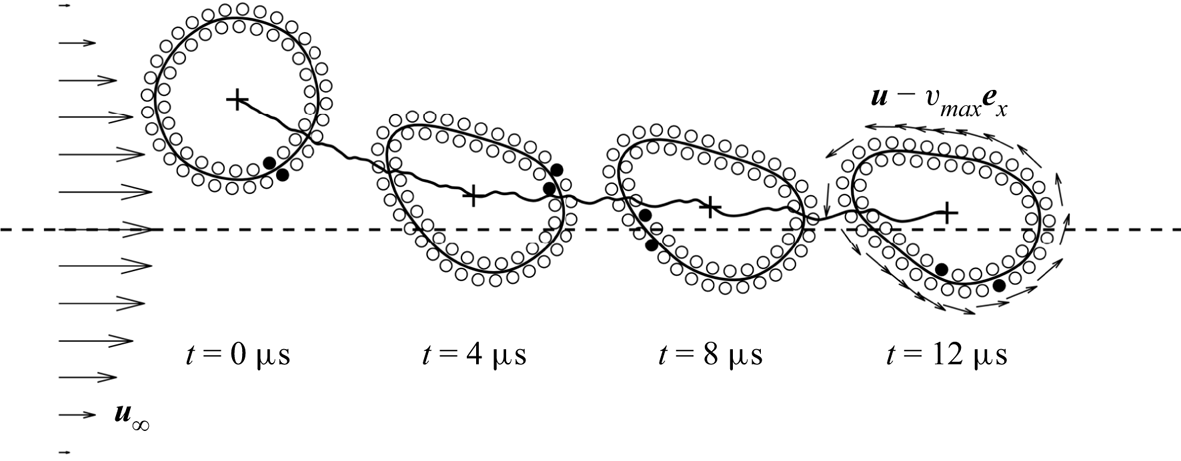
Figure 6 shows four configurations for one specific case where the centroid of the JP vesicle is initially placed slightly above the  $x$-axis. We have marked a pair of particles (filled circles) in the inner and outer leaflets, respectively, and observe that the deformed JP vesicle (figure 6,
 $t = 12\,\mathrm {\mu }$s) has an anticlockwise movement and the shape of the vesicle approaches an asymmetric slipper shape. For this test, the reduced area in the final configuration is approximately
 $0.9$ which matches the previous numerical tests in Kaoui et al. (Reference Kaoui, Biros and Misbah2009) where a slipper-like shape occurs when the flow velocity is weak and the reduced area is large. The flow causes the vesicle, which is initially placed above the axis, to drift downward where it reaches a steady height of approximately
 $1$ nm.
A JP vesicle placed in a parabolic flow drifts towards the central axis. It assumes a slipper shape and undergoes tank-treading motion as in the shear flow case. The horizontal dashed line represents time in units of  $\mathrm {\mu }$s and the vertical axis represents the scaled
 $y$-position of the centroid of the JP vesicle. The arrows on the left-hand side illustrate the background flow and the arrows on the right-hand side show the velocity relative to the vesicle's moving frame. The thick black curve plots the distance from the axis as a function of time from left to right. The parameters are
 $v_{max} = 8$ nm ns
 $^{-1}$,
 $w=10$ and
 $R_0=17$ nm.

4.3. Stretching and permeability
In this section, we consider a circular JP vesicle suspended in a quiescent flow  $\boldsymbol {u}_{\infty } = 0$. We show that the JP particle bilayer behaves as an inextensible, permeable membrane with the inextensibility coming from a large stretching modulus.
In membrane continuum mechanics, changes in membrane surface area  $A$ give rise to a tension
 $\tilde \sigma = K_A(A/A_0 - 1)$ where
 $A_0$ is the reference surface area (Nagle & Tristram-Nagle Reference Nagle and Tristram-Nagle2000). For a two-dimensional membrane, the tension is
 \begin{equation} \tilde \sigma = K_A\left(L/L_0 - 1 \right), \end{equation}
where  $L$ and
 $L_0$ are arclength and resting length, respectively. Membrane tension gives rise to a Laplace pressure
 \begin{equation} \Delta p = \tilde \sigma/R, \end{equation}
where  $\Delta p$ is the jump in far-field pressure to internal pressure and
 $R = L/2{\rm \pi}$. In order to relieve Laplace pressure, water flows across the membrane. The rate of efflux is governed by
 \begin{equation} \frac{\mathrm{d} A}{\mathrm{d} t} ={-} P\Delta p, \end{equation}
where  $P = K/(\mu \Delta x)$ is a constant,
 $K$ is hydraulic permeability,
 $\mu$ is the solvent viscosity and
 $\Delta x$ is the membrane thickness, approximately 5 nm (Chabanon et al. Reference Chabanon, Ho, Liedberg, Parikh and Rangamani2017; Quaife et al. Reference Quaife, Gannon and Young2021).
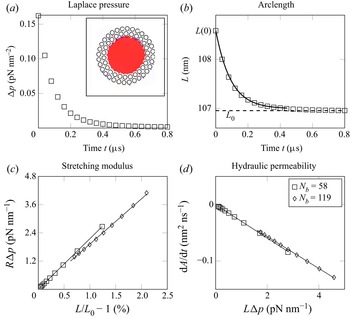
Our simulation set-up consists of an initial, non-equilibrium JP vesicle obtained by dilating the equilibrium shape outward (figure 7a). At  $t = 0$, pressure (2.1) is spatially constant inside and outside the vesicle (figure 7a, inset) and Laplace pressure decreases to zero exponentially (figure 7a, squares). At the same time, the arclength decreases from its initial value
 $L(0)$ to its resting length
 $L_0$ (figure 7b).
Tension and pressure relax as fluid is expelled through the particle interstices. In panel (a), inset, pressure is spatially constant inside the JP vesicle (inset) and Laplace pressure (panel a, squares) and excess length (panel b, squares) dissipate exponentially. The data in panels (b,c) show a linear relationship expressed by (4.9) and (4.10).

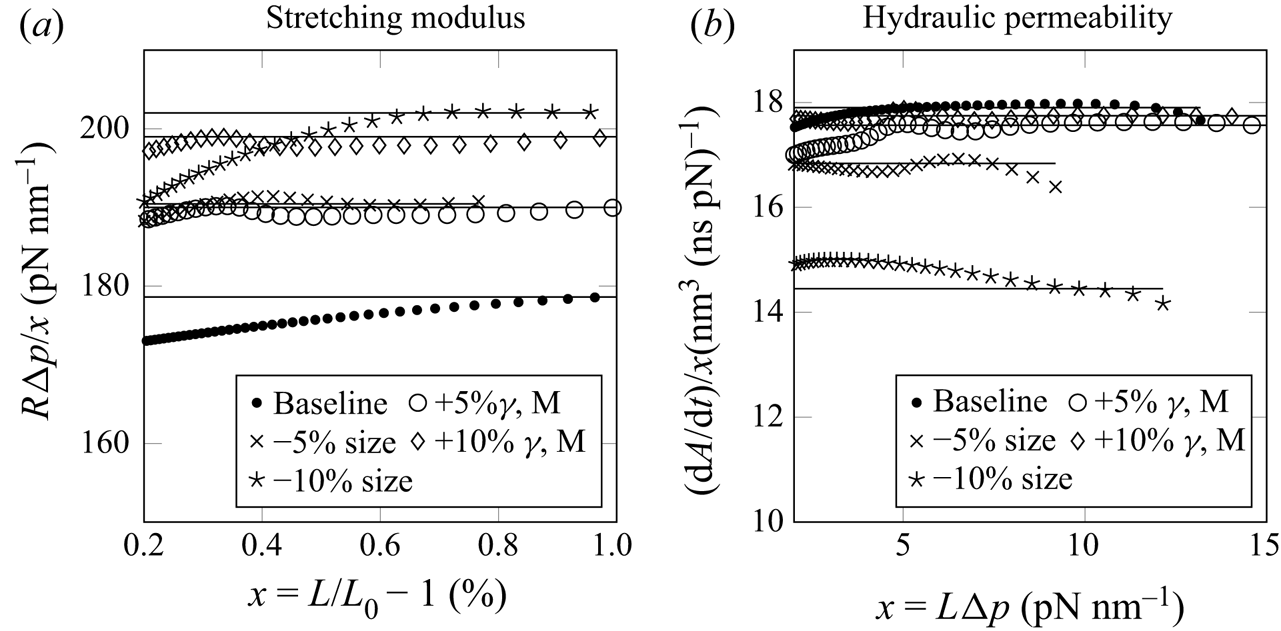
To evaluate whether JP vesicles possess a stretching modulus, figure 7(c) plots  $R \Delta p$ against the excess length
 $L/L_0 - 1$. The squares are for the baseline simulation with vesicle diameter approximately 34 nm. The diamonds are for a vesicle with twice the diameter. The linear relationships are independent of vesicle size and give an area modulus
 $K_A = 170 \pm 9$ pN nm
 $^{-1}$. This relatively large stretching modulus is the reason why the JP vesicle conserves length in the shear-flow simulations (figure 7c). The value also reasonably agrees with stretching moduli for lipid bilayers, around
 $240$ pN nm
 $^{-1}$ (Nagle & Tristram-Nagle Reference Nagle and Tristram-Nagle2000).
In the initial, dilated vesicle, contractile motion is limited by the incompressibility of the fluid bound by the vesicle. Hence, the Laplace pressure comes from an excess in interparticle separation. The vesicle-bound water, however, can escape through the gaps between the particles and this is how the JP vesicle relieves Laplace pressure over time (figure 7a).
To evaluate the rate of water outflow, figure 7(d) plots the simulation values for  $\mathrm {d} A/\mathrm {d} t$. These values are proportional to
 $L\Delta p$ and like for the stretching modulus, the proportionality constants are independent of vesicle size. The linear fits give a hydraulic permeability with
 $P = 0.0290 \pm 0.007$ nm
 $^{3}$ ns
 $^{-1}$ pN
 $^{-1}$. We can combine (4.8), (4.9) and (4.10) to derive
 \begin{equation} L_0(L-L(0)) + L_0^{2} \ln\left|\frac{L-L_0}{L(0)-L_0}\right| ={-}4{\rm \pi}^{2} P K_A t. \end{equation}
Using the fitted values for  $P$ and
 $K_A$, the theoretical time course for (4.11) (figure 7b, solid curve) is in good agreement with the JP data (figure 7b, squares).
Our value for permeability disagrees with permeabilities for lipid bilayers by a few orders of magnitude (Chabanon et al. Reference Chabanon, Ho, Liedberg, Parikh and Rangamani2017; Quaife et al. Reference Quaife, Gannon and Young2021). Potential reasons for this include the following. Our two-dimensional simulations correspond to water flowing past a collection of parallel cylinders, which has a larger permeability than for a collection of spheres of comparable radius. Second, permeability vanishes with interparticle separation. However, in our simulations, interparticle separation is intentionally made comparable to particle radius to avoid aggressive mesh refinement.
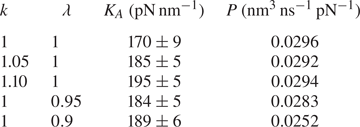
We performed a parametric study of the dependence of  $K_A$ and
 $P$ on model parameters taking into account (i) changes in interfacial strength and (ii) changes in size. Table 2 provides the results of stretching moduli
 $K_A$ and permeabilities
 $P$ for various cases. The baseline set-up is shown in the first row. The next two rows demonstrate the results when the force parameters
 $\gamma$ and
 $M$ are increased by 5 % and 10 %. The parameter
 $k$ is used to scale the force parameters
 $\gamma, M \to k\gamma, kM$. The final two rows show the results for the cases where the length scale related parameters are decreased by 5 % and 10 %. The parameter
 $\lambda$ is used to simultaneously scale length parameters;
 $\rho, \rho _0, c \to \lambda \rho, \lambda \rho _0, \lambda c$. The data comes from figure 8 which plots the ratio of the abscissa and ordinates used in figure 7(c,d). The transformed data are fit by constant functions.
Stretching moduli and permeabilities.

The ratios of the abscissa and ordinates from figure 7(c,d) are well-fitted by constant functions (baseline, dots). The open circles and diamonds are for  $\gamma$ and
 $M$ increased by 5 % and 10 %, respectively. The crosses and stars are for particle radius,
 $\rho$ and
 $\rho _0$ decreased by 5 % and 10 %, respectively. The variable
 $x$ is used to denote the horizontal axis coordinate.

Increases in  $\gamma$ and
 $M$ result in a commensurate increase in the stretching modulus. Permeability, however, is insensitive to simultaneous increases in
 $\gamma$ and
 $M$. To give a detailed explanation for this, the JP system has the potential energy
 $E = G + H$ where
 \begin{equation} G = \gamma \int_{\varOmega} \rho |\boldsymbol{\nabla} \eta |^{2} + \rho^{{-}1} \eta ^{2} \,\mathrm{d}\boldsymbol{x},\quad H = M \sum_{i=1}^{N_b}\sum_{j \neq i} P\left(\frac{|\tilde{\boldsymbol{x}}_i - \tilde{\boldsymbol{x}}_j|}{\rho_0}\right). \end{equation}
Here,  $G$ is the HAP for the boundary value problem (2.7)–(2.9), and
 $H$ is the repulsion potential. For the circular vesicle, total energy depends only on the characteristic interparticle distance
 $x$ and has a minimum at
 $x_0$. If
 $\gamma$ and
 $M$ are scaled by a parameter
 $k$, we can relate the scaled energy to that of the baseline case by
 \begin{equation} E_k(x) = k(G(x) + H(x)). \end{equation}
Permeability does not change with like increases in  $\gamma$ and
 $M$ because the critical number for
 $E_k$, and hence interparticle separations, are independent to
 $k$. The stretching modulus comes from
 ${{\rm d}^{2}E_k}/{{{\rm d} x}^{2}}$ and this quantity varies proportionally with
 $k$.
One can observe that  $K_A$ increases and
 $P$ decreases as the length scale decreases. The decrease in
 $P$ is expected because the size of the gap between adjacent JP particles is directly proportional to length scale. To give a more detailed account, pressure
 $p$ and water flux across the membrane
 $q$ scale as
 $p_{\lambda }(\boldsymbol {x}) = \lambda ^{-1} p(\boldsymbol {x}/\lambda )$ and
 $q_{\lambda }(\boldsymbol {x}) = q(\boldsymbol {x}/\lambda )$ when
 $l_0$ is scaled by
 $\lambda$. As a result, the scaled permeability constant satisfies
 \begin{equation} P_{\lambda} = q_{\lambda}/\Delta p_{\lambda} = q/(\lambda^{{-}1} \Delta p) = \lambda P. \end{equation}
For the stretching modulus, the total energy transforms as
 \begin{equation} E_{\lambda}(x) = \lambda G(x/\lambda) + H(x/\lambda ). \end{equation}
The factor  $\lambda$ comes from the change of variables formula for the integral in (4.12a,b). The stretching modulus increases because
 ${{\rm d}^{2}E_{\lambda }}/{{{\rm d} x}^{2}}$ increases with decreases in
 $\lambda.$
4.4. Two vesicles in a linear flow
4.4.1. Shear flow
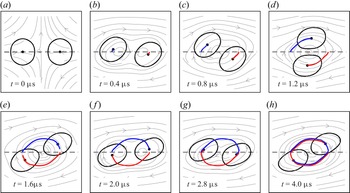
Finally, we can study vesicle–vesicle interactions in background flows. Figure 9 shows the simulation of two JP vesicles suspended in a shear flow with shear rate  $\chi =0.005$. We duplicate the prerelaxed
 $58$-body JP vesicle from previous sections and construct the initial configuration shown in figure 9(a). The two centroids are at coordinates
 $(-25,0)$ and
 $(25,0)$ in nanometres. In all panels, the blue and red curves show the trajectory of the two JP vesicle centroids. They have nearly completed a full period by
 $t=4\,\mathrm {\mu }$s.
Two JP vesicles suspended in a shear flow interact by orbiting about the origin. The moving paths of the two centroids are plotted in blue and red. The centroids are initially located on the  $x$-axis. The fluid velocity streamlines are for the dimensionless shear rate
 $\chi =0.005$.

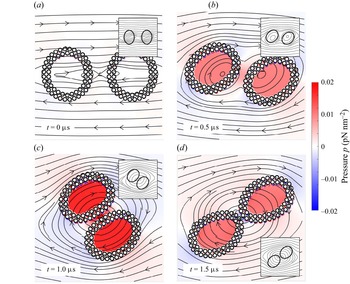
We show snapshots of the fluid pressure in figure 10. Supplementary movie 5 shows the overall vesicle interaction. Since the initial JP vesicles are prerelaxed, there is initially no pressure jump between the internal and external fluids (figure 10a). Figure 10(b–d) show the configurations when  $t = \{0.5,1,1.5\}\,\mathrm {\mu }$s, and the streamlines are plotted in the background for all panels. We include the numerical results from a continuum model in all insets and these comparisons give a qualitative agreement between two models. We also observe an adhesive effect between the two JP vesicles that is set up by the hydrophobic attraction (figure 10c). Similar dynamics have been observed between a pair of adhering vesicles in a shear flow (Quaife et al. Reference Quaife, Veerapaneni and Young2019; Abbasi et al. Reference Abbasi, Farutin, Ez-Zahraouy, Benyoussef and Misbah2021). This adhesive behaviour is absent when two JP vesicles are well-separated.
The figure is for the same simulation as in figure 9, but also plots the fluid pressure  $p$. The colourbar is identical for all panels. Internal pressure is initially zero, but then grows as the vesicles come close to contact (see panel c). The insets are generated from simulations of a continuum model of the vesicles (Quaife et al. Reference Quaife, Veerapaneni and Young2019). The streamlines of the two models are in agreement.

4.4.2. Extensional flow
Using a similar set-up to the shear flow case, we suspend the same two, prerelaxed,  $58$-body JP vesicles and consider their dynamics in an extensional flow
 \begin{equation} \boldsymbol{u}_{\infty}(\boldsymbol{x}) = \dot \gamma (-(\boldsymbol{e}_x \boldsymbol{\cdot} \boldsymbol{x})\boldsymbol{e}_x + (\boldsymbol{e}_y \boldsymbol{\cdot} \boldsymbol{x})\boldsymbol{e}_y) \end{equation}
with extensional rate  $\dot \gamma =0.005$ ns
 $^{-1}$. This extensional flow is stretching in the
 $y$-direction and squeezing in the
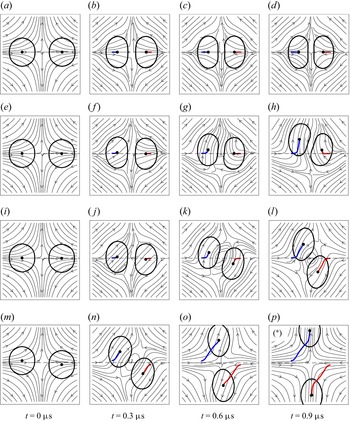
 $x$-direction. Figure 11 shows how the initial placement of the JP vesicles affects the dynamics. When two centroids are both placed symmetrically on the
 $x$-axis (figure 11a–d), the JP vesicles come into contact and reach a steady equilibrium. If one centroid is placed above the
 $x$-axis (figure 11e–h), the two JP vesicle move together and then upward. The migration of the right JP vesicle is a consequence of the adhesive effect caused by the hydrophobic interactions. When the two centroids start on opposite sides of the
 $x$-axis (figure 11i–l), they eventually diverge from one another along the
 $\pm y$-directions. Finally, when the two centroids start on opposite sides of the
 $x$-axis, but with a greater displacement (figure 11m–p), the JP vesicles move much faster along the
 $\pm y$-directions (see supplementary movie 6).
The initial placement of two JP vesicles suspended in an extensional flow affects the long-time dynamics. The moving paths of the two centroids are plotted in blue in red. Each row corresponds to a different initial placement of the JP vesicles. (a–d) Both JP vesicle centroids are on the  $x$-axis. (e–f) The centroid of the left-hand JP vesicle is
 $0.25$ nm above the
 $x$-axis and the right-hand JP vesicle is on the
 $x$-axis. (i–l) The centroid of the left-hand JP vesicle is
 $0.25$ nm above the
 $x$-axis and the right-hand JP vesicle is
 $0.25$ nm below the
 $x$-axis. (m–p) The centroid of the left-hand JP vesicle is
 $1.25$ nm above the
 $x$-axis and the centroid of the right-hand JP vesicle is
 $1.25$ nm below the
 $x$-axis. The streamlines are for the flow rate
 $\dot \gamma =0.005$ ns
 $^{-1}$ in all cases.

Figure 12 shows numerical results when the centroids of the two Janus particles are placed at  $(-10,-0.1)$ and
 $(10,0.1)$ nanometres (figure 11i–l). With this set-up, the two JP vesicles eventually separate along the
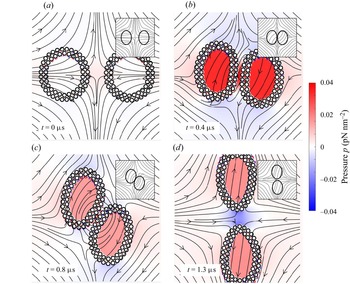
 ${\pm }y$-directions and we compare the results against a continuum model as shown in all insets. Figure 12(b–d) show the transient behaviour of the JP vesicles and the continuum vesicles under an extensional flow. In both the coarse-grained model and the continuum model, the vesicles initially approach one other and then diverge along the
 $y$-axis. The behaviour of the streamlines in both cases are similar. The pressure is initially largest in the gap formed by two JP vesicles and decreases during the separation. The short-range repulsion plays an important role to avoid particle collisions.
The figure is for the simulation case of figure 11(i–l), and additionally plots the pressure  $p$. The colourbar is shared by all panels. The insets of all panels are generated from simulations of a continuum model of the vesicles and the streamlines agree between the two models.

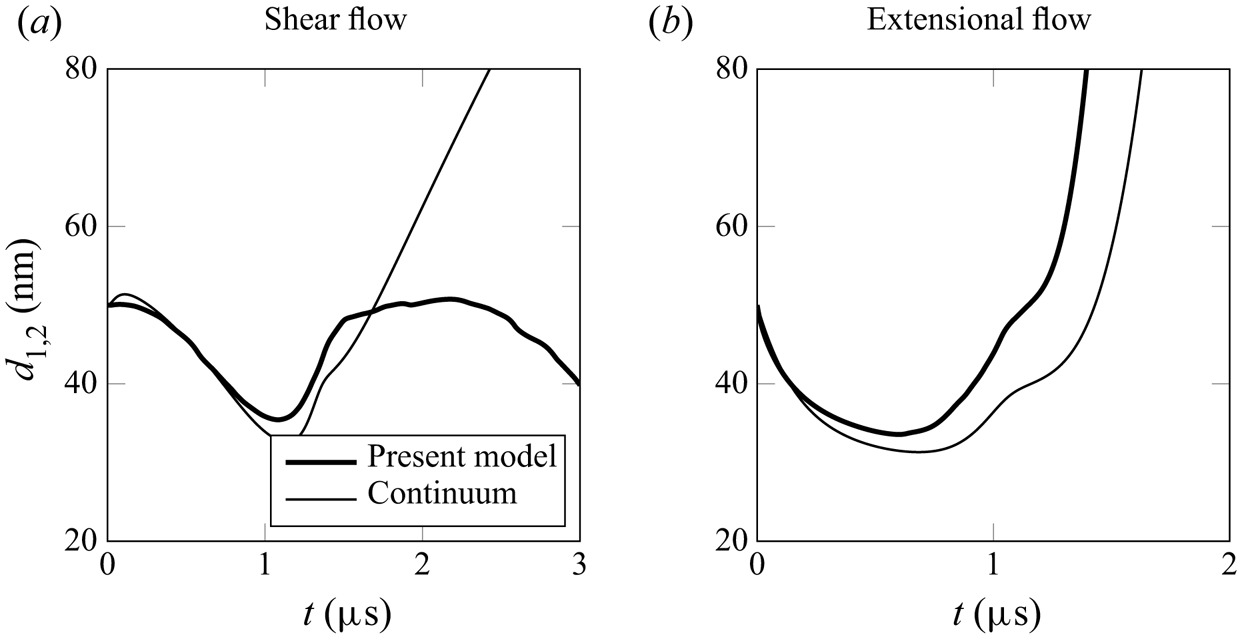
The behaviour of the suspended JP vesicles has similarities to the numerical results generated by using the algorithm adopted in Quaife et al. (Reference Quaife, Veerapaneni and Young2019) (refer to all figure insets in figures 10 and 12). Figure 13 shows trajectory comparisons between the proposed model and the continuum modelling for both shear flow and extensional flow cases in two vesicle simulations. The quantity  $d_{1,2}$ represents the distance between two centroids of JP vesicles. The initial centroid positions are identical for both models and the geometry in the continuum model is created along the midplane locations of JP vesicles and the initial reduced area is matched. Figure 13(a) shows that the results of continuum model does not have a periodic motion and two vesicles flow apart after 1.5
 $\mathrm {\mu }$s. Figure 13(b) shows that the results of the continuum model have a similar trend as the proposed model.
Comparisons between the proposed HAP model and a continuum model for two vesicles in shear flow and in extensional flow. The value  $d_{1,2}$ is the distance between two centroids of JP vesicles. The thin curves plot the trajectories of
 $d_{1,2}$ generated by the continuum model and the thick curves are computed using the proposed HAP model.

5. Conclusion
Fu et al. (Reference Fu, Ryham, Klöckner, Wala, Jiang and Young2020) developed a mathematical model to quantify the macroscopic assembly and mechanics of a JP vesicle in a viscous solvent. The interactions between JP are formulated as a second-kind integral equation, which is coupled to the Stokes equations for the surrounding incompressible fluid at the zero-Reynolds-number limit. Numerical simulations of a JP suspension revealed self-assembly of JP into micelles and bilayers, providing an alternative means for computing mechanical moduli, which often requires the knowledge of an equation of state from experiments on a colloidal membrane (Balchunas et al. Reference Balchunas, Cabanas, Zakhary, Gibaud, Fraden, Sharma, Hagan and Dogic2019). Results in this work show great potential for the study of Janus colloids (Bradley et al. Reference Bradley, Chen, Stebe and Lee2017; Mallory et al. Reference Mallory, Alarcon, Cacciuto and Valeriani2017) and the morphology of colloid surfactants (Bradley, Stebe & Lee Reference Bradley, Stebe and Lee2016). For example, with the flexibility of the model, we can specify the boundary condition on JP surfaces based on the chemicals used in experiments.
In the present study, we used this integral formulation and numerical algorithm to simulate the hydrodynamics of JP vesicles in background flows. Under a linear shear flow, we found a JP vesicle to exhibit elongation and tank-treading dynamics observed for a lipid bilayer giant unilamellar vesicles (GUVs). The results showed that the reduced area  $A^{*}$ decreases with shear rate but that the total length is conserved. The decay rate of the reduced area was independent of the shear rate values. Moreover, the proposed model describes membrane rupture in high shear rates. Therefore, our method can be applied to vesicles undergoing topological changes which is difficult to simulate when using a continuum model that represents vesicles as closed and continuous curves.
We estimated the intermonolayer friction  $b$, membrane permeability constant
 $P$ and the membrane stretching modulus
 $K_A$. The intermonolayer friction coefficient was determined by calculating the tangential shear force and slip velocities with respect to the bilayer midplane. The range of friction coefficients agree with values reported by den Otter & Shkulipa (Reference den Otter and Shkulipa2007) in their MD study. The coarse-graining level of the JP vesicle has a larger length scale than molecular dynamics simulations, and future convergence studies will investigate how physical properties like the friction coefficient and membrane permeability depend on the particle shape and size.
We also simulate the spatial migration of a JP vesicle in a parabolic shear flow. Replicating the hydrodynamics of a GUV in a Poiseuille flow (Coupier et al. Reference Coupier, Kaoui, Pokgorski and Misbah2008; Danker et al. Reference Danker, Vlahovska and Misbah2009; Kaoui et al. Reference Kaoui, Biros and Misbah2009), the JP vesicle moves towards the centre of the shear flow. While the initial reduced area of the JP vesicle is  $A^{*} \approx 1$, the equilibrium reduced area is
 $A^{*}=0.9$. For the parameters we used in the simulation, the JP vesicle takes on an asymmetric, ‘slipper’ shape as it settles above the centre of flow and exhibits tank-treading motion. An interesting contrast with continuum results is that the JP vesicle oscillates at a height slightly above the centre of the Poiseuille flow.
We further simulated the hydrodynamics of two JP vesicles, and drew comparisons with simulation results of two vesicles described by the Helfrich continuum model. A comparison of the vesicle shapes and the streamlines demonstrate remarkable similarities. The two overlapping trajectories of the JP vesicles’ centroids in a shear flow evolve as expected when the two centroids are initialized on the same horizontal level. We also observe a rotating behaviour that is present in models involving vesicle adhesion (Quaife et al. Reference Quaife, Veerapaneni and Young2019). The hydrophobic attraction led to this adhesive effect when two JP bilayers are sufficiently close. We also performed several simulations of a pair of JP vesicles suspended in an extensional flow. By varying the initial vertical displacement of the vesicles’ centroids, we can control for divergent trajectories and obtain similar results to the continuum model.
In § 3.3, we derived an alternative integral form for calculating the force and torque to avoid the singular integral evaluation. These alternative integrals allow us to accurately resolve trajectories over long times without having to rely on computationally expensive quadratures.
Our current numerical method does not support a viscosity contrast like that found in (Vlahovska & Gracia Reference Vlahovska and Gracia2007; Veerapaneni et al. Reference Veerapaneni, Young, Vlahovska and Bławzdziewicz2011; Kaoui & Harting Reference Kaoui and Harting2016). The JP vesicle is permeable and the mixture of two different fluids requires the introduction of a contact line between the two phases.
Our future goals include extending the current framework to a three-dimensional JP vesicle system. This will require additional algorithmic implementation including a fast summation method such as the fast multipole method. Other research directions include fluctuating hydrodynamics for Brownian suspensions (Bao et al. Reference Bao, Rachh, Keaveny, Greengard and Donev2018), critical to understanding membrane diffusion, and an analysis of the relationship between particle shape on effective properties. Finally, physically more accurate boundary conditions for the HAP model will allow us to draw comparisons between computational and laboratory experiments.
Supplementary movies
Supplementary and movies are available at https://doi.org/10.1017/jfm.2022.290.
Funding
B.Q. acknowledges support from NSF (grant no. DMS 2012560) and from the Simons Foundation, Mathematics and Physical Sciences-Collaboration Grants for Mathematicians (award no. 527139). Y.-N.Y. acknowledges support from NSF (grant no. DMS 1614863 and 1951600) and Flatiron Institute, part of the Simons Foundation.
Declaration of interests
The authors report no conflict of interest.