As one of the most beloved and well known of the traditional American English regions, the eastern New England dialect (ENE) has long held a prominent place in popular culture and folk linguistic imagination (Figure 1).
Nonrhotic spelling of chowder as observed in the name of a restaurant chain in Boston.

With origins tracing back to the 17th century European settlements of the Massachusetts Bay area, the modern ENE region covers thousands of square miles of New England. Recent studies suggest that a major decline in traditional ENE features is under way in northern New England (Nagy & Irwin, Reference Nagy and Irwin2010; Nagy & Roberts Reference Nagy, Roberts, Schneider, Burridge, Kortmann, Mesthrie and Upton2004; Perry, Reference Perry2013; Stanford, Leddy-Cecere, & Baclawski, Reference Stanford, Leddy-Cecere and Baclawski2012). This rapid shift calls for further investigation, especially considering that this change involves a whole “suite” of phonological features, including nonrhotic speech, intrusive-r, fronted father, fronted start, “broad-a” in bath, and others. To explore these rapid changes in progress and their theoretical implications, we conducted new fieldwork in central New Hampshire with adult speakers across a broad range of ages. We then analyzed the apparent-time results in terms of Sankoff's (Reference Sankoff2013a) notion of “age vectors” and Labov's (Reference Labov2012:267,272) “outward” orientation of the language-learning faculty.
Research questions
We note that prior studies of dialect loss have typically focused on one or two particular features, rather than quantitatively investigating a whole suite of features that are rapidly receding together, as is the case for traditional ENE features in northern New England. Northern New England therefore provides an unusually rich opportunity to address questions about different rates of change for different features and relationships between features. In cases of rapid generational change, are certain types of linguistic variables more resistant to change than others are? When younger generations shift away from traditional regional features, which types of variables change the fastest? Are different variables related to each other in any way? What happens when two of the variables are found within the same syllable? In sum, how exactly does outward orientation work during a major dialect shift?
In addition to these issues, our New Hampshire results also contribute more data toward the growing evidence that young North American speakers are leveling a number of traditional, regionally prominent phonological features, including metropolitan leveling of the Southern Vowel Shift, among others (Chambers, Reference Chambers, Campoy-Hernandez and Conde-Silvestre1999, Reference Chambers and Eble2000; Dodsworth & Kohn, Reference Dodsworth and Kohn2012; Labov, Ash, & Boberg, Reference Labov, Ash and Boberg2006:304; Pantos, Reference Pantos2006; Roberts, Reference Roberts2007; Thomas, Reference Thomas1997).
Outward orientation and age vectors
Labov (Reference Labov2012) argued that each new generation acquires language in a way that is oriented toward the speech community, not the speech of their caregivers. Thus, language learning has an outward orientation:
In some way that is not yet fully understood, children have the capacity to detect at an early age the fact that their parents’ language is not fully representative of the speech community and so is not the proper target for their language learning. (Labov, Reference Labov2012:271)
This perspective is rooted in the well-established principle that children prioritize peer influence over parent influence (Chambers, Reference Chambers2002; Labov, Reference Labov and Shuy1964, Reference Labov1966, Reference Labov1991/1972:304; Weinreich, Labov, & Herzog, Reference Weinreich, Labov, Herzog, Lehmann and Malkiel1968:144–146). However, the notion of outward orientation also accounts for situations where the choices involve other social dimensions, such as families (Hazen, Reference Hazen, Chambers, Trudgill and Schilling-Estes2002) or clans, rather than a simple distinction of parents versus peers. For example, among the Sui people of China (Stanford, Reference Stanford2008), children have an outward orientation in their language learning, toward the local clan as the “proper target,” even when such a choice means that they must disregard the dialect features of one of their parents.
Applied to central New Hampshire, the notion of outward orientation suggests that young generations do not consider their parents’ traditional ENE features to be the proper target of language learning. Young speakers are rejecting the traditional phonological features of older generations, favoring instead a set of leveled, nonregional pronunciations. How exactly are they doing this? As Labov (Reference Labov2012) asked, “What is to be learned?” Each generation must not only identify an appropriate speech community as the target of language learning, but also identify the appropriate degree of change for each variable.
To clarify what is happening in such generational cohorts, we turn to Sankoff's (Reference Sankoff2013a) notion of age vectors. Sankoff suggested, “children observe the age vector in the broader community” (Reference Sankoff2013a:38). Young children become aware of the vector of language change, and then continue the process of change in the same direction. Discussing Montreal French, Sankoff described the general process as follows:
I would argue that children are keen observers of vectors within the speech community, and that by the time they are adolescents, they are well aware of the fact that it is old-fashioned to say, as grandfather does, j'ai parti à huit heures ‘I left at eight o'clock’. (Sankoff, Reference Sankoff2013a:37)
Research on this topic is typically applied to settings involving just one or two dialect features. Studies involving multiple features, such as Labov, Rosenfelder, and Fruehwald (Reference Labov, Rosenfelder and Fruehwald2013) and Thomas (Reference Thomas2010) have provided important progress, but the variables in such studies are not usually all related to a single, unidirectional, major dialect shift. In New Hampshire, by contrast, it turns out that a whole suite of variables is involved in a relatively unified, unidirectional shift away from traditional ENE features. The present study therefore shows how Sankoff's (Reference Sankoff2013a) notion of age vectors can be applied to multiple dialect features moving in the same overall direction at about the same time. In such a case, does each generation shift in all variables equally? Why or why not? Are certain types of linguistic variables more susceptible to change than others?
PRIOR WORK IN NORTHERN NEW ENGLAND
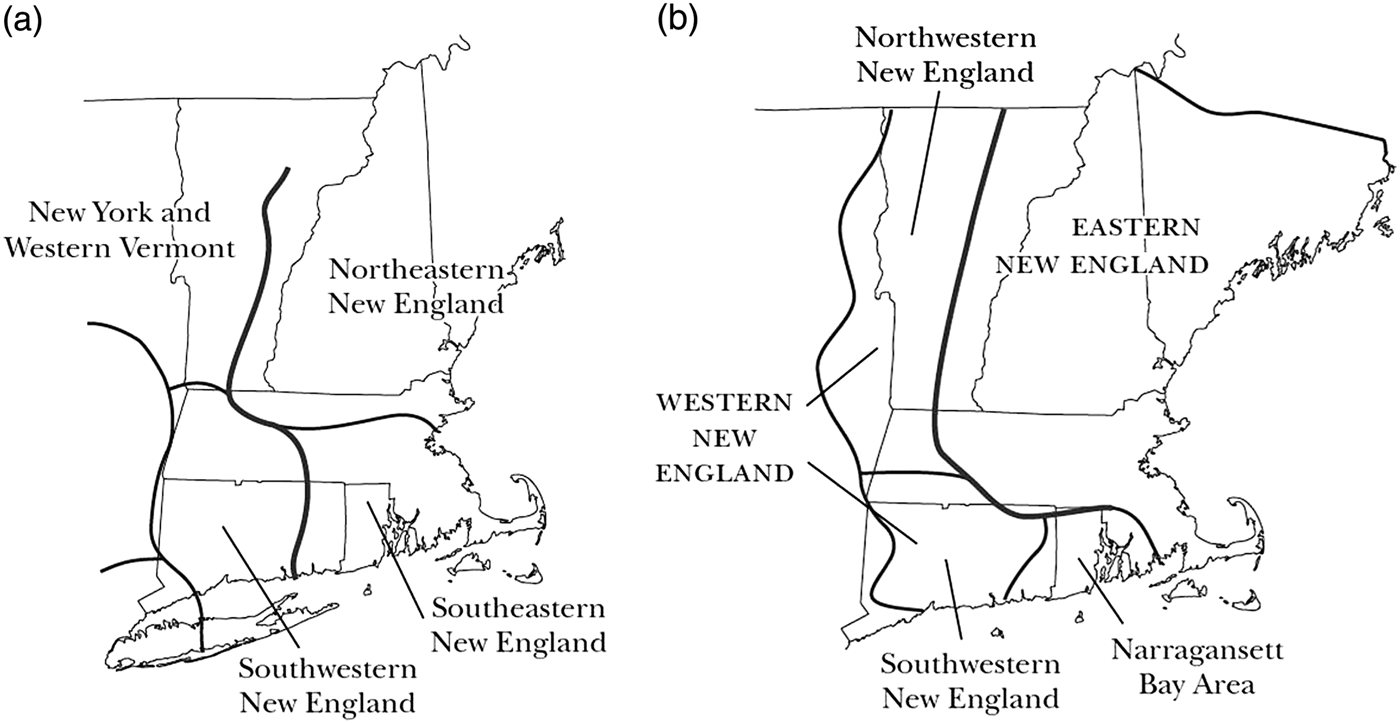
The English-speaking European settlements of central New Hampshire became established in the 1700s (Kurath, Reference Kurath1939:plate 2; Nagy & Irwin, Reference Nagy and Irwin2010:245). Most of the early European settlers in this region had close ties to the Massachusetts Bay, an area characterized by nonrhotic speech and the other features linked to southeast England (Nagy & Irwin, Reference Nagy and Irwin2010:244). Many generations later, the 1931–1933 fieldwork of the Linguistic Atlas of New England (LANE) found strong evidence that those traditional ENE features continued to persist (Kurath, Reference Kurath1939; Kurath, Hanley, Bloch, Lowman, & Hansen, Reference Kurath, Hanley, Bloch, Lowman and Hansen1939–1943). In particular, LANE reported an east-west dialect contrast along Vermont's Green Mountains near the Vermont–New Hampshire border (Figure 2a). Carver (Reference Carver1987) then examined the 1960s lexical data from the Dictionary of American Regional English (Cassidy, Reference Cassidy1985), and he determined that Kurath's east-west contrast continued to endure about one generation after LANE (Figure 2b).
(a) New England subdivisions according to LANE England (Kurath, Reference Kurath1949; Kurath & McDavid, Reference Kurath and McDavid1961, map 2). (b) Eastern and western New England in Carver's (Reference Carver1987:31) analysis of Dictionary of American Regional English. Both maps adapted by Charles Carson and reprinted from Stanford et al. (Reference Stanford, Leddy-Cecere and Baclawski2012) with permission from Duke University Press.
As an example, Figure 3 shows two of the variables from the LANE era that Kurath used in defining a distinction between eastern New England and western New England: rhoticity and fronted father. Note the east-west contrast that differentiated western Vermont from eastern Vermont/New Hampshire/Maine. More recently, The Atlas of North American English (ANAE) (Labov, Ash, & Boberg, Reference Labov, Ash and Boberg2006) reported on a few urban locations in southeastern New Hampshire and western/northwestern Vermont, using telephone survey data collected from 1992 to 1999 (Labov et al., Reference Labov, Ash and Boberg2006:3–4). However, because ANAE focused on cities, the rural areas of New Hampshire were not sampled at that time, including the region of the current study.
Kurath's east-west contrast for rhoticity and fronted father, according to the LANE 1931 to 1933 fieldwork reported in Kurath and McDavid (Reference Kurath and McDavid1961, map 32). Adapted by Charles Carson and reprinted from Stanford et al. (Reference Stanford, Leddy-Cecere and Baclawski2012) with permission from Duke University Press.
Stanford et al.’s (Reference Stanford, Leddy-Cecere and Baclawski2012) research along the Vermont–New Hampshire border showed that Kurath's east-west contrast is shifting eastward for older speakers. Rather than a distinction along the Green Mountains in Vermont, the line of distinction for these older speakers is now roughly along the Connecticut River (state border of Vermont and New Hampshire). For young adults in that study, the traditional ENE features are notably dissipating.
However, that study focused on the east-west New England border region, not farther east into the ENE region itself. Moreover, middle-aged speakers were not examined. Without middle-aged speakers, it is not possible to clearly determine how and when the change is occurring. In the present study, we provide the first acoustic sociophonetic investigation of rural central New Hampshire. Focusing on this rural region that was not sampled by ANAE or Stanford et al. (Reference Stanford, Leddy-Cecere and Baclawski2012), we conducted fieldwork with 51 adults of all ages with the goal of a thorough apparent-time analysis of change in progress in seven traditional ENE features.
METHODS
Seven traditional eastern New England variables
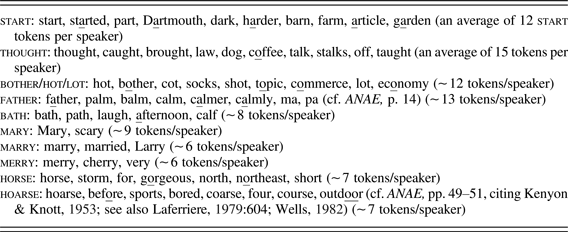
Reviewing prior literature in this dialect region, we selected seven phonological features that have been traditionally recognized as features of eastern New England: nonrhotic speech, intrusive-r, fronted father, fronted start, hoarse/horse distinction, mary/marry/merry distinction, and broad-a in bath (Appendix A).Footnote 1 In choosing these particular variables, we drew from New England descriptions in ANAE (Labov et al., Reference Labov, Ash and Boberg2006:225–232), Boberg (Reference Boberg2001), Dinkin (Reference Dinkin2005, Reference Dinkin2009, Reference Dinkin2011), Johnson (Reference Johnson2010), Kurath (Reference Kurath1939), Kurath and McDavid (Reference Kurath and McDavid1961), Laferriere (Reference Laferriere, Fasold and Shuy1977, Reference Laferriere1979), Madan (Reference Madan2010a, Reference Madan2010b), Nagy and Roberts (Reference Nagy, Roberts, Schneider, Burridge, Kortmann, Mesthrie and Upton2004), Nagy (Reference Nagy2001), Roberts (Reference Roberts2006, Reference Roberts2007), Stanford et al. (Reference Stanford, Leddy-Cecere and Baclawski2012), and Villard (Reference Villard2009).
Any list of dialect features is a simplification. A “dialect region” is a multidimensional construct of features and frequencies, overlapping with other regions in noncategorical ways (Kretzschmar, Reference Kretzschmar2009:66–82). Even so, we find it heuristically useful and theoretically meaningful to focus on seven particular features that have been traditionally associated with ENE.Footnote 2 We chose to study phonological variables rather than lexical variables because, as Carver (Reference Carver1987:21–51) showed (cf. Wolfram & Schilling-Estes, Reference Wolfram and Schilling-Estes2006:118), specific lexical items are susceptible to change even when long-term regional contrasts endure along the same lines.
The interviews
We recorded 51 adult speakers from a broad range of ages (19 to 97 years old), balanced for sex (25 women, 26 men). All speakers were ethnically European American, and all were raised to adulthood in rural towns or farms in the area. Our study focused on the rural central part of New Hampshire, that is, northwest of the city of Concord and east of the Connecticut River valley.Footnote 3 Like Madan (Reference Madan2010a, Reference Madan2010b), we recorded speakers from a variety of small towns in the region. In this way, our results are not limited to just a single town, and we are able to generalize across this rural part of the state. Unlike studies of large urban centers where dialect generalizations in one city can cover millions of people (e.g., ANAE), rural research requires that a handful of nearby towns be analyzed together to achieve meaningful variationist generalizations. This approach was also necessary for practical reasons. Unlike Kurath's era in the early 1930s, we found that many of our speakers had lived in a handful of small towns or farm locations in the local region during their adult lives, making it difficult to find people who had lived in exactly the same small town or farm location for their entire lives. For example, speakers often identified one town where they were born and raised, while noting that they had later moved to another nearby town (or towns) for various work opportunities.
Although we recognize the possibility of micro–regional dialect contrasts, there is solid support for regional homogeneity among these rural towns and farms of central New Hampshire. First, as discussed in the results section, we statistically tested for effects of hometown and found that there were no regional effects in our dataset. Second, dialect geography studies spanning 70+ years in this region (Carver, Reference Carver1987; Kurath, Reference Kurath1949; Kurath et al., Reference Kurath, Hanley, Bloch, Lowman and Hansen1939–1943; Kurath & McDavid, Reference Kurath and McDavid1961; Madan, Reference Madan2010a, Reference Madan2010b; Stanford et al., Reference Stanford, Leddy-Cecere and Baclawski2012) have all placed central New Hampshire (i.e., our entire study region) well within the ENE dialect region (recall Figures 2a and 2b).
Participants for the study were recruited through random contacts in local stores, restaurants, farm stands, town clerk offices, post offices, community events, school offices, and neighborhoods. We approached prospective participants in these settings, explaining that we would like to invite them to participate in a study about people who were raised in the local area. Recorded interviews (approximately 15 to 30 min) consisted of the following activities: (a) a list of 83 words (to be read two times), (b) a reading passage adapted from Nagy's (Reference Nagy2009) “How to Survive a New England Winter,” (c) an additional list of seven sentences (to be read two times), and (d) conversational questions about local attitudes, social changes, and such topics.
The specific interview materials are listed in Appendix B. Participants were recorded with Edirol R-09HR digital recorders. In situations where background noise might be a factor, we used directional (cardioid) Audio Technica lapel external microphones to reduce noise.
Acoustic analyses and normalization
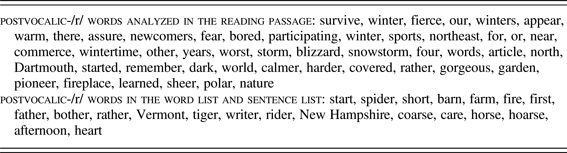
The targeted phonological variables were elicited from the word list, reading passage, and the additional seven sentences, using the words shown in Tables 1 and 2. These styles provide a controlled sample of tokens that can be analyzed consistently between speakers. We used the conversational questions for ethnographic perspectives.
Recorded words used for the acoustic analysis of the traditional eastern New England vowel variables (for polysyllabic words, the relevant vowel is underlined)
Recorded words used in the auditory analysis of postvocalic-/r/ (approximately 90 tokens of postvocalic-/r/ words per speaker)
In designing these activities, we aimed for neutral phonetic environments as much as possible (e.g., Baranowski, Reference Baranowski, Bayley, Cameron and Lucas2013), but we note that our environments are not perfectly controlled. For example, due to the limited number of father words in English, our father analysis includes some differing environments like ma and father. We recognize the possibility that such phonetic environments could influence the vowel results to some extent, but our dataset does not contain enough tokens of each environment for meaningful comparisons on this level. The recorded interview activities were necessarily limited, being unscheduled interruptions in the interviewees’ public workday routines. This study is intended as a broad survey of a whole set of distinctive ENE variables, and we welcome future research that may take the next step by focusing on one or two variables at a higher level of phonetic detail.
For the vowel variables, we followed Labov (Reference Labov2011) and Labov et al. (Reference Labov, Rosenfelder and Fruehwald2013) in using Forced Alignment Vowel Extraction software (FAVE) (Rosenfelder, Fruehwald, Evanini, & Yuan, Reference Rosenfelder, Fruehwald, Evanini and Yuan2011). We recognize that any automated extraction system has limitations. In our case, the automated approach helped us achieve our goal of conducting a relatively large-scale study with limited resources. Labov et al. (Reference Labov, Rosenfelder and Fruehwald2013:34–38) pointed out that FAVE provides a substantial increase in the amount of tokens that can be analyzed and a substantial decrease in the time and personnel resources required. This is especially helpful for relatively large-scale survey projects like the present study. We used FAVE to extract 20,092 vowel tokens in stressed syllables, which is an average of 400 tokens per speaker. This made it possible to obtain vowels representing each speaker's entire vowel space, as required by the normalization procedures to be discussed.
Because the mechanics and methodological justifications of the FAVE system are detailed in Labov et al. (Reference Labov, Rosenfelder and Fruehwald2013), we just provide a summary here. Using the default measurement method provided in FAVE,Footnote 4 vowels are measured at a point that is one-third of the way between the onset and offset (Labov et al., Reference Labov, Rosenfelder and Fruehwald2013, citing Evanini, Reference Evanini2009). However, FAVE has additional measurement criteria for certain vowels: For /ay/ and /ey/, FAVE extracts formants at the maximum point of F1. The /ow/ and /aw/ sounds are measured at the midpoint between the onset and the maximum of F1. Coronal-initial /uw/ is measured at the vowel onset. Finally, for each vowel token, FAVE takes four candidate measurements with different pole settings. FAVE then selects the one best measurement for the given token by means of comparison to the ANAE measurement for the same vowel (Mahalanobis distance).
Although no measurement technique achieves perfect accuracy and consistency, the overall reliability of FAVE is supported by Evanini (Reference Evanini2009) and Evanini, Isard, and Liberman's (Reference Evanini, Isard and Liberman2009) comparisons of different techniques. Using the ANAE recordings, Evanini (Reference Evanini2009:92) and Evanini et al. (Reference Evanini, Isard and Liberman2009) compared manual measurements with their automated measurement methods, which FAVE is based on. Evanini et al. (Reference Evanini, Isard and Liberman2009:3–4) showed that their automated methods achieved an accuracy of vowel classification comparable to the hand measurements in the original ANAE dataset, and they reported that the sociolinguistic analyses resulting from these measurements (in this case, the characteristics of the Northern Cities Vowel Shift) were equivalent to manual approaches. Finally, Labov et al. (Reference Labov, Rosenfelder and Fruehwald2013:38) compared the standard error of the mean in FAVE formant measurements versus manual ANAE measurements.
A full comparison of the reliability of hand extractions versus automated methods goes beyond the scope of the present study. But to confirm that FAVE's measurements were reliable for the purposes of our study, we tested a sample of 10 speakers (one-fifth of our speakers). For this test, we focused on father F2 and start F2 because the bulk of the acoustic discussion in this paper concerns the fronting of those two vowels. For the 10 speakers (5 women, 5 men, randomly selected), a single trained analyst used Praat 5.3 (Boersma & Weenink, Reference Boersma and Weenink2013) to make a hand measurement of F2 of every token that FAVE had measured for father (n = 131) and start (n = 122). For these manual extractions, we followed the ANAE method of locating the “central tendency” by measuring F2 at the point of F1 maximumFootnote 5 (see Labov et al., Reference Labov, Ash and Boberg2006:38, for details of this approach; cf. Thomas, Reference Thomas2011:150). Comparing our manual extractions of F2 with the FAVE extractions, we find good reliability. First, t-tests comparing the two measurement techniques showed no significant difference for any of the 10 speakers (see Appendix C for numerical results). Second, our average absolute differences between manual and automated methods, 31.5 Hz (2.6%) and 31.3 Hz (2.4%) for start F2 and father F2, respectively, are comparable to prior work. Evanini's (Reference Evanini2009:92) comparison of manual and automated methods shows an average difference of 126.4 Hz (8.6%) for F2. Our results are also comparable to prior studies of interanalyst differences in manual extraction. After all, for a large-scale project, it would typically be necessary to have a team of analysts extracting vowels, which is a potential source of error. Labov, Yaeger, and Steiner (Reference Labov, Yaeger and Steiner1972:32, cited in Evanini, Reference Evanini2009:93) reported interanalyst F2 differences of 84, 60, 38, and 64.8 Hz. Deng, Cui, Pruvenok, Huang, Momen, Cheng, and Alwan (Reference Deng, Cui, Pruvenok, Huang, Momen, Cheng and Alwan2006, cited in Evanini, Reference Evanini2009:93) reported an interanalyst F2 difference of 69 Hz. Hillenbrand, Getty, Clark, and Wheeler (Reference Hillenbrand, Getty, Clark and Wheeler1995:3101, cited in Evanini, Reference Evanini2009:93) showed a somewhat better level of F2 reliability between two analysts: 17.6 Hz. Lastly, examining the numerical results (Appendix C), we note that the measurements would lead to the same overall sociolinguistic conclusions (e.g., start is typically farther forward than father) regardless of whether the extractions were manual or automated, a point made by Evanini et al. (Reference Evanini, Isard and Liberman2009) with respect to the Northern Cities Shift.
To use FAVE in our study, we first transcribed the 51 recordings into English orthography sentences (TextGrid in Praat; Boersma & Weenink, Reference Boersma and Weenink2013). The FAVE-Align system then aligned each phonetic segment in the transcription. After checking the accuracy of the alignment and making any necessary corrections, we submitted each file to FAVE-Extract for vowel extraction. We then exported the FAVE-Extract output to R, where we removed unreliable high-bandwidth tokens and normalized the formant measurements of all speakers’ vowels together. For normalization, we used the Lobanov technique with hertz scalingFootnote 6 (R function norm.lobanov in the package “vowels” by Kendall & Thomas, Reference Kendall and Thomas2010, based on Lobanov, Reference Lobanov1971), following the normalization recommendations in Thomas and Kendall (Reference Thomas and Kendall2007). In addition to the targeted ENE vowels in Table 1, the Lobanov normalization procedure requires the full vowel space for each speaker. Therefore, we used the FAVE extractions of each speaker's full vowel space, using the word list, reading passage, and additional sentences, for approximately 400 vowel tokens per speaker (20,092 total vowel tokens in the dataset).
Measuring rhoticity
Following common practices in variationist sociolinguistics, we based our rhoticity analysis on auditory judgments (e.g., Labov et al., Reference Labov, Ash and Boberg2006; Nagy & Irwin, Reference Nagy and Irwin2010). For each speaker, two trained analysts judged rhotic versus nonrhotic pronunciation for each token of the words in Table 2: approximately 90 tokens per speaker. There are 4,585 rhoticity tokens in the dataset (4,585 tokens × 2 analysts for each token = 9,170 individual auditory judgments). Intercoder reliability was 88% (4,033 of 4,585 tokens), which is comparable to the 83% reliability reported in Yaeger-Dror, Kendall, Foulkes, Watt, Eddie, Harrison, and Kavenagh (Reference Yaeger-Dror, Kendall, Foulkes, Watt, Eddie, Harrison and Kavenagh2008) and 90% in Nagy and Irwin (Reference Nagy and Irwin2010:250) (cf. Hall-Lew & Fix, Reference Hall-Lew and Fix2012). As for phonetic environments, we followed the approach in the ANAE (Labov et al., Reference Labov, Ash and Boberg2006:47, citing Labov, Reference Labov1966). The ANAE (p. 47) defines the variable (r) as tautosyllabic (coda) /r/, excluding intervocalic /r/. They also exclude cases where /r/ is followed by a vowel-initial word, noting that such (linking /r/) environments tend to have a higher degree of rhoticity. Because our study examines many other variables beyond rhoticity, we focused our analysis of (r) according to the ANAE definition, rather than additional phonetic environments (see Nagy & Irwin, Reference Nagy and Irwin2010, for a paper focused on rhoticity).
RESULTS
Short summary
We found a significant decline in apparent time for six of the seven traditional ENE dialect features in the study: nonrhotic speech, intrusive-r, broad-a bath, fronted father, fronted start, and unmerged mary/marry/merry. The only feature showing full stability in apparent time was unmerged hoarse/horse. For all of the linguistic variables undergoing change, birth year was by far the most important factor. Gender was a significant factor in one of the variables undergoing change (start), but education and occupation were not significant.
The results are divided into two parts. Part A discusses the two features related to /r/, and Part B discusses vowel variables.
Part A: /r/ vocalization and intrusive-r
Nonrhotic speech
Nonrhotic (“r-less”) speech is a sociolinguistically salient and highly stereotypical feature of ENE (e.g., see Figure 1). Nonrhotic speech is “the icon of the Boston accent” (Fitzpatrick, Reference Fitzpatrick, Wolfram and Ward2006:66), one of the “major New England shibboleths” (Nagy & Roberts, Reference Nagy, Roberts, Schneider, Burridge, Kortmann, Mesthrie and Upton2004:270). Locals commonly talk about “dropping their r's” in various contexts, including New Hampsha’ as well as the ubiquitous phrase pahk the cah in Hahvahd Yahd. Nagy and Irwin (Reference Nagy and Irwin2010:247) observed advertisements for Maker's Mark whiskey in the Boston area spelled in a humorously nonrhotic style as “Makahs Maahk.” Local Boston T-shirts show playful nonrhotic spellings such as “Beantown Swaggah” and “Wicked Smaaht,” and one T-shirt prints a “Boston Alphabet” such that the letter R is replaced by “AH”: ABCDEFGHIJKLMNOPQAHSTUVWXYZ.
The rhoticity line in Figure 3 shows Kurath's analysis of the 1930s LANE data: Speakers west of Vermont's Green Mountains tended to be rhotic, whereas eastern speakers tended to be nonrhotic. This situation has been changing in recent generations, even in the area of the original Massachusetts Bay Colony (Nagy & Irwin, Reference Nagy and Irwin2010, and references therein; Van Riper, Reference Van Riper1958; Wells, Reference Wells1982). The ANAE shows rhotic speech increasing in New Hampshire and other parts of New England (Labov et al., Reference Labov, Ash and Boberg2006:226). Stanford et al.’s (Reference Stanford, Leddy-Cecere and Baclawski2012) Vermont–New Hampshire border study reports that, for older speakers (ages 61 to 92), the east-west contrast in nonrhotic speech has moved eastward from the Green Mountains to the Connecticut River (Vermont–New Hampshire state border), and younger speakers (18 to 22 years old) now have almost categorically rhotic speech.
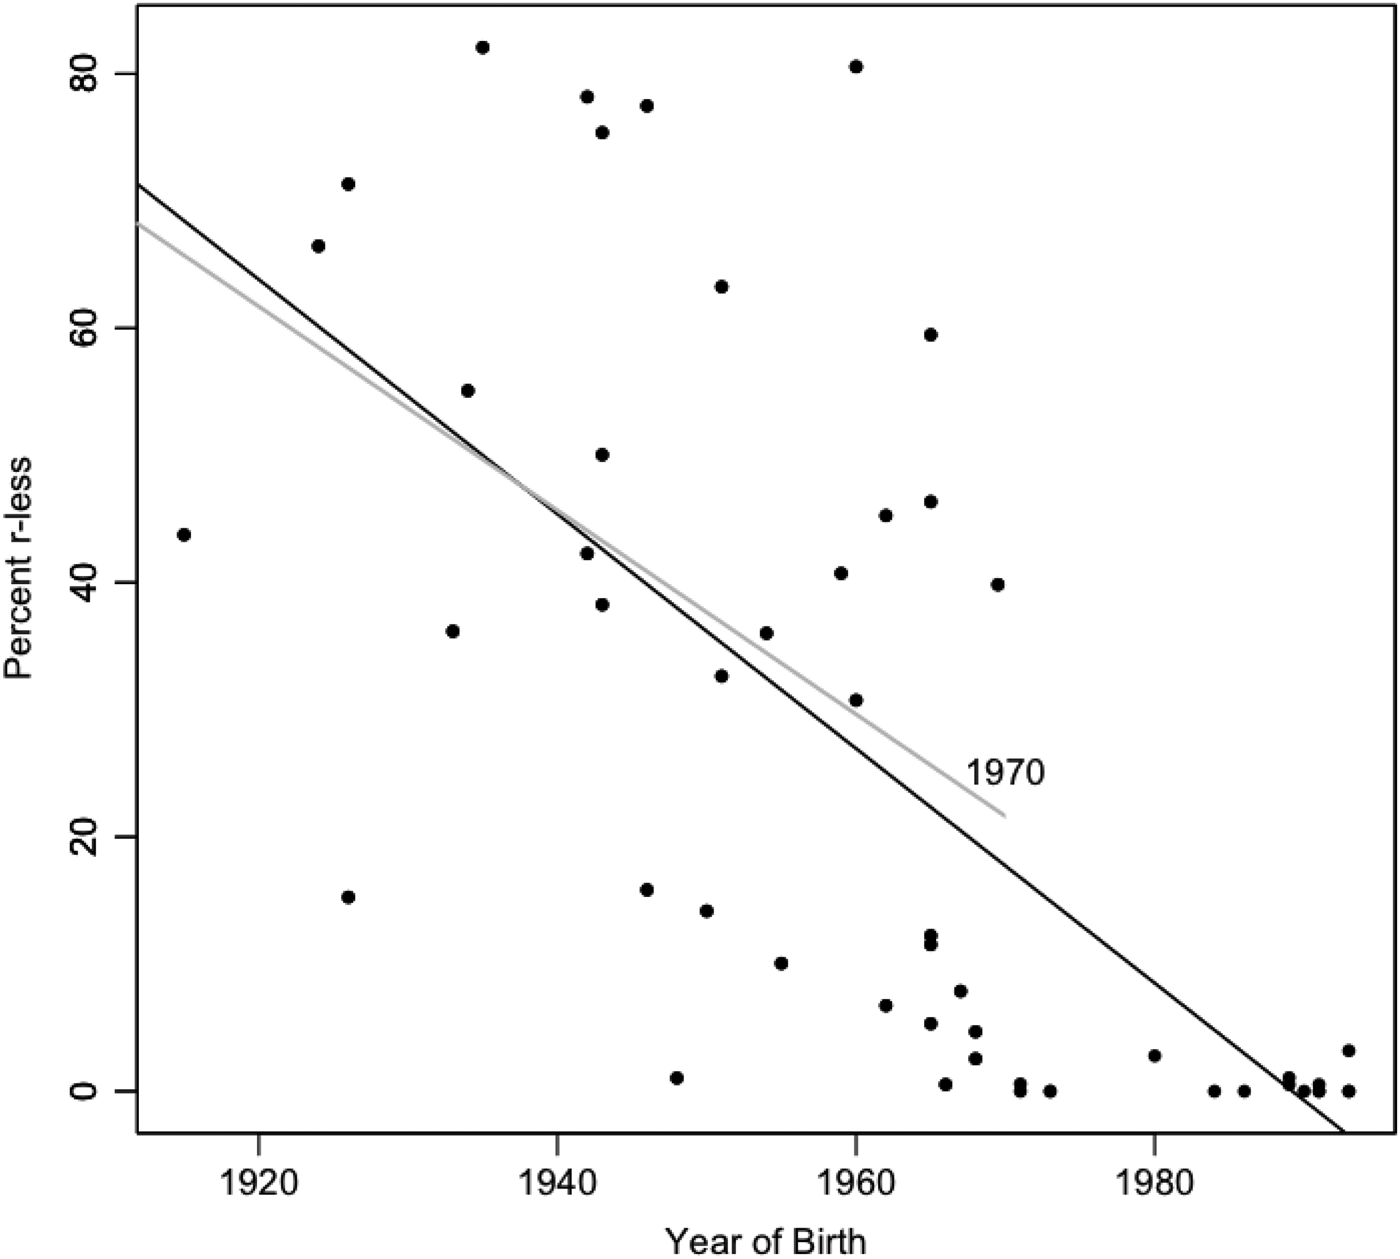
Figure 4 presents each speaker's birth year versus r-lessness percentage (average of the two analysts’ rhoticity score for each speaker) in the present study. In this figure, simple birth year accounts for a large amount of the data: R 2 = 0.47 with a linear regression coefficient of –.9923% per year (p < .0001). This result suggests that r-lessness in central New Hampshire is decreasing at a rate of approximately 1% per year of age. Following ANAE’s 25-year definition for a generation (Labov et al., Reference Labov, Ash and Boberg2006:47–48), we find that our central New Hampshire speakers show a decrease of 25% per generation (25 years × .9923%/year). For a comparison, ANAE finds a 14% decrease in nonrhotic speech in the US South per 25-year generation (Labov et al., Reference Labov, Ash and Boberg2006:47–48; see also Feagin, Reference Feagin and Edmondson1990).
Birth year versus percentage of nonrhotic pronunciations. The dark sloping line is a regression for all speakers (p < .0001, R 2 = .4708, coefficient = −.9923%/year). The gray sloping line is a regression for just the speakers born before 1970 (p = .007, R 2 = .2003, coefficient = −.8017%/year). Based on 4,585 tokens.
Nevertheless, the results in Figure 4 suggest that this change is occurring across several generations, not a sudden “drop-off.” Not only most of the youngest speakers but also a good number of speakers born in the 1960s and 1970s are very rhotic. Regression analysis on just the speakers born before 1970 (the gray sloping regression line in Figure 4) shows that, as with the full dataset, birth year is significant for speakers born before 1970 (R 2 = .20 with a coefficient of –.8017%/year, p = .007). In fact, the slopes of the regression lines are very similar, suggesting that the change is being incremented across several generations.
Multifactorial analysis of rhoticity
To analyze rhoticity in terms of other factors, we use linear mixed effects modeling (Rbrul) (Johnson, Reference Johnson2009; cf. Clark, Reference Clark2010). We modeled the data as 1 or 0 for each token where both coders agreed, omitting the 12% of tokens where the two coders disagreed.
For the factors education and occupation, we used the 1 to 4 scales in Labov (Reference Labov1966) and Michael (Reference Michael1962:213–214), as described in Ash (Reference Ash, Chambers, Trudgill and Schilling-Estes2002:406). On those scales, a score of 1 represents high socioeconomic/educational status, whereas 4 is the low end of the scale. For any occupations not directly mentioned in Ash (Reference Ash, Chambers, Trudgill and Schilling-Estes2002), our New Hampshire–raised coauthor (the second author) chose the best categories corresponding to locally relevant occupations.
Besides education and occupation, factors tested in the model were birth year, gender, and speech style (word list, reading, sentences). The random effects were speaker, word (lexical item), and hometown. The Rbrul step-up/step-down algorithm selected birth year and speech style as the only significant fixed effects, with no significant interactions. For the random effects, speaker and word made significant contributions to the model, but hometown did not. Analysis of variance tests of the model with and without each of these factors as a random effect (using lmer in R) (cf. Baayen, Reference Baayen2008:253–255; see also Fox, Reference Fox2002:14) indicated that hometown was not significant.
As seen in Table 3, the model found that increasing birth year contributes to a decrease in r-lessness: younger speakers are more likely to be rhotic. As for speech style, we find that sentences style (i.e., the list of seven additional sentences; listed in Appendix B) is the only style that contributes to greater r-lessness. Considering overall percentages in the raw data, we confirm that the sentences style tended to have a higher percentage of r-lessness, followed by reading style. Overall percentages of r-lessness in the three speech styles were: word list style = 20% r-less; reading passage style = 26% r-less; sentences style = 36% r-less. This greater level of r-lessness in sentences style may be due to the length of the activities in the interviews and the order of activities. The sentences activity is considerably shorter than the other two activities (see Appendix B), so interviewees may have perceived it as a quick, secondary activity requiring less concentration.
Multifactorial modeling results for rhoticity
Grand mean: .226; intercept: 6.939; deviance: 1926.6
Note: An increase in r-lessness is positive.
For example, in the field interview materials, the word list occupied a full page of evenly spaced words in columns, whereas the sentences activity just occupied a few lines of text. Moreover, the sentences activity occurred after the word list and reading passage activities, so interviewees may have been more relaxed at that point in the interview. When we reached the sentences activity at the end of an interview, we often had the impression that interviewees were quickly and casually finishing the interview. The speech style results are therefore consistent with well-known patterns of speech behavior with respect to formality (e.g., Labov, Reference Labov1966, Reference Labov1991/1972): greater r-lessness in more casual styles.
Summary of rhoticity
We find that r-lessness is receding quickly in apparent time, especially when considered in comparison to the centuries-long timescale of ENE features in this region. In our modeling, only birth year is significant, and it is younger speakers who are more likely to be rhotic. Furthermore, the evidence from speech style and ethnographic observations suggest that nonrhotic speech is not simply an indicator; it is a stereotype (Labov, Reference Labov1991/1972). These results suggest that one of the processes of outward orientation may be conscious avoidance of stigmatized features.
Intrusive-r
A variable that is related to nonrhotic speech is intrusive-r: the addition of /r/ in words such as “idear” (idea), “Chinar” (China), “sawr” (saw), and so on. This feature is likely an overextension of linking-r (see Wolfram & Schilling-Estes, Reference Wolfram and Schilling-Estes2006:46–47). Like r-lessness, intrusive-r is a highly salient, stigmatized variable (Stanford et al., Reference Stanford, Leddy-Cecere and Baclawski2012:160). Intrusive-r is clearly associated with nonrhotic speech in the sense that ENE speakers who are nonrhotic often have intrusive-r (cf. Nagy & Roberts, Reference Nagy, Roberts, Schneider, Burridge, Kortmann, Mesthrie and Upton2004:279). Nonetheless, the relationship between the two variables is not rigid: Nonrhotic speakers do not necessarily also have intrusive-r.
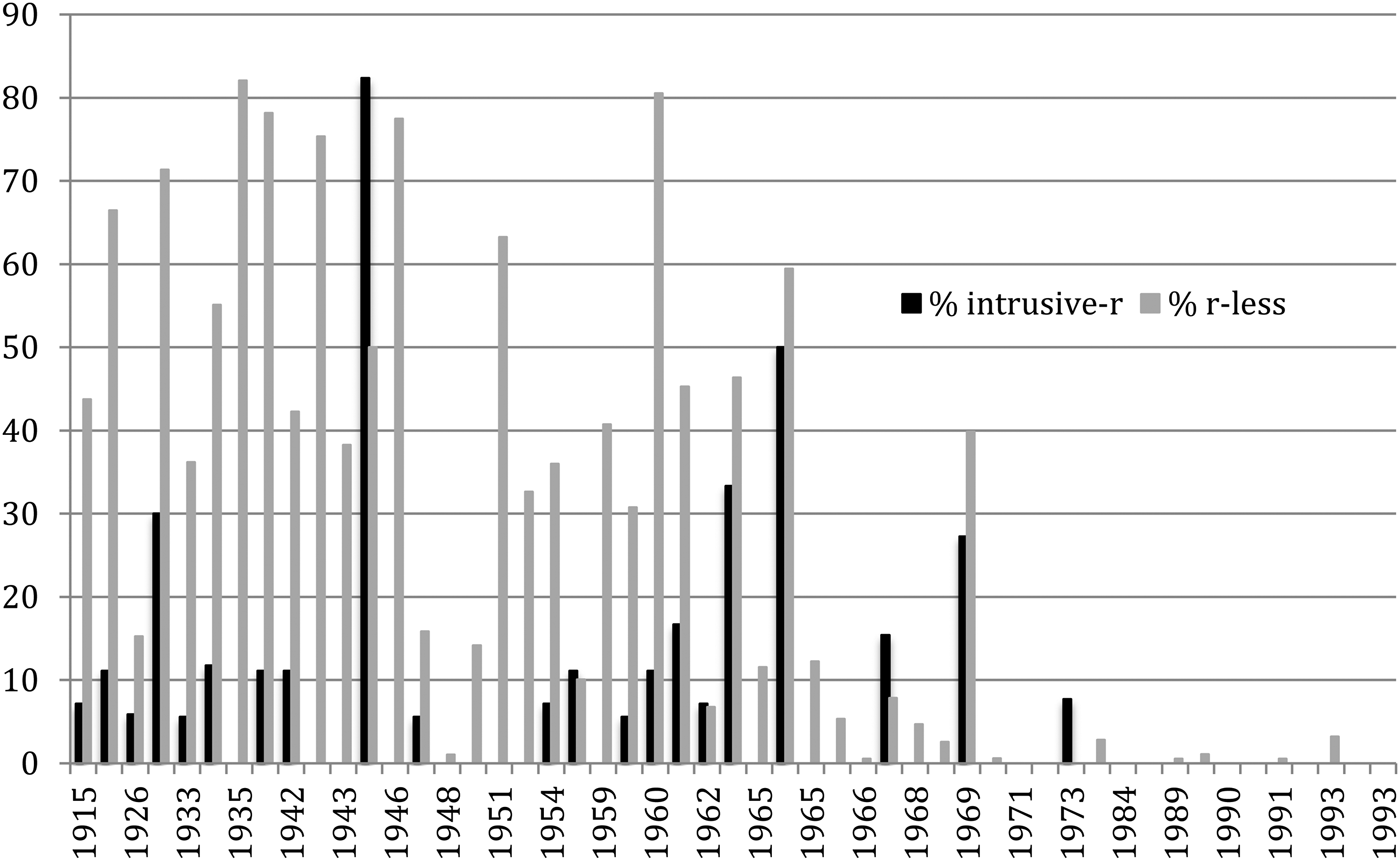
In our recordings, 21 of 51 speakers produced at least one instance of intrusive-r. This feature was observed in the following words: “mar and pa” (ma and pa), “arnt” (aunt), “parm” (palm), “carm/carmly” (calm), and “barm” (balm). Among these lexical items, intrusive-r was most common in ma, occurring 23.6% of the time (22 intrusive-r occurrences in 93 tokens of ma), followed by aunt (8.1%; 15 of 185 tokens) and palm (7.4%; 7 of 94 tokens). The prevalence of intrusive-r in ma is not surprising as ma was always followed by a vowel (ma and pa, see word list in Appendix B), an environment that could evoke a prevocalic linking-r environment like far and away. Figure 5 shows our apparent-time plot of intrusive-r. These graphical results suggest a change in progress that roughly parallels nonrhotic speech, but the percentages of intrusive-r are generally lower.
Percentage of intrusive-r (black) and percentage of r-lessness (gray) for each speaker: 51 speakers, arranged by birth year.
Multifactorial analysis of intrusive-r
Overall, intrusive-r was only observed in 58 of 830 possible tokens (7%) of the targeted words.Footnote 7 Due to this low incidence of intrusive-r, the logistic regression algorithm (Rbrul) did not converge on a viable model for the data; it was not possible to model the individual tokens of intrusive-r (1s and 0s). Instead, we analyzed intrusive-r on the basis of a percentage score for each speaker: the total number of intrusive-r tokens divided by the total possible intrusive-r words for the given speaker, that is, the intrusive-r percentages in Figure 5.
We ran a linear mixed effects model in Rbrul, and the factors tested were birth year, education, occupation, gender, and percent r-less, with hometown as a random effect. (Speaker could not be modeled as a random effect because there was only a single dependent variable score for each speaker, i.e., the overall percentage of intrusive-r for the given speaker.) Likewise, because there is only a single row in the data for each speaker in this approach, it is not possible to model speech styles, lexical items, or other factors related to individual tokens.
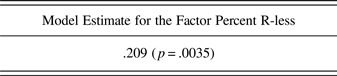
The Rbrul step-up/step-down algorithm showed that percent r-less (speakers’ percentage of r-lessness) was the only significant factor. The coefficient for this r-less factor was .209, so the model estimated that the percentage of intrusive-r increases by .209 for each 1% increase in r-lessness (Table 4).
Multifactorial modeling results for intrusive-r
Grand mean: 7.333; intercept: 1.977; deviance: 409.8
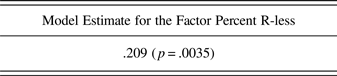
Note: An increase in r-lessness is positive.
Birth year was not selected by the model as significant, nor were interactions between birth year and percent r-less or other factors. Nonetheless, intrusive-r is likely to be absent in future generations because it depends on r-lessness. In the previous section, we found that r-lessness is sharply receding in apparent time and largely absent in younger speakers. In this section, we found that intrusive-r is dependent on the level of r-lessness of the speaker. Therefore, the results suggest that future generations of central New Hampshire speakers are unlikely to have either of these two traditional ENE features.
The overall conclusion for intrusive-r is clear. This traditional ENE feature is vanishing in central New Hampshire at about the same time as r-lessness. Intrusive-r is “riding piggyback” on r-lessness as r-lessness declines, and each generation is following this vector of change.
Part B: Vowel features
In this section we discuss the results for fronted father, fronted start, broad-a bath, hoarse/horse, and mary/marry/merry.
Fronted father
Fronted father refers to a fronted low vowel in words such as father, palm, calm, ma, and pa (see ANAE, Labov et al., Reference Labov, Ash and Boberg2006:14). The 1930 to 1931 fieldwork of LANE found an east-west contrast in father-fronting (reprinted in our Figure 3). Likewise, ANAE considers fronted father to be a distinguishing feature of Northeast New England (Labov et al., Reference Labov, Ash and Boberg2006:230–231, Map 16.5). Finally, in their Vermont–New Hampshire border study 77 years after LANE, Stanford et al. (Reference Stanford, Leddy-Cecere and Baclawski2012) found that this line of contrast for father had moved eastward to the Connecticut River for older speakers (ages 61 to 92), whereas for younger speakers (ages 18 to 22), fronted father had vanished as a distinguishing feature. Nagy (Reference Nagy2001) found that southern New Hampshire participants were more likely to self-report a father/bother merger than were Boston participants and northern New Hampshire participants, and she concluded that southern New Hampshire speakers are resisting sociolinguistic identification with Boston.
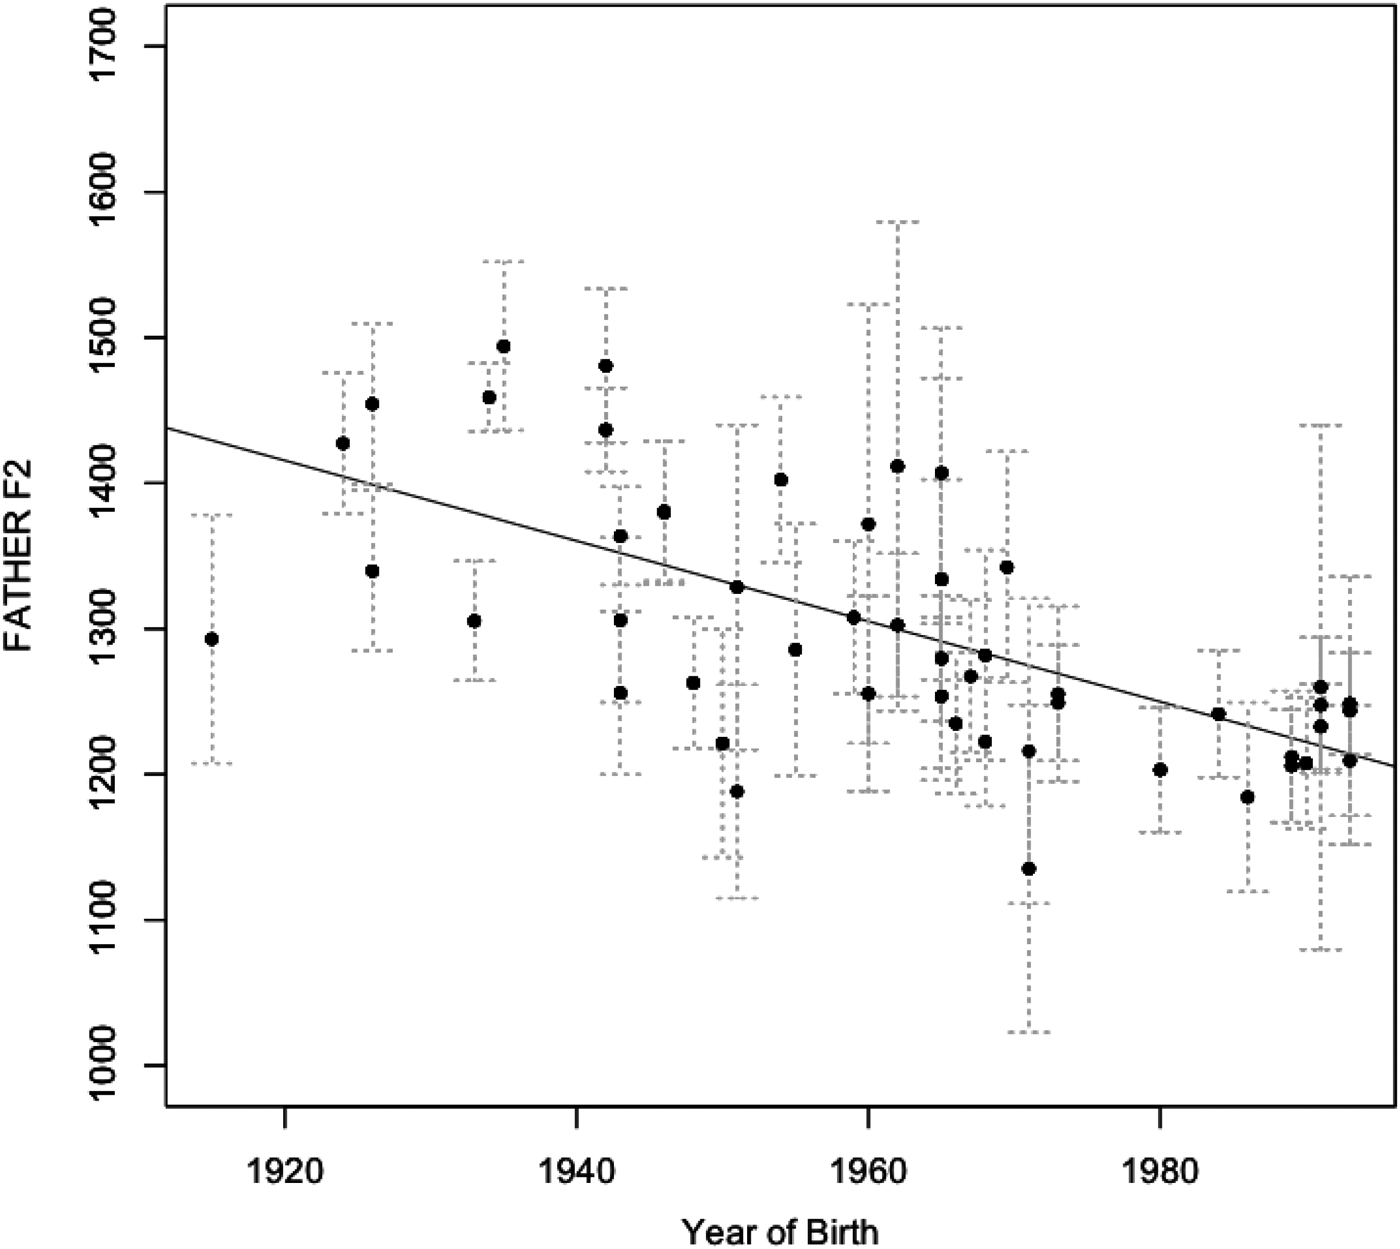
In the present study, we find a clear age contrast in fronted father in central New Hampshire. Because our primary ENE interest in father is the degree of frontness, we plot each speaker's mean F2 versus birth year. Figure 6 shows that F2 of father is decreasing quite rapidly in recent generations. However, there is not a sudden break in transmission at any particular point. Each generation is following the age vector of change, decreasing the F2 of father in generational increments.
Birth year versus father (speaker means). Linear regression: p < .0001, R 2 = .271, slope = −2.76 Hz/year. Each dot represents the mean F2 of one speaker (Hz). There are 51 speaker means in the plot, representing 660 total tokens. Dotted lines are standard deviations, and the solid line is the linear regression fit.
Linear mixed effects analysis of father
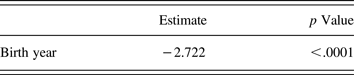
Because the fronted father variable involves multiple measurements for each speaker (multiple tokens of F2), we used linear mixed effects to analyze F2 of father in terms of different social factors: birth year, gender, education, occupation, and speech style. The Rbrul step-up/step-down procedure reported that birth year was the only significant fixed effect factor (Table 5), with speaker, hometown, and word (lexical item) as random effects. Interactions were not significant. In the model, father F2 values were estimated to decrease by 2.722 Hz per year of age, which corresponds to the pattern in Figure 6. For example, a hypothetical speaker born in 1940 would be estimated to have a father vowel that is 108.9 Hz farther forward than a speaker born in 1980 (2.722 Hz/year × 40 years = 108.9 Hz).
Multifactorial modeling results for father F2
Grand mean: 1299.3; intercept: 1463.3; deviance: 7508.8
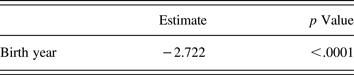
Note: Positive value indicates more fronted (i.e., higher) F2.
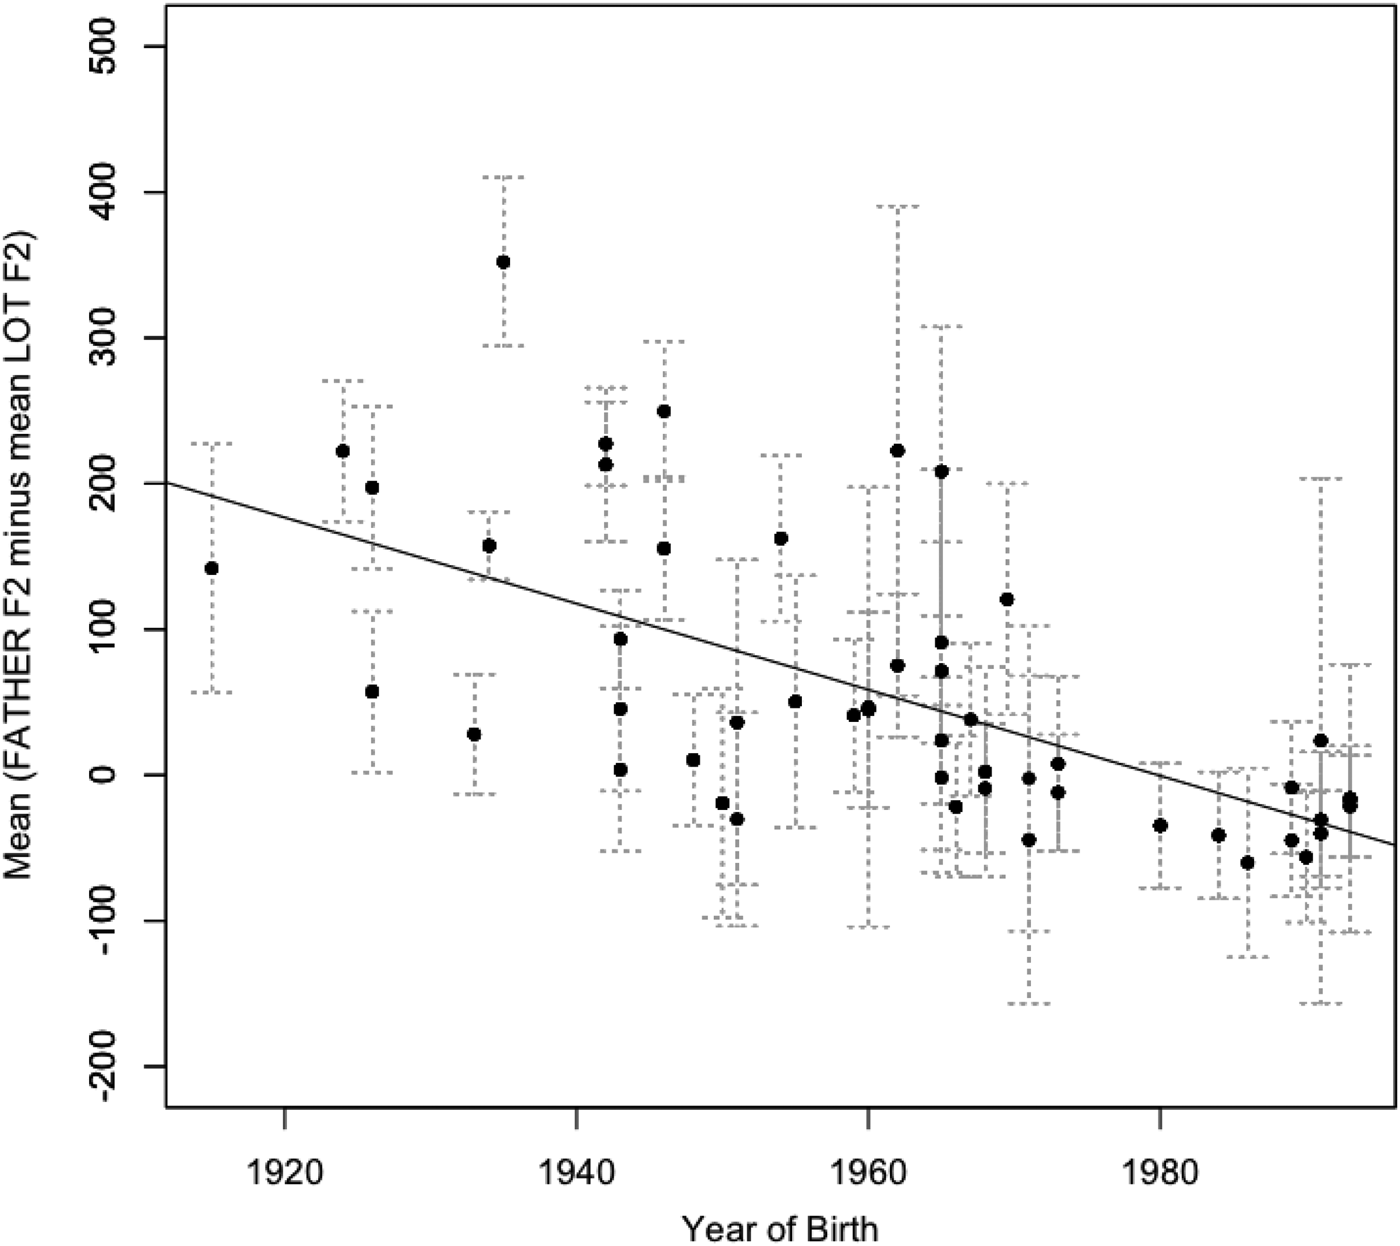
We also examined whether father and lot are merging along the F2 axis. Figure 7 plots F2 of father minus the mean F2 of lot, illustrating the merger in progress. The results in Figure 7 are quite similar to Figure 6.Footnote 8 In apparent time, F2 of these two lexical sets are clearly merging toward zero difference. In conclusion, the traditional ENE fronted father variant is receding quickly in apparent time in central New Hampshire.
Plot of birth year versus the mean of a speaker's father F2 minus that speaker's mean lot F2 (Hz). Linear regression: p < .0001, R 2 = .2754, slope = −2.96.
Fronted start
Following ANAE (Labov et al., Reference Labov, Ash and Boberg2006:228–231; cf. Baranowski, Reference Baranowski, Bayley, Cameron and Lucas2013), we provide separate analyses of start and father. We also include a discussion of possible phonetic issues of /r/ in start. start words include start, dark, part, hard, barn, farm, etc. ANAE reports fronted start across northern New England, whereas fronted father is limited to the eastern side. LANE considered both fronted start and fronted father to be ENE features (Kurath et al., Reference Kurath, Hanley, Bloch, Lowman and Hansen1939–1943:map 121; Kurath & McDavid, Reference Kurath and McDavid1961:map 46). Stanford et al. (Reference Stanford, Leddy-Cecere and Baclawski2012) found that fronted start is somewhat more conservative (more resistant to change) than some other variables; it is retained by young speakers even though they have lost many other traditional ENE features, including fronted father and nonrhotic speech. Stanford et al. (Reference Stanford, Leddy-Cecere and Baclawski2012) attributed this to an under-the-radar effect: younger speakers in ENE are carefully avoiding socially salient variables, especially nonrhotic speech. But because start-class words actually contain two variables, (r) and start, Stanford et al. (Reference Stanford, Leddy-Cecere and Baclawski2012) suggested that younger speakers are being careful to pronounce the /r/ in start-class words, yet “overlooking” the fronted vowel in those words. The younger speakers may be assuming that their rhotic speech has sufficiently “cleansed” their pronunciations of all traditional ENE features, even though the fronted start vowel persists to some extent. For this reason, Stanford et al. (Reference Stanford, Leddy-Cecere and Baclawski2012) argued, fronted start is more conservative than fronted father is. Such an analysis may also be applied to hoarse/horse distinctions.
Our results for fronted start
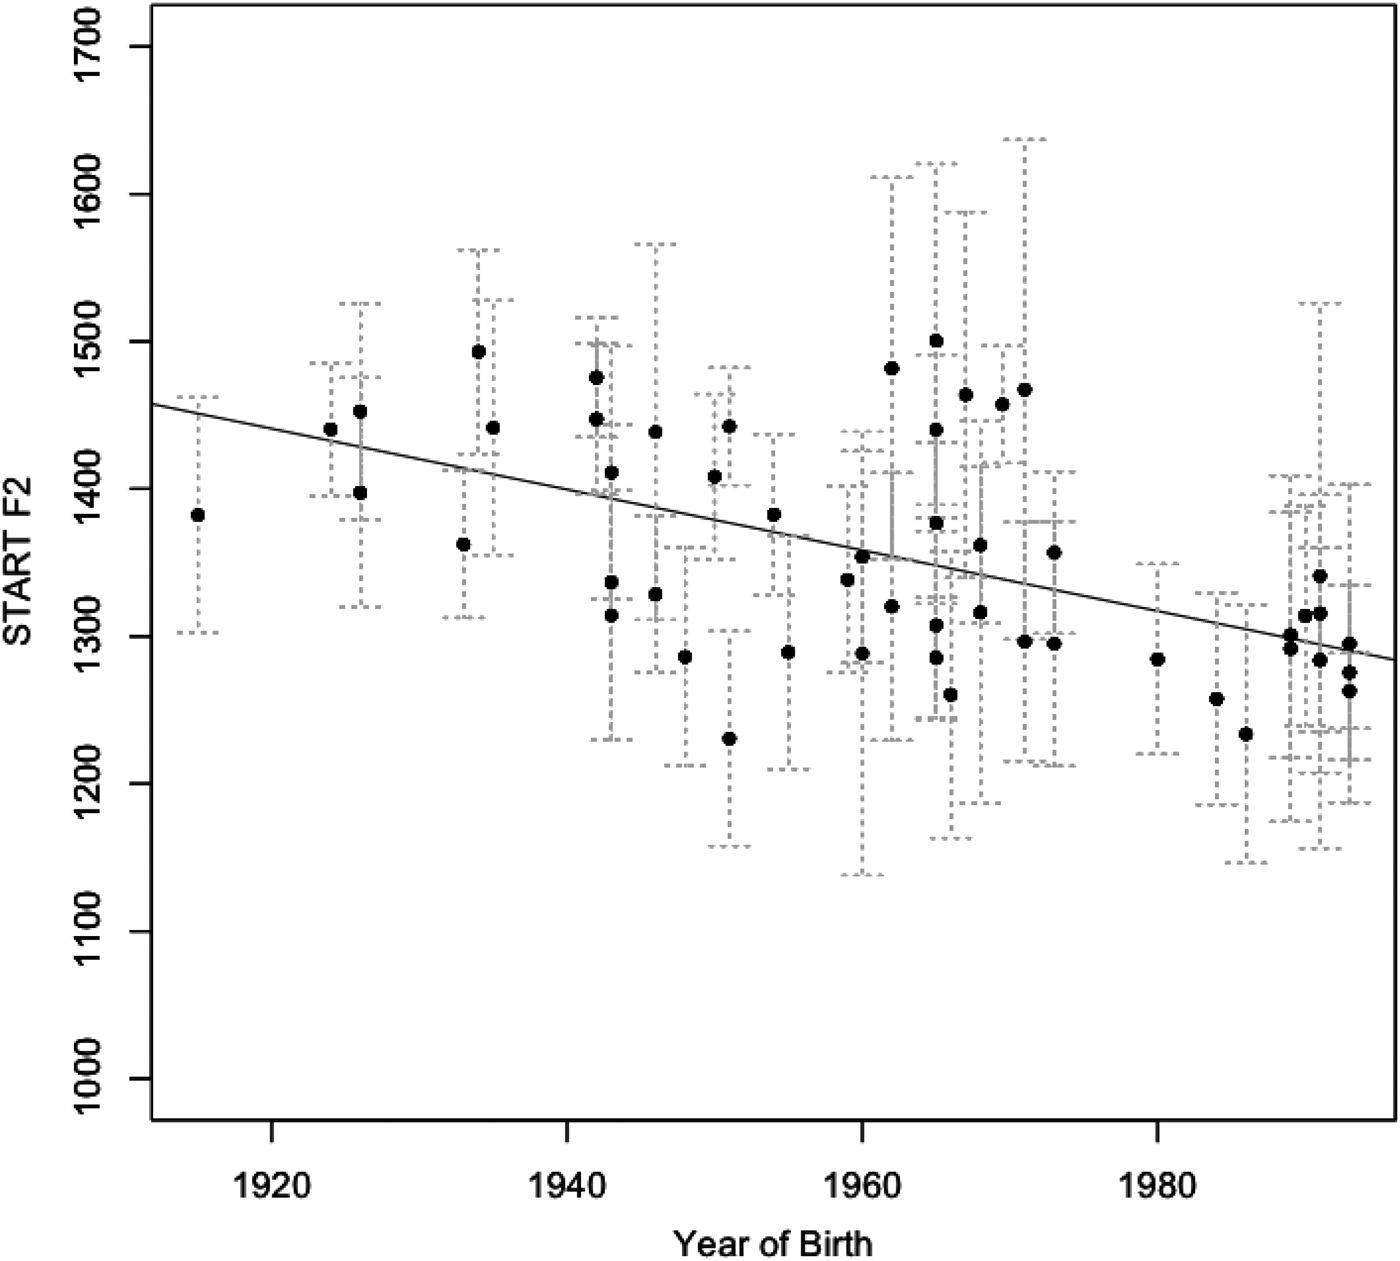
We analyze start in detail due to its role as an under-the-radar variable and its contrast with father. Figure 8 shows a steady apparent-time decline in F2 of start, which is much like our results for father (Figure 6). However, the linear regression fit for start is considerably weaker (R 2 = .15) than the fit for father (R 2 = .27). Birth year is certainly important for start, but the effect is not quite as strong as it is for father.
Birth year versus start (speaker means). Linear regression: p < .0001, R 2 = .15, slope = −2.062 Hz/year. The plot shows means of 51 speakers, and 596 total tokens. Dotted lines represent standard deviations. The solid line is the linear regression fit.
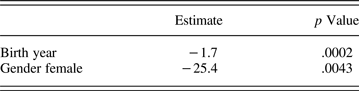
As with father, we ran a linear mixed effects analysis (Rbrul) on F2 of start. We tested for effects of birth year, gender, education, occupation, and speech style on F2 of start, with speaker, hometown, and word (lexical item) as random effects. Unlike father, both birth year and gender showed significant effects (Table 6); interactions were not significant.
Linear mixed effects results for start
Grand mean: 1353.2; deviance: 6794.6; intercept: 1466.8.
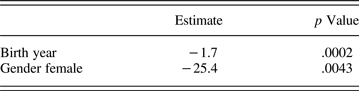
Note: Positive value indicates more fronted (i.e., higher) F2.
The model estimates that F2 of start will be 1.7 Hz farther back (lower F2) for every year of increase in birth year, which is consistent with the graphical results in Figure 8. As for gender, the model estimates that a speaker's start F2 will be 25.4 Hz farther back (lower F2) if the speaker is female (and vice versa for male). Both of these estimates match our expectations. First, considering the rapid decline in other traditional ENE features, we expect that younger speakers will tend to have a less-fronted start than older speakers. Second, following Labov (Reference Labov1990, Reference Labov2001), we expect that men will lag behind women in the change toward less stigmatized variants of start. We expect that men will tend to have a more fronted start than women will, and the model agrees.
Therefore, although both fronted father and fronted start are receding in apparent time, only start shows a significant effect of gender. While there are various possible interpretations of this result, we suggest that it is likely due to the relative speeds of change: fronted father is receding so quickly in apparent time that birth year is the only significant factor selected by the model. Fronted start is receding just a bit more slowly, and so the model is able to uncover gender playing its classic role in sound change (Labov, Reference Labov1990, Reference Labov2001:274). Note that the slope estimates for F2 are 62% lower for start than for father (–1.7 Hz/year and –2.722 Hz/year, respectively). Such results appear to support an under-the-radar analysis for start. These two variables occupy similar places in the vowel space ([a]), yet the vowel change in start words is receding more slowly.
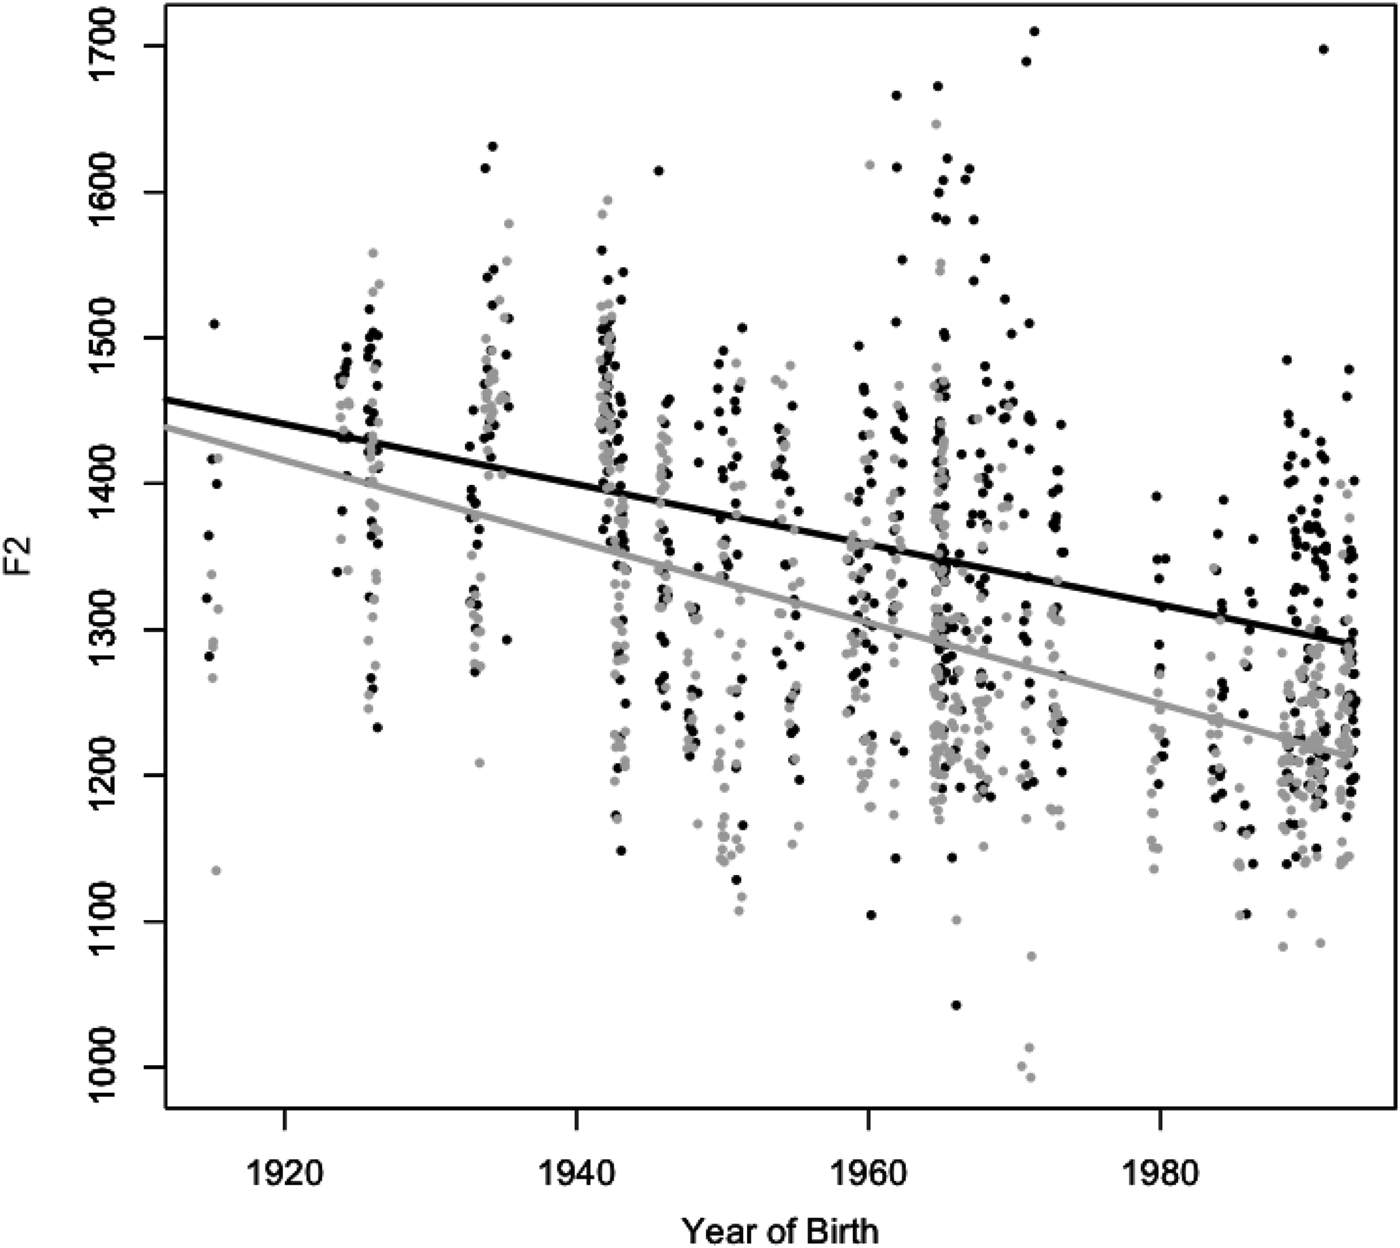
We provide further evidence through a graphical and statistical comparison of individual tokens of start and father. First, in Figure 9 note the clear contrast between start and father among the younger speakers on the right side where birth year >1970. For the younger speakers in our dataset, fronted father is almost nonexistent, as this vowel has merged with lot in F2 (recall the F2 merger of father and lot in Figure 7). Yet start remains distinctively farther forward than father.Footnote 9
Birth year versus F2 for start (black) and father (gray). Individual tokens. For this plot, jitter was added to the horizontal axis to make the individual tokens visually distinguishable.
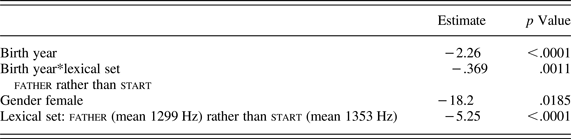
With Figure 9 in mind, we ran a linear mixed effects model with lexical set (word class) as a factor (that is, start versus father), along with the social factors and random effects used previously. As with the separate model runs for start and father, we find that F2 significantly decreases with birth year (Table 7). Gender is significant as well, such that male speakers are estimated to front F2 by 18.2 Hz more than female speakers do.
Linear mixed effects results for F2 of start and fatherGrand mean: 1324.8; deviance: 14721; intercept: 1465.6
Note: Positive value indicates more fronted (i.e., higher) F2.
Notably, Table 7 also shows a significant interaction between birth year and lexical set. The model estimates that F2 is 0.369 Hz per year farther forward for start. Thus, the model predicts that if a particular token is a start vowel, its F2 will be 0.369 Hz farther forward for each year of increasing birth year than it would be for a father vowel. This interaction result is consistent with the graphical contrast observed among younger speakers in Figure 9; namely, the F2 contrast in start and father is strongest among younger speakers, where the traditional fronted start variant is receding more slowly than fronted father is. The Table 7 results also show a slight but significant main effect for lexical set (start versus father). In this model across the full dataset, a token of father is estimated to be slightly farther back (5.25 Hz) than a token of start. But it is the interaction term (birth year*lexical set) that is most notable here because it shows that fronted start is more robust than fronted father among younger speakers.
The role of postvocalic-r in start
Beyond these modeling results, it is important to carefully consider whether these F2 differences between start and father are not due to some kind of intrinsic phonetic effect from the different postvocalic environments of these two word classes. In this section, we present three reasons why such an intrinsic phonetic explanation (i.e., presence of /r/) is inadequate and why we favor the sociolinguistic explanation of fronted start as being under the radar.
First of all, Hawkins and Slater (Reference Hawkins and Slater1994) found that postvocalic-r typically lowers F2 in the preceding vowel, all things being equal. Yet as we have shown in the previous section, young central New Hampshire speakers typically have a higher F2 for start than for father; fronted start is more conservative than fronted father is in our data. Whatever intrinsic lowering effects postvocalic-r may cause, such effects are overridden by the regional sociolinguistic tendency for fronted start in central New Hampshire.
Second, we coded for the presence/absence of postvocalic-r in each token of start and father to confirm that the phonetic presence of rhoticity did not have a significant effect on F2. For father, it is possible that intrusive-r could affect F2 in some consistent pattern, although only 32 of 660 father tokens had intrusive-r. Likewise, for start, the presence/absence of a postvocalic-r could affect F2. But this factor was not significant in the linear mixed effects modeling for F2 (Rbrul step-up/step-down). In other words, lexical set (start versus father) is significant, but the presence or absence of postvocalic-r in a given token is not.
Third, despite the phonetic predictions in Hawkins and Slater (Reference Hawkins and Slater1994), it is possible that American English start simply tends to be farther forward than father (for some unknown phonetic reason). The ANAE does not find this to be the case, and our own analysis of ANAE data concurs. In the ANAE, fronted start is largely limited to northern regions (ANAE map 10.34). In particular, the ANAE determines that northern New England has “exceptional” fronting of start in comparison to lot (Labov et al., Reference Labov, Ash and Boberg2006:228–229, map 16.4). Fronted start is also reported to be common in the Atlantic Provinces of Canada (Labov et al., Reference Labov, Ash and Boberg2006:141, map 11.12). Using data from the ANAE project (Labov, personal communication), we made a subset of all ANAE speakers who were not from New England, not from the Atlantic Provinces of Canada, and who were rhotic. For these 397 speakers, we found that start was significantly farther back than father was (p < .0001; mean start F2 = 1231.8 Hz; mean father F2 = 1313.0 Hz). start was also farther back than lot was (p < .0001; lot F2 = 1330.8 Hz).Footnote 10 Such results (lower F2 for start) are what we would expect from the intrinsic phonetic influence of postvocalic-r (Hawkins & Slater, Reference Hawkins and Slater1994), all things being equal.
We conclude that central New Hampshire's conservative rate of change in start in comparison to father is best explained as a dialect variable that is sociolinguistically under the radar. We suggest that younger generations of speakers are acutely aware that nonrhotic speech is a highly stigmatized regional feature, and they know that words like start can be pronounced in a nonrhotic manner. As they carefully avoid that traditional ENE feature, they tend to “overlook” the fact that start words also contain another traditional ENE feature: the fronted start vowel. Therefore, regardless of whether they produce postvocalic-r or not in start, they still tend to front the vowel. Further support for this analysis is provided in our discussion of horse/hoarse, which is another example of a vowel variable adjacent to (r).
Note that these under-the-radar effects are not directly related to the issue of whether a particular variable is an indicator or not (Labov, Reference Labov1991/1972). Instead, it is a matter of relative prominence. In our dataset, neither father nor start showed significant contrasts in speech style, yet we found a clear distinction between start and father in the degree of fronting. At the same time, it is plausible that a marker or even a highly stereotyped feature could be under the radar relative to an even more stereotyped feature within the same syllable. After all, start actually appears four times in the quintessential ENE stereotyped phrase, pahk the cah in Hahvahd Yahd (Nagy, Reference Nagy2001:33). The specific origins of this phrase are unknown, but it is almost certainly not a coincidence that this phrase includes so many opportunities to produce the distinctive New England start vowel. If r-lessness were the only feature being performed in this phrase, then many other vowels could have appeared besides start (bird, here, there, etc.). Even so, r-dropping is by far the most common topic of overt comment about dialects in this region. The status of start as an indicator, marker, or stereotype will require future research. Regardless, our results suggest that the under-the-radar effect is a matter of relative prominence between two variables in the same syllable or word.
Broad-a in bath
The broad-a pronunciation of bath words refers to low central [a] as opposed to a low front [æ]. Kurath (Reference Kurath1939:30, 8–9, 11), Laferriere (Reference Laferriere, Fasold and Shuy1977:102), and Wells (Reference Wells1982:133–135) reported that ENE has a broad-a pronunciation for bath words, such as bath, path, laugh, and calf. As with r-lessness and intrusive-r, broad-a in bath is a “particularly salient feature” (Fitzpatrick, Reference Fitzpatrick, Wolfram and Ward2006:66). Nagy and Roberts (Reference Nagy, Roberts, Schneider, Burridge, Kortmann, Mesthrie and Upton2004:270) consider these two features to be “major New England shibboleths.” Prior studies of this variable (Laferriere, Reference Laferriere, Fasold and Shuy1977; Stanford et al., Reference Stanford, Leddy-Cecere and Baclawski2012; Wood, Reference Wood2011) suggested that there is a change in progress in ENE as the [a] variant is receding in favor of [æ].
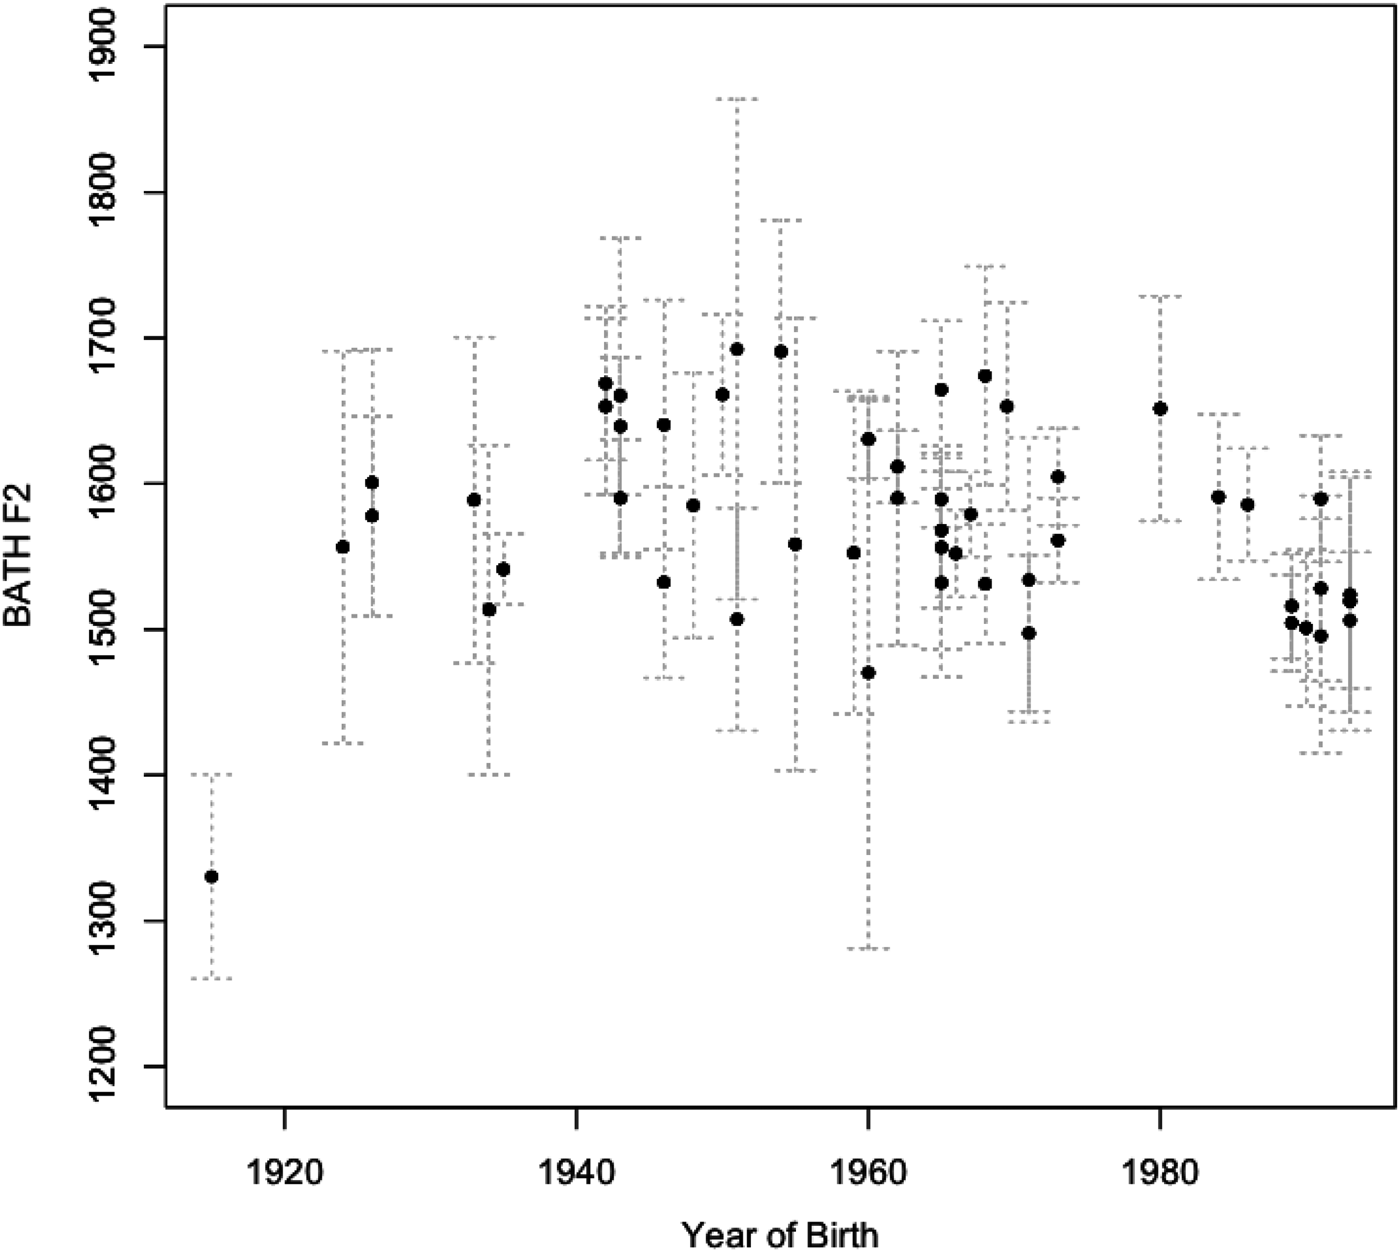
Because broad-a involves a front-back dimension (low central [a] versus low front [æ]), in the present study we quantify it in terms of F2. As Figure 10 shows, only 1 of our 51 speakers has a consistently backed bath: the data point in the lower left corner of Figure 10 represents a 97-year-old woman who had consistent broad-a pronunciations (speaker 53), both auditorily and acoustically. Naturally, we cannot draw broad conclusions about just one speaker who has consistent broad-a bath. But that is exactly the point: the broad-a bath feature of ENE has dramatically receded, so that now there are very few robust examples of [a] speakers in New Hampshire. From the LANE fieldwork in the early 1930s, we know that broad-a bath speakers once permeated New Hampshire. Our 97-year-old speaker 53 appears to represent one of the last speakers from that era.
Plot of bath F2 by birth year. Each dot represents the mean F2 for a speaker. There were 51 total speakers and 404 total tokens.
Even so, we do not find a categorical drop-off in broad-a speakers. Speaker 53 was not the only speaker who produced tokens of [a] for bath words. We auditorily observed that a few of the other older speakers occasionally produced one or two tokens of [a] for bath words, especially in the word laugh. Following these auditory hints, we examined the recordings for acoustic evidence. To quantify it, we located all bath tokens that were within one standard deviation of the mean F2 of speaker 53. There are 10 bath tokens that meet this criterion. In terms of lexical tendencies, we note that 6 of those 10 tokens are the word laugh, which is consistent with our auditory impressions. In terms of speakers, we find that eight speakers were responsible for those 10 tokens, and most of those speakers were older. Of the eight speakers, six were born before 1963, and two others were born in 1990 and 1991. This highly salient feature has clearly been rapidly receding in recent generations, but it is not a sudden drop-off between any two generations.
It is possible that backed variants of this vowel (especially in younger speakers) could be the result of other contemporary changes, for example, the Canadian Shift, although the Canadian Shift has not been reported in this region. Likewise, it would be useful for future research to examine dance/trap with respect to nasal split /æ/ (cf. ANAE map 13.5).
hoarse/horse
hoarse words include hoarse, coarse, four, sports, etc. horse words include horse, storm, for, north, short, etc. (see Labov et al., Reference Labov, Ash and Boberg2006:49–51, citing Kenyon & Knott, Reference Kenyon and Knott1953; see also Laferriere, Reference Laferriere1979:604; Wells, Reference Wells1982). At the time of the LANE fieldwork, the hoarse and horse word classes were distinct in ENE but not in western New England (Kurath & McDavid, Reference Kurath and McDavid1961:120, map 44). The ANAE reports a change such that hoarse/horse is now merged in ENE except among speakers in the Boston metropolitan area and some speakers in Maine (ANAE map 16.2). Along the Vermont–New Hampshire border, Stanford et al. (Reference Stanford, Leddy-Cecere and Baclawski2012) reported unmerged hoarse/horse among both older and younger speakers. They suggested that, like start-fronting, unmerged hoarse/horse is comparatively conservative due to the fact that these words simultaneously contain two variables: the highly salient postvocalic (r) variable and the under-the-radar hoarse/horse vowel distinction.
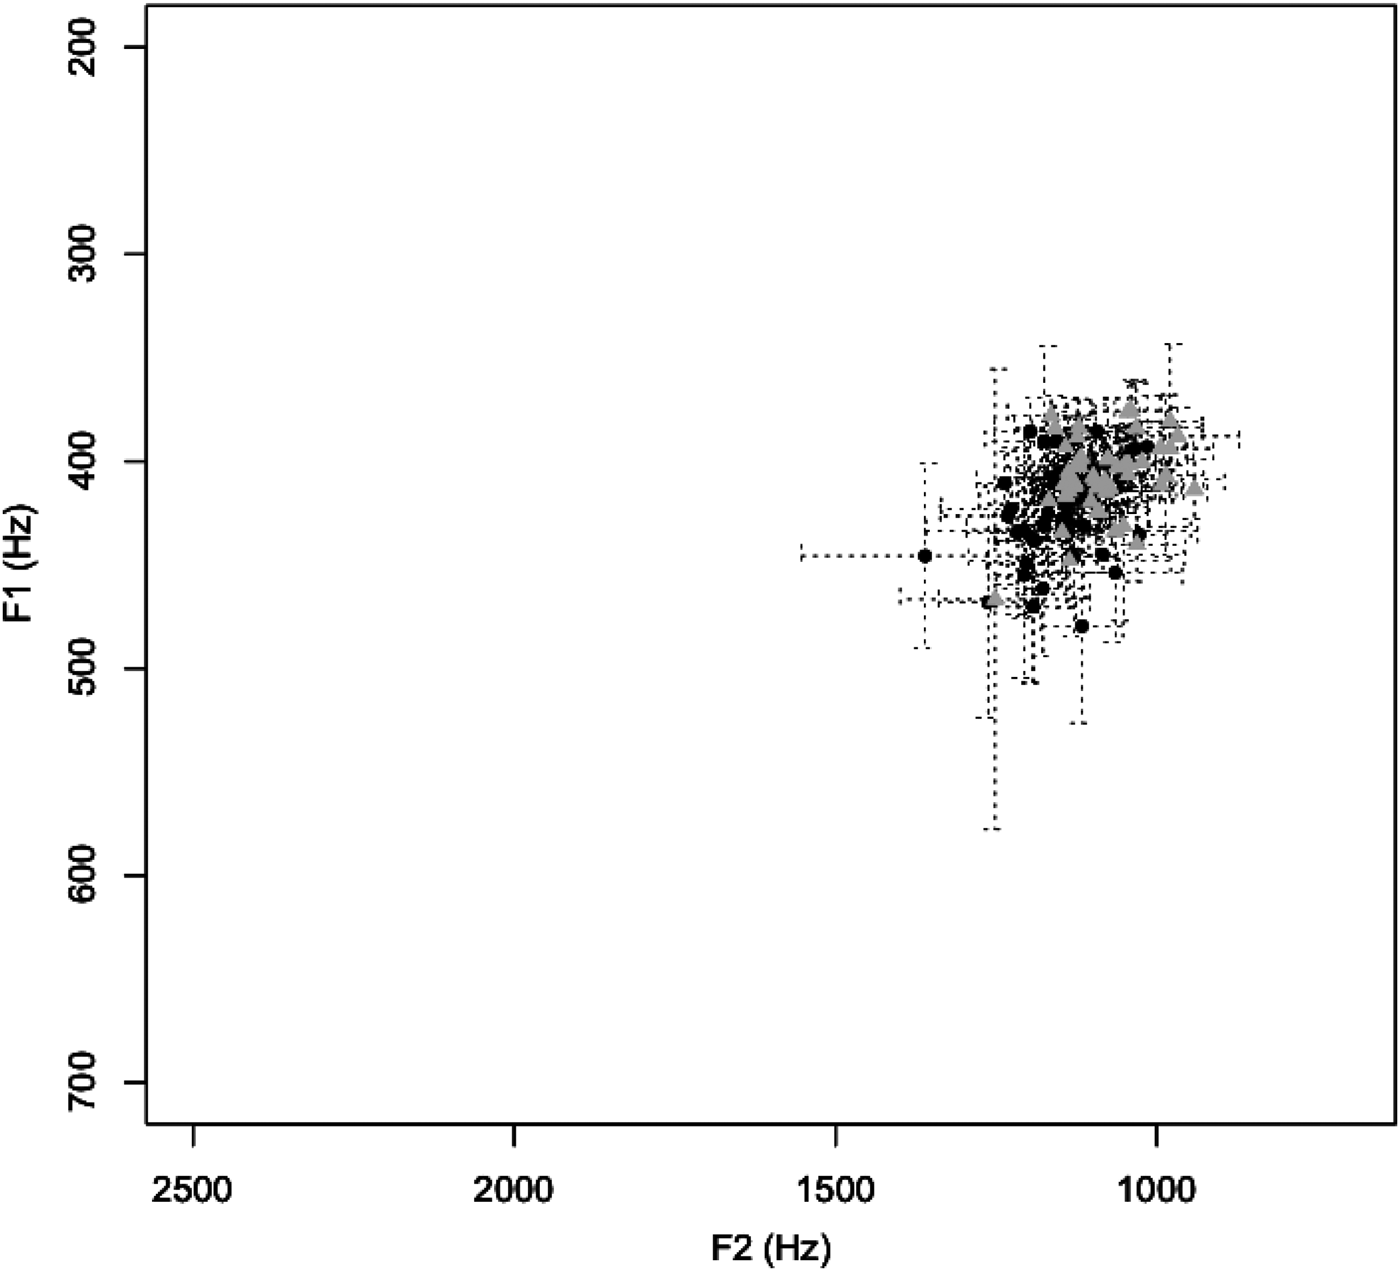
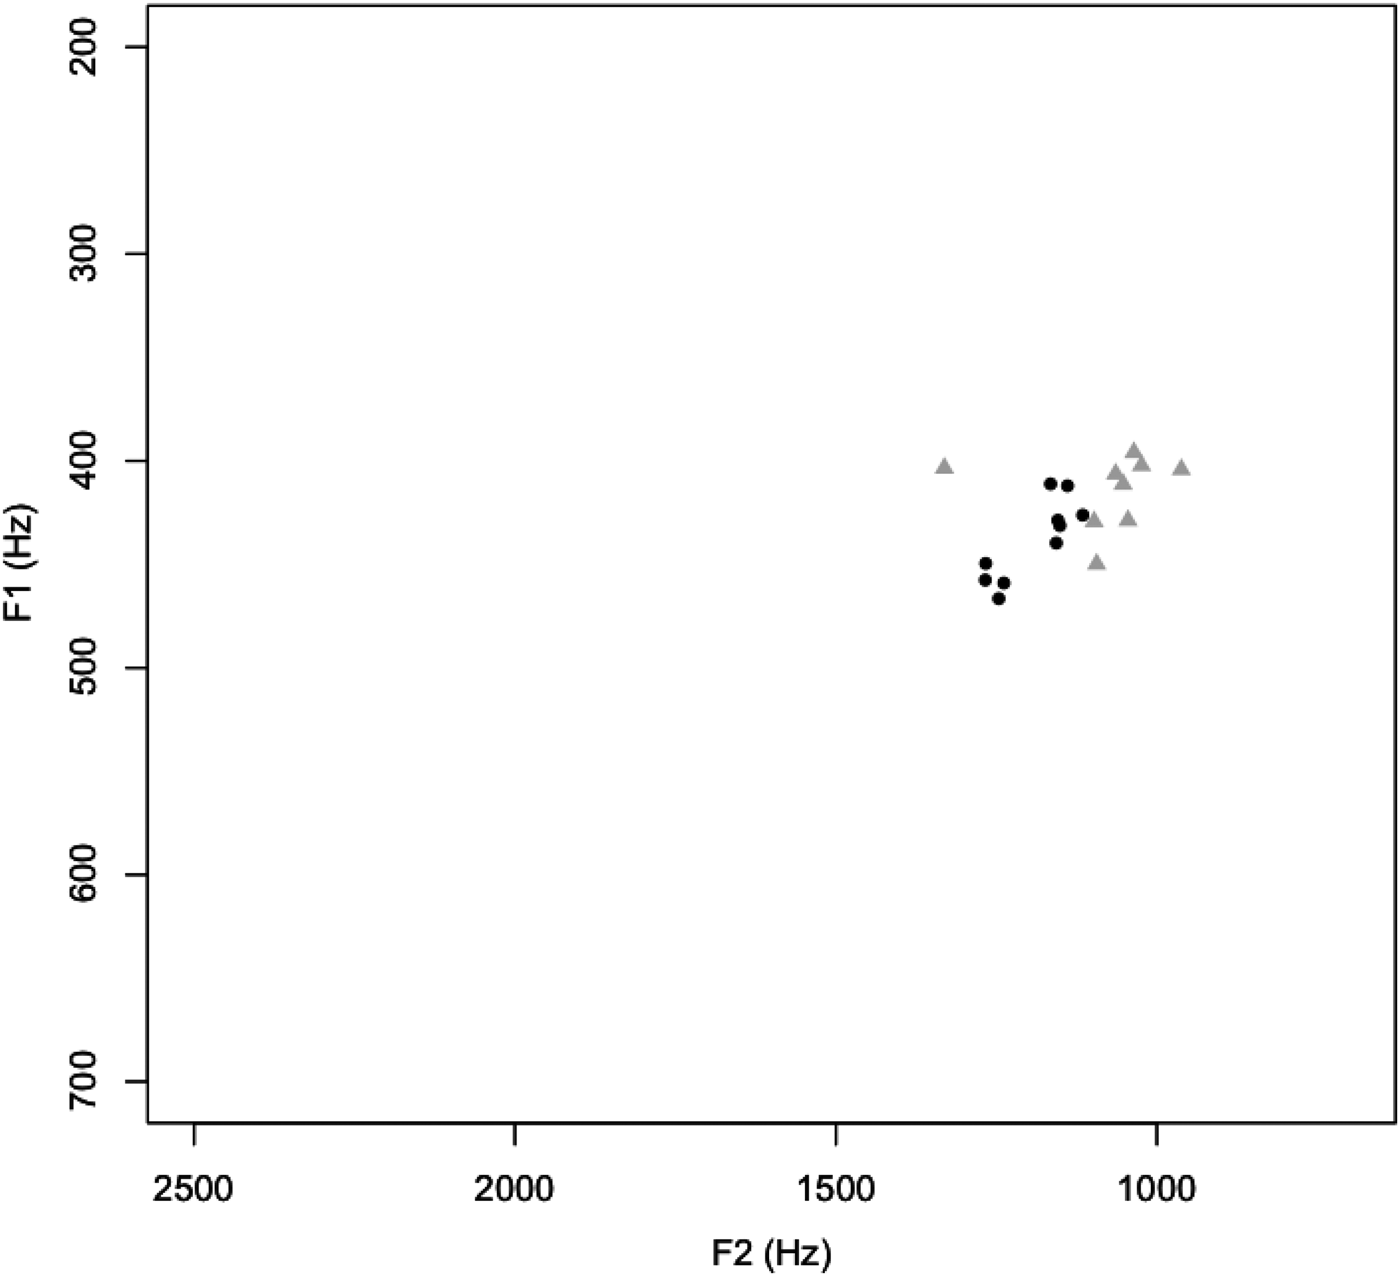
In the present study, we also find that the hoarse/horse distinction is comparatively conservative in apparent time. Figure 11 plots the mean F1/F2 of hoarse and horse for all 51 speakers. We find a statistically significant difference in both the F1 and F2 dimension (p < .0001). The positioning of the two vowels (hoarse slightly higher and backer than horse) is consistent with the examples in ANAE from Boston (Labov et al., Reference Labov, Ash and Boberg2006:226). In addition, as a complement to the speaker means plotted in Figure 11, Figure 12 provides an example of one speaker's individual hoarse/horse tokens (a 22-year-old man, speaker 29).
Speaker means for hoarse ( ) and horse (●). Significant at p < .0001 for both F1 and F2. The plot represents 51 speakers, 2 vowels, and 713 total tokens. Dotted lines represent standard deviations.
Example of a speaker with unmerged hoarse/horse. Individual tokens of hoarse () and horse (●) for a 22-year-old man (speaker 29). Significant at p < .012 for both F1 and F2.
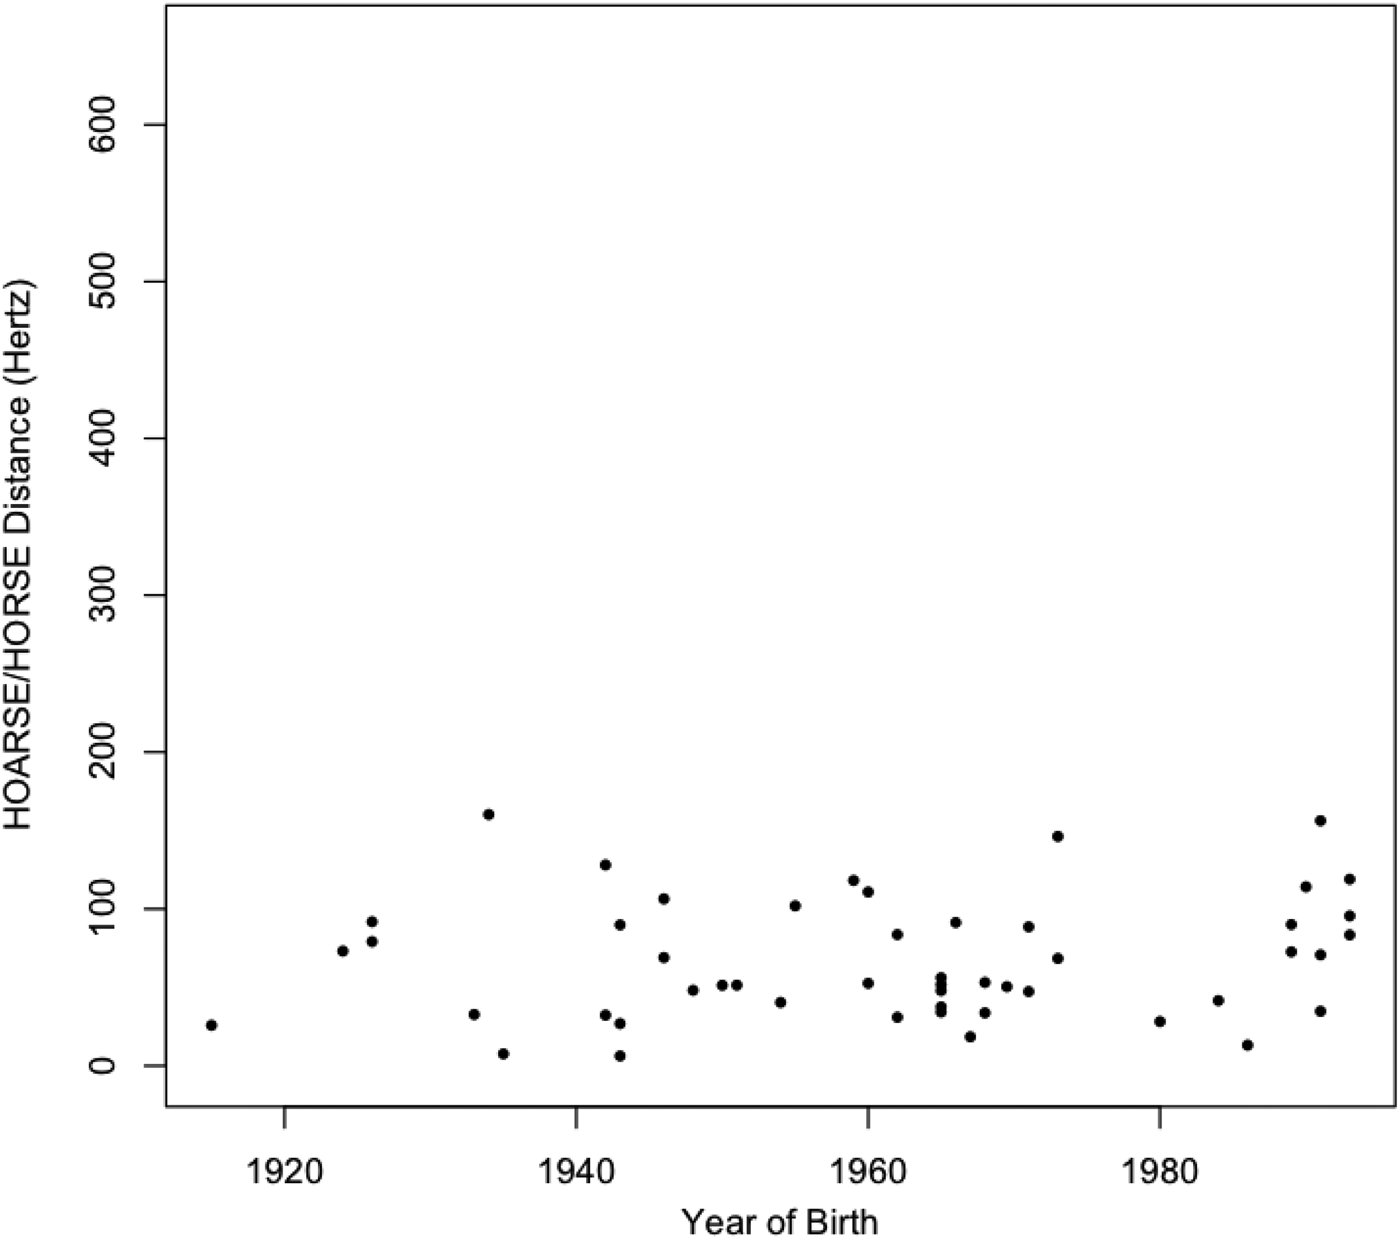
For our apparent-time analysis, we calculated the mean Euclidean distance between hoarse and horse for each speaker (Figure 13). Unlike the other variables in this study, the hoarse/horse distinction is not changing over time. Linear regression on birth year shows no significant effect (p = .3412, R 2 = .02). Linear mixed effects modeling showed no significant effects for birth year, gender, occupation, and education, with hometown as a random effect (as with intrusive-r, the factor speaker was not used as a random effect for horse/hoarse because there was only one row of data per speaker, i.e., a single distance score).
Birth year versus Euclidean distance between horse and hoarse (speaker means). p = .3412, R 2 = .01889.
mary/marry/merry
The LANE fieldwork found two- or three-way distinctions between mary, marry, and merry across much of New England, and most speakers in central New Hampshire had the three-way distinction (Dinkin, Reference Dinkin2005:map 1; Kurath & McDavid, Reference Kurath and McDavid1961:124–125, maps 49–51; Nagy & Roberts, Reference Nagy, Roberts, Schneider, Burridge, Kortmann, Mesthrie and Upton2004:277). Nagy's (Reference Nagy2001) questionnaire study showed stable variation in the mary/marry/merry distinction in New Hampshire. ANAE found the mary/marry/merry distinction receding in northern New England, but two- or three-way distinctions were still present among speakers in southeastern New England, New York, New Jersey, some South locations, and others (Labov et al., Reference Labov, Ash and Boberg2006:map 8.4).
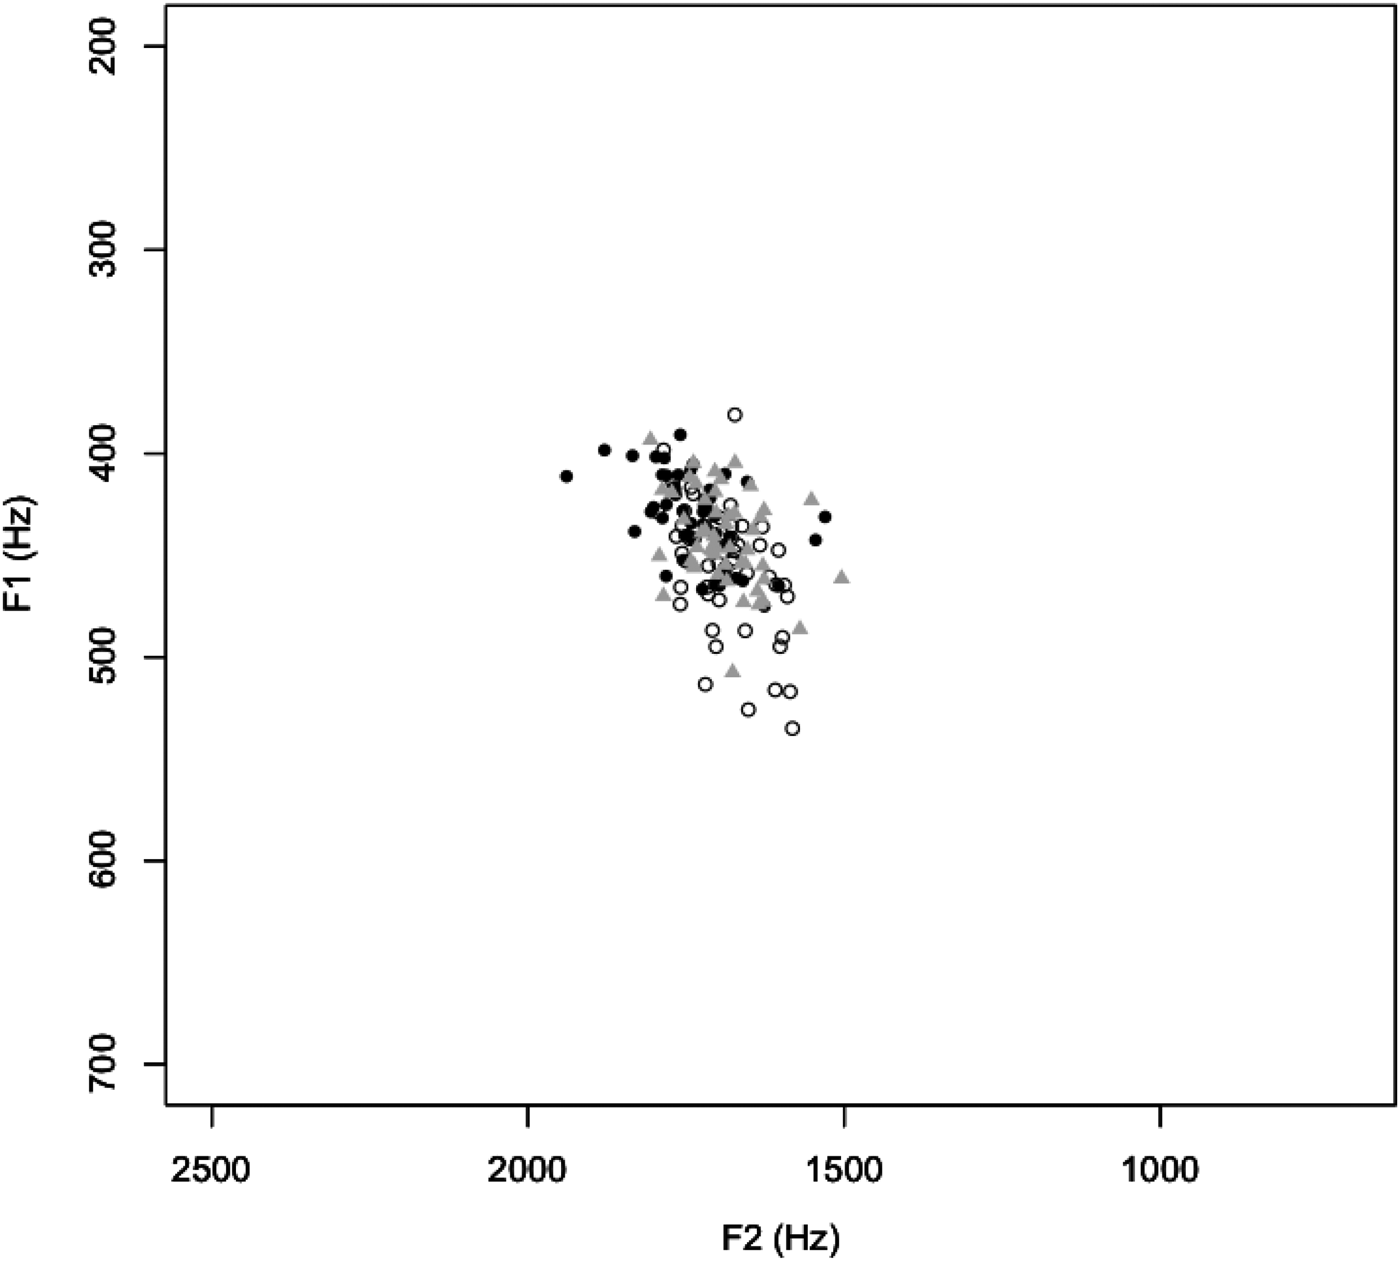
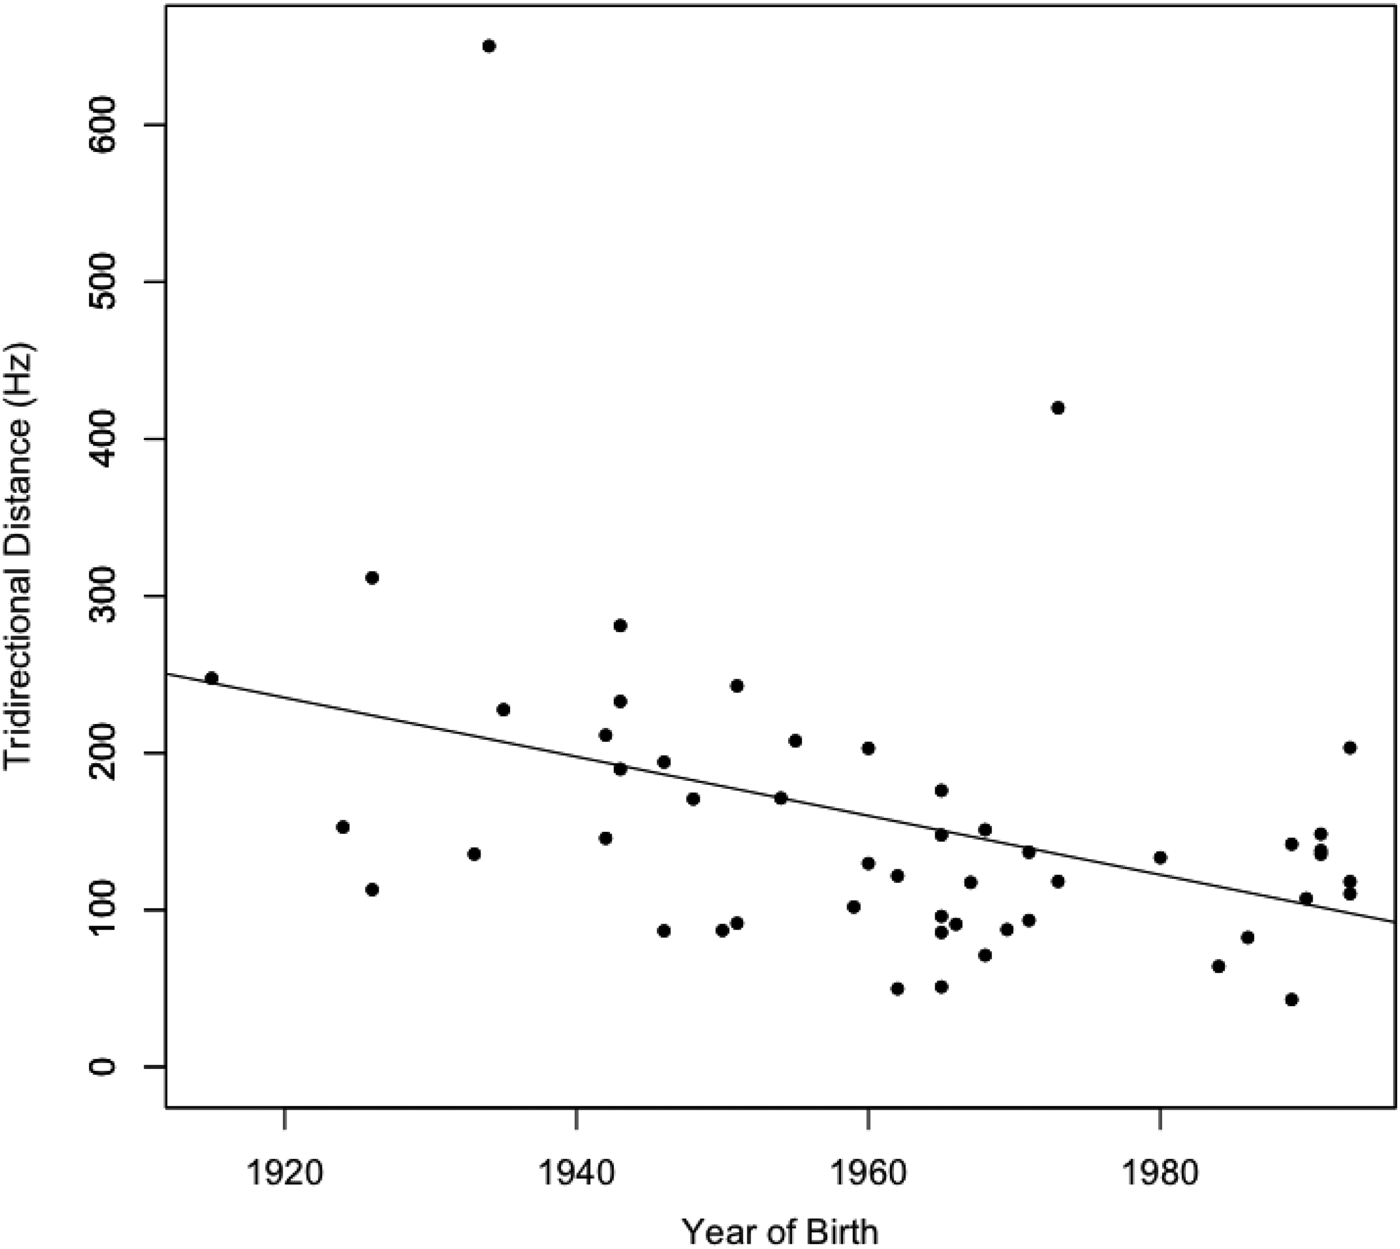
Our results suggest a change in progress for mary/marry/merry in rural central New Hampshire.Footnote 11 Unmerged pronunciations are receding, as younger speakers are more likely to be merged than older speakers are. First, we show speaker means for mary (●), marry (○), and merry (), providing an initial graphical view of distinctions among these vowels in the dataset (Figure 14). Next, we quantify the degree of distinction by means of a “tridirectional” distance calculated for each speaker, that is the Euclidean distance between mary and marryplus the Euclidean distance between mary and merryplus the Euclidean distance between marry and merry. Figure 15 plots the tridirectional distances of each speaker versus birth year, suggesting a change in progress as younger speakers tend to have lower tridirectional distances, that is, they tend to be more merged than older speakers are.
Speaker means for mary ●, marry ○, and merry (means of 51 speakers, 1018 total tokens).
Tridirectional distances for mary, merry, marry (speaker means). Slope = −1.88 Hz/year, p = .005, R 2 = .1499 (51 speakers).
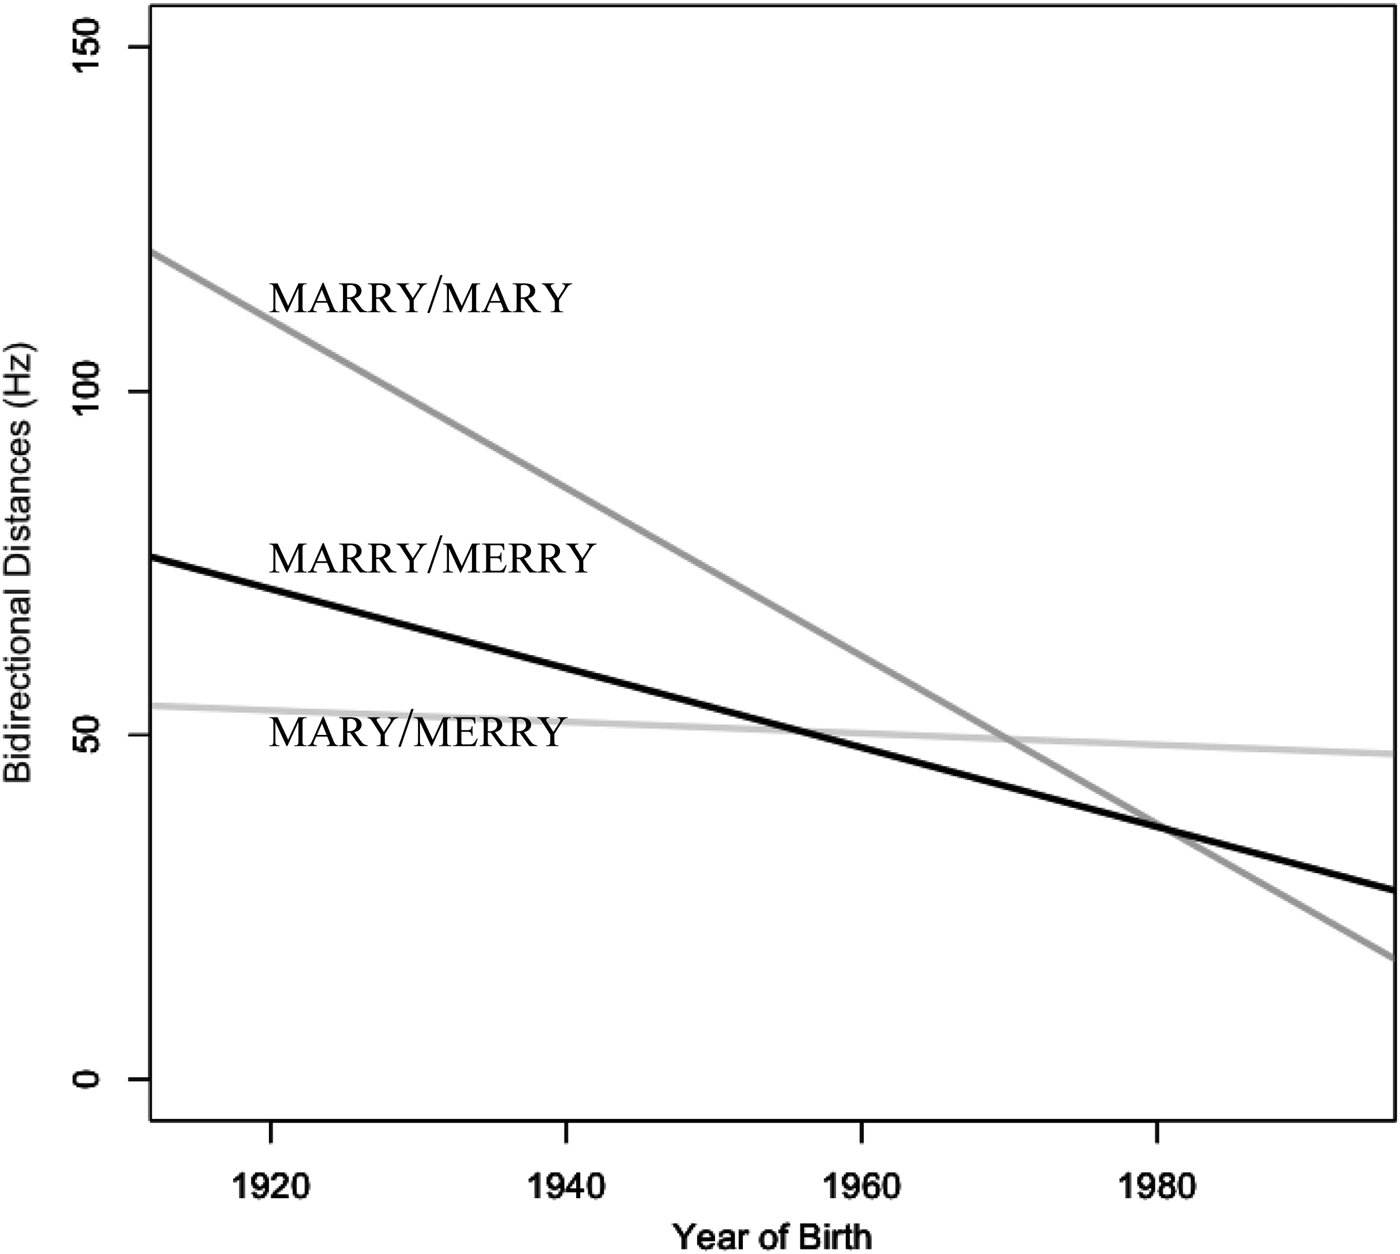
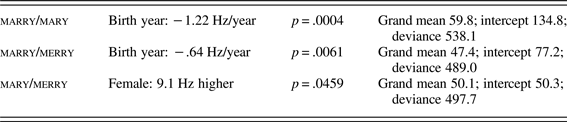
This graphical analysis is supported by a linear regression of tridirectional distance versus birth year: –1.88 Hz/year, p = 0.005, R 2 = .1499. Linear mixed effects modeling selected birth year in the step-up/step-down process, but no other factors (Table 8). Lastly, we examine bidirectional distances among the three vowels. Figure 16 shows the different slopes of change for the three pairings: mary/merry, marry/mary, and marry/merry. The greatest changes in apparent time were found in the two pairs involving marry, whereas mary/merry showed no significant change. In linear mixed effects modeling (Table 9), birth year was the only significant factor for marry/mary and marry/merry. For mary/merry, the only pair not involving marry, the only significant factor was gender.
Linear regressions on birth year versus mean paired distances: marry/mary = dark gray (R 2 = .218, slope = −1.22, p = .0006); marry/merry = black (R 2 = .139, slope = −.576, p = .007); mary/merry = light gray (n.s., R 2 = .0027, slope = −.084).
Linear mixed effects results for the tridirectional analysis of mary/marry/merry
Grand mean: 157.3; deviance: 605.5; intercept: 272.8

Note: Positive value indicates greater tridirectional distance.
Linear mixed effects results for mary/merry/marry analyzed in pairs
Note: Positive value indicates greater distance between the two vowels.
DISCUSSION AND CONCLUSION
Loss of traditional eastern New England features
About two centuries passed between the time of the early European settlements in central New Hampshire and the LANE-era fieldwork, approximately eight generations.Footnote 12 But current generations of speakers are now rapidly losing most of the traditional ENE features. In our apparent-time study of 51 speakers in rural central New Hampshire, we find that nonrhotic speech, intrusive-r, broad-a in bath, fronted father, fronted start, and unmerged mary/marry/merry are all receding. Only hoarse/horse is fully stable in apparent time. We note that the changes in these features are rapid but not sudden; there is no categorical drop-off between any two successive generations, even for the highly stigmatized features. Instead, these changes are occurring across multiple generations in apparent time.
How exactly are these changes being implemented? Among the seven different phonological variables involved in this major loss of traditional ENE features, we observe fine-grained differences in rates of change for different variables. In particular, we suggest that fronted start and hoarse/horse are susceptible to an under-the-radar effect because the (r) variable is sharing the same syllable with the vowel variables. We find that fronted father and nonrhotic speech are receding more quickly, and broad-a in bath has receded even faster. We also find that intrusive-r is statistically dependent on the presence of nonrhotic speech; the decline in intrusive-r is piggybacking the decline in nonrhotic speech. For each of these changes, successive generations have acquired the level of change appropriate for their particular generation. With these differential changes in mind, we interpret our overall findings in light of Labov's (Reference Labov2012) outward orientation of the language-learning capacity and Sankoff's (Reference Sankoff2013a) notion of age vectors.
Outward orientation
Labov determines that “children learn language from their caretakers but quickly depart from the patterns provided by those caretakers if it does not match the pattern of the wider community” (Reference Labov2012:267). In Labov's model, children are outwardly oriented toward a target speech community beyond their primary caregivers (see also Chambers, Reference Chambers2002:121–123). This suggests that the younger generations of speakers in central New Hampshire recognize that traditional ENE features do not represent the “proper target” of language learning. It is natural for the younger generations to reach this linguistic conclusion in parallel with their daily experiences of the ongoing changes in traditional ENE lifestyles.
First, as Roberts (Reference Roberts2006) pointed out, northern New England is rapidly shifting away from traditional agricultural occupations. Each new generation of northern New Englanders is moving farther and farther from the traditional agricultural society of earlier times, and linguistic features are associated with these changes as well. Other major social changes in New Hampshire include immigration and reduced isolation from other parts of the country. The “back to the land” movement of the 1960s and 1970s had a strong role in changing New Hampshire's social and cultural outlook, as thousands of people left large East Coast cities and moved up to northern New England (Wooster, Reference Wooster1998:135–139). In the 1950s, only 12,000 new residents moved into New Hampshire. The number of newcomers then suddenly increased to 69,000 in the 1960s as the back-to-the-land movement took hold, and then further increased to 136,000 in the 1970s and 117,000 in the 1980s (Nagy & Irwin, Reference Nagy and Irwin2010:247, citing Ferrie, Reference Ferrie2006, and Wood, Reference Wood2011; cf. K. Johnson, Reference Johnson2007, Reference Johnson2012). Our apparent-time results show dialect changes that parallel these disruptive social changes in the region.
Our ethnographic interviews also suggest cultural changes and clashes of lifestyles. For example, an older New Hampshire man referred to the newcomers as “poison” and whimsically suggested building a wall around his whole town to keep them out. A local preteen boy was once heard using the regional phrase “down-cellar,” such as, “Do you want to go play down-cellar?” But after some time playing with a new boy who had moved into the neighborhood from out of state, the local boy now says, “Do you want to go play in the basement?,” which is a leveled, supraregional version. Such anecdotes provide glimpses into the large-scale processes of leveling, immigration, increasing supraregional contact, and “expanded identity” (Hazen, Reference Hazen2000:128). Younger generations in central New Hampshire are acquiring a set of emerging, supraregional norms for the community, and each new generation is incrementing the next step in these changes (Labov, Reference Labov2001:446–465; Reference Labov2007; Tagliamonte & D'Arcy, Reference Tagliamonte and D'Arcy2009).
Age vectors
The major ENE shift described here is not monolithic; we have seen a number of fine-grained contrasts among the variables, and we must also keep in mind the possibility of some degree of “lifespan change” among older speakers (Sankoff, Reference Sankoff2013a, Reference Sankoff, Bayley, Cameron and Lucas2013b; Sankoff & Blondeau, Reference Sankoff and Blondeau2007). It is clear that different variables have different rates of change in central New Hampshire, and young language learners must somehow grasp these differences during the acquisition process. Sankoff explains, “children are alive to the vector, actively looking to those who are just a little older than themselves as models” (Reference Sankoff2013a:38). Our results support Sankoff's analysis that children align themselves to a vector of change. We also find that such young speakers can handle multiple vectors at the same time within the same overall shift.
How is it that this ENE shift involves so many different vectors? Why are some of the phonological variables changing at faster rates than others are? Contrasts in perceptual and social salience are likely sources of some of these differences. As we have suggested, certain variables like nonrhotic speech, intrusive-r, and broad-a bath have been reported to have a high degree of social salience. Given the significant demographic and lifestyle changes in recent generations, it is not surprising that many young speakers would avoid features that have a clear connection to traditional eastern New England. Nonrhotic speech and intrusive-r have now declined to the point that they are almost obsolete among the younger speakers in our study. The obsolescence of broad-a bath is positioned about one generation earlier in apparent time.
But why are there different age vectors for start versus father, and why does horse/hoarse seem to be immune to these changes entirely? We have proposed that the under-the-radar effect, previously suggested by research around the Vermont–New Hampshire border (Stanford et al., Reference Stanford, Leddy-Cecere and Baclawski2012), is active in central New Hampshire as well. Specifically, start and horse/hoarse both contain two variables within the same syllable: the postvocalic (r) variable and a vowel variable. As a result, fronted start and horse/hoarse may be overshadowed by (r). If this analysis is correct, younger speakers are carefully producing rhotic speech, overlooking the continuing presence of traditional New England fronted start and horse/hoarse distinctions in their speech.
We hope that future research in New England can quantify perceptual contrasts between “salient” and “subtle” variables, perhaps helping with the challenges of defining salience itself (Siegel, Reference Siegel2010:120–127; see also Auer, Barden, & Grosskopf, Reference Auer, Barden and Grosskopf1998; Hinskens, Auer, & Kerswill, Reference Hinskens, Auer, Kerswill, Auer, Hinskens and Kerswill2005:45; Kerswill & Williams, Reference Kerswill, Williams, Jones and Esch2002; Trudgill, Reference Trudgill1986:11–21), and examining further issues of style (Coupland, Reference Coupland2007; Schilling-Estes, Reference Schilling-Estes2002). It may be that young speakers in central New Hampshire perceive the stigmatized aspects of certain variants clearly enough to move significantly away from their parents’ speech, yet they might not perceive that their own speech continues to retain some traditional ENE characteristics. We look forward to future fieldwork or experiments focused on these questions.
APPENDIX A
ANAE notation corresponding to the each of the lexical sets (Wells, Reference Wells1982) in this study.
start: /ahr/ bath-trap: /æ/ hoarse: /ohr/ horse: /ɔhr/ thought: /oh/
bother-lot: /o/ father: /ah/ mary: /eyr/ marry: /ær/ merry: /er/
APPENDIX B
Interview materials.
Word list
roof, way, riding, laugh, outside, short, father, dog, Ted, don't bother, thought, Sue, see, say, boat, tree, do, rather, Vermont, loud, dusk, mouse, go, spider, ban, documentary, why, ma and pa, path, thief, socks, desk, cut, farm, tax, writing, trap, fishhook, Mary, bat, law, dance, hood, wash, barn, first, hid, marry, toe, bad, white, tough, push, bang, huckleberry, bath, six, start, palm, merry, coarse, bag, hex, fire, Tuesday, route, tiger, wide, balm, coffee, talk, writer, shot, rider, stalks, cherry, calm, taught, hot, scary, Larry, New Hampshire
Reading passage
Adapted from Nagy's (Reference Nagy2009) “How to Survive a New England Winter” (see Nagy & Irwin, Reference Nagy and Irwin2010).
People who are new to New England often worry about how to get through New England's fierce winters. Although our winters might appear to be unpleasant, New Englanders have many ways of keeping warm. When asked the question, “How do you make it through the winter up there?” many natives assure newcomers not to fear that they will be cold or bored. In fact, snow is part of the allure of New England, and many of us enjoy skiing and participating in other winter sports and outdoor rituals. Most tourists only come to the northeast in the summer or the fall—often for weddings, since couples like to get married near the beach or in the fall foliage (and this commerce helps our economy very much). But New England does not shut down in the wintertime! On the other hand, a blizzard takes over every few years. The worst storm in recent history is the “Blizzard of ’78,” a snowstorm which brought in three to four feet of snow. The following words are from an article by Mary U. of North Dartmouth, Massachusetts:
“It started out like any other snowstorm that I remember. The dainty flakes were descending slowly from the dark gray sky as if to show the world that the storm could not be rushed. It was actually calmer than it usually was before a storm. But the snow got harder and harder, and seeing our path through the snow-covered sidewalk was rather difficult. Of course, the view was gorgeous outside, a magical garden of snow among the maple trees. Because we had no electricity, I felt like Mary Ingalls, the pioneer girl. If we wanted to take a bath, we had to heat the water in the fireplace. I learned a lot from the sheer simplicity of life during that week—like a polar bear in nature. What a winter that was!”
Sentence list
1. My father doesn't bother to take off his shoes at home.
2. My Aunt Mary is planning to marry a generous, merry old man.
3. Every afternoon out on the farm, my aunt takes care of a calf.
4. I caught a cold because I slept on a cot by the window.
5. This horse seems to have a hoarse throat.
6. That story about the witch has some scary topics which might frighten kids.
7. I calmly took the candy heart from his palm.
APPENDIX C
Testing the automated FAVE system: 10 speakers (5 women, 5 men, randomly chosen). “Difference” = absolute value of [mean of the manual approach] – [mean of the automated approach].