1. Introduction
Despite the well-documented evidence that poor neonatal health is linked to an array of worse adult outcomes [Almond et al. (Reference Almond, Chay and Lee2005), Black et al. (Reference Black, Devereux and Salvanes2007), Oreopoulos et al. (Reference Oreopoulos, Stabile, Walld and Roos2008), Figlio et al. (Reference Figlio, Guryan, Karbownik and Roth2014)], critical gaps remain in our understanding of the consequences of poor birth outcomes, which can include low birth weight, preterm birth, and other abnormal birth conditions. In particular, we have limited knowledge of the scope of effects of poor neonatal health on the family. A child with poor neonatal health may require more financial resources and parental time investment than a child born without any complications. If the economic toll on the family is substantial, then the adverse effects of poor birth outcomes on the child may be significantly compounded. Moreover, the prevalence of poor birth outcomes is higher among low-income mothers [National Research Council and Institute of Medicine (Reference Shonkoff and Phillips2000)]. Children from low-income families generally have limited access to care and credit, and even those with insurance might face additional barriers to adequate care and treatment [Van Cleave et al. (Reference Van Cleave, Gortmaker and Perrin2010)]. Disparities in poor birth outcomes can therefore have persistent and magnifying effects on income and health inequality. Understanding the spillover effects of poor neonatal health on families is critical in formulating policies to support the well-being of these children and their families.
In this paper, we leverage administrative birth record data merged with longitudinal survey data from the Fragile Families and Child Wellbeing Study to examine the consequences of poor neonatal health on both the child and the family. The Fragile Families Study follows, from birth to age 15 over six survey waves, about 5,000 children born between 1998 and 2000, and their parents. We examine a comprehensive range of outcomes that capture the economic circumstances of these families: including child health, maternal labor supply, safety net program participation, household income, poverty, maternal mental health, and parental relationship. Because families who have a child with a poor birth outcome may be systematically different from those who do not, we use entropy balancing [Hainmueller (Reference Hainmueller2012)] to generate weights that achieve a high degree of covariate balance among a large set of pre-birth characteristics between treated and non-treated families—derived from both the administrative medical record data and the detailed baseline survey data.
Our study builds upon the body of work that has examined the effects of neonatal health on various outcomes, including cognitive development and child disability [Figlio et al. (Reference Figlio, Guryan, Karbownik and Roth2014), Elder et al. (Reference Elder, Figlio, Imberman and Persico2019)], adult earnings and education [Black et al. (Reference Black, Devereux and Salvanes2007), Oreopoulos et al. (Reference Oreopoulos, Stabile, Walld and Roos2008)], maternal labor supply [Corman et al. (Reference Corman, Noonan and Reichman2005)], benefit receipt [Reichman et al. (Reference Reichman, Corman and Noonan2004), Guldi et al. (Reference Guldi, Hawkins, Hemmeter and Schmidt2018)], and household income [Porterfield and Tracey (Reference Porterfield and Tracey2003)], and parental relationship [Reichman et al. (Reference Reichman, Corman and Noonan2004), Swaminathan et al. (Reference Swaminathan, Alexander and Boulet2006)]. Our contribution to the literature is three-fold. First, we use administrative medical record data that contain detailed health information of the infant and mother. We show that mothers who experience a poor birth outcome—who we will refer to as being “treated” henceforth—are different in commonly examined demographic characteristics (e.g., race and age). Moreover, they exhibit stark differences in medical and psychosocial risk factors that we obtained from the confidential medical record data, such as involvement in the criminal justice system, experience with domestic violence, and substance use during pregnancy. These differences highlight the need for an empirical approach that takes into account the endogeneity of poor birth outcomes, as well as the strength of the administrative medical record data. Second, we use entropy balancing to generate weights that achieve covariate balance between treated and non-treated families on a large (more than 60) set of pre-birth characteristics. We show that using entropy balancing greatly enhances comparability between treated and non-treated families along all examined measures with respect to both first and second moments. Finally, our data are longitudinal, which allows us to follow the children and their families from birth until age 15 (even if they have moved to another state). To our knowledge, this is the longest panel that have been studied on the topic of child disability in the US.
We present several key findings. Our analysis shows that one-fifth of children born to urban families have a poor birth outcome. The most common abnormal birth conditions are low birth weight (10.6%), followed by assisted ventilation for more than 30 min (7.2%) and birth injury (6.8%). Our estimates using weights constructed from entropy balancing suggest that children who had poor neonatal health are much more likely to be diagnosed with a disability, especially one related to neurodevelopmental disorders. We find evidence that treated mothers decrease labor force participation at both the intensive and the extensive margins, especially when the child is young. Treated children are also much more likely to receive Supplemental Security Income (SSI), and treated mothers are more likely to receive benefits from the Supplemental Nutrition Assistance Program (SNAP) and the Temporary Assistance for Needy Families (TANF) program. Household income among treated families is on average lower, but the difference is not statistically significant in any wave. Similarly, treated households are not significantly more likely to be in poverty, possibly as a result of the additional financial support they receive from safety net programs. Parents of children with poor neonatal health are much less likely to be married or cohabitating in any wave. The probability of maternal depression, on the other hand, does not appear to be affected significantly by poor neonatal health. Results are consistent when using alternate definitions of poor neonatal health, including when we consider only “exogenous” abnormal birth conditions that were unlikely to be caused by maternal prenatal behavior (e.g. chromosomal disorders).
The rest of the paper proceeds as follows. Section 2 describes the data, followed by a discussion of the empirical strategy in Section 3. Section 4 reports and discusses the key findings. Section 5 offers several exercises to test the sensitivity of our results. Section 6 concludes.
2. Data description
To examine how poor neonatal health affects the family, we use data from the Fragile Families and Child Wellbeing Study, a rich, longitudinal data set that follows a cohort of 5,000 children born between 1998 and 2000 from birth to around age 15. The survey is designed to be representative of births in cities with a population of 200,000. A goal of the study was to obtain data to develop an understanding of how children fare when born into families that are “fragile” (more vulnerable to poverty and breakup), and how policies and environmental conditions affect these families.
The survey currently has six waves of data. The baseline interview (“wave 1”) took place in the hospital at the time of the focal child's birth. Follow-up interviews occurred when the focal child was age 1 (“wave 2”), 3 (“wave 3”), 5 (“wave 4”), 9 (“wave 5”), and 15 (“wave 6”). The study used a complex, multi-stage clustered sampling design, with an oversample of unmarried parents. Although births among unmarried females were oversampled, the data, when weighted or regression adjusted, represent all hospital births in large cities between 1998 and 2000 [see Reichman et al. (Reference Reichman, Teitler, Garfinkel and McLanahan2001 for details)]. We use the city weighting scheme to provide a representative picture of children from the 22 cities that participated in the survey.
The study has several features that make it particularly valuable for assessing the effects of having a child with poor neonatal health on the household. The Fragile Families Study collected crucial administrative medical-record data that were drawn from birth hospitalization records for mothers and focal children, and we use the birth record data to define poor neonatal birth. In particular, birth certificates in the US have a section titled “abnormal conditions of the newborn,” which we use to define poor neonatal health. These conditions include low birth weight, preterm birth, chromosomal abnormalities, and other indicators of abnormal birth conditions.Footnote 1 Table 1 reports the birth conditions (categorized in the same way as they are in the birth certificate data) that we use to define poor neonatal health and the frequency of those conditions in the sample. The most common types of abnormal birth conditions are (1) low birth weight, followed by (2) respiratory issues that require assisted ventilation for more than 30 min, and (3) preterm birth. The conditions listed in Table 1 are not mutually exclusive: roughly 8% in our sample of 3,681 births have two or more abnormal birth conditions (for example, infants born preterm are often low birth weight, and such infants are more likely to have underdeveloped lungs and concomitant breathing problems). In Section VI, we test the sensitivity of the results to two alternate definitions of poor neonatal health.
Birth conditions used to define poor neonatal health

Note: Birth conditions are not mutually exclusive. Means are estimated using the city sample weights.
* Indicates conditions that (based on current medical knowledge) are unlikely to be caused by maternal prenatal behavior as determined by an external pediatric consultant appointed by the Fragile Families Study. We use these “exogenous” conditions in a sensitivity analysis in Section V.
One association of interest is that between poor neonatal health and the likelihood of being diagnosed with a disability or chronic health condition in later childhood. To define child disability, we use health information reported by the primary caregiver. The questions and specific conditions vary somewhat from wave to wave, partly to reflect the age of the children. In the second and third waves, when the focal child is about 1 and 3, respectively, the primary caregiver is asked whether the child has any disabilities, and after an affirmative binary response, the respondent is further asked to classify the disability type among a given list (refer to the data appendix for the full list). Starting in the fourth wave, the pertinent question changed to “Has a doctor or health professional ever told you that (CHILD) has any of the following health conditions?” Questions about attention-deficit/hyperactivity disorder (ADHD) and autism were added beginning in wave 4 when the child was about 5. The addition in later waves makes sense because it is often impossible to diagnose such conditions at earlier ages. We broadly code the child as having a diagnosed disability if the primary caregiver responded “yes” to the binary question in waves 2 and 3 and to any of the listed disabilities in wave 4 onward. The data appendix provides a detailed description of the survey questions and the types of disabilities covered in each wave.
In addition to child health, we measure the effects of poor neonatal health on an encompassing range of outcomes that measure the economic circumstances and well-being of the household, including maternal labor supply, earnings, household benefit receipt, household income, financial distress, maternal depression, and parental marital status. For maternal labor market activity, the survey asks about labor market status, including whether currently working, hours of work, and earnings at each job.Footnote 2 The study also contains detailed information on household participation in various safety net programs: TANF, SNAP, SSI, and other forms of public assistance, such as unemployment insurance and workers' compensation.Footnote 3 We also examine the associations of having an infant born in poor health and household income, as well as household poverty status.Footnote 4
Finally, we examine whether poor neonatal health affects maternal mental health, which we consider to be a novel contribution to the literature. Recent research has shown that as many as one in seven mothers experience perinatal mood and anxiety disorders, and the cost of untreated maternal depression is high in the United States [Luca et al. (Reference Luca, Garlow, Staatz, Margiotta and Zivin2019)]. The psychological stress of having a child with a poor birth outcome is conceivably large, and could be further exacerbated among the lower socioeconomic status families that make up the Fragile Families sample. It is therefore of policy interest to examine whether maternal mental health is affected by poor neonatal health. The Fragile Families Study constructed two measures of maternal depression (conservative and liberal) based on the mother's responses to a standard series of questions intended to measure the severity of depression. We use the conservative definition as the dependent variable.
3. Empirical strategy
The key challenge in our empirical analysis is that the mothers and families who have a child born in poor health (“treated” families) may differ systematically from mothers and families who do not. For example, women who are more educated might be more likely than less-educated women to obtain prenatal care and less likely to have a child with preterm birth. The effect of having a child with a poor birth outcome might therefore be biased in a research design that does not take into account the potential endogeneity of having an adverse birth outcome.
Our analysis uses weighting methods with entropy balancing to flexibly control for the observed differences between mothers who did and did not have a child with a poor birth outcome. While this approach naturally cannot rule out selection based on unobservable factors, we can include an extensive list of pre-birth covariates to model the probability of having an infant with poor neonatal health.
To achieve covariate balance in a large set of measures between treated and non-treated households, we use entropy balancing, which can be thought of as a generalization of the conventional propensity score weighting approach where the researcher first estimates the unit weights with logistic regression and then conducts balance checks to see whether the estimated weights help enhance comparison between treatment and comparison groups. However, in practice, such estimated propensity score weights can fail to balance the covariate moments, even when manually cycling through multiple iterations between propensity score modeling, matching, and balance checking to search for a suitable balancing solution. Researchers have found that slight misspecification of the propensity score model can result in substantial bias of estimated treatment effects [Smith and Todd (Reference Smith and Todd2005), Kang and Schafer (Reference Kang and Schafer2007)]. Entropy balancing works “backward” by estimating the weights directly from the imposed balance constraints. The entropy-balancing scheme then searches for a set of weights that satisfy the balance constraints, while striving to keep the weights as close as possible to the set of uniform base weights in order to retain efficiency for the subsequent analysis. A key advantage of entropy balancing is that it ensures balance on all covariate moments included in the reweighting, which precludes the need for continual balance checking and iterative searching over propensity score models that may stochastically balance the covariate moments [Hainmueller (Reference Hainmueller2012)].Footnote 5
We conduct entropy balancing to generate separate weights for each wave and each outcome separately to ensure covariate balance in both first and second moments for each model that is being estimated. To the extent there may be varying missingness of outcomes or differential attrition for treated and non-treated families across outcomes and waves, reweighting for each outcome by wave helps ensure covariate balance in each model that is being estimated. We incorporate the city sampling weights into both the entropy reweighting scheme and the outcomes analysis to take into account the complex sampling design and response rates over waves [Ridgeway et al. (Reference Ridgeway, Kovalchik, Griffin and Kabeto2015)].Footnote 6 We include a large set of baseline covariates that are potentially associated with the treatment and outcome for entropy balancing (Table 2).
Differences in pre-birth measures, weighted and unweighted

Note: Descriptive statistics are produced using the mother baseline city sample weights. Mother's earnings include zeros (those who do not work). Sample years for the baseline survey include 1998 to 2000.
*Absolute value of the standardized difference >0.05. ^Variance ratio >2 or <0.5.
We then use the unit weights determined through entropy balancing to generate weighted least squares estimates. Following Rosenbaum and Rubin (Reference Rosenbaum and Rubin1983), our main interest is in the estimation of the average treatment effect on the treated (ATT) for the sample of treated women, so that the weights for treated women in the sample are 1 and the weights for non-treated women are $\hat{w}_i$ , constructed through entropy balancing. For the estimation of the ATT, the outcome variable, Yit, is regressed on the treatment dummy variable, PoorBirthOutcome i, applying the individual weights, $\hat{w}_i$
 . Intuitively, observations are weighted so that greater weight is given to units that are more similar to the treated units. Robust standard errors are clustered by the primary sampling unit. We prefer weighted least squares using the weights generated through entropy balancing because weighting does not impose linearity among the large set of covariates we use, but we also present OLS results in the Appendix.
We present descriptive statistics for baseline characteristics that are used to estimate the weights through entropy balancing in Table 2. It is evident that families who experience an adverse birth outcome are different at baseline from those who do not. In terms of sociodemographic characteristics, treated mothers are more likely to be Black, less likely to be Hispanic, less likely to be married, and more likely to work. More revealingly, treated mothers have higher rates of many psychosocial flags typically not observed in survey data, which could confound both the likelihood of poor neonatal health and the outcomes of interest. For example, treated mothers are more likely to be reported (in birth record data) as having suspected parenting inadequacy, to experience domestic violence, and to be involved in the criminal justice system. These differences highlight the nuanced differences between treated and non-treated families and the need for an empirical strategy to improve comparability between the two groups. After we apply entropy balancing, covariate balance is achieved as expected: standardized differences shrink to zero, and the variance ratio becomes 1 for all baseline measures, demonstrating the strength of entropy balancing to facilitate covariate balancing.Footnote 7
To see how characteristics of families in the Fragile Families Study change in the years since the child's birth, we examine summary statistics of key variables in the subsequent waves (Table 3). The variables shown in Table 3 are somewhat different from the baseline variables presented in Table 2, because the baseline survey asked questions that were different than those asked in the subsequent waves, over which the surveys also changed. For example, SSI receipt by a household member was no longer asked in the sixth wave but was instead grouped with other types of benefits. Overall, the statistics show slight upward trends in earnings and household income over the age of the child. Notably, there is a somewhat larger jump in earnings and household income between the fifth and sixth waves than between the other waves. This can perhaps be explained in part by the fact that there were 6 years between those two waves vs 4 years between the fourth and fifth waves (and even shorter intervals between prior waves).Footnote 8 We next examine whether the trajectories of these outcomes vary significantly between families who have a child born with poor neonatal health and those who do not.
Summary statistics of key variables by wave

SSI, Supplemental Security Income; TANF, Temporary Aid to Needy Families; SNAP, Supplemental Nutrition Assistance Program
Note: Descriptive statistics are produced using the analytic sample in each wave (defined as the sample for whom we have birth record data) and mother wave-specific city sample weights. Number of observations are unweighted.
a Hours worked are conditional upon working.
b Earnings include those with zero earnings.
4. Results
All results discussed in this section are estimated using weights constructed using entropy balancing. We use figures to illustrate the estimated average treated outcomes for treated families and counterfactual means for waves 2 to 6 (the estimated mean of the outcome if the treated families had not experienced a poor birth outcome).Footnote 9 The difference between the two lines thus represents the ATT. To facilitate comparison with other studies and to reveal the extent to which entropy reweighting changes the coefficients, we also estimate models for each outcome using OLS and report the results in appendix tables A1 to A4.Footnote 10 Because we use city weights, the results are representative of children born in cities with a population of 200,000.
We first examine the subsequent health trajectories of infants with poor neonatal health.
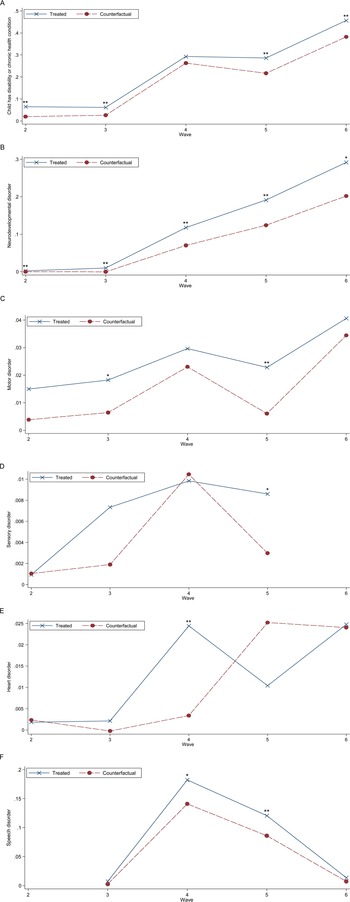
Indeed, children who have poor neonatal health are significantly more likely to be classified as having a disability in subsequent years (Table 4; Figure 1A). In particular, treated children are more likely to develop neurodevelopmental disorders and are at heightened risk of developing motor and speech disorders (Table 4; Figure 1B to F). It is worth noting that even the counterfactual proportion of children who develop disabilities or chronic health conditions is high. Nonetheless, being born with a poor birth outcome is associated with a substantial increase in the likelihood of being diagnosed with a disability, but the increase diminishes in magnitude over time. When they are age 1, treated children are three times more likely to be diagnosed with any disability (6.7% vs 2.2%). By the time they are age 3, treated children are more than twice as likely to be diagnosed with a disability (6.7% vs 3.1%). By the time they are age 5, the increased risk of being diagnosed with a disability for treated children falls to around 14% (24.9% vs 21.9%). Treated children are 30% more likely to be diagnosed with a disability in the fifth wave when they are 9 (30.3% vs 23.4%), and 20% more likely in the sixth wave, when they are 15 (44.4% vs 37.0%). One potential explanation for the diminished gap in the likelihood of diagnoses in later years is that children who had a poor birth outcome may be subject to more extensive follow-up care and monitoring in early childhood, whereas many disabilities for non-treated children may not be diagnosed until they enter school.
Impact of poor neonatal health and subsequent child disability

Note: Each cell represents the weighted least squares estimate from a separate regression, using weights constructed through entropy balancing. Robust standard errors in parentheses are clustered by the national sampling unit. Sensory disorders include blindness and deafness. Motor disorders include problems with limbs and cerebral palsy. Neurodevelopmental disorders include developmental, autism, and attention deficit hyperactivity disorders. N.A. = the referenced disability was not asked about in the survey wave.
*/**/***Statistically significant at the 0.10/.05/.01 level.
Impact of poor neonatal health on subsequent child disability. (A) Any child disability. (B) Neurodevelopmental disability. (C) Motor disability. (D) Sensory disability. (E) Heart disorder. (F) Speech disorder.
Note: Lines represent the regression-adjusted treated and counterfactual outcome means. Sensory disorders include blindness and deafness. Motor disorders include problems with limbs and cerebral palsy. Neurodevelopmental disorders include developmental, autism, and attention-deficit/hyperactivity disorders.
*/**/***Statistically significant at the 0.10/.05/.01 levels.

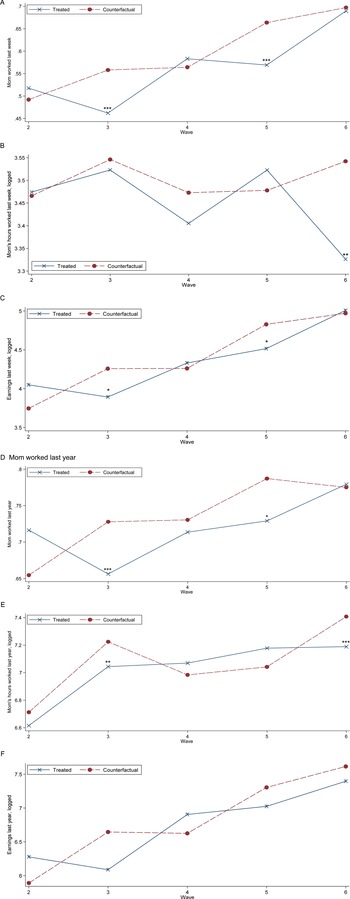
We then examine the consequences of having a child born in poor health on maternal labor supply and earnings (Table 5 and Figure 2). In Figure 2, we show that treated mothers on average have lower labor force participation rates and work fewer hours, but the statistical significance of the coefficients suggests that the impacts of poor neonatal health on maternal labor force activity may be larger at the extensive margin, at which treated mothers are more likely to withdraw from the labor force, especially in the third wave, when the child is 3. Treated mothers also tend to work fewer hours last year (if working), especially in the earlier waves, when the child is young. This might be explained by the intensive time required to care for a young child who had a poor birth outcome. While the measures of labor market activity are somewhat noisy, the net impact on maternal earnings is qualitatively consistent, with the decline in earnings being the largest in waves 3 and 5, when mothers are more likely to withdraw from the labor force.
Impact of poor neonatal health on maternal labor market activity

Note: Each cell represents the weighted least squares estimate from a separate regression, using weights constructed through entropy balancing. Robust standard errors in parentheses are clustered by the national sampling unit. Hours worked are conditional upon working. Earnings are augmented by 1 before logging and include those with zero earnings.
*/**/***Statistically significant at the 0.10/.05/.01 level.
Impact of poor neonatal health on maternal labor market activity. (A) Mom worked last week. (B) Mom's hours worked last week, logged. (C) Mom's earnings last week, logged. (D) Mom worked last year. (E) Mom's hours worked last year, logged. (F) Mom's earnings last year, logged.
Note: Lines represent the regression-adjusted treated and counterfactual outcome means. Hours worked are conditional upon working. Earnings are augmented by 1 before logging and include those with zero earnings.
*/**/***Statistically significant at the 0.10/.05/.01 level.

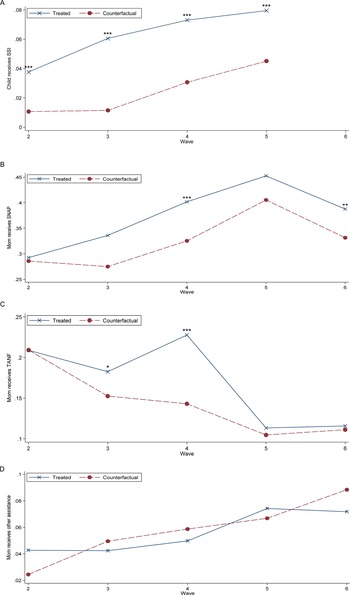
We find that children who had poor neonatal health are much more likely to receive child SSI (Table 6; Figure 3). Treated children are almost four times as likely to receive SSI by the time they are 1, relative to those who did not have a poor birth outcome (4.9% vs 1.3%). Treated children are close to five times as likely to receive SSI by the time they are 3 in wave 3 (7.1% vs 1.5%), close to three times as likely by the time they are 5 (5.6% vs 2.0%), and close to twice as likely by the time they are 9 (6.4% vs 3.6%). Treated mothers also have higher mean likelihoods of benefit receipt from SNAP and TANF relative to if they had not been treated, but not from other forms of public assistance.
Impact of poor neonatal health on benefit receipt

Note: Each cell represents the weighted least squares estimate from a separate regression, using weights constructed through entropy balancing. Robust standard errors in parentheses are clustered by the national sampling unit. SSI = Supplemental Security Income; SNAP = Supplemental Nutrition Assistance Program; TANF = Temporary Assistance for Needy Families; N.A. = not available because the outcome was not asked about in the survey wave.
*/**/*** Statistically significant at the 0.10/.05/.01 level.
Impact of poor neonatal health on benefit receipt. (A) Child SSI receipt. (B) Mom's SNAP receipt. (C) Mom's TANF receipt. (D) Mom's receipt of other public assistance program benefits.
Note: Lines represent the regression-adjusted treated and counterfactual outcome means. Hours worked are conditional upon working. Information on child SSI receipt was not available in wave 6.
*/**/***Statistically significant at the 0.10/.05/.01 level.

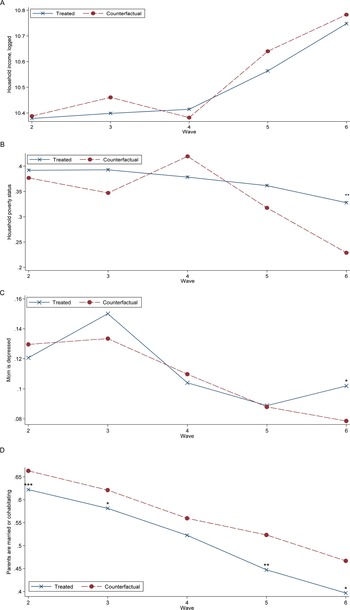
We do not find any significant effects of poor neonatal health on household income (Table 7; Figure 4A). Similarly, we do not find any statistically significant differences in the likelihood of household poverty among treated families, except in wave 6 (Table 7; Figures 4B).
Impact of poor neonatal health on household well-being

Note: Each cell represents the weighted least squares estimate from a separate regression, using weights constructed through entropy balancing. Robust standard errors in parentheses are clustered by the national sampling unit.
*/**/***Statistically significant at the 0.10/.05/.01 level.
Impact of poor neonatal health on household well-being. (A) Household income, logged. (B) Poverty. (C) Mother experienced depression last year. (D) Parents married or cohabiting.
Note: Lines represent the regression-adjusted treated and counterfactual outcome means.
*/**/***Statistically significant at the 0.10/.05/.01 level.

Finally, we examine two additional indicators of household well-being: maternal mental health and parental relationship status. Treated mothers do not have significantly different likelihoods of experiencing depression in subsequent waves, relative to what they otherwise would have experienced, except in wave 6 (Table 7; Figure 4C). However, our estimates indicate that poor neonatal health negatively affects the likelihood of parents being married or cohabiting in subsequent waves, with the magnitude of the effect growing over time. (Table 7; Figure 4D).
We present OLS estimates results in the Appendix (tables A1 to A4). In general, raw differences are larger between treated and non-treated groups, which likely reflects preexisting differences in other confounders. Once we control for potential confounders, the estimates become much closer to those reported in the main tables. This analysis highlights both the need to control for baseline characteristics and the strength of entropy balancing to reduce the high dimensionality of a large set of baseline measures while ensuring covariate balance.
5. Sensitivity analyses
We conduct two exercises to examine how results vary with alternative definitions of poor neonatal health.Footnote 11 First, we define it using only low birth weight (under 2,500 g) and preterm birth (<37 weeks), a commonly used definition of a poor birth outcome in the medical literature. Results are mostly similar when we use this definition, but there are several notable differences. First, the likelihood of being diagnosed with a child disability is higher when compared to the main results, which suggests that low birth weight and preterm births are stronger predictors of child disability. Second, treated mothers appear to increase labor force participation at both the intensive and the extensive margin in wave 2, when the child is 1. It is possible that low birth weight and preterm birth are conditions that impose heavier financial relative to time burdens, driving mothers to work more. We do not have sufficient sample size to delve into a detailed subgroup analysis in this paper, and so we leave examining the heterogeneous effects by different birth conditions as a future research topic.
Second, we define poor neonatal health using only birth conditions that are considered not to be directly caused by maternal prenatal behavior. The coding of infants' abnormal health conditions was conducted by an outside pediatric consultant (appointed by the Fragile Families Study) who determined, from the birth record data and 1-year maternal reports of child disability, how likely it was that the mother's prenatal behavior caused the condition.Footnote 12 The motivation behind this sensitivity test is that even though we employ entropy reweighting, we might not have accounted sufficiently for omitted variable bias caused by unobserved differences when considering all abnormal birth conditions. By using only conditions that are plausibly exogenous, we may be better able to identify the causal effects of poor neonatal health. When we code poor neonatal health using only these conditions and exclude the sample of infants whose abnormal birth conditions were coded as likely to be caused by maternal behavior, the weighted estimates remain qualitatively similar for most dependent variables (Table 8).Footnote 13 In particular, the estimated effects on SSI receipt and child disability remain very similar. However, the effects on poverty and household income become more pronounced. Treated households are now more likely to have lower income and to be in poverty than if they had not been treated. This suggests that the effects on household economic well-being may be even more severe than we found in the main analysis. The second interpretation of these findings is that each condition that makes up their treatment indicator for poor neonatal health at birth has a different treatment effect on later life outcomes. It could be that all the conditions included in the main “treatment” definition are as good as randomly assigned, but the conditions included in the main definition and not in the “exogenous” set had a smaller effect on later life outcomes. In this case, the main analysis results are simply a weighted average of a different set of treatment effects compared to the “exogenous” treatment analysis result, and both sets of estimates could be considered the “true” effects of poor neonatal health, depending on how poor neonatal health is defined.
Sensitivity analyses: using different definitions of poor neonatal health

Note: Each cell represents the weighted least squares estimate from a separate regression, using weights constructed through entropy balancing. Robust standard errors in parentheses are clustered by the national sampling unit. Sample in Panel A excludes children who did not have low birth weight or preterm birth but had other abnormal birth conditions. Sample in Panel C excludes children who had abnormal birth conditions that were coded as likely to be caused by maternal behavior. SSI, Supplemental Security Income. N.A., not available because the outcome was not asked about in the survey wave.
*/**/***Statistically significant at the 0.10/.05/.01 level.
6. Conclusion
Using administrative birth record data combined with a 15-year panel of survey data from the Fragile Families Study, this paper offered a unique examination of the consequences of poor neonatal health among urban families. We show that about one-fifth of infants born among these families are born in poor health, with low birth weight and respiratory difficulties being the most common abnormal birth conditions. Further, we demonstrate that families who have infants born in poor health are different from other families in many dimensions, which suggests that these families are a non-random sample. To account for selection bias, we use entropy balancing and weighted least-square estimators to obtain the treatment on the treated effects of poor neonatal health. By using entropy balancing, we are able to achieve allow covariate balancing between treated and non-treated families on a large set of pre-birth characteristics, including variables derived from the administrative medical record data that are typically not observed in survey data (e.g. maternal medical conditions, psychosocial and situational risk factors).
The results suggest that the consequences of poor neonatal health are substantial. Poor neonatal health may demand time-intensive resources, leading treated mothers to work less at both the intensive and the extensive margin, especially when the child is younger. Children with poor neonatal health are much more likely to be diagnosed with a disability, which in turn leads to higher SSI receipt. Treated households are also more likely to receive benefits from SNAP and TANF. Treated mothers are much less likely to be married or cohabitating with the child's father, relative to the counterfactual, which suggests that the stress from having a child in poor health could lead to ruptures in already “fragile” families. Somewhat reassuringly, treated households are not any more likely to experience poverty or declines in household income, which could be due to the buffering effects of income obtained from safety net programs. We also do not find any significant differences in the likelihood of maternal depression, though we examine only one measure of mental health. Further work is needed to assess whether other aspects of parental mental health are affected.
Our study highlights the broad consequences of poor neonatal health on the family, and suggests that the spillover effects on the family could act as additional pathways through which neonatal health affects adult outcomes. By understanding how poor neonatal health affects these key household outcomes, the findings could provide insight on policies aimed to alleviate the negative relationship between early poor health and later-life outcomes. More research is needed to understand whether the provision of follow-up care of infants with poor birth outcomes, especially among low-income populations, can significantly alter health trajectories. This includes further investigation into how best to ensure adequate assessments that allow for timely identification of needs for early intervention services. Further work to shed light on the extent to which perinatal interventions can remediate the disadvantage of poor birth outcomes can help guide policy designed to improve outcomes of children with poor neonatal health. Continued research to cast light on the spillover effects of poor birth outcomes and child disability on families, such as parental mental health, are equally needed to understand how best to support these especially vulnerable families.
Supplementary material
The supplementary material for this article can be found at https://doi.org/10.1017/dem.2022.4.
Financial support
This work was supported by the U.S. Social Security Administration (SSA) as part of the Disability Research Consortium. The opinions and conclusions expressed are solely those of the author(s) and do not represent the opinions or policy of SSA or any agency of the Federal Government. Neither the United States Government nor any agency thereof, nor any of their employees, makes any warranty, expressed or implied, or assumes any legal liability or responsibility for the accuracy, completeness, or usefulness of the contents of this report.