


Introduction
During the general survey of economically important freshwater fishes of the Meerut region, two important and commonly available fish, namely Wallago attu and Silonia silondia, were found harbouring two new species of the genus Thaparocleidus Jain, Reference Jain1952. These two hosts are known to harbour several other important monogenean genera besides Thaparocleidus Jain, Reference Jain1952. The genus Thaparocleidus was proposed by Jain (Reference Jain1952) for the species T. wallagonius from the gills of W. attu (Bloch & Schneider) at Lucknow, India. Subsequently, Gusev (Reference Gusev1976) proposed the genus Silurodiscoides, to which many species of the genus Thaparocleidus were transferred. However, Lim (Reference Lim1996) pointed out that Thaparocleidus is a senior synonym of Silurodiscoides and listed 80 species of Thaparocleidus Jain, Reference Jain1952. Lim et al. (Reference Lim, Timofeeva and Gibson2001) listed dactylogyrid monogeneans of siluriform fishes of the Old World and tentatively considered 77 species of Thaparocleidus valid and questioned the validity of certain Indian species, emphasizing the need to ascertain the status of some species from Indian fish.
Polymerase chain reaction (PCR) technology and DNA sequencing techniques permit the identification of species, strains and populations from any stage in their life history and also enable morphologically similar parasites to be distinguished (Lockyer et al., Reference Lockyer, Olson and Littlewood2003; Olson et al., Reference Olson, Cribb, Tkach, Bray and Littlewood2003). The nuclear rDNA gene repeat unit harbours different regions that evolve at varying rates, and thus has also been used extensively in the study of variation and phylogeny at several different taxonomic levels. So far, many nuclear rDNA genes have commonly been used in intraspecies or interspecies molecular systematics (Blaxter et al., Reference Blaxter, De Ley, Garey, Liu, Scheldeman, Vierstraete, Vanfleteren, Mackey, Dorris, Frisse, Vida and Thomas1998; Vilas et al., Reference Vilas, Criscione and Blouin2005). Moreover, in platyhelminth systematics, rDNA genes, in general, have been used successfully (Pouyaud et al., Reference Pouyaud, Desmarais, Deveney and Pariselle2006; Šimková et al., Reference Šimková, Matejusová and Cunningham2006; Lee et al., Reference Lee, Chun and Huh2007) and 28S rDNA, in particular, to estimate the relationships existing among the Platyhelminthes (Olson et al., Reference Olson, Cribb, Tkach, Bray and Littlewood2003). Monogenean sequences of partial large subunit rDNA have been used successfully to study phylogenetic relationships at higher levels, i.e. family and subfamily (Mollaret et al., Reference Mollaret, Jamieson, Adlard, Hugall, Lecointre, Chombard and Justine1997, Reference Mollaret, Jamieson and Justine2000a; Littlewood et al., Reference Littlewood, Rohde and Clough1998; Jovelin & Justine, Reference Jovelin and Justine2001), and generic levels (Mollaret et al., Reference Mollaret, Lim and Justine2000b; Chisholm et al., Reference Chisholm, Whittington, Morga and Adlard2001; Justine et al., Reference Justine, Jovelin, Neifar, Mollaret, Lim, Hendrix and Euzet2002; Olson & Littlewood, Reference Olson and Littlewood2002; Whittington et al., Reference Whittington, Deveney, Morgan, Chisholm and Adlard2004; Wu et al., Reference Wu, Chilton, Zhu, Xie and Li2005, Reference Wu, Zhu, Xie, Wang and Li2008; Šimková et al., Reference Šimková, Matejusová and Cunningham2006; Lee et al., Reference Lee, Chun and Huh2007).
In India, using molecular sequence analysis and studying phylogenetic relationships among the parasitic helminths is not common. The aim of the present investigation was to describe the morphology of the new species and to use sequences of the 28S rDNA region to estimate the genetic variation and phylogenetic relationship among various species of the genus Thaparocleidus Jain, Reference Jain1952. In addition to this, secondary structures have also been predicted to substantiate the findings.
Methods
Parasites
Monogeneans were collected from the gills of Wallago attu (Bloch & Schneider, Reference Bloch and Schneider1801) and Silonia silondia (Hamilton, Reference Hamilton1822) from Meerut (29°01′N and 77°45′E), UP, India, according to the method suggested by Malmberg (Reference Malmberg1970). Both species of fish belong to the order Siluriformes, family Siluridae and Schilbeidae, respectively. They are economically important food fishes of India. A morphological study of the monogeneans was made as suggested by Malmberg (Reference Malmberg1970). A light microscope equipped with a differential interference contrast, digital image analysis system (Motic digital microscope for Windows, B1 series, Xiamen, People's Republic of China) was used for morphometric analysis.
DNA extraction and amplification
Identification of the monogeneans was made with the help of morphology of the haptoral hard parts and copulatory complex. Subsequently, one identified specimen of monogenen was fixed in either 95 or 100% ethanol for extraction of genomic DNA (DNeasy Tissue Kit, Qiagen, Hilden, Germany). The 28S region was amplified with the specifically designed forward primer (5′-TCAGTAAGCGGAGGAAAAGAA-3′) and reverse primer (5′-CAAAACCACAGTTCTCACAGC-3′). Each amplification reaction was performed in a final volume of 25 μl containing 3 μl of lysate, 10 × polymerase chain reaction (PCR) buffer, 1 U Taq polymerase (Biotools, Madrid, Spain), 0.4 mm deoxyribonucleotide triphosphates (dNTP) and 10 pm of each primer pair in a thermocycler (Eppendorf Mastercycler personal; Eppendorf, Hamburg, Germany). PCR products were examined on 1.5% agarose–TBE (Tris–borate–EDTA) gels, stained with ethidium bromide and visualized under ultraviolet light.
DNA sequencing and phylogenetic analyses
Amplification products were purified by a Chromous PCR clean up kit (#PCR 10, Chromous Biotech, Bangalore, India). Gel-purified PCR products were sequenced using a Big Dye Terminator version 3.1 cycle sequencing kit in ABI 3130 genetic analyser (Applied Biosystems, Foster City, California, USA) with the same primers. Sequences were aligned using the program Clustal W (Thompson et al., Reference Thompson, Higgins and Gibson1994). The algorithm starts by computing a rough distance matrix among each pair of sequences based on pairwise sequence alignment scores. These scores were computed using the pairwise alignment parameters for DNA. Many other Thaparocleidus species used in this study were from locations such as China, the Czech Republic and Malaysia. We chose species according to the database's identity matches with these two new species (see fig. 3 for their location and accession numbers). Phylogenetic trees were reconstructed using MEGA version 5 (Tamura et al., Reference Tamura, Peterson, Peterson, Stecher, Nei and Kumar2011). Phylogenetic analyses were performed based on neighbour-joining (NJ) and maximum-parsimony (MP) methods. For constructing the MP tree, only sites at which there are at least two different kinds of nucleotides or amino acids, each represented at least twice, were used (parsimony-informative sites). Other variable sites were not used for constructing the MP tree, although they were informative for distance and maximum-likelihood methods. All positions containing gaps, and missing data, were eliminated. In reconstructing the NJ tree, the Kimura two-parameter model was used to estimate the distances. Kimura's two-parameter model (Kimura, Reference Kimura1980) corrects for multiple hits, taking into account transitional and transversional substitution rates, while assuming that the four nucleotide frequencies are the same and that rates of substitution do not vary among sites. In order to obtain the most parsimonious tree, the Max–mini branch-and-bound search strategy was used. Robustness of the inferred phylogeny was assessed using a bootstrap procedure with 1000 replications. Large subunit rDNA gene sequences of T. siloniansis sp. n. and T. longiphallus sp. n. extracted in this study were deposited in GenBank under the accession numbers GU980973 and GU980972, respectively.
Prediction of secondary structures
RNA secondary structures were determined using Sfold (Software for Statistical Folding and Rational Design of Nucleic Acids) in the Sribo program based on a statistical sample of the Boltzmann ensemble for secondary structures (Ding & Lawrence, Reference Ding and Lawrence2003). Subsequently, the inferred structure was examined for stems, loops and bulges. Since GC content is known to influence structural energy, GC percentage was therefore determined using a GC calculator (http://www.genomicsplace.com/gc_calc.html). Energy levels of presumptive secondary structures were then calculated with Mfold (Jaeger et al., Reference Jaeger, Turner and Zuker1989; Zuker et al., Reference Zuker, Mathews, Turner, Barciszewski and Clark1999). The MARNA web server (Siebert & Backofen, Reference Siebert and Backofen2005) was used to align 28S sequences with a secondary-structure format, based on both the primary and secondary structures. The default setting, base deletion, was scored 2.0, base mismatch 1.0, arc removing 2.0, arc breaking 1.5, and mismatch 1.8 with ensemble of shaped structures.
Results
Thaparocleidus longiphallus sp. n.
Type of host. Wallago attu (Bloch & Schn.).
Type of locality. Meerut (29°01′N, 77°45′E), UP, India.
Site of infection. Gills.
Etymology. The specific name is from Latin (longi= long+phallus= penis) and refers to the size of the male copulatory complex.
Deposition of type specimens. The holotype and paratype slides have been deposited in the museum of the Department of Zoology (voucher number HS/Monogenea/2010/01), CCS University, Meerut, UP, India.
Description. The body is elongated with blunt anterior and posterior ends measuring 0.75–0.80 × 0.08–0.10 mm (fig. 1a). The head has three pairs of head organs and two pairs of eyespots. The posterior pair of eyespots is larger than the anterior pair due to the presence of a greater number of melanistic granules. The pharynx is muscular and spherical, measuring 0.031–0.034 mm in diameter. The intestine is simple, bifurcated and the crura unite posteriorly, anterior to the haptor.
Thaparocleidus longiphallus sp. n. (a) Whole mount; (b) eggs; (c) male copulatory complex; (d) dorsal anchor and dorsal transverse bar; (e) ventral anchor and ventral transverse bar; (f) hook.
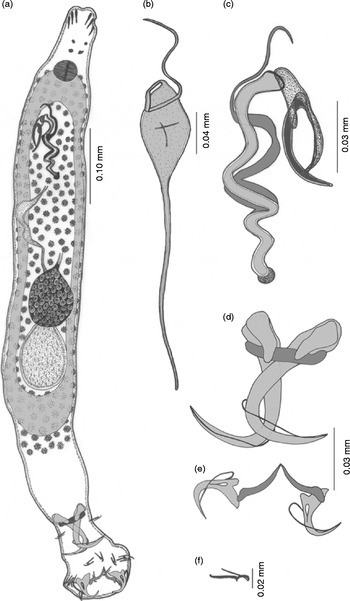
The ovary is intercaecal, pre-testicular, slightly overlapping the anterior margin of the testis, elongate oval in outline, measuring 0.072–0.080 × 0.032–0.051 mm. The eggs are elongated in outline, double walled, measuring 0.09–0.10 × 0.03–0.04 mm. The outer membrane of the egg is strengthened with two polar filaments located at either pole, measuring 0.18–0.21 mm (fig. 1b). Vitelline follicles are densely spread and co-extensive with intestinal caeca. The male reproductive system comprises a testis, vas deferens, seminal vesicle, vasa efferentia and cirrus. The testis is single, elongated, pear-shaped, intercaecal, post-ovarian, post-equatorial, measuring 0.09–0.10 × 0.06–0.07 mm. A fine vas deferens arises from the anterior border of the testis, runs forward and convolutes over the intestinal crura and extends further anteriorly and dilates to make an elongated seminal vesicle in the pre-equatorial region, anterior to the ovary. The seminal vesicle measures 0.008–0.009 × 0.022–0.026 mm. From the seminal vesicle, a narrow tube, the vasa efferentia or ejaculatory duct, arises, which opens at the base of the male copulatory complex. The male copulatory complex (fig. 1c) consists of the cirrus proper and three accessory pieces. The cirrus proper is a long chitinoid, zigzag tube with a slightly swollen base with the anterior part thin and pointed, measuring 0.26–0.28 mm in length. The basic accessory piece runs along the entire length of the cirrus and extends beyond the cirrus as a whip, measuring 0.29–0.32 mm. The other accessory piece is fist-shaped, measuring 0.05–0.06 mm. The third accessory piece is in the form of a sickle attached with the thumb of the fist, measuring 0.04–0.05 mm.
The opisthaptor is set off from the body proper and measures 0.13 × 0.09 mm. The armature of the haptor has two pairs of anchors (dorsal and ventral), a dorsal transverse bar, a ventral transverse bar and seven pairs of marginal hooklets. The dorsal anchors (fig. 1d) are with a recurved point, an elongated inner root, but an almost inconspicuous outer root measuring 0.16–0.18 mm. The shaft of the dorsal anchor is cylindrical and strengthened by the presence of sleeve sclerites. At the base of the inner root of the dorsal anchor, small inwardly directed conical patches (capitula) are present, measuring 0.04–0.05 mm. The dorsal transverse bar has outwardly projecting ends, the mesial portion of the bar is projected backwards, measuring 0.04–0.05 mm (fig. 1d). The ventral anchors (fig. 1e) are much smaller as compared with the dorsal, with short recurved points and small bifid roots measuring 0.05–0.06 mm. Between the two roots, a small oval vacuity is present. The base of the ventral anchors is broad, the shaft is short, cylindrical, supported by the sleeve sclerite and points are recurved. The ventral transverse bar is a paired, wide, inverted ‘V’-shaped bar with swollen outer ends measuring 0.06–0.07 mm each (fig. 1e). Marginal hooklets are with a flattened heel, sickle-shaped blade and a swollen handle which is slightly outwardly directed, measuring 0.01–0.03 mm. The sickle filament loop is attached at the distal part of the sickle on the ventral side (fig. 1f).
Remarks. A survey of the literature revealed that the following species of the genus Thaparocleidus have been described from the gills of the fish W. attu: T. indicus (Kulkarni, Reference Kulkarni1969) Lim, Reference Lim1996, T. wallagonius Jain, Reference Jain1952 and T. gomtius (Jain, Reference Jain1952) Lim, Reference Lim1996. The present worm can be distinguished morphologically from T. indicus in having very large patches on the dorsal anchor, ventral anchors are with vacuities, the inner root of the ventral anchor is larger and pointed, ventral bars are pointed centrally, the cirrus is coiled and is strengthened with a similarly coiled accessory piece in addition and a fist-shaped accessory piece is also present. The specimens at the disposal of the authors differ from T. wallagonius in having larger patches at the base of the dorsal anchor, difference in shape of the dorsal transverse bar, ventral anchors are with prominent roots at the base and vacuities, ventral transverse bars are pointed centrally and have swollen outer ends, the cirrus is not spirally coiled and is also strengthened with a similarly coiled accessory piece in addition and a fist-shaped accessory piece is also present. Moreover, the present worm differs from T. gomtius in having ventral anchors with prominent roots whereas roots are with a broad base and vacuities in T. gomtius, ventral transverse bars are pointed centrally and have swollen outer ends; the cirrus is not spirally coiled and is strengthened with a similarly coiled accessory piece in addition and a fist-shaped accessory piece is also present, but in T. gomtius the cirrus proper is a small, straight tube and foliate with bifurcated ends. In addition to this, it is distinguished from all the Thaparocleius species described from India from various hosts in the shape of the male copulatory complex and haptoral armature.
Thaparocleidus siloniansis sp. n.
Type of host. Silonia silondia (Ham.).
Type of locality. Meerut (29°01′N, 77°45′E), UP, India.
Site of infection. Gills.
Etymology. The specific name is derived from the host.
Deposition of type specimens. The holotype and paratype slides have been deposited in the museum of the Department of Zoology (voucher number HS/Monogenea/2010/02), CCS University, Meerut, UP, India.
Description. The body is elongated with blunt anterior and posterior ends, measuring 0.70–0.75 × 0.10–0.12 mm (fig. 2a). The cephalic region is bluntly triangular, having four pairs of head organs and two pairs of eye spots. The pharynx is spherical, measuring 0.03–0.04 mm in diameter. The oesophagus is short, the intestine simple, bifurcated and the crura unite posteriorly, anterior to the haptor. The testis is a single, elongated, oval, intercaecal, post-ovarian, post-equatorial structure measuring 0.080–0.085 × 0.050–0.055 mm. The male copulatory complex consists of an accessory piece and cirrus proper. The cirrus is filamentous, swollen at the base, measuring 0.30–0.40 mm in length. The accessory piece measures 0.25–0.26 mm wider than the cirrus, runs all along the length of the cirrus, and is forked at the distal end and provides space for gliding the tip of the cirrus proper (fig. 2b). The ovary is oval, posteriorly overlaps one-quarter of the anterior portion of the testis, is equatorial, intercaecal, pre-testicular and elongated, and measures 0.070–0.075 × 0.050–0.055 mm. Vitelline follicles are densely spread along the intestinal caeca.
Thaparocleidus siloniansis sp. n. (a) Whole mount; (b) male copulatory complex; (c) dorsal anchor and dorsal transverse bar; (d) ventral anchor and ventral transverse bar; (e) hooks.
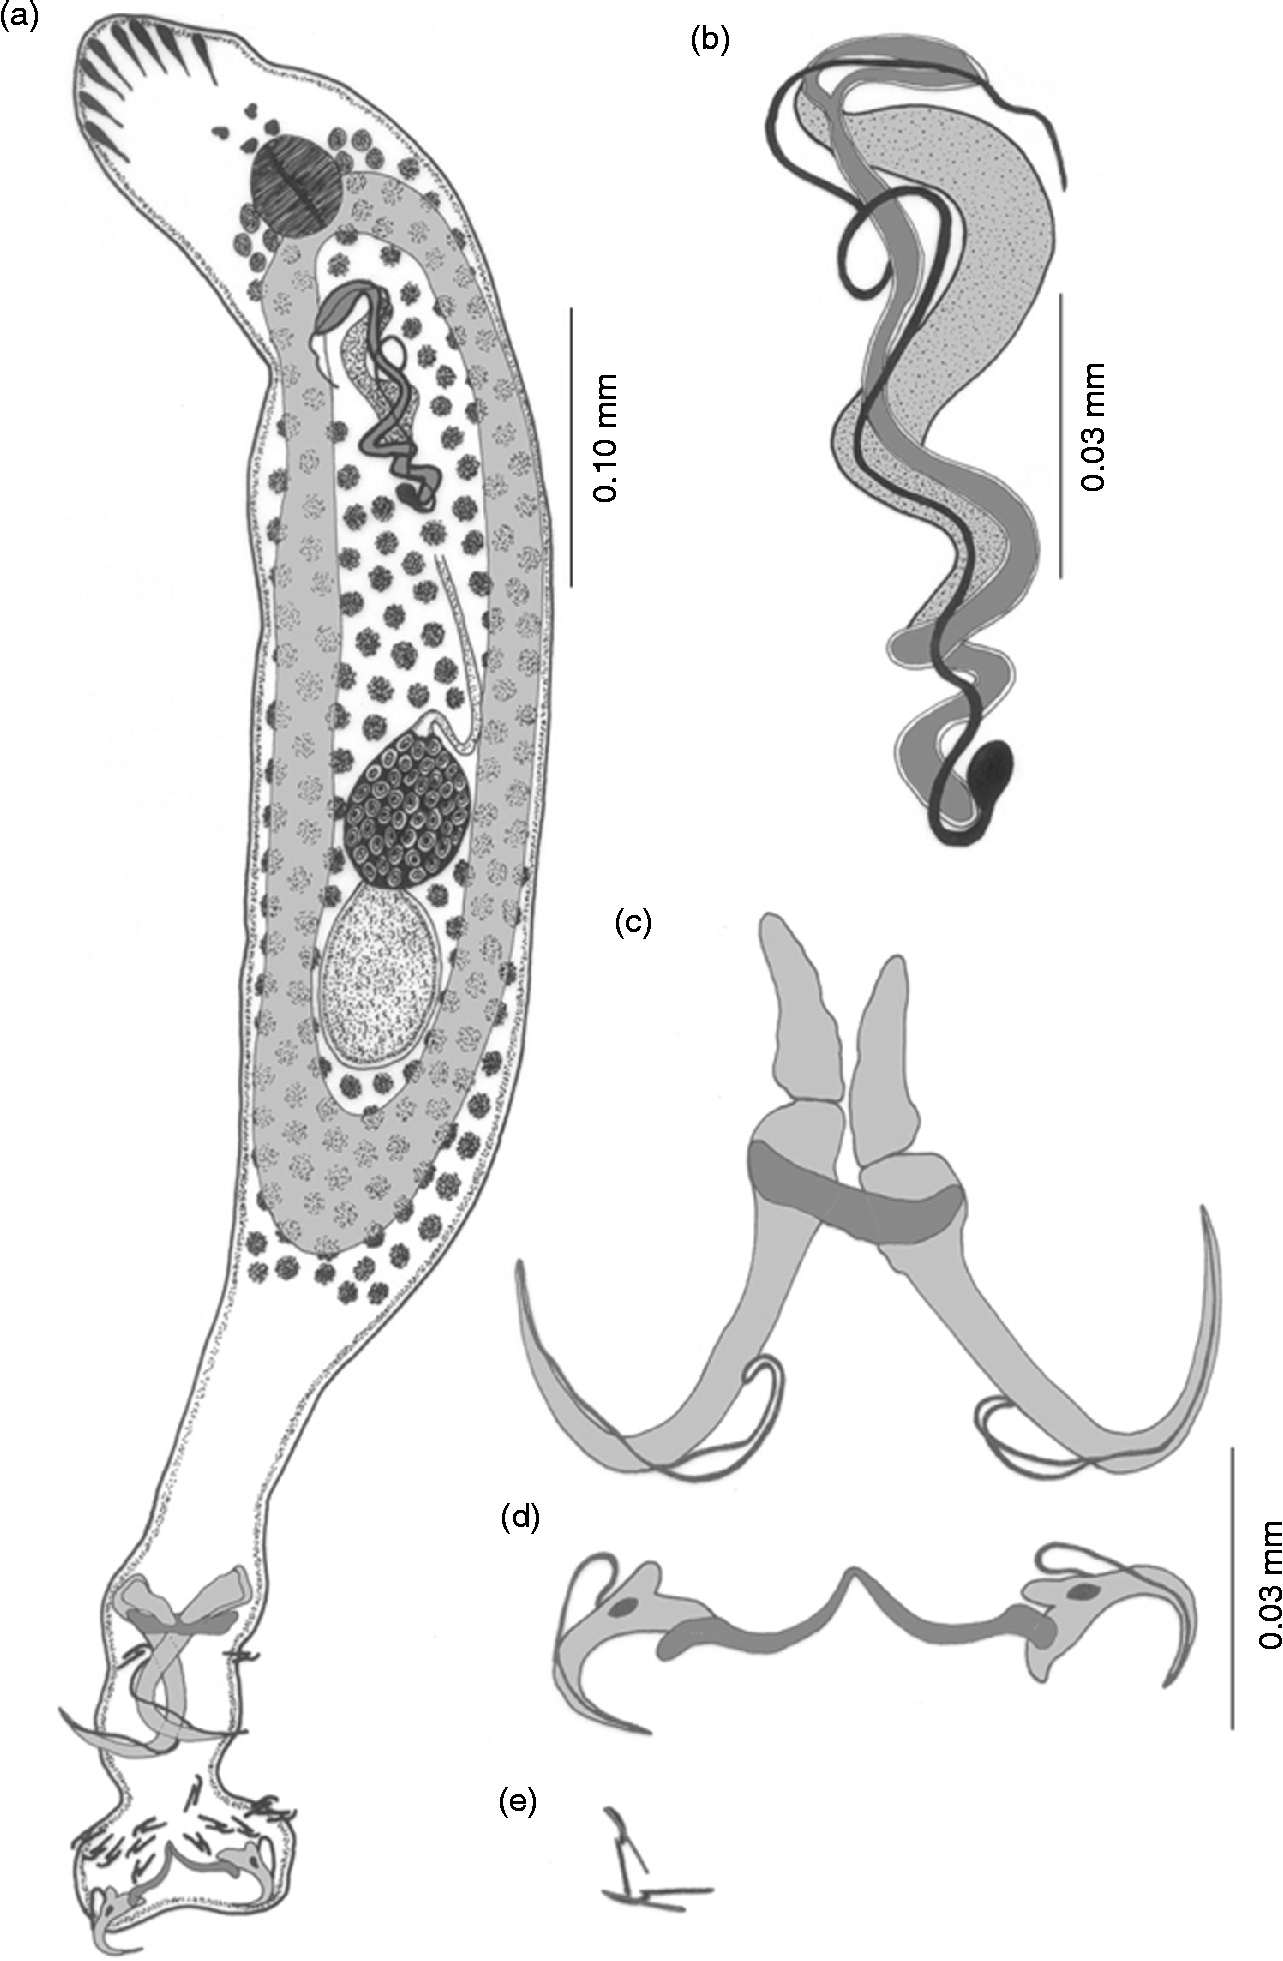
The opisthohaptor globose is set off from the body proper by a short peduncle and measures 0.14–0.15 × 0.09–0.10 mm. The armature of the haptor comprises two pairs of anchors (dorsal and ventral), a dorsal transverse bar, a ventral transverse bar and seven pairs of marginal hooklets. The dorsal anchor (fig. 2c) is well developed, much larger than the ventral, with roots undifferentiated, measuring 0.13–0.14 mm in total length. The shaft is cylindrical, measuring 0.05–0.06 mm, and is strengthened by the presence of a sleeve sclerite. Points are recurved, measuring 0.04–0.05 mm. At the base of the inner root of the dorsal anchor, small inwardly directed conical patches (capitula) are present, measuring 0.03–0.04 mm. The dorsal transverse bar measures 0.04–0.05 mm, has outwardly projecting ends and the mesial portion of the bar is slightly bent backwards. The ventral anchors (fig. 2d) measure 0.03–0.04 mm in total length and have a short recurved point measuring 0.01–0.02 mm. Roots are well differentiated, small and bifid. Between the two roots, a small oval vacuity is present. The outer root measures 0.01–0.02 mm and the inner root measures 0.03–0.04 mm. The shaft is short, cylindrical and supported by the sleeve sclerite, measuring 0.01–0.02 mm. The ventral transverse bar is a single piece, wide, ‘V’-shaped with swollen outer ends measuring 0.06–0.07 mm. Marginal hooklets measure 0.01 mm with a flattened heel, sickle-shaped blade and an elongated handle. A sickle filament loop is attached at the distal part of the sickle on the ventral side, an opposable piece is attached dorsally with the proximal part of the sickle (fig. 2e).
Remarks. A survey of the literature reveals that only one species of Thaparocleidus has been described from the gills of the fish S. silondia, namely T. multispiralis (Jain, Reference Jain1957) Lim, Reference Lim1996. Jain (Reference Jain1957) observed only one pair of anchors and placed this parasite in the genus Dactylogyrus. On further investigation it was transferred by Lim (Reference Lim1996) to the genus Thaparocleidus Jain, Reference Jain1952 but the species (multispiralis) was retained as valid. The present form differs morphologically from the above species in having undifferentiated roots of the dorsal anchors, large patches at the base, a zigzag and not coiled copulatory tube, an accessory piece that runs all along the length of the cirrus which is forked at the distal end and provides space for gliding the tip of the cirrus proper, whereas the accessory piece in T. multispiralis is attached firmly at the distal end of the tube and arranged in a floral fashion. The new species can be readily distinguished from other species of this genus by the different shape of the copulatory complex and shape of the armature of the haptor.
Molecular phylogenetic analyses
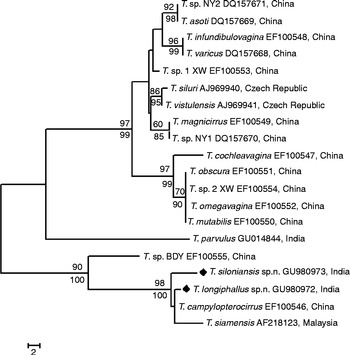
Ribosomal DNA 28S genes of T. longiphallus sp. n. and T. siloniansis sp. n. were amplified, having 758 and 751 base pairs, respectively. The sequences of the two species differ from each other by 0.023 K2P-distance (Kimura, Reference Kimura1980). The BLAST search revealed that T. longiphallus sp. n. exhibits close similarity (99%) with T. campylopterrocirrus (accession number EF100546), a species reported from China. However, T. siloniansis sp. n. exhibits 98% similarity to T. siamensis (accession number AF218123), a species from Malaysia. Both NJ and MP analyses inferred from 28S rDNA sequences gave similar topology; thus only the MP tree is shown (fig. 3). Branches corresponding to partitions reproduced in less than 50% bootstrap replicates were collapsed. The percentage of replicate trees in which the associated taxa clustered together in the bootstrap test (1000 replicates) is shown above the branches. Maximum support is seen in the phylogenetic elaborations for the clade formed by the two new biological species (i.e. T. longiphallus sp. n. and T. siloniansis sp. n.). Tree topologies obtained are congruent in showing the existence of a well-supported subclade formed by the two species of the genus Thaparocleidus Jain, Reference Jain1952 which is included in the same main clade (fig. 3). The tree is drawn to scale, with branch lengths calculated using the average pathway method and are in units of the number of changes over the whole sequence. Since this clade exhibited high bootstrap values, T. longiphallus sp. n. and T. siloniansis sp. n. appear to be sister-taxa. In addition to this, there is a high level of bootstrap support not only with each other but also with T. campylopterrocirrus (Zeng, Reference Zeng1988) Lim, Reference Lim1996 and T. siamensis (Lim, Reference Lim1990) Lim, Reference Lim1996.
Phylogenetic positioning of Thaparocleidus longiphallus sp. n. and T. siloniansis sp. n. based on 28S sequences using maximum parsimony (MP).
Secondary-structure prediction
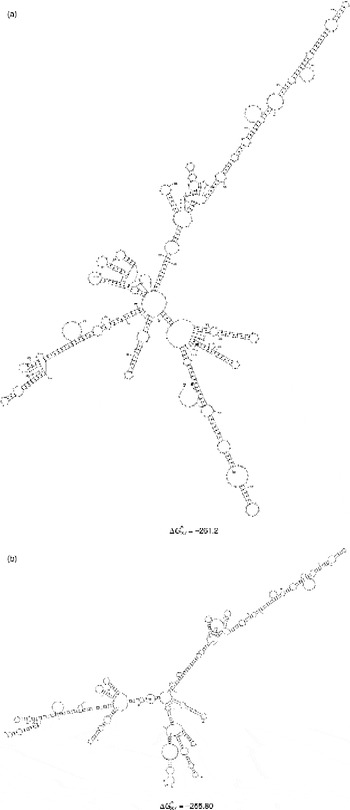
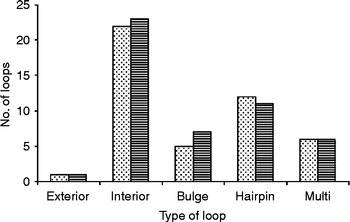
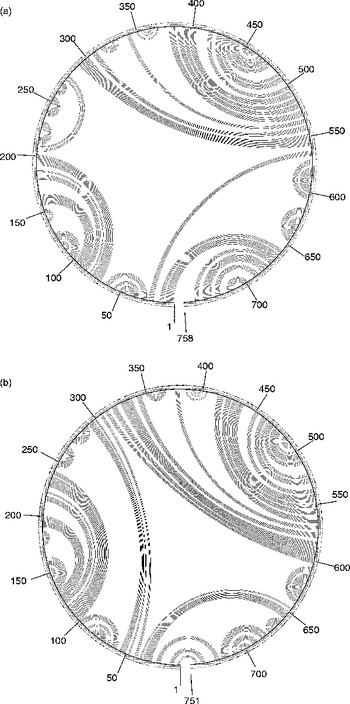
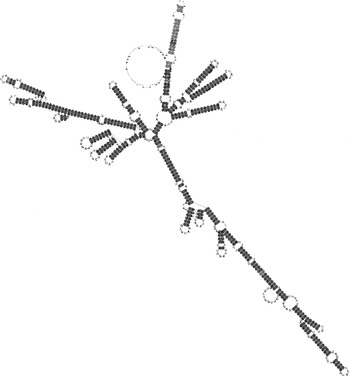
G+C contents for the regions of 28S of T. longiphallus sp. n. and T. siloniansis sp. n. ranged between 45 and 45.1%. Prediction of accessibility is based on a statistical sample of the Boltzmann ensemble for secondary structures. The probability profiling approach by Ding & Lawrence (Reference Ding and Lawrence2001) reveals target sites that are commonly accessible for many statistically representative structures in the target RNA. This novel approach bypasses the long-standing difficulty in accessibility evaluation due to limited representation of probable structures, due to high statistical confidence in predictions. The minimum free energy is estimated by summing individual energy contributions from base-pair stacking, hairpins, bulges, internal loops and multi-branch loops. The RNA secondary structure consists of stems and loops. From the data we were able to draw the rRNA secondary structure where each residue is identified by a base pair, the backbone and the hydrogen bonds are represented as dots between the base pairs (fig. 4a and b). Mainly five types of loops are present in the RNA secondary structure, namely interior, hairpin, exterior, multi and bulge (fig. 5). The centroid for a set of structures is the structure with the minimum total base-pair distance to all structures in the set. Each residue is represented on the abscissa and semi-elliptical lines connect bases that pair with each other. In a centroid diagram, bases are positioned along a circle, in a clockwise orientation. An arc connecting two bases across the circle shows pairing between the bases. Lack of pseudoknots in the secondary structure is reflected by the absence of intersecting lines in the centroid structure of T. longiphallus sp. n. and T. siloniansis sp. n., respectively (fig. 6a and b).
Schematic representation of 28S rRNA predicted secondary structures and their structure formation enthalpies for (a) Thaparocleidus longiphallus sp. n. and (b) T. siloniansis sp. n. Solid lines represent the ribose phosphate backbone and solid circles mark base pairs. ΔG = − 261.2 and − 255.80 are the secondary structure formation enthalpies for both species.
Distribution of different loops in the 28S region of Thaparocleidus longiphallus sp. n. (stippled bars) and T. siloniansis sp. n. (striped bars).
The secondary structure is shown as a centroid, where each base is represented by a dot on the circumference of a circle of arbitrary size and the bases that pair with each other are connected by lines, in (a) Thaparocleidus longiphallus sp. n. and (b) T. siloniansis sp. n. The numbers around centroids are the numbers of base pairs, i.e. 1–758 and 1–751, respectively, of the 28S ribosomal DNA for both the species.
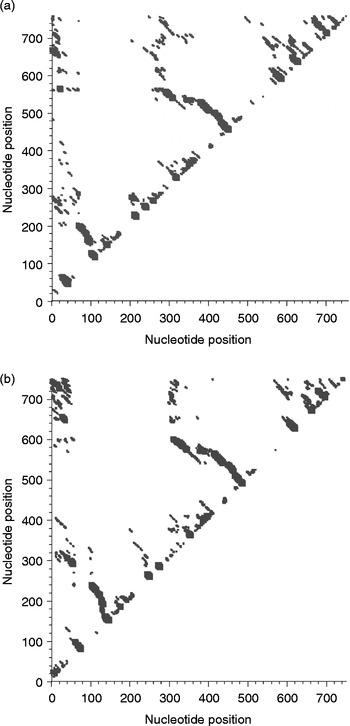
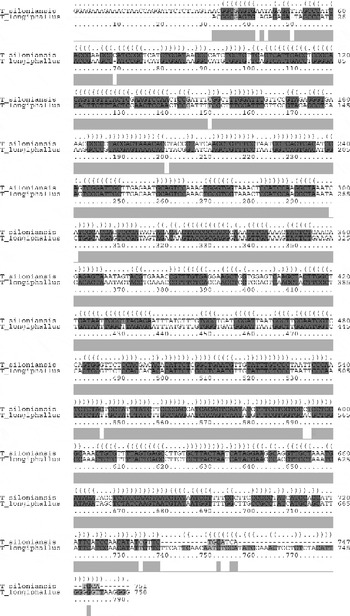
In the two-dimensional histogram, the patterns of base-pair frequencies are nearly identical for T. longiphallus sp. n. and T. siloniansis sp. n. (fig. 7a and b). In the present work, we applied a more objective approach for the reconstruction of best alignment using secondary structure. Manual construction of alignment is a complex and time-consuming procedure, whereas application of the MARNA program generates a reliable alignment and represents a powerful tool (fig. 8). The figure shows alignment of T. longiphallus sp. n. and T. siloniansis sp. n., which evaluates both the sequence and structural similarity. The alignment optionally satisfies given constraints and allows unaligned fragments at the end of both sequences without penalty. The alignment is shown together as the predicted structure (fig. 9). The consensus structure is printed as a string of dots and brackets on top of the alignment. The string is well bracketed, such that each base pair in the structure is shown by corresponding opening and closing brackets. Furthermore, compatible base pairs are dark grey, where the hue shows the number of different types C–G, G–C, A–U, U–A, G–U or U–G of compatible base pairs in the corresponding columns. In this way the hue shows sequence conservation of the base pair. The saturation decreases with the number of incompatible base pairs; thus, it shows the structural conservation of the base pair.
Two-dimensional histograms of base-pair frequencies of predicted secondary structures in (a) Thaparocleidus longiphallus sp. n. and (b) T. siloniansis sp. n. On the x and y axes, nucleotide probability profiles (W= 4) are computed in the form of a plot, against nucleotide positions. On a profile for fragment width W, the probability that W consecutive bases are all unpaired is plotted against the first base of the segment.
Thaparocleidus species sequence alignment shows a consensus secondary structure. The structure is shown in the dot bracket format above the alignment and each corresponding bracket represents consensus base pairs of the alignment columns beneath. A sequence conservation profile is also shown in light grey bars below the alignment.
The consensus predicted secondary structure from fig. 8, light and dark grey according to the different types of base pairs in the corresponding alignment columns.
Discussion
Delimiting species of Thaparocleidus monogeneans is often difficult, owing to their limited morphological characters, and this may have resulted in a gross underestimation of the true number of species. DNA-based identification used during this study has enabled the recognition of new Thaparocleidus taxa, which has implications for our understanding of their species diversity estimates. Of the 92 nominal species attributed to the genus Thaparocleidus and its synonyms, there are 15 that are considered species inquirendae/nomina nuda and synonyms and 77 that are tentatively considered valid. At least 16 nominal species of Thaparocleidus have been described from W. attu in India (Lim et al., Reference Lim, Timofeeva and Gibson2001; Pandey et al., Reference Pandey, Agrawal, Vishwakarma and Sharma2003). So, it is difficult to ascertain from the morphological descriptions, even though many are detailed, whether the differences noted are significant or the result of environmental or other variation.
The present study has provided a reliable means of delineating biological species and for inferring their genetic relationships. The validity of the new species described above, i.e. T. longiphallus n. sp. and T. siloniansis n. sp., is strongly supported by molecular evidence inferred from rDNA 28S sequence analysis. Indeed, T. longiphallus n. sp. and T. siloniansis n. sp. represent two genetically distinct clades, which correspond to two distinct lineages with respect to T. campylopterrocirrus and T. siamensis from China and Malaysia, respectively. With phylogenetic analysis, as a general rule, if the bootstrap value for a given interior branch of a phylogenetic tree is 70% or higher, then the topology at that branch is considered reliable. The present findings show the bootstrap value to be >70% for the tree obtained and the 28S sequence was similar between the two new species. The two new species are also genetically well distinct from the other species of Thaparocleidus previously recognized with the same ribosomal markers, available at the National Center for Biotechnology Information (NCBI). The tree topologies derived from the phylogenetic analysis are in agreement where they depicted T. longiphallus sp. n. and T. siloniansis sp. n. as genetically closely related sister-taxa and a high bootstrap value was obtained for the clade formed by these sibling-species, including T. campylopterrocirrus and T. siamensis (fig. 3).
In monogeneans, speciation processes are not always accompanied by morphological differentiation; speciation has led in this group of parasites to several sibling-species, whose morphological recognition has been made possible only after their genetic identification. For example, in the case of T. longiphallus sp. n. and T. siloniansis sp. n., morphologically they resemble each other closely in the structure of the male copulatory complex and haptoral parts. Molecular studies have been shown to be useful diagnostic criteria for monogenean parasites and for recognizing genetically detected sibling-species. Thus, according to both genetic and morphological analyses, T. longiphallus sp. n. and T. siloniansis sp. n. are considered to represent two new species of Thaparocleidus Jain, Reference Jain1952 parasitizing W. attu and S. silondia, respectively. This study shows that molecular markers are useful for distinguishing sister-species of monogeneans.
In phylogenetic studies involving secondary-structure analysis as a tool, RNA folding is used for refining the alignment. The molecules' measurable structural parameters are used directly as specific characters to construct a phylogenetic tree. These structures are inferred from the sequence of the nucleotides, often using energy minimization (Zuker, Reference Zuker, Griffin and Griffin1994). In 28S RNA structures from T. longiphallus sp. n. and T. siloniansis sp. n. the highest negative free energies are − 261.2 kcal and − 255.80 kcal, respectively. In the two new species T. longiphallus sp. n. and T. siloniansis sp. n. from different host isolates, convergence at the secondary-structure level between species, as in the present findings, may be due to the evolutionary pressure on 28S to maintain the RNA secondary structure, which involves the post-transcriptional processing of rRNA. Kuracha et al. (Reference Kuracha, Rayavarapu, Kumar and Rao2006) have also pointed out that critical changes in the folding pattern of rRNA are because of sequence evolution during rRNA formation, with which we also agree. Molecular morphometrics has been found to be the most powerful tool in comparison to classical primary sequence analysis, because in the study of phylogenetics only the size variations of homologous structural segments are considered, whereas molecular morphometrics infers the folding pattern of an RNA molecule. Therefore, with the help of this, homologous recognizable characters are easily seen by finding the same pattern in the secondary structures, as also advocated by Prasad et al. (Reference Prasad, Tandon, Biswal, Goswami and Chatterjee2009). Several patterns of predicted secondary structures of RNA were constructed from 28S sequences from two different isolates of Thaparocleidus Jain, Reference Jain1952. This provided additional information for correct identification of the species. Moreover, the secondary-structure analysis also confirmed the results obtained from primary sequence analysis. Different RNA folding algorithms also take into account the structural energy as the major determinant in furnishing RNA secondary-structure models and conformation, which will definitely add significant dimensions to our understanding of the relationships among the sequence features and structural parameters that come into play in determining the structural energy. This approach can be further fine-tuned for resolving ambiguities, using differences at the RNA structural level for identification of sibling-species complexes. Therefore, structural model-based analyses of DNA sequence data have become increasingly important for phylogenetic inference.
Application of the secondary-structure model of rRNA to phylogenetic analyses leads to trees with less resolved relationships among clades and probably eliminates some artefactual support for misinterpreted relationships. The highly resolved topology in tree parts suggests that a deep phylogenetic signal has been retained in the 28S sequences of extant species. However, incorporating secondary-structure information allows improved estimates of phylogeny among several Thaparocleidus species.
In conclusion, the present identification of the Thaparocleidus species with 28S sequence and secondary-structure analysis is consistent with investigations made using traditional approaches, i.e. by morphology. The molecular study of the genus Thaparocleidus Jain, Reference Jain1952 has gained impetus in recent times; 28S sequences are a promising tool for monogenean species identification. RNA secondary-structure analysis could be a valuable tool for distinguishing new species and completing Thaparocleidus systematics, because the 28S secondary structure contains more information than the usual primary sequence alignment.
Acknowledgements
We are thankful to the Head of the Department of Zoology, CCS University, Meerut, for providing laboratory facilities. Funding for this study was provided by the Department of Science and Technology (grant number SR/SO/A543/2005) to H.S.S.



