This study surveys language-internal variability and short-term diachronic change, along dimensions that are familiar from the cross-linguistic typology of languages. The terms analytic and synthetic have a long and venerable tradition in linguistics, going back to the 19th century and August Wilhelm von Schlegel, who is usually credited for coining the opposition (Schlegel, Reference August Wilhelm von.1818). This is, alas, not the place to even attempt to review the rich history of thought in this area (but see Schwegler, Reference Schwegler1990:chapter 1 for an excellent overview). Suffice it to say that the terms “are used in widely different meanings by different linguists” (Anttila, Reference Anttila1989:315), a terminological confusion that requires, right at the outset, a concise definition that guides the present study's empirical argument (note that grammaticity, as a derived notion, will be defined in a following section). This study is interested, first, in the overt coding of grammatical information, which is why lexical analyticity and syntheticity do not enter into consideration here. Second, our definition is a strictly formal one (and not a semantic one) that broadly follows Andrei Danchev's notion that “formal analyticity … implies that the various meanings … of a given language unit are carried by … free morphemes, whereas formal syntheticity is … characterized by the presence of one bound morpheme” (Danchev, Reference Danchev, Rissanen, Ihalainen, Nevalainen and Taavitsainen1992:26). In this spirit—but avoiding reference to the morpheme construct, which is theoretically not unproblematic—we operationally define:
Formal grammatical analyticity—comprises all those coding strategies in which grammatical information is conveyed by free grammatical markers, which we in turn define as synsemantic (cf. Marty, Reference Marty1908) word tokens that have no independent lexical meaning.
Formal grammatical syntheticity—comprises all those coding strategies where grammatical information is signaled by bound grammatical markers.
A few additional remarks are in order here. As for analyticity, this study equates synsemantic word tokens with function (also known as structure or empty) words, which are here defined as being members of closed word classes: conjunctions (e.g., and, if), determiners (e.g., the), pronouns (e.g., he), prepositions (e.g., in), infinitive markers (e.g., to), modal verbs (e.g., can, will), and negators (e.g., not). Note that this definition of analyticity and of what should count as a function word appears to be a fairly uncontroversial one and in accordance with standard reference works (for instance, Bussmann, Trauth, & Kazzazi, Reference Bussmann, Trauth and Kazzazi1996:22, 471). As for our definition of syntheticity, we take bound grammatical markers to comprise verbal, nominal, and adjectival inflectional affixes (e.g., past tense -ed, plural -s, comparative -er, and so on), the genitive clitic (as in Tom 'shouse), as well as allomorphs including ablaut phenomena (e.g., past tense s ang), i-mutation (e.g., plural m en), and other nonregular yet clearly bound grammatical markers. Our model of morphological analysis is thus, at base, an item-and-process model (Hockett, Reference Hockett1954:396) in which grammatically marked forms are thought of as deriving from simple forms via some sort of process—in our diction, via adding some sort of overt grammatical (but not necessarily segmentable) grammatical signal, be it a (regular) inflectional affix, a stem vowel change, or the like. What does not enter into our notion of syntheticity, however, is the “zero morpheme” construct (as in they go-Ø) postulated in some morphological approaches to deal with paradigmatic contrasts in finite verb forms. Note here that the present study is, in fact, going to be interested in null marking—but only to the extent that null marking serves as an alternative to non-null synthetic (and also analytic) marking, not as an instantiation of synthetic marking.
Having thus set the scene, what is the main objective in this article? In cross-linguistic morphological typology, languages are classified as rather analytic (for instance, modern Romance languages) or as rather synthetic (for example, Classical Latin). English is frequently cited as the textbook example of a language that has developed from a synthetic language into an analytic one. Consider the following, classical Schlegel quote:
En Europe les langues dérivées du latin, et l'anglais, ont une grammaire tout analytique … synthétiques dans leur origine … elles penchent fortement vers les formes analytiques.Footnote 1 (Schlegel, Reference August Wilhelm von.1846:161; emphasis mine)
Against this backdrop, the present study seeks to demonstrate that Modern English is not as monolithic, or monolithically analytic, as the preceding quote and indeed much of the cross-linguistic morphological literature would seem to suggest. Instead, we will see that variability in analyticity and syntheticity is endemic, surprisingly so, even among closely related dialects and varieties of the same language, Modern English. The task before us is to marry Schlegel's old idea about the syntheticity-analyticity continuum to state-of-the-art corpus-linguistic techniques along the lines of Gries (Reference Gries2006) to explore three language-external parameters of intralingual variability: geography, text type, and short-term diachrony.
A comment on this study's general methodological orientation seems appropriate at this point. Though interested in variation and variability, the present study does not adopt a strictly variationist approach in the sense of, for example, Labov (Reference Labov1966, Reference Labov1972). Whereas it is certainly possible, in many cases, to define a linguistic variable that has an analytic variant and a synthetic variant (e.g., the analytic of-genitive versus the synthetic s-genitive, analytic adjective comparison vs. synthetic adjective comparison, and so on), in the majority of instances, a particular analytic or synthetic pattern will not have a neatly definable alternative variant. For example, synthetic marking of plurality (e.g., many horses) does not have an analytic alternative that would convey exactly or even roughly the same meaning. As the subsequent frequency analyses will show, however, the alternative to analytic and synthetic marking is, in many contexts, no grammatical marking at all; the empirical question being whether analytic or synthetic marking is more likely to be substituted by zero.
INDICES
In a seminal (1960) paper entitled “A Quantitative Approach to the Morphological Typology of Language,” Joseph Greenberg demonstrated that prima facie abstract typological notions are amenable to sufficiently precise numerical measurements by calculating a number of indices on the basis of naturalistic texts. Greenberg defined (i) an index of synthesis, (ii) of agglutination, (iii) a compounding index, (iv) a derivational index, (v) a gross inflectional index, (vi) a prefixial index, (vii) a suffixial index, (viii) an isolational index, (ix) a pure inflectional index, and (x) a concordial index (Greenberg, Reference Greenberg1960:187). So, for instance, Greenberg defined the gross inflectional index as the number of inflectional morphemes (nonconcordial or concordial) in the analyst's sample divided by the total number of words in the sample (Greenberg, Reference Greenberg1960:186–187).Footnote 2
This study utilizes Greenberg's method in revised form. First, as for inflection it calculates syntheticity indices in a slightly different fashion. What is measured, in a given textual sample, is not the number of inflectional morphemes per sample (which is what Greenberg's original gross inflectional index measures), but the number of words in a sample that bear at least one bound grammatical marker. Note that these are not necessarily two different ways of saying the same thing, as—depending on one's analytical framework—the form walks (as in he walks the dog) can be analyzed as containing two grammatical morphemes, {nonpast} and {third-person singular}. In our approach, the form walks contains exactly one grammatical marker, -s, which may have more than one meaning. Notice here that except for some rare genitive plural forms (such as the ox en'slegs), English has virtually no word forms that exhibit more than one segmentable bound grammatical marker.
Second, what is notably absent from Greenberg's index portfolio is an analyticity index. In an attempt to remedy this omission, Kasevič & Jachontov (Reference Kasevič and Jachontov1982:37) (cited in Kempgen & Lehfeldt, Reference Kempgen, Lehfeldt, Booij, Lehmann, Mugdan and Skopeteas2004:1237) suggested an “index of analyticity,” which relates the number of synsemantic words in a given text to the total number of words in that text (cf. Kelemen, Reference Kelemen, Dezso and Hajdú1970:62 for a similar proposal). This is how the present study calculates its analyticity index.
In addition to the syntheticity and analyticity indices, we calculate grammaticity indices that measure the number of grammatical markers, free or bound, in a given sample. Numerically, the grammaticity index equals the sum of the former two indices. Grammaticity is equivalent to grammar minus word order in that the notion comprises all explicit grammatical markers, but not word order. To summarize, the present study is concerned with calculating three different indices:
1. The analyticity index (henceforth AI): the ratio of the number of free grammatical markers in a sample (F) to the total number of words in the sample (W), normalized to a sample size of 1,000 tokens. Hence: AI = F/W × 1,000.
2. The syntheticity index (henceforth SI): the ratio of the number of words in a sample that bear a bound grammatical marker (B) to the total number of words in the sample (W), normalized to a sample size of 1,000 tokens. Hence: SI = B/W × 1,000.
3. The grammaticity index (henceforth GI): the ratio of the total number of grammatical markers (B + F) in a text to the total number of words (W) in the sample, normalized to a sample size of 1,000 tokens. Hence: GI = (B + F)/W × 1,000.
All three indices have a lower bound of zero. The syntheticity and the analyticity index have an upper bound of 1,000 index points, whereas the grammaticity index has an upper bound of 2,000 index points.
THE LINK TO LANGUAGE COMPLEXITY
A survey of the literature reveals that there is a customary nexus between analyticity, syntheticity, and language complexity (note, though, that this nexus is not always backed up by hard empirical evidence, especially when it comes to processing complexity). Be that as it may, the present study is in line with a number of orthodox interpretational patterns, which can be summed up as follows.
Wilhelm von Humboldt was one of the first to claim that analyticity increases explicitness and transparency while easing comprehension difficulty (Humboldt, Reference Wilhelm von.1836:284–285). Syntheticity, on the other hand, is often viewed as increasing speaker/writer output economy and expressivity (cf. Danchev, Reference Danchev, Rissanen, Ihalainen, Nevalainen and Taavitsainen1992:36) by virtue of the fact that synthetic marking (in English, typically affixation) is the more compact and economical coding option vis-à-vis analytic marking. Consider the alternation between the synthetic s-genitive (as in the president's speech) and the analytic of-genitive (as in the speech of the president). The synthetic option is more output-economical, because the genitive marker is a clitic and not a full-blown preposition, and because the possessed NP lacks a determiner. But, by the same token, the analytic option is the more explicit and arguably the more transparent one, by virtue of the fact that more material is used for grammatical coding.
Thus, syntheticity is more output-economical than analyticity is because synthetic markers are typically more compact than analytic markers. As for grammaticity, this study equates—following the argument in Szmrecsanyi & Kortmann (Reference Szmrecsanyi, Kortmann, Sampson, Gil and Trudgill2009)—increased text frequencies of grammatical markers (synthetic or analytic) with “repetition of information” (Trudgill, Reference Trudgill, Filppula, Klemola and Paulasto2009: 314), which increases marking redundancy and hence decreases overall speaker/writer output economy, because more overt grammatical information is being explicitly coded, be it synthetically or analytically. This is why we consider less grammaticity to be more output-economical than more grammaticity, and here it does not matter if more grammaticity comes about through more analyticity or syntheticity, because zero marking is always more output-economical than explicit marking is. On the other hand, however, increased grammaticity, that is, increased overt redundancy, can be seen (for instance, Bisang, Reference Bisang, Sampson, Gil and Trudgill2009) as easing hearer/reader pragmatic inference complexity, because less is left for the reader/hearer to pragmatically infer from the context. So, the basic idea, advocated in, for example, Bisang (Reference Bisang, Sampson, Gil and Trudgill2009), is that there is a trade-off between competing motivations such that higher levels of grammaticity are comprehension-economical with regard to the hearer/reader whereas lower levels of grammaticity are output-economical with regard to the speaker/writer. Our interpretational approach can thus be summarized as follows:
1. Increased analyticity increases explicitness and transparency and decreases hearer/reader comprehension complexity.
2. Increased syntheticity increases speaker/writer output economy vis-à-vis analytic marking, by virtue of being the more compact coding option.
3. Increased grammaticity (i) increases redundancy, thus (ii) decreasing overall speaker/writer output economy, because more grammatical information is subject to overt coding. Redundancies such as these, however, (iii) reduce hearer/reader pragmatic inference complexity.
METHOD AND DATA
Data
The present study draws on a fairly wide array of publicly accessible text corpora:
The British National Corpus (BNC World Edition). This data base contains approximately 90 million words of written standard British English (henceforth: BrE) and 10 million words of spoken standard BrE. Containing over 4,000 individual texts, the corpus samples 70 different registers (24 spoken, 46 written; for instance, S_speech_scripted vs. S_speech_unscripted, W_fict_drama vs. W_fict_poetry) at the highest level of granularity, which boil down to 34 macro registers (16 spoken, 18 written; for instance, S_speech and W_fict). The corpus is fully part-of-speech (henceforth: POS) annotated using the CLAWS5 tag set (Aston & Burnard, Reference Aston and Burnard1998).
The Brown family of corpora (Brown, LOB, Frown, F-LOB). These are four matching text corpora sampling 1960s American English (henceforth: AmE) (Brown) (see Francis & Kučera, Reference Francis and Kučera1982), 1960s BrE (LOB) (see Johansson & Hofland, Reference Johansson and Hofland1989), 1990s AmE (Frown) (see Hinrichs, Waibel, & Smith, Reference Hinrichs, Waibel and Smith2007), and 1990s BrE (F-LOB) (see Hinrichs et al., Reference Hinrichs, Waibel and Smith2007). The four corpora have (roughly) the same design, each spanning one million words (500 texts of approximately 2,000 words each) and sampling 15 written micro registers falling into four macro registers (Press, General Prose, Learned Writing, Fiction) and two major text categories (informative vs. imaginative prose). The corpora are fully POS-annotated with the CLAWS8 tag set.
Switchboard. This corpus samples AmE telephone conversations. The version that is used here stems from the second release of the American National Corpus.Footnote 3 It contains approximately three million words and is POS-annotated with the Hepple tag set. Switchboard serves to represent standard spoken AmE.
The Freiburg Corpus of English Dialects (FRED). FRED contains transcribed oral history interviews, the bulk of which were recorded in the 1970s and 1980s. Speakers are typically non-mobile old rural males. FRED yields three levels of areal granularity: 9 dialect areas, 38 counties (in pre-1974 boundaries), and 163 locations (see Hernández, Reference Hernández2006; Szmrecsanyi & Hernández, Reference Szmrecsanyi and Hernández2007). This study explores variation between six dialects sampled in FRED: the dialects spoken in the counties of Somerset (southwestern England), Kent (southeastern England), Shropshire (English Midlands), Lancashire (northern England), Glamorgan (Wales), and Sutherland (Scottish Lowlands).Footnote 4
The International Corpus of English (ICE). The following ICE subcorpora are analyzed: ICE-IRE (Irish E), ICE-PHI (Philippine E), ICE-HK (Hong Kong E), ICE-SG (Singapore E), ICE-IN (Indian E), ICE-NZ (New Zealand E), ICE-JAM (Jamaican E), and ICE-EA (East African E, i.e., Kenyan and Tanzanian E).Footnote 5 The subcorpora typically contain 500 texts (300 spoken, 200 written), with every individual text spanning approximately 2,000 words (Greenbaum, Reference Greenbaum1996). Of the many registers sampled in ICE, this study explores the spoken-conversational material (section s1a).
Method
To obtain quantitative results, the present study exploits POS annotation, where tokens in a corpus are tagged for their word class (this includes information on whether nouns, verbs, adjectives, and certain pronouns carry inflections). In the case of those corpora that are POS-annotated in the first place (i.e., the BNC, Switchboard, and the Brown family of corpora), the findings derive from an exhaustive analysis of all the material sampled in the corpora.
In the case of those corpora in the present study's portfolio that are not POS-annotated a priori (essentially, FRED and the ICE subcorpora), an algorithm selected 1,000 random decontextualized tokens (i.e., words) per variety studied. Subsequently, these tokens were annotated manually for their part of speech using the BNC (CLAWS5) tag set with a minor extension (as in the CLAWS8 tag set, the primary verbs be, do, and have were explicitly annotated for whether they occurred in auxiliary function by prefixing the character ‘A' to the CLAWS5 tag; note that in the analysis of the BNC itself, primary verbs were automatically disambiguated contextually for auxiliary or main verb usage).Footnote 6
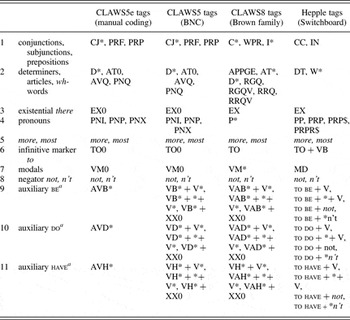
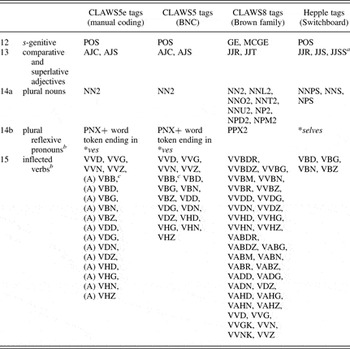
Given the definition of analyticity and syntheticity detailed in the first section, POS tags (or rather the tokens annotated with POS tags) were subsequently placed into four categories: (i) purely lexical tags, such as singular nouns (which are uninteresting to the present study), (ii) synthetic tags (essentially all tokens that, following Vennemann, Reference Vennemann, Heinz and Wandruszka1982:330, show affixation or mutation to indicate grammatical information), (iii) analytic tags (at base, function words), and (iv) a small number of simultaneously synthetic and analytic tags (inflected auxiliary verbs and reflexive pronouns in their plural form). The exact tag/token-to-category matches can be seen in Tables 1Footnote 7 and 2, which categorize analytic tags into 11 broad component categories and synthetic tags into 4 broad component categories.Footnote 8
Eleven broad component categories (as defined through POS tags and/or word tokens) loading on the analyticity index in (i) the modified BNC tag set (CLAWS5e) used for manual annotation, (ii) the original BNC tag set (CLAWS5), (iii) the Brown family tag set (CLAWS 8), and (iv) the Switchboard (Hepple) tag set

aCategory members may also load on the syntheticity index.
Five broad component categories (as defined through POS tags and/or word tokens) loading on the syntheticity index in (i) the modified BNC tag set (CLAWS5e) used for manual annotation, (ii) the original BNC tag set (CLAWS5), (iii) the Brown family tag set (CLAWS 8), and (iv) the Switchboard (Hepple) tag set

aConsidered if and only if not preceded by more or most.
bCategory members may also load on the analyticity index.
cConsidered if and only if the form of the verb is not be.
Finally, a retrieval script written in the programming language Perl automatically established the text frequencies of the relevant POS tags (or POS-tag categories) in the data set. These text frequencies served as the empirical basis for calculating the indices.Footnote 9
GEOGRAPHIC VARIABILITY IN WORLD ENGLISHES
This section explores analyticity, syntheticity, and grammaticity variability in 16 geographic varieties of English, comprising 10 geographic L1 varieties of English and 6 non-native, indigenized L2 (or ESL) varieties of English, all of which are spoken. The L1 varieties include the traditional dialects spoken in Glamorgan, Kent, Lancashire, Shropshire, Somerset, and Sutherland; Irish E; New Zealand E; standard (conversational) BrE; and standard spoken AmE. The L2 varieties are East African E, Indian E, Hong Kong E, Philippine E, Singapore E, and Jamaican E.Footnote 10 Crucially, in controlling for text type as far as possible (notice that the data subject to analysis in this section are all spontaneous-spoken), the variability subject to analysis in this section can be considered genuinely geographic.
Analyticity and syntheticity in World Englishes
For every one of the 16 geographic varieties under investigation, the scatterplot in Figure 1 plots analyticity indices against syntheticity indices in a two-dimensional plane, differentiating visually between native L1 varieties and non-native, indigenized L2 varieties. It is evident that variability in World Englishes is considerable. In the analyticity dimension (vertical axis), values range from 403 analytic markers per 1,000 words of running text (Hong Kong E) all the way to 531 markers per 1,000 words (Sutherland English). In terms of syntheticity (horizontal axis), values span the range between 111 synthetic markers per 1,000 words (Singapore E) and 185 markers per 1,000 words (Shropshire E). The two standard varieties, standard AmE and BrE, cover the middle ground. We shall now discuss some general tendencies in the data set, not all of which are significant, due to the comparatively low number of observations (such tendencies will be reported anyway, with the proviso that they are tentative and await corroboration in future research).
Geographic varieties: analyticity by syntheticity (in index points, ptw).

According to Peter Trudgill (Reference Trudgill, Filppula, Klemola and Paulasto2009), the distinction between high-contact and low-contact varieties of English is what amounts to “the true typological split” (Trudgill, Reference Trudgill, Filppula, Klemola and Paulasto2009:315) among varieties of English. Trudgill's argument boils down to the purportedly “lousy language-learning abilities of the human adult” (Trudgill, Reference Trudgill2001:372). The idea, in a nutshell, is that contact implicates adult language learning, which in turn implicates simplification. The resulting simplicity in different domains (see Trudgill, Reference Trudgill, Filppula, Klemola and Paulasto2009, for an overview) is what should set apart high-contact from low-contact varieties as synchronic groups. In terms of the present data set, high-contact varieties thus comprise:
Non-native, indigenized L2 varieties: East African E, Indian E, Hong Kong E, Philippine E, Singapore E, and Jamaican E;
Transplanted L1 Englishes (or colonial varieties; cf. Mesthrie, Reference Mesthrie2006a:382): New Zealand E and standard spoken AmE;
Language-shift Englishes: varieties “that develop when English replaces the erstwhile primary language(s) of a community” and that have “adult and child L1 and L2 speakers forming one speech community” (Mesthrie, Reference Mesthrie2006a:383). The present study also includes what might be called shifted varieties, which are varieties that used to be genuine language-shift varieties in the past 500 years or so but which no longer have significant numbers of L2 speakers any more: Irish E, Welsh E (Glamorgan), Scottish Highlands E (Sutherland);
Standard varieties, such as standard BrE and standard AmE, the genesis of which, according to Trudgill (Reference Trudgill, Filppula, Klemola and Paulasto2009), always implicates a high degree of dialect contact.
Varieties that do not fall into one of the preceding categories are considered low-contact L1 dialects of English, that is, traditional nontransplanted regional dialects that are “long-established mother tongue varieties” (Trudgill, Reference Trudgill, Filppula, Klemola and Paulasto2009:320): thus, in terms of the data set analyzed here, the traditional dialects spoken in Kent, Lancashire, Shropshire, and Somerset.
Observe, first, that low-contact varieties are significantly (p = .006)Footnote 11 more synthetic than high-contact varieties (mean SI high-contact: 141; mean SI low-contact: 169) (cf. Szmrecsanyi & Kortmann, Reference Szmrecsanyi, Kortmann, Sampson, Gil and Trudgill2009).Footnote 12 Second, L1 varieties exhibit significantly (p = .023) more syntheticity (mean SI: 156) than L2 varieties (mean SI: 134). Among L2 varieties, there is a striking gap between Southeast Asian L2 varieties (Singapore E, Philippine E, Hong Kong E) and non–Southeast Asian L2 varieties (Indian E, Jamaican E, East African E) inasmuch as the former exhibit significantly (p = .009) less analyticity than do the latter. There is also a tendency for Southeast Asian varieties to exhibit less syntheticity than other L2 varieties. We will return to this issue later.
Third, the standard view in the literature (on English or other European languages) is that there is a historical trade-off between syntheticity and analyticity. English, for instance, is said to have compensated for the loss of synthetic marking by adding analytic marking (cf. the discussion and quotes in the first section). What is interesting about Figure 1 is that on the synchronic-geographic plane, there is no such thing as a trade-off between analyticity and syntheticity; on the contrary, there seems to be a positive (r = .47), though statistically marginally insignificant (p = .066), correlation between analyticity and syntheticity. In short, varieties of English that exhibit greater syntheticity tend to also exhibit a high degree of analyticity, whereas varieties that display little syntheticity will typically also have little analyticity. The crucial variable thus seems to be grammaticity, to which we turn next.
Grammaticity
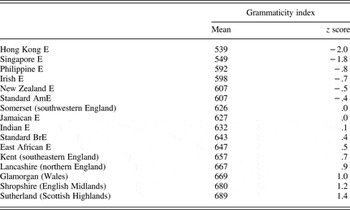
Table 3 provides GI scores for every one of the 16 geographic varieties under study in this section, along with z scores as indices of variability between varieties. The variety exhibiting the lowest level of grammaticity is Hong Kong E: 539 grammatical markers per 1,000 words of running text. Its z score of −2.0 indicates that Hong Kong E's GI is 2.0 cross-variety standard deviations less than the mean of all varieties under study (in the data set, the standard deviation for grammaticity is 43.4 index points; the mean index value for grammaticity is 626.9). By contrast, Sutherland E has a GI of 689.0, which is 1.4 standard deviations greater than the mean of all varieties. In summary, starting at the top of Table 3, Hong Kong E through Somerset E have lower-than-average grammaticity; Jamaican E through Sutherland E exhibit higher-than-average grammaticity.
Grammaticity in geographic varieties of English

Again, some tendencies in the data set should be pointed out. For one thing, British varieties of English tend to exhibit more grammaticity (mean GI: 654) than other varieties, whereas L2 varieties have less-than-average grammaticity (mean GI: 598), with transplanted L1 varieties taking the middle road (mean GI: 607); these differences are significant at p = .032, according to a one-way analysis of variance. In a similar vein, L1 varieties tend to exhibit more grammaticity (mean GI: 644) than L2 varieties do (mean GI: 598; p = .032). Again, we find the three Southeast Asian L2 varieties (Singapore E, Philippine E, Hong Kong E) at the bottom of Table 3. With a mean GI of merely 560, these differ significantly (p = .001) from the other varieties in the sample in that they seem to avoid grammatical marking. At this point, it is instructive to examine some authentic text samples: (1) is a conversational snippet taken from the Hong Kong E data, and (2) exemplifies conversational Singapore E. Sites where grammatical markers could appear are marked by Ø.
1. …the Putonghua we we speak, uhm, include-Ø just part of the Beijing dialect. But in Beijing most people especially the, uhm people who are less educated they speak Ø Beijing dialect which is really difficult for us to understand. Even I myself I finished Ø advance course I, can't hear what they say. (ICE-HK S1A-002)
2. …and he actually went you know to Robinson and bought him two shirt-Ø and one tie … Ah because he lost the bet mah because he say-Ø that if Wei Ho change-Ø he will do that for him … But when he came in on Monday that day we almost die-Ø laughing uh and Kang Heng also lost the bet to us … Kang Heng say-Ø he won't change If he change-Ø he give-Ø us ten dollars. (ICE-SG S1A-013)
Consider, now, Hong Kong E. In (1), we find two sites (they speak Ø Beijing dialect, I finished Ø advance course) where an article could be employed, and one site (the Putonghua … include-Ø just part of the Beijing dialect) where many speakers of L1 standard varieties would employ a verbal inflection. Likewise, in the relatively short snippet in (2), we find seven unmarked nouns or verbs (two shirt-Ø, he say-Ø, Wei Ho change-Ø, we almost die-Ø, Kang Heng say-Ø, If he change-Ø he give-Ø us) where there could be inflectional forms. The generalization seems to be that in Southeast Asian L2 varieties of English in particular, speakers do not substitute, say, synthetic grammatical markers by purportedly more transparent and explicit analytic markers. Instead, they opt for less overall grammaticity, avoiding overt marking—in the spirit of the motto “if it can be deleted, it will be deleted” (Mesthrie, Reference Mesthrie2006b:142). This strategy is even more output-economical than synthetic marking is, yet it arguably incurs pragmatic complexities on the part of the hearer (cf. Bisang, Reference Bisang, Sampson, Gil and Trudgill2009).
The sources of geographic analyticity/syntheticity variability
Let us now identify those individual grammatical markers and/or marker categories that are most strongly involved in geographic analyticity/syntheticity variability. This means that we will deconstruct the indices considered so far, elucidating which of the 15 component categories detailed in Tables 1 and 2 are subject to significant variability. We begin by exploring analytic markers. Correlating, in our sample of N = 16 varieties, each of the component categories with the analyticity index yields a statistically significant (p < .003)Footnote 13 Pearson correlation coefficient for articles, determiners other than articles, and wh-words. These correlate strongly (r = .83) with increased AI levels. Subsequent independent samples t tests show that the text frequency of such markers is also what sets Southeast Asian L2 varieties apart from other varieties of English (p = .007). Within this category it is especially articles that show robust variability (see example (1)). As for syntheticity, we obtain an even stronger correlation (r = .90) between increased SI levels and inflected verbs (especially third-person singular and past tense forms). Once again, independent samples t tests indicate that inflected verbs are likewise highly involved in the overall divide between Southeast Asian L2 varieties and other varieties (p = .029). Recall that Singapore E is the least synthetic variety in our sample according to Figure 1, and as we have seen in example (2), this variety exhibits a strong preference for unmarked verb forms.
Interim summary
In all three relevant dimensions—analyticity, syntheticity, and grammaticity—geographic varieties of English are subject to substantial variability. This section has offered the following generalization. Low-contact varieties are more synthetic than high-contact varieties.Footnote 14 Thus, in the data set subject to analysis here, low-contact communities emphasize output economy whereas high-contact speaker communities put a premium on explicitness and transparency. Furthermore, L1 varieties exhibit more grammaticity than L2 varieties do, and Southeast Asian L2 varieties in particular are substantially less explicit grammatically than are other varieties. Hence, Southeast Asian L2 varieties are more economical than other varieties when it comes to grammaticity (note that this seems to be true for Southeast Asian languages in general, according to Bisang, Reference Bisang, Sampson, Gil and Trudgill2009). Next, exploring which grammatical markers are specifically involved in this kind of variability, we have seen that determiners, articles, and wh-words—and within this category, articles more than anything else—are loading high on the analyticity index. As for syntheticity, it is mainly text frequencies of verbal inflections (or the lack thereof) that are most strongly implicated in the observable variability. Last but not least, analyticity does not seem to trade off against syntheticity such that reduced syntheticity would imply increased analyticity or vice versa. Instead, there is not only a binary choice between analyticity and syntheticity, but also a third option—zero—which is often the preferred one.
TEXT TYPE VARIABILITY
This portion of the article investigates text type (or genre) variability in standard BrE, drawing on the BNC as the primary corpus database. Recall that the point estimate for spoken Standard BrE in the previous section (cf. Figure 1) was based on the conversational part of the BNC. What picture would emerge if we explored variability between this genre and the many other registers sampled in the BNC? It is to this task that we next turn.
Analyticity and syntheticity
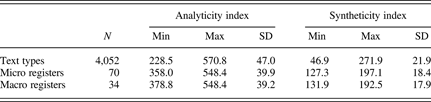
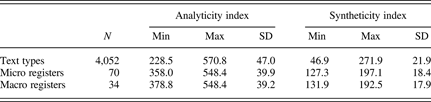
We begin by looking at analyticity-syntheticity variability. The BNC in its entirety yields an AI of 440.2 and an SI of 176.9, but, needless to say, there is a good deal of variability in the corpus. Table 4 reports some summary measures of this variability, at three granularity levels: individual texts, micro registers (for instance, unscripted speech vs. scripted speech, drama fiction vs. prose fiction), and macro registers (for instance, speech vs. fiction). For a first impression of this variability, observe that the least analytic individual text (text G2A, a collection of estate agents' property details) in the BNC only exhibits 228.5 analytic markers per 1,000 words of running text, whereas the most analytic text, J98 (a Herts County Council committee meeting), is on record with an AI of 570.8. As for the statistical dispersion around the mean, notice that the standard deviations are in the double-digit range and thus quite sizable, even at the level of macro registers.
Some summary measures (N of objects, minimum value, maximum value, standard deviation) for corpus-internal variability in the BNC, three levels of granularity: individual texts, micro registers, macro registers. Overall mean values: AI 440.2, SI 176.9
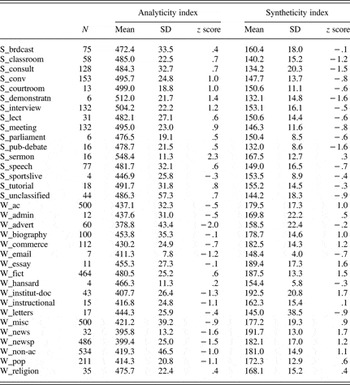
In what follows, let us have a closer look at variability within and between macro registers. Table 5 lists the BNC's macro registers, along with point estimates for AI/SI, the standard deviation associated with each such point estimate (a measure of dispersion within macro registers), and z scores. So, for instance, broadcasts (S_brdcast) have a mean AI of 472.4; the register-internal standard deviation associated with that mean is 33.5 (meaning that the 75 broadcast texts in the BNC deviate, on average, by 33.5 points from the preceding mean); and the z score is .4, which means that S_brdcast's AI is .4 cross-macro register standard deviations greater than the mean of all macro registers' AI. A survey of the standard deviations in Table 5 reveals that there are more or less monolithic genres. The seven e-mail texts sampled in the BNC are comparatively homogeneous with regard to the indices at hand, whereas the unclassified material is extraordinarily heterogeneous.
Summary measures for variability between and within macro registers in the BNC: N of individual texts, point estimates for AI and SI (in index points, ptw), standard deviation, and z score

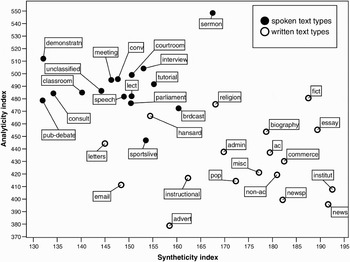
Register-internal variability aside, Figure 2 depicts the variability between macro registers by plotting AI/SI point estimates on a two-dimensional plane. Among the mass of data points displayed, a closer look at the extreme cases along the two dimensions in the diagram is instructive. In the syntheticity dimension, with SIs beyond 190, institutional documents and news are the most synthetic genres in the BNC, which is another way of saying that for these text types, the pressure for output economy is the strongest. At the other end of the spectrum, we find public debate and demonstrations as the least synthetic text types in the BNC—genres, therefore, that are least subject to pressures of output economy.
BNC macro registers: analyticity by syntheticity (in index points, ptw).

The extreme genres in the analyticity dimension are sermons and advertisements. Sermons, for one thing, are extremely analytic (AI: 548.4); thus here we are dealing with a text type where the need for explicitness, transparency, and ease of comprehension is rather imperative. (3) exemplifies this genre:
(3) Why not have the light within you so you don't have to go and get it outside but it's there dwelling within you, day by day, moment by moment? And he longs to meet this woman's need. And we can try all sorts of things. And there's, there's things are not necessarily wrong, there's the legitimate things, erm, wi within our work, th there's a, there's job satisfaction, but there's more to that than, in life than just job satisfaction. (BNC text KN8)
What we find in (3), then, is a relatively high degree of reference tracking via pronouns (you, it, he, we), many prepositions (e.g., within, by, in), and repetition of analytic material galore (notice, for instance, the multiple repetition of existential/dummy there). Compare this, now, to (4), an actual advertisement illustrating the BNC's least analytic text type (AI: 378.8):
(4) Build up a total heating system room by room. Interested? USE THE POST-FREE COUPON OVERLEAF. Total Heating. Forget fuel deliveries, dust, dirt, smells, noise, fetching, carrying, tending the boiler . Get a new electric boiler and forget it—all of it! (BNC text HT1)
In (4), it is obvious that all nonessential material is dispensed with, which is, of course, thanks to the fact that advertisements constitute one of the genres where the pressure to maximize output economy can be quantified, as it were, in monetary terms. This pressure affects analytic material in particular, because analytic markers are typically less compact and economical than synthetic markers.
The written-spoken dichotomy
As for higher-order generalizations, let us begin by noting that there are significant correlations between the AI/SI levels for individual text types and some of the dimensions of register variation identified by Biber (Reference Biber1988). The relevant dimensions are involved vs. informational production and abstract vs. nonabstract information. Based on a subsample of BNC registersFootnote 15 whose AIs/SIs were matched against the factor loadings reported in Biber (Reference Biber1988), the following pattern emerges. Increased analyticity correlates with involved production (r = .78, p < .05), whereas increased syntheticity dovetails with abstract informational content (r = .62, p < .05). However, it is likely that these correlations are actually epiphenomenal to a number of very robust differences between spoken and written text types. These we shall survey in the following text.
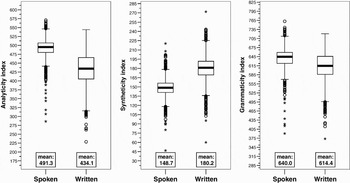
Some readers will no doubt have noticed already that the z scores in Table 5 are fairly suggestive with regard to medium: spoken macro registers are typically associated with positive AI scores and negative SI scores, whereas the converse holds true for written registers. The box plot in Figure 3 is a more refined way to look at the variance between spoken and written macro registers (cf. Gries, Reference Gries2006).Footnote 16 In the plot, the boxes depict the interquartile index range comprising the middle 50% of individual BNC texts (in terms of their analyticity/syntheticity/grammaticity levels), with the thick line in the boxes indicating the median. The whiskers above and below the boxes extend to data points that score no more than 1.5 times the interquartile range. The dots above and below the whiskers represent outliers, asterisks indicate extreme cases. Four observations about the variance between spoken and written text types merit attention:
1. Spoken texts are significantly more analytic than written texts are. The typical spoken text exhibits 50 or more analytic markers per 1,000 words of running text than the typical written text. In keeping with the interpretational framework outlined earlier, this means that spoken English places a premium on explicitness, transparency, and the minimization of comprehension complexities.
2. Written texts are significantly more synthetic than spoken texts are, in that the former exhibit, on average, approximately 30 more synthetic markers per 1,000 words of running text than the latter. Therefore, written texts maximize output economy whereas spoken texts incur output diseconomies.
3. Spoken texts exhibit significantly more grammaticity than written texts. Thus, vis-à-vis written texts, spoken texts display more grammatical redundancy, which eases pragmatic inference complexity.
4. As far as the scope of variability is concerned, variability among written texts is more sizable than among spoken texts (notice the size of the boxes in Figure 3). For instance, in terms of grammatical analyticity, the interquartile range containing the middle 50% of all written texts spans roughly 50 index points, whereas the corresponding interquartile range for spoken texts spans only about 25 index points.
In short, the overall pattern is that spoken texts—which, in Chafe's (Reference Chafe and Tannen1982) and Biber's (Reference Biber1988) parlance, are typically specimens of rather involved production—consistently maximize transparency, explicitness, and ease of comprehension, whereas written texts, which typically convey more abstract (Biber, Reference Biber1988) or detached (Chafe, Reference Chafe and Tannen1982) information, can flexibly maximize output economy. This is due to a crucial and well-known difference between the two mediums: “Speaking takes place on the fly, but a writer can mull over how best to say what is desired, and has ample time to edit what is produced” (Chafe, Reference Chafe and Tannen1982:262). By the same token, oral comprehension takes place on the fly, with the spoken word fading rapidly (cf. Hockett, Reference Hockett1960), whereas readers have ample time to go back and forth in a written text, rereading passages as necessary. The point is that speech is subject to temporal constraints (specifically transitoriness, irreversibility, and synchronization, according to Auer, Reference Auer2009) in a way that writing is not. This is why, for the sake of comprehension, speakers have arguably less leeway to manipulate the coding of grammatical information than writers do. The net result is a more narrow emphasis on transparency and explicitness in speech, whereas writing “mold[s] a succession of ideas into a more complex, coherent, integrated whole, making use of devices we seldom use in speaking” (Chafe, Reference Chafe and Tannen1982:37; emphasis mine).
Spoken vs. written text types (variance in index points, ptw).

An issue that should also be addressed here is how syntheticity and analyticity correlate with each other. Earlier, this study detailed that on the level of geographic varieties, analyticity and syntheticity actually correlate positively, which is contrary to expectations. Text type variability is similar in this sense. A cursory glance at Figure 2 might appear to suggest that text types, in fact, exhibit the textbook trade-off. Globally, increased analyticity incurs reduced syntheticity, and vice versa. Statistical analysis shows that this relationship has a moderate strength (r = −.31) and is statistically highly significant at p < .001. However, it is important to note that this overall negative correlation disappears entirely—and thus, turns out to be epiphenomenal—if spoken and written text types are looked at separately. Among written text types, there is no significant relationship (r = −.01, p = .76) at all, but among spoken text types there is a weakly positive relationship (r = .13, p < .001). This replicates this study's earlier finding on the geographic plane that was based on spoken data as well.
The sources of text type–stratified analyticity-syntheticity variability
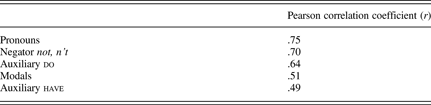
Which grammatical markers or marking families (cf. Tables 1 and 2) are most involved in the variability just discussed? Starting with analyticity, Table 6 lists the top five component categories (cf. Tables 1 and 2) that correlate most highly with overall AI levels.Footnote 17 These are (in descending order of importance) pronouns, as in (5),Footnote 18 the negator not (contracted or uncontracted), as in (6), auxiliary do, as in (7), modal verbs, as in (8), and auxiliary have, as in (9).
(5) As she leaned into the car, the attacker grabbed her … (BNC J1M)
(6) He's not out to break any records … (BNC K1M)
(7) Does it work? (BNC K1B)
(8) Shoppers in Abingdon must be hoping an agreement is reached … (BNC K1C)
(9) Eleven people have been taken to hospital … (BNC J1M)
Text frequencies of such items, in other words, are the best predictors for overall analyticity levels. Take, for instance, auxiliary do, which has a mean frequency of 3.7 per thousand words (henceforth: ptw) in the BNC as a whole. In sermons (the most analytic text type in the corpus), it has a frequency of 8.0 ptw, whereas in advertisements (the least analytic text type), it has a frequency of merely 1.4 ptw.
Top five correlations between the analyticity index and broad component categories on the level of individual BNC texts (N = 4,052)
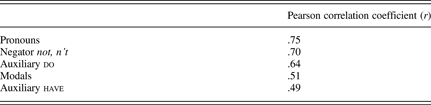
Note: All correlations are significant at p < .001.
Turning to syntheticity, Table 7 indicates the top five component categories correlating most strongly with overall syntheticity levels (again, in descending order of importance): plural nouns, as in (10); inflected verbs, as in (11); conjunctions, as in (12a), subjunctions, as in (12b), and prepositions, as in (12c); the s-genitive, as in (13); and comparative/superlative adjectives, as in (14).Footnote 19
(10) Two police armoured cars stood outside the courthouse. (BNC A95)
(11) The US gave no answer to their request, said Mr Cheney. (BNC A2X)
(12)
a. No record of the initial request is kept and the shape and style only evolves as the metal is worked. (BNC FE6)
b. Thousands of Soviet television viewers yesterday heard Boris Yeltsin, the Communist Party rebel, warn of a revolution from below if radical economic changes did not happen within a year (BNC A1G)
c. … the imminent collapse of the military regime … (BNC A1G)
(13) … the exiled ANC's internal representatives … (BNC A1G)
(14)
a. … the need for better resources management. (BNC A96)
b. … the biggest burdens in the business … (BNC A3W)
Notice here, for example, that plural nouns occur with an overall text frequency of 50.8 ptw in the entire BNC—yet in institutional documents (the most synthetic genre in the BNC), they occur 88.1 times ptw, whereas in public debate (the least synthetic genre in the BNC), they only have a text frequency of 33.7 ptw. It is hardly surprising that plural nouns, inflected verbs, the s-genitive, and inflected adjectives are responsible for a considerable amount of syntheticity variability. What is remarkable is that conjunctions, subjunctions, and prepositions show up on the list; here we have a per se analytic category, which nevertheless correlates with increased syntheticity. Why is this? A closer look at the data reveals that especially the preposition of (POS tag PRF; r = .33, p < .0001) and other prepositions such as about, at, in, on, on behalf of, with (POS tag PRP; r = .46, p < .0001)Footnote 20 correlate highly with SI levels.Footnote 21 The likely explanation is that prepositions, although analytic, always come with NPs that stand a good chance of containing an inflected plural noun, as in (15), or even premodified by an inflected adjective, as in (16). The net effect is an increase in syntheticity.
(15) … sell the policy package to voters without worrying about splits. (BNC A1J)
(16) THE arrival in Romania of Mr Gyula Horn, the Hungarian Foreign Minister, is a sign of Hungarian hopes for better relations with their neighbour … (BNC AAT)
Top five correlations between the syntheticity index and broad component POS categories on the level of individual BNC texts (N = 4,052)
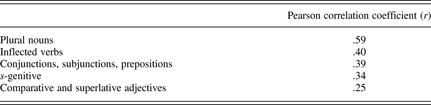
Note: All correlations are significant at p < .001.
Interim summary
This section has suggested that there can be a good deal of text type variability within a single geographic variety (in our case, BrE). We have also seen that index levels are predicted by functional pressures and communicative needs. First and foremost, there is an empirically very robust opposition between spoken and written texts such that spoken texts exhibit more analyticity as well as grammaticity, but less syntheticity than written texts. A further difference between spoken and written English concerns the correlation between analyticity and syntheticity. Among spoken texts, there is a positive correlation between analyticity and syntheticity. Among written texts, there is no such correlation. This section has argued that all these contrasts boil down to the online nature of speech. Finally, the grammatical categories that cause most of the variability in the analyticity dimension include pronouns, negators, auxiliary do/have, and modals. The categories that correlate with increased syntheticity comprise—in addition to the usual suspects (plural nouns, inflected verbs, the s-genitive, and inflected adjectives)—prepositions, which, in spite of being an analytic category per se, typically attract NPs and the inflectional marking that comes with them.
SHORT-TERM DIACHRONIC VARIABILITY
Adding a longitudinal dimension to the so far purely synchronic discussion, the final parameter of intralingual variability in English to be discussed in this article is real time. More specifically, this section explores short-term diachronic drifts in written English, based on the Brown family of corpora, a set of four matching text corpora documenting early 1960s and early 1990s English, both American and British.
The Brown family of corpora: an overview
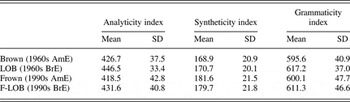
Table 8 displays global indices in the Brown family of corpora. As for analyticity, notice that there have been significant decreases both in AmE (−8.2 index points; significant at p = .001Footnote 22) and in BrE (−14.8 index points; p < .001). The opposite is true for syntheticity. Both matching corpus pairs show significant increases, by 12.7 index points in AmE (p < .001) and 9.0 index points in BrE (p < .001). We thus note that on the whole, both American and British English have become more synthetic and less analytic over the past half century or so, thus reversing what is often argued to be a millennium-old trend. In terms of grammaticity, no significant changes are observable in AmE, but we note a weakly significant decrease (−5.8 index points; p = .03) in BrE. A closer look at the standard deviations provided in Table 8 is also instructive. In both varieties and for all three indices under study, the standard deviations are larger—and sometimes considerably larger—in the 1990s than they were in the 1960s. Thus, written English has come to display more intertextual or inter-register variability in the 1990s than it did in the 1960s. The ensuing discussion will attempt to shed more light on these developments.
Summary measures for variability in the Brown family of corpora: mean index values and standard deviations (each corpus spans N = 500 texts)

Register variability in the Brown family of corpora
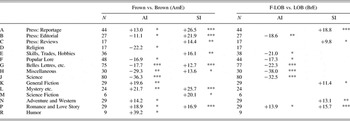
We will now scrutinize diachronic drifts in individual written macro and micro registers sampled in the Brown family of corpora. We begin by discussing diachronic drifts among the 15 micro registers sampled in the corpus suite. For every one of these registers, Table 9 displays statistically significant longitudinal AI/SI differentials by national variety (AmE vs. BrE). Let us discuss analyticity and syntheticity variability in turn:
Analyticity. In both BrE and AmE, Press Editorials (category B), Popular Lore (category F), Belles Lettres, Biographies and Essays (category G), the Miscellaneous Learned Writing category (H), and Science (category J) exhibit significant decreases in analyticity. The decreases are most pronounced in categories H and J (Miscellaneous Learned Writing and Science). In AmE, most of the fiction registers—General Fiction (category K), Mystery etc. (category L), Adventure and Western (category N), Romance and Love Story (category P), and Humor (category R)—are on record with increases in analyticity. Among BrE fiction registers, only Romance and Love Story (category P) features a significant positive differential.
Syntheticity. All significant differentials have a positive sign, thus all significant syntheticity differentials are increases. Observe that in both AmE and BrE, the most significant increases have occurred in the Press Reportage section (category A).
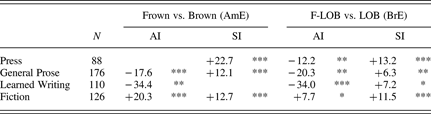
As a first step toward a robust generalization, we conflate the 15 micro registers into 4 macro registers. The result of this exercise is shown in Table 10, which displays significant AI and SI differentials for each one of the four macro registers (Press, General Prose, Learned Writing, Fiction). The overall pattern that emerges from the numbers can be summarized as follows. In the analyticity dimension, Press, General Prose, and Learned Writing tend to show significant decreases (which are most substantial in the Learned Writing section), whereas Fiction exhibits significant analyticity increases in both AmE and BrE. As far as syntheticity is concerned, all macro registers except AmE Learned Writing (where the positive differential is not statistically significant) exhibit increases, most markedly so Press language.
Diachronic shifts (in index points, ptw) in micro registers in the Brown family of corpora

Nonsignificant differentials are omitted. *significant at p < .05, **significant at p < .005, ***significant at p < .001.
Diachronic shifts (in index points, ptw) in macro registers in the Brown family of corpora
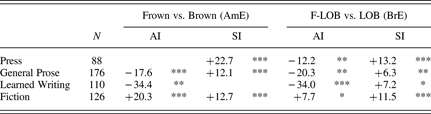
Nonsignificant differentials are omitted. *significant at p < .05, **significant at p < .005, ***significant at p < .001.
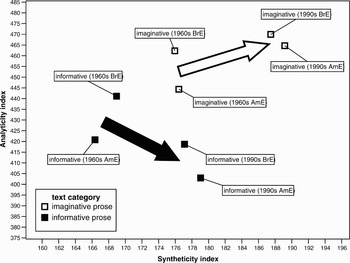
The foregoing discussion points to a robust longitudinal split between informative prose (registers A through J) and imaginative prose (registers K through R). In Figure 4, we find a diagram that visualizes short-term diachronic drifts among the two text categories in a two-dimensional analyticity-syntheticity plane. The scatterplot makes amply clear that since the 1960s, there has been a pattern of longitudinal divergence between informative and imaginative texts. Both text categories have become more synthetic, but whereas informative prose has become less analytic, imaginative prose has actually become more analytic over time. In other words, written English text types have become more heterogeneous, a fact which partially explains the increasing corpus-internal standard deviations noted earlier in connection with Table 8. The interpretation that the present study would like to offer is that informative prose has traded output economy against explicitness and transparency, thus incurring reader comprehension complexity, whereas imaginative prose has come to favor more grammatical marking, and thus redundancy.
Short-term diachronic drifts: analyticity by syntheticity among text categories in the Brown family of corpora (in index points, ptw). All drifts are significant at p < .05 in both dimensions.

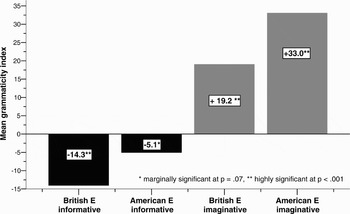
The pattern of divergence between the two text categories is further highlighted when one explores what has happened to grammaticity levels in the period between the early 1960s and the early 1990s. Figure 5 plots the mean difference in grammaticity between sampling times (1990s vs. 1960s) by variety and text category (informative vs. imaginative). We observe that in both varieties, informative prose has shed grammaticity—thus, by inference, eliminating redundancies and maximizing writer output economy at the expense of increased pragmatic complexity whereas imaginative prose has come to be grammatically more redundant (considerably more so).
Short-term diachronic drifts in the Brown family of corpora: mean increase in grammaticity in text categories (in index points, ptw).

How can we account for this clear pattern of increasing dissimilarity between informative and imaginative texts? The present study would like to offer that the pattern can be traced back to two tendencies, economization and colloquialization, which according to the literature are shaping present-day written English. On the one hand, Biber, among others, has noted that modernity has caused an “informational explosion” (Biber, Reference Biber, Aitchison and Lewis2003:180), which is why informative texts (e.g., newspaper texts, scholarly prose) are subject to an increasingly high informational density. In this light, Hinrichs & Szmrecsanyi (Reference Hinrichs and Szmrecsanyi2007:469) defined economization as a tendency toward brevity and compact (grammatical) marking caused by the growing demands of economy and informational compression. On the other hand, it has been observed that since the beginning of the 19th century, certain written genres, such as fiction, have increasingly resembled oral genres (Biber, Reference Biber, Aitchison and Lewis2003:169). For the period between the 1960s and the 1990s specifically, there is ample evidence (see, for instance, Hundt & Mair, Reference Hundt and Mair1999; Mair, Reference Mair and Ljung1997; Mair & Hundt, Reference Mair, Hundt, Sauer and Böker1997) that written English has increasingly incorporated more oral features. Against this backdrop, Mair has defined colloquialization as “a trend towards informality … [which] has had a clear linguistic correlate, a narrowing of the stylistic gap between speech and writing” (Mair, Reference Mair2006:183). It is important to note, in this connection, that economization and colloquialization are not necessarily conflicting factors. For instance, not-contraction is both colloquial and economical. Still, in many cases, the two tendencies are in conflict.
Recall, now, that the section on the written-spoken dichotomy showed that the crucial difference is that spoken texts tend to exhibit more grammaticity and analyticity than written texts do. The increased grammaticity and analyticity of imaginative prose can thus be interpreted as a process of colloquialization such that imaginative written texts narrow the gap to oral texts in two crucial dimensions. Meanwhile, the decreasing grammaticity and analyticity levels observable in informative prose result in better output economy and reduced explicitness and transparency, respectively. This is why the latter drifts practically advertise themselves to be explained in terms of an economization process such that writers seek “to pack information into relatively few words” (Biber, Reference Biber, Aitchison and Lewis2003:179).
Having said that, it should be noted that the neat pattern of economization in informative texts and colloquialization in imaginative texts sketched so far does not fully explain why even imaginative prose has become more synthetic (which cannot be a colloquialization phenomenon, because spoken texts are typically less synthetic than written texts). However, note that we do not really know at this time whether spoken language is also becoming more synthetic in real time, an issue whose empirical discussion is reserved for another occasion. Pending such clarification, we note that colloquialization and economization as processes driving change retain a good deal of explanatory potency, despite some interpretational twilight concerning what is happening in the syntheticity dimension.
The sources of short-term diachronic analyticity-syntheticity variability
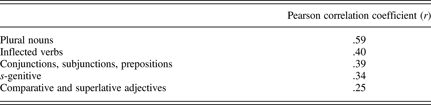
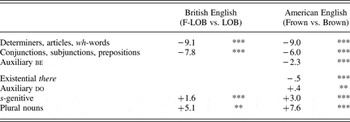
Next, we take a more in-depth look at those individual grammatical markers and marker families (cf. Tables 1 and 2) that are responsible for the increasing divergence between informative and imaginative prose in the Brown family of corpora. We start by investigating changes in informative prose. Table 11 lists those component categories whose text frequency has significantlyFootnote 23 changed in at least one of the two national varieties under study. An inspection of the signs in Table 11 reveals that those categories that have been subject to a frequency decrease are typically analytic categories, whereas those categories that show increases are typically synthetic in nature. Among the analytic components, it is determiners, articles, and wh-words that, as a group, show the strongest decrease over time. Supplemental analyses suggest that within this category, it is especially articles (POS-tag AT), as in (17), and determiners (POS-tag D*), as in (18), that show the most substantial frequency decreases over time. Next, with a similarly substantial decrease, we find conjunctions, subjunctions, and prepositions, a category in which prepositions (POS tag I*), as in (19), are responsible for the bulk of the net loss in frequency over time. Also on the decline in informative prose is auxiliary be, as in (20) and, in the AmE data at least, existential there, as in (21).
17 In the near future, … (FROWN A12)
18 It won't do him any good. (FROWN A01)
19 Polanski now lives in Paris, … (FROWN A24)
20 These fires were originally set by lightning or Indians. (FROWN A32)
21 There is a common misconception that … (FROWN A18)
Component categories: significant changes (1990s vs. 1960s, in index points ptw) in informative prose

*significant at p < .003, **significant at p < .0005, ***significant at p < .0001.
Among those categories that have significantly increased their text frequency in informative prose over time, notably absent are inflected verbs (cf. Mair, Hundt, Leech, & Smith, Reference Mair, Hundt, Leech and Smith2002, for a similar finding as to the overall stability of verb frequencies). Instead, we find the s-genitive, as in (22), and especially plural nouns, as in (23). The prominence of the s-genitive as a category on the rise in informative prose ties in nicely with previous claims (Hinrichs & Szmrecsanyi, Reference Hinrichs and Szmrecsanyi2007; Szmrecsanyi & Hinrichs, Reference Szmrecsanyi, Hinrichs, Nevalainen, Taavitsainen, Pahta and Korhonen2008) that journalists have come to prefer the s-genitive over the of-genitive for primarily output-economy related reasons. On the other hand, the increasing frequency of plural nouns could conceivably be seen as supporting evidence for claims that written English has been suffering from “noun disease” (Potter, Reference Potter1975:101) of late.
22 For Piaget's constructivist theory … (F-LOB J23)
23 It is difficult to think productively about ‘modernization’ for many reasons … (F-LOB J26)
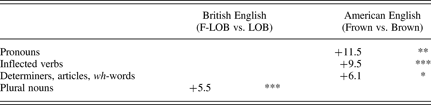
We now turn to imaginative prose, where the picture is less clear-cut than in the informative material. Table 12 highlights those component categories whose text frequency is significantlyFootnote 24 higher in 1990s imaginative prose than it was in 1960s imaginative prose (in imaginative material, no decreases in text frequency are on record). In AmE, these are, in descending order of importance, pronouns, as in (24); inflected verbs; as well as determiners, articles, and wh-words. Supplemental analyses show that among inflected verbs, it is the -s form of verbs (POS tag V*Z), as in (25), that is responsible for the overall increase; among determiners, articles, and wh-words, it is possessive determiners (POS tag APPGE), as in (26), and to a lesser extent what the corpus manual labels as “wh-general adverb[s]” (Hinrichs et al., Reference Hinrichs, Waibel and Smith2007:24) (POS tag RRQ), as in (27), that increase in frequency. In the British imaginative data, finally, it is plural nouns (as in (23)) that have been subject to significant expansion.
24 When I reached twenty, I moved to New York … (FROWN R01)
25 A kid like you buys a car … (FROWN R01)
26 At that same time my father began sending me thick envelopes … (FROWN R06)
27 … they walked several blocks to a part of the neighborhood where nobody knew her. (FROWN R08)
Component categories: significant changes (1990s vs. 1960s, in index points ptw) in imaginative prose
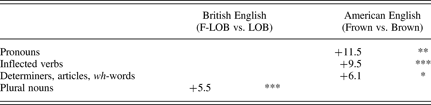
*significant at p < .003, **significant at p < .0005, ***significant at p < .0001.
Interim summary
We have seen in this section that written English, both American and British, has demonstrably become more synthetic over the past 40 or so years, reversing to some extent a millennium-old trend toward more analyticity. In informative prose specifically, the component categories that drive the expansion of synthetic marking are the inflectional s-genitive and inflected plural nouns, but not inflected verbs. We have also uncovered evidence that a longitudinal divergence between informative and imaginative texts may be taking place, in that there has been a development toward less overall analyticity and grammaticity in informative prose, whereas imaginative prose shows the converse development. The present study has suggested that informative prose is subject to a process of economization whereas imaginative prose is undergoing a process of colloquialization.
CONCLUSION
The cumulative weight of evidence discussed in this study suggests that English is anything but a monolithically analytic, or monolithically nonsynthetic, language. Instead, we have seen that observable analyticity, syntheticity, and grammaticity levels vary along at least three important dimensions. There is a good deal of geographic variation (where sociohistory and variety type seem to impact variability), we see significant short-term diachronic variation (where real-time variability is induced by changing discourse norms), and the data attest to pervasive text type variation (where, among other things, the orality-literacy divide plays a major role). In short, we are dealing with variability galore, which is demonstrably sensitive to language-external factors. Hence, point estimates for, say, “the English language,” which often take center stage in language typology, are perhaps more simplistic than is desirable.
On the interpretational plane, this study has linked typological notions to language complexity, arguing that grammatical syntheticity and analyticity each afford certain payoffs, such as increased explicitness in the case of analyticity and better output economy in the case of syntheticity. Against this backdrop, variability was interpreted in terms of how speakers and writers seek to achieve communicative goals while minimizing certain types of complexity (e.g., hearer-reader comprehension difficulty) and/or cost (such as the monetary cost associated with being exceedingly explicit in advertisements).
Needless to say, there are many more variational dimensions and data sources to be investigated in future research. Work is under way in Freiburg to explore long-term diachronic analyticity-syntheticity variability in English and to explore differences and similarities between non-native, indigenized L2 varieties (such as Indian English) and genuine L2 interlanguage varieties (such as French learner English). Another dimension of variability that is yet unexplored is how sociological variables, such as age, gender, socioeconomic status, might impact analyticity-syntheticity variability. Finally, future research along the lines sketched out in the present study should also include English-based pidgin and creole languages in its data portfolio.
Most pressingly, however, we need data on intralingual variability in other languages in order to learn more about the nature of analyticity-syntheticity variability and to assess whether the scope of variability observable in English is within normal parameters of intralingual variability. Consider text type variability. Across all texts in the BNC, the interquartile range (a measure of dispersion comprising those 50% of the texts that are closest to the median, thus excluding outliers and extreme cases) is 71 index points for the analyticity index and 30 index points for the syntheticity index. This is tantamount to saying that variability, for example, in analyticity, typically has a scope of ±35 index points in the BNC. The problem is that at present, we have no good idea as to whether this range of variability is relatively large in comparison to other languages. Is English particularly elastic in regard to analyticity-syntheticity variability? Or are there languages (such as Russian, French, Japanese) that are even more flexible than English? Is the degree of intralingual elasticity contingent on the structural blueprint of the language? An exploration of questions like these would admittedly open up an ambitious research agenda, but one that would combine careful, intralingual-philological, variationist analysis with the broad, abstractive bird's eye perspective that is the hallmark of language typology. Indeed, this is an endeavor that would certainly be worth the effort.