Introduction
Clays are lamellar minerals commonly found in rocks, soils, or sediments. Their minute particle sizes and associated large surface area control to a significant extent the fate of a wide range of inorganic or organic pollutants in rocks, soils, or sediments (Yang et al., Reference Yang, An, Feng, Boufadel and Ji2022; Ye et al., Reference Ye, Cheng, Wu, Hao, Lu, Hu, Mo, Li, Wu and Wu2022). In addition, the surface properties of clays are also beginning to be used as barriers against the spread of contaminants in the context of nuclear waste repositories (Charlet et al., Reference Charlet, Alt-Epping, Wersin and Gilbert2017; Landais, Reference Landais2006). However, in many situations, these clay-rich porous media are only partially water-saturated and pollutant mobility is then controlled by the short-range surface wettability that in turn governs: (1) the distribution of water in the pore network; (2) the connectivity for solute migration (Gimmi and Churakov, Reference Gimmi and Churakov2019; Wang et al., Reference Wang, Savoye, Ferrage, Hubert, Lefevre, Radwan, Robinet, Tertre and Gouze2022; Yang et al., Reference Yang, Churakov, Patel, Prasianakis, Deissmann, Bosbach and Poonoosamy2024). For these reasons, understanding the wettability of clay minerals is a key parameter for establishing comprehensive predictions of water distribution and pollutant migration in natural or artificial materials. In that regard, contact angle is an important physical dimension. Contact-angle measurements are often used to characterize clay–water interaction and evaluate the amount and distribution of water in the pore network for a given relative humidity, through the application of the Young-Laplace equation (Gimmi and Churakov, Reference Gimmi and Churakov2019)). However, little is known about the variability in contact angles to be used in such models. This can be particularly detrimental in the case of clayey materials, considering the wide compositional variability of clay minerals that is well illustrated by the family of 2:1 clay minerals. The crystal structure of these materials is based on two opposing tetrahedral sheets sandwiching a central octahedral sheet (Brigatti et al., Reference Brigatti, Galan, Theng, Bergaya and Lagaly2006). This 2:1 layer can be neutral (e.g. talc, pyrophyllite) or negatively charged when chemical isomorphic substitutions in both the tetrahedral or octahedral sheets induce a permanent layer-charge deficit, compensated by cations located in the interlayer space (e.g., smectite, vermiculite, micas). The amount of charge and nature of cation are well known to govern clay–water interactions (Ferrage, Reference Ferrage2016; Hendricks et al., Reference Hendricks, Nelson and Alexander1940; Méring, Reference Mering1946; Sato et al., Reference Sato, Watanabe and Otsuka1992) and can then also affect wettability (Szczerba et al., Reference Szczerba, Kalinichev and Kowalik2020). For this reason, contact-angle measurements of various clay minerals have been performed in the literature generally by macroscopic experiments where a water drop is deposited on the surface of monocrystals, when available, or on pressed clay powders. The visual inspection of the shape of the droplet then allows determination of the contact angle. Whereas all experiments showed that neutral clays such as talc are far more hydrophobic than charged ones, results for charged samples displayed a strong variability that did not allow derivation of clear answers on the influence of the crystal chemistry of clay minerals on their wettability. One reason for such dispersion lies in the common use of compacted powders (as monocrystals are scarce) for which particle size, orientation, and porosity all affect wettability. One possible way of overcoming this drawback is to use molecular simulations in which the clay–water interface is well defined. In addition, molecular simulations provide information about the thermodynamic properties of the fluids close to the solid surfaces (Rotenberg et al., Reference Rotenberg, Patel and Chandler2011). Still, to be relevant, molecular simulations must concur with experimental results and it has been shown repeatedly that the choice of inter-atomic force field used in the simulation is crucial. As far as clays are concerned, several classical force fields have been developed (Cygan et al., Reference Cygan, Liang and Kalinichev2004; Heinz et al., Reference Heinz, Koerner, Anderson, Vaia and Farmer2005; Pitman and van Duin, Reference Pitman and van Duin2012; Skipper et al., Reference Skipper, Refson and McConnell1989; Zhang et al., Reference Zhang, Liu, van Duin, Lu and Meijer2024). The very popular Clay Force Field ClayFF (Cygan et al., Reference Cygan, Liang and Kalinichev2004) has been shown to be very efficient at investigating clay–water interactions, Still, the detailed analysis revealed certain limitations in the description of hydration states and transport properties (Marry et al. Reference Marry, Malikova, Cadone, Dubois, Durand-Vidal, Turq, Breu, Longeville and Zanotti2008, Reference Marry, Dubois, Malikova, Durand-Vidal, Longeville and Breu2011, Reference Marry, Dubois, Malikova, Breu and Haussler2013, Reference Marry, Le Crom, Ferrage, Michot, Farago, Delville and Dubois2024), in particular of fluorinated clays, and more generally of the interface between clay and water (Ferrage et al., Reference Ferrage, Sakharov, Michot, Delville, Bauer, Lanson, Grangeon, Frapper, Jimenez-Ruiz and Cuello2011; Hånde et al., Reference Hånde, Ramothe, Tesson, Dazas, Ferrage, Lanson, Salanne, Rotenberg and Marry2018; Tesson et al., Reference Tesson, Louisfrema, Salanne, Boutin, Ferrage, Rotenberg and Marry2018). To circumvent this drawback, it could be relevant to include the polarizability of atoms (Daub et al., Reference Daub, Cann, Bratko and Luzar2018: Kamath et al., Reference Kamath, Deshmukh and Sankaranarayanan2013; Le Crom et al., Reference Le Crom, Tournassat, Robinet and Marry2020; Wick and Cummings, Reference Wick and Cummings2011) and some researchers have been active in the development of a polarizable force field for clay/water/ion systems, referred to as PIM (Polarizable Ion Model), specifically adjusted to reproduce ab initio calculation results. Over several years, this force field has yielded promising results regarding the structure, thermodynamics, and diffusion of ion/water systems (Tazi et al., Reference Tazi, Boţan, Salanne, Marry, Turq and Rotenberg2012). It has also shown good agreement with experimental results for the structure of clays and the properties of water and ions in the interlayer space (Le Crom et al., Reference Le Crom, Tournassat, Robinet and Marry2020; Tesson et al., Reference Tesson, Salanne, Rotenberg, Tazi and Marry2016, Reference Tesson, Louisfrema, Salanne, Boutin, Rotenberg and Marry2017, Reference Tesson, Louisfrema, Salanne, Boutin, Ferrage, Rotenberg and Marry2018). In the present study, the potential of molecular simulations to describe clay wettability was explored by focusing on a neutral 2:1 clay mineral, i.e. talc. The emphasis was on the influence of crystal chemistry with analysis in parallel of the wettability of a hydroxylated talc sample and a fluorinated one in which structural hydroxyls were replaced by fluorine atoms. Such a substitution has been shown to modify the amount of water interacting with the structure, fluorinated clays accommodating less water than their hydroxylated counterparts for the same relative humidity (Dazas et al., Reference Dazas, Lanson, Breu, Robert, Pelletier and Ferrage2013; Malikova et al., Reference Malikova, Cadone, Dubois, Marry, Durand-Vidal, Turq, Breu, Longeville and Zanotti2007; Michot et al., Reference Michot, Villieras, Francois, Yvon, Le Dred and Cases1994). Two force fields were used, i.e. ClayFF and PIM and their ability to reproduce experimental contact angles measured on a hydroxylated talc monocrystal was assessed. After deriving PIM parameters for fluorine, this then allowed us to perform molecular simulations on fluorinated talc to extend our understanding of the role played by fluorine on clay wettability and on the thermodynamic properties of the fluid at the clay–water interface.
Materials and methods
Experimental procedure
The talc sample was obtained from the Trimouns deposit located in the French Pyrénées, about 100 km south of Toulouse (France), at an altitude of 1700 m. The sample consisted of centimetric flakes, a quality that is commonly referred to as “talc flower” (Ferrage et al., Reference Ferrage, Seine, Gaillot, Petit, De Parsseval, Boudet, Lanson, Ferret and Martin2006). The chemical composition was close to that of the Mg3Si4O10(OH)2 hydrogenated end-member but with minor amounts of Fe, Al, and F, and traces of Mn, Ti, Cr, Ni, Na, and K (Martin et al., Reference Martin, Micoud, Delmotte, Marichal, Dred, Parseval, Mari, Fortune, Salvi, Beziat, Grauby and Ferret1999). In this sample, clay layers were all stacked in the same direction. Consequently, detrimental effects linked to the presence of grain boundaries in powder samples, i.e. roughness, sample swelling, and liquid penetration that affect contact angle measurements were reduced significantly. Still, the sample contained steps with depths reaching 100 nm (Ferrage et al., Reference Ferrage, Seine, Gaillot, Petit, De Parsseval, Boudet, Lanson, Ferret and Martin2006), which decreased the measured contact-angle values compared to a pristine and ideally flat surface. Moreover, the contact-angle value varied depending on where the drop was placed on the surface. To obtain an accurate measurement, it was then necessary to measure a large number of drops at different locations on the sample. Unfortunately, fluorinated talc is not available in single-crystal form, and no contact-angle measurement values are listed in the literature.
Water contact-angle measurements on talc monocrystals were carried out using the static sessile drop method using a drop analyser DSA30 from Krüss GmbH, Hamburg, Germany. Contact-angle values were obtained by depositing a 5 μL of ultra-pure water drop dispensed by a 500 μL syringe attached to a 0.5 mm diameter steel needle. Prior to water–drop deposition, the talc samples were cleaved using scotch tape seconds before the measurement. In order to avoid sample deformation and breaking, a rigid carbon double-sided tape was used.
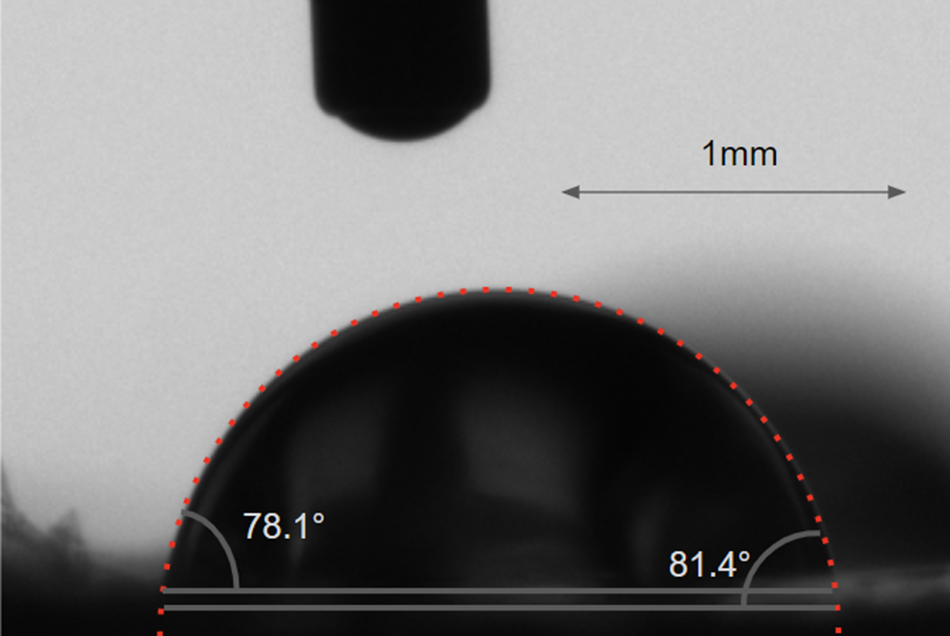
The circle fitting method was used to calculate contact angles. The drop contour was fitted to a circle segment, and the contact angle was measured at the point where this segment intersected the baseline. A representation of an experimental drop is shown Fig. 1.
Representation of the circle method and the influence of the baseline placement on the measured contact angle.

Experimentally, the baseline is a line drawn tangentially to the solid surface at the point where the liquid droplet meets the solid surface. It is used as a reference line for measuring the contact angle. If the baseline is drawn too high or too low, it can cause the apparent contact angle to be larger or smaller than its actual value. In the present study, the description of the baseline was difficult, partially due to the roughness of the sample resulting from the partial peeling of bits of the monocrystal. The procedure was as follows: for each drop, the angle was measured for the two extreme positions of the base line, depicted in Fig. 1. These two extreme baselines were separated by 0.07 mm, which corresponds to about 7% of the drop radius. The contact angle for the drop was determined by taking the mean of the two resulting angles.
Molecular simulations
Description and parametrization of the PIM
As explained in previous studies (Hånde et al., Reference Hånde, Ramothe, Tesson, Dazas, Ferrage, Lanson, Salanne, Rotenberg and Marry2018; Le Crom et al., Reference Le Crom, Tournassat, Robinet and Marry2020; Tesson et al., Reference Tesson, Salanne, Rotenberg, Tazi and Marry2016, Reference Tesson, Louisfrema, Salanne, Boutin, Rotenberg and Marry2017, Reference Tesson, Louisfrema, Salanne, Boutin, Ferrage, Rotenberg and Marry2018), the use of the PIM force field was justified by the improvements it can bring due to the inclusion of polarizability in the interactions at the clay–fluid interface. However, as the PIM parameters for fluorine have not been determined previously, the following paragraphs present the development of the force field for fluorinated clays.
The PIM potential is composed of the following terms:
 $$ {V}_{\mathrm{Total}}={V}_{\mathrm{Charge}}+{V}_{\mathrm{Dispersion}}+{V}_{\mathrm{Repulsion}}+{V}_{\mathrm{Polarization}} $$
 $ {V}_{\mathrm{Charge}} $
corresponds to the Coulombic interactions between atomic charges. The second term accounts for the instantaneous correlations of density fluctuations between the electronic clouds (Tesson et al., Reference Tesson, Salanne, Rotenberg, Tazi and Marry2016, Reference Tesson, Louisfrema, Salanne, Boutin, Rotenberg and Marry2017):
 $$ {V}_{\mathrm{Dispersion}}=-\sum \limits_{i<j}[{f}_6^{ij}({r}_{ij})\frac{C_6^{ij}}{{({r}_{ij})}^6}+{f}_8^{ij}({r}_{ij})\frac{C_8^{ij}}{{({r}_{ij})}^8}] $$
where
 $ {r}_{ij} $
is the interatomic distance and the
 $ {C}_6^{ij} $
and
 $ {C}_8^{ij} $
terms are the dipole-dipole and dipole-quadripole dispersion coefficients, respectively. The Tang-Toennies function
 $ {f}^{ij} $
is used for short-range correction:
 $$ {f}_n^{ij}\left({r}_{ij}\right)=1-{e}^{-{b}_n^{ij}{r}_{ij}}\sum \limits_{k=0}^n\frac{{\left({b}_n^{ij}{r}_{ij}\right)}^k}{k!} $$
where
 $ k $
and
 $ n $
are integers and
 $ 1/{b}_n^{ij} $
is the range of the dumping.
The repulsion potential is modelled by the following decaying exponential:
 $$ {V}_{\mathrm{Repulsion}}=\sum \limits_{i<j}{A}_{ij}{\mathrm{e}}^{-{B}_{ij}{r}_{ij}} $$
where
 $ {A}_{ij} $
and
 $ {B}_{ij} $
are two parameters.
Finally, many-body electrostatic effects are described by the induced dipoles
 $ {\boldsymbol{\unicode{x03BC}}}_{\mathbf{i}} $
, which are treated as additional degrees of freedom and obtained at each MD step by minimizing the polarization energy,
 $$ {V}_{\mathrm{Polarization}}=\sum \limits_{i<j}[\frac{q_i{\mathbf{r}}_{ij}\cdot {\boldsymbol{\unicode{x03BC}}}_j}{r_{ij}^3}{g}_4^{ij}({r}_{ij})-\frac{q_j{\boldsymbol{\unicode{x03BC}}}_i\cdot {\mathbf{r}}_{ij}}{r_{ij}^3}{g}_4^{ij}({r}_{ij})+\frac{{\boldsymbol{\unicode{x03BC}}}_i\cdot {\boldsymbol{\unicode{x03BC}}}_j}{r_{ij}^3} $$
 $$ -\frac{3\left({\mathbf{r}}_{ij}\cdot {\boldsymbol{\unicode{x03BC}}}_i\right)\left({\mathbf{r}}_{ij}\cdot {\boldsymbol{\unicode{x03BC}}}_j\right)}{r_{ij}^5}\Big]+\sum \limits_i\frac{{\left|{\boldsymbol{\unicode{x03BC}}}_i\right|}^2}{2{\alpha}_i} $$
where
 $ {\alpha}_i $
is the polarizability of ion i, and
 $ {g}_4^{ij}({r}_{ij}) $
are short-range corrections to the multipolar expansion of the Tang-Toennies-type:
 $$ {g}_4^{ij}({r}_{ij})=1-{c}_{ij}{e}^{-{b}_D^{ij}{r}_{ij}}\sum \limits_{k=0}^4\frac{{({b}_D^{ij}{r}_{ij})}^k}{k!} $$
where
 $ k $
is an integer,
 $ {c}_{ij} $
a parameter, and
 $ 1/{b}_D^{ij} $
the range of the dumping.
The water model chosen in the parametrization of PIM is the Dang-Chang polarizable model (Dang and Chang, Reference Dang and Chang1997), the parameters of which are given in Table S1 of the Supporting Information (SI) file.
The fluorine-clay and fluorine-water parameters
 $ {A}_{ij} $
,
 $ {B}_{ij} $
,
 $ {c}_{ij} $
, and
 $ {b}_D^{ij} $
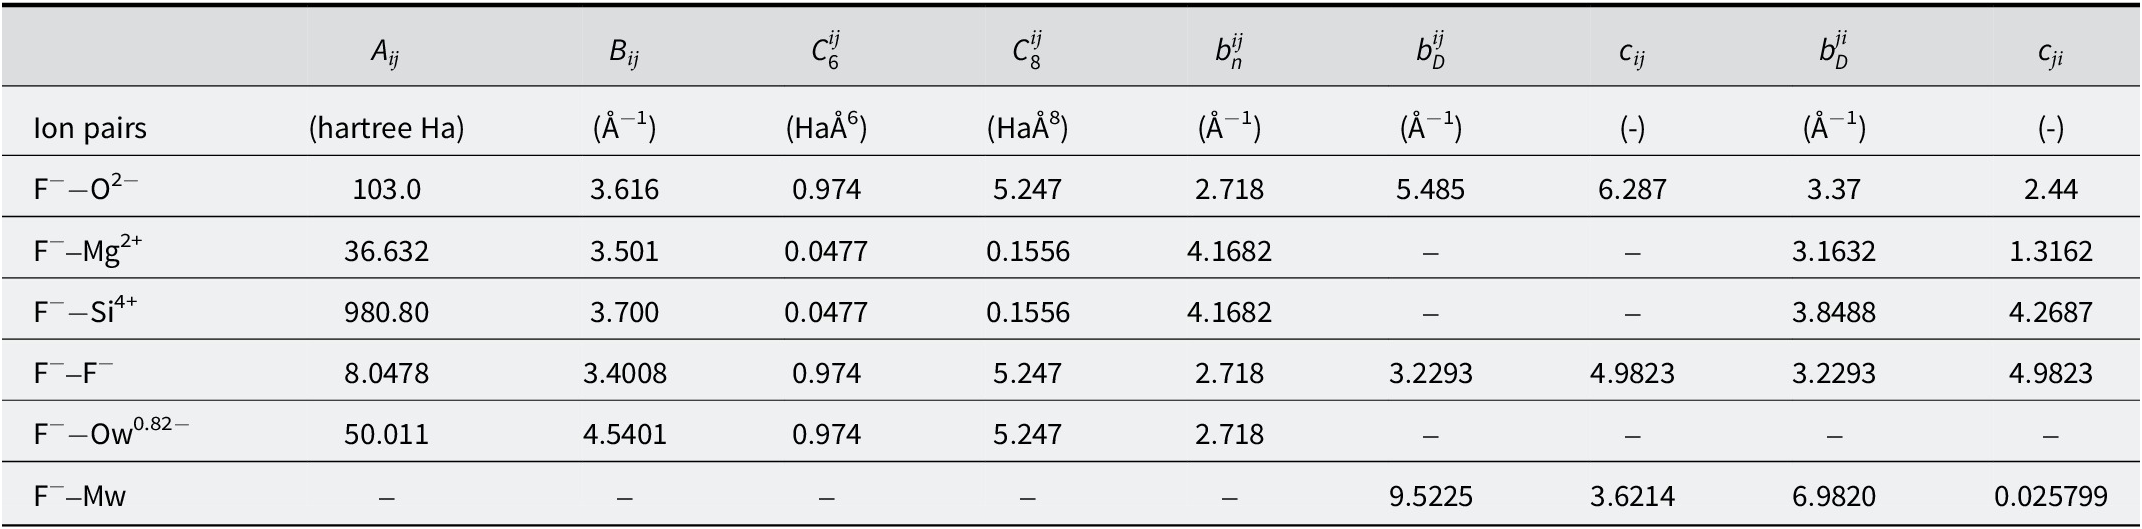
have not been published previously and were obtained following the previous procedure (Tazi et al., Reference Tazi, Molina, Rotenberg, Turq, Vuilleumier and Salanne2012, Tesson et al., Reference Tesson, Salanne, Rotenberg, Tazi and Marry2016, Reference Tesson, Louisfrema, Salanne, Boutin, Rotenberg and Marry2017, Reference Tesson, Louisfrema, Salanne, Boutin, Ferrage, Rotenberg and Marry2018) detailed in section 1 of SI. The parameters obtained are given in Table 1.
Parameters obtained for the interactions between fluorine and the rest of the clay

Simulations of contact angles
Contact-angle simulations were performed with two force fields: PIM and the non polarizable force field ClayFF (Cygan et al., Reference Cygan, Liang and Kalinichev2004). The flexible simple point charge SPC-F water model (Teleman et al., Reference Teleman, Jšnsson and Engstršm1987) was used with ClayFF simulations as it was the water model used for the development of ClayFF. For fluorine, the same parameters as in Rotenberg et al. (Reference Rotenberg, Patel and Chandler2011) were used.
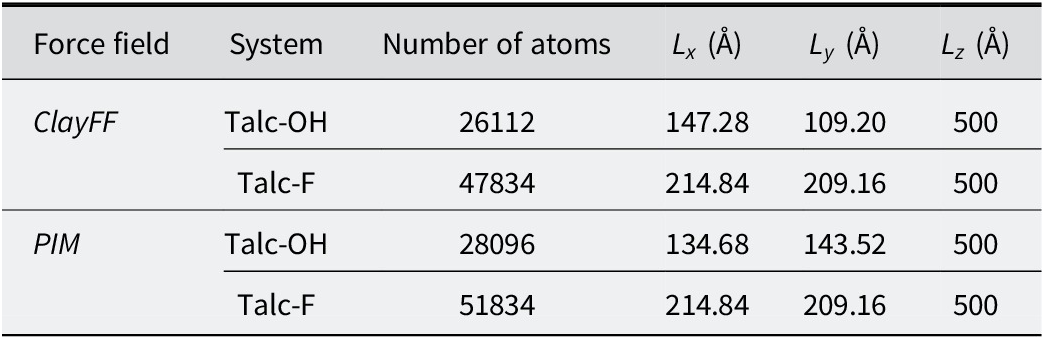
The simulated systems contained a single layer of hydroxylated or fluorinated talc of formula Mg3Si4O10(OH/F)2. The dimensions of the talc surfaces are given in Table 2.
Simulation box characteristics for the modeling of contact angles on talc surfaces.
 $ {L}_x $
,
 $ {L}_y $
, and
 $ {L}_z $
are the dimensions of the simulation box along the x, y, and z axes

About half of the magnesium atoms located in the middle of the clay layer were fixed during the simulations to prevent clay surfaces from bending. Several drop sizes (i.e. containing different amounts of H2O) were tested. With fewer than 2000 water molecules, it was difficult to obtain spherical drops, especially for the PIM force field. In the end, a compromise of 4000 H2O molecules was the number chosen, which enabled us to obtain spherical drops, with a contact angle independent of the line tension, without lengthening simulation times too much. To ensure that the simulated droplet size was sufficient, a simulation of a cylindric droplet on a talc-OH surface was also conducted with ClayFF force field. The simulation details are given in section 3 of the SI. The contact angle showed no significant difference from that obtained from spherical droplets.
All the simulations were performed in the the canonical ensemble at a temperature of 300 K with a timestep of 1 fs. Long-range electrostatic interactions were computed with Ewald summation. The simulation codes Metalwalls (Marin-Lafloche et al., Reference Marin-Laflèche, Haefele, Scalfi, Coretti, Dufils, Jeanmairet, Reed, Serva, Berthin, Bacon, Bonella, Rotenberg, Madden and Salanne2020) and LAMMPS (Plimpton, Reference Plimpton1995) were used with PIM and ClayFF force fields, respectively. For 2 ns, the water molecules were trapped in a cube made of virtual walls specified by a repulsive Lennard Jones to keep them close to the surface. The walls were removed and the systems were equilibrated for a further 1 ns. The atoms’ positions were recorded every 1000 timesteps for a total of 4 ns and used to calculate the contact angles.
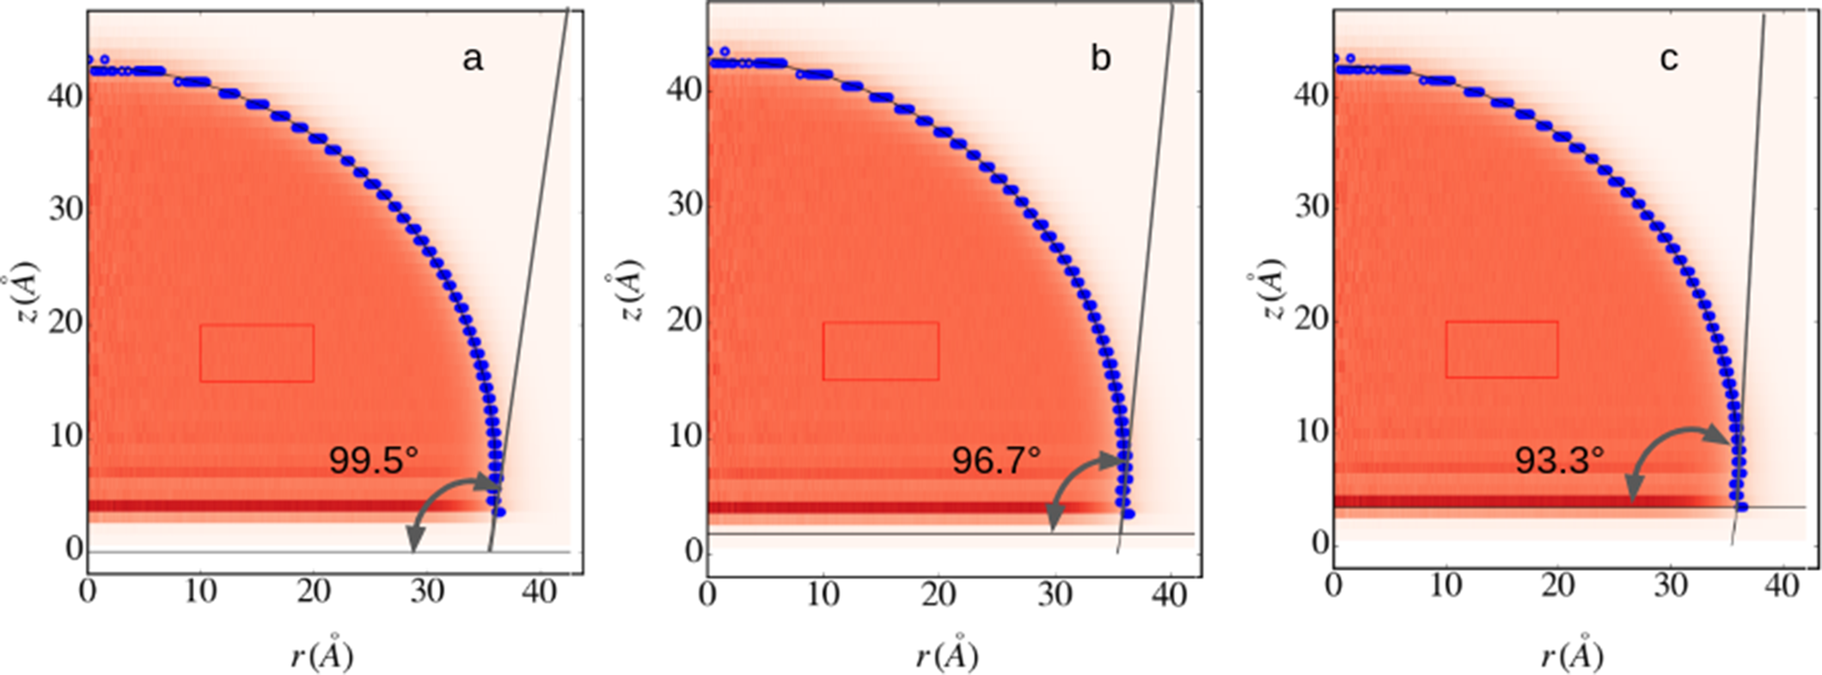
The 2-dimensional density
 $ \unicode{x03C1} \left(z,r\right) $
(Fig. 2) was extracted from the positions with a home-made program, where z is the height from the first atomic plane of the clay surface and r is the radial distance to the drop’s center of mass. The liquid–vapor interface was characterized by the blue points where the local density was equal to half the bulk density
 $ {\unicode{x03C1}}_0 $
, which was defined by the red square in the drop’s center. A circle segment was fitted to the blue dots, and the contact angle was calculated by intersecting the circular fit with the interface plane. Like the experimental contact-angle values, the simulated ones depend on the distance to the surface from which the tangential line was drawn. The impact of the choice of the water–clay interface on the contact angle value is illustrated in Fig. 2. As in the experiment, two extreme base lines could be considered: the first was situated at the
 $ z $
position of the surface atoms and the second at
 $ z $
position of the first water oxygen atoms. The distance between these two baselines was ~3–3.5 Å, which corresponded to ~8–10% of the drop radius. This percentage is close to its experimental equivalent, resulting in a range of angles of 3 to 6°. The baseline chosen to evaluate the contact angle was located at the mean distance between the two extreme baselines, as for experiments.
Representation of the contact-angle measurement from the density profiles of droplets extracted from molecular dynamics trajectories and the influence of the baseline placement on the measured contact angle values. The density profiles were extracted from the simulations performed on hydroxylated talc modeled by ClayFF. The same procedure was applied with PIM. The blue circles correspond to the positions where the water density is equal to half of the density of water in the droplet.

Results
Experimental contact angles
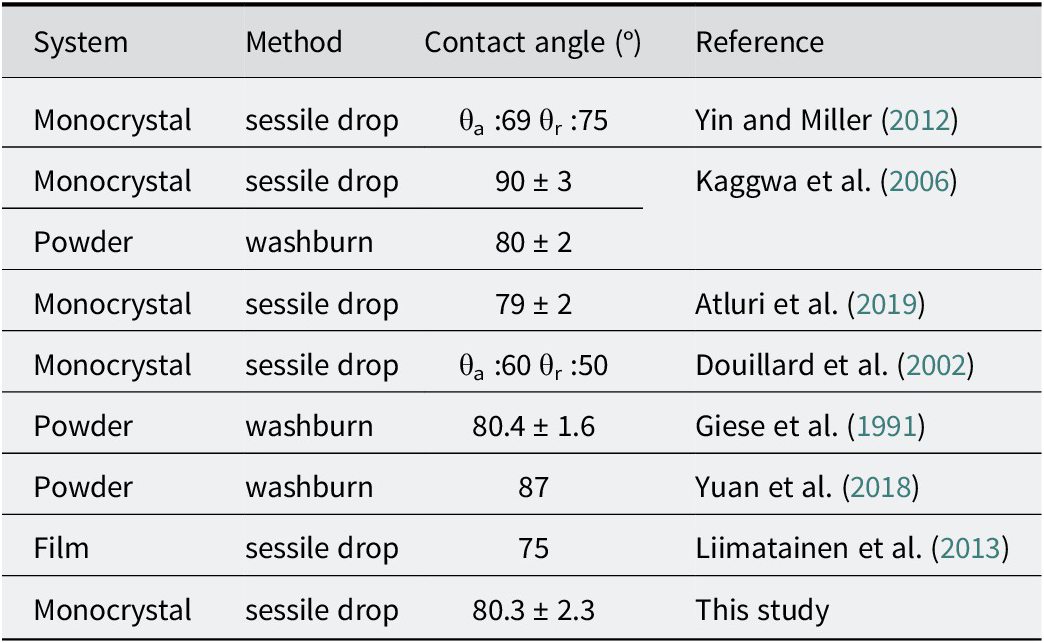
The final result was averaged over 54 measurements, resulting in a value of 80.3° with a standard deviation of 2.3°. A histogram of the distribution of the measured contact angle is given in Fig. S2 of SI. This value was compared with literature values given in Table 3.
Summary of different water contact-angle studies on various talc samples

Measurements of advancing and receding contact angles on a macrocrystal of talc were made by Yin and Miller (Reference Yin and Miller2012), obtaining angles of 69° and 75°, respectively, indicating a slightly hydrophilic behavior of the surface. However, no information on drop volume or in terms of the number of measurements was provided. In addition, it is unusual to observe an advancing angle which is greater than the receding angle. It is likely that the authors mistakenly reversed the order of the values.
Talc wettability was studied (Kaggwa et al., Reference Kaggwa, Huynh, Ralston and Bremmell2006) by measuring contact angles on both a single crystal and powders. They deposited ultrapure water droplets with a volume of 100 μL on a freshly cleaved surface using a micropipette. After only five static angle measurements, the average measured angle was
 $ 90\pm 3{}^{\circ} $
. Contact-angle measurements on powders were performed using the Washburn method (Washburn, Reference Washburn1921), resulting in a contact angle of
 $ 80\pm 2{}^{\circ} $
. Kaggwa et al. (Reference Kaggwa, Huynh, Ralston and Bremmell2006) explained the 10° discrepancy between these two measurements as being due to the hydrophilic edges of talc particles present in the powders, whereas only the basal surface of talc is considered in the sessile drop method on a single crystal.
An advancing angle of 60° and a receding angle of 50° were measured by Douillard et al. (Reference Douillard, Zajac, Malandrini and Clauss2002) on a single crystal of talc. Their values are significantly lower than others, which can be explained by the fact that their talc surface was polished rather than freshly cleaved, potentially leading to surface contamination.
A static contact angle of
 $ 75\pm 2{}^{\circ} $
on thin talc films made from powder was measured by Liimatainen et al. (Reference Liimatainen, Ezekiel, Sliz, Ohenoja, Sirviš, Berglund, Hormi and Ni-inimŠki2013). In the case of talc films, surface roughness is significant, and the contact angle may appear lower due to the presence of hydrophilic sites on the edges of clay particles.
An angle of 87° was obtained using the Washburn method (Yuan et al., Reference Yuan, Xie, Shi, Yi, Zhang, Zhang, Liu and Zeng2018), while a contact angle of
 $ 80.4\pm 1.6{}^{\circ} $
was measured by Giese et al. (Reference Giese, Costanzo and Van Oss1991), also using the Washburn method.
According to the literature, and even taking into account the variability in experimental procedures and the statistical uncertainty associated with such measurements, the contact angle of water on talc generally ranged from 75° to 90°. The average angle of 80.3° measured in this study was thus consistent with most literature values. Still, it is possible that the partial peeling of the monocrystal may have generated steps, resulting in a lower contact angle than might be expected on an ideal surface. Indeed, depending on the surface, it has been shown that roughness can either increase (Cassie and Baxter, Reference Cassie and Baxter1944; Wenzel, Reference Wenzel1936) the contact angle with the combined effect of the geometry of the surface and the surface tension of the liquid or reduce it (Wenzel, Reference Wenzel1936) by offering more sites for adhesion. The (010) plane of clays being more hydrophilic than the basal plane (Du and Miller, Reference Du and Miller2007; Nalaskowski et al., Reference Nalaskowski, Abdul, Du and Miller2007; Yin and Miller, Reference Yin and Miller2012), significant roughness and large steps should lead to a smaller apparent contact angle than the contact angle that would be obtained on an ideal surface but still closer to reality than contact angles obtained with samples of talc powder.
Simulated water contact angles and comparison with experimental data
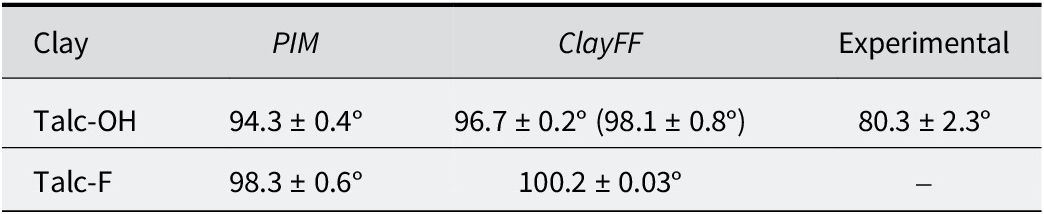
Calculated contact angles are reported in Table 4, together with the experimental contact angle.
Measured and calculated contact angles for the present study. The value in parentheses represents the contact angle calculated for the cylinder droplet on a talc-OH surface using the ClayFF force field (see text and section 3 of SI)

Although no contact-angle simulations have been carried out previously using PIM, the values found for hydroxylated and fluorinated talc with ClayFF were consistent with those reported by Rotenberg et al. (Reference Rotenberg, Patel and Chandler2011), i.e. 96° and 103°, respectively, using ClayFF and SPC/E as the water model. Atluri et al. (Reference Atluri, Jin, Shrimali, Dang, Wang and Miller2019) also simulated water droplets on talc surfaces using molecular dynamics with the ClayFF force field and the SPC/E water model. Those authors observed a contact angle of 70° after only 1 ns of simulation including equilibration, which was a relatively short simulation time. Generally, simulated droplets require a few nanoseconds to reach a stable state (Ravipati et al., Reference Ravipati, Aymard, Kalliadasis and Galindo2018).
Changing the force field had no drastic impact on the value of the contact angles, and the contact angle obtained for both forcefields in the case of hydroxylated talc were larger than experimental data. This may be partially explained by the fact that simulated surfaces were perfectly flat and devoid of defects, while the crystalline surface in the experiment was rough with large steps. Another interpretation was that neither force field chosen was good enough to provide a quantitative agreement with experiment.
Nevertheless, even if direct comparison between experiment and simulation was rather difficult in view of the defects in the sample, the angle given by PIM was closer to the experimental data than the ClayFF. Moreover, for the same force field, the contact angle on fluorotalc was greater than on the hydroxylated talc. Both force fields thus demonstrated the hydrophobic character of fluorine, as observed experimentally (Dazas et al., Reference Dazas, Lanson, Breu, Robert, Pelletier and Ferrage2013; Michot et al., Reference Michot, Villieras, Francois, Yvon, Le Dred and Cases1994). However, the difference remained moderate considering the differences observed in the amount of interlayer water in charged clays, depending on whether they are hydroxylated or fluorinated (Dazas et al., Reference Dazas, Lanson, Breu, Robert, Pelletier and Ferrage2013; Marry et al., Reference Marry, Dubois, Malikova, Durand-Vidal, Longeville and Breu2011).
The differences in contact angles calculated with the two force fields could be multi-factorial. If the force field chosen for the clay could play a role, e.g. polarizability, water properties could also differ from one water model to another. In the next section, the impact of the force field on the fluid is examined in more detail.
Structure of the fluid at the solid–liquid interface: comparison of the two force fields
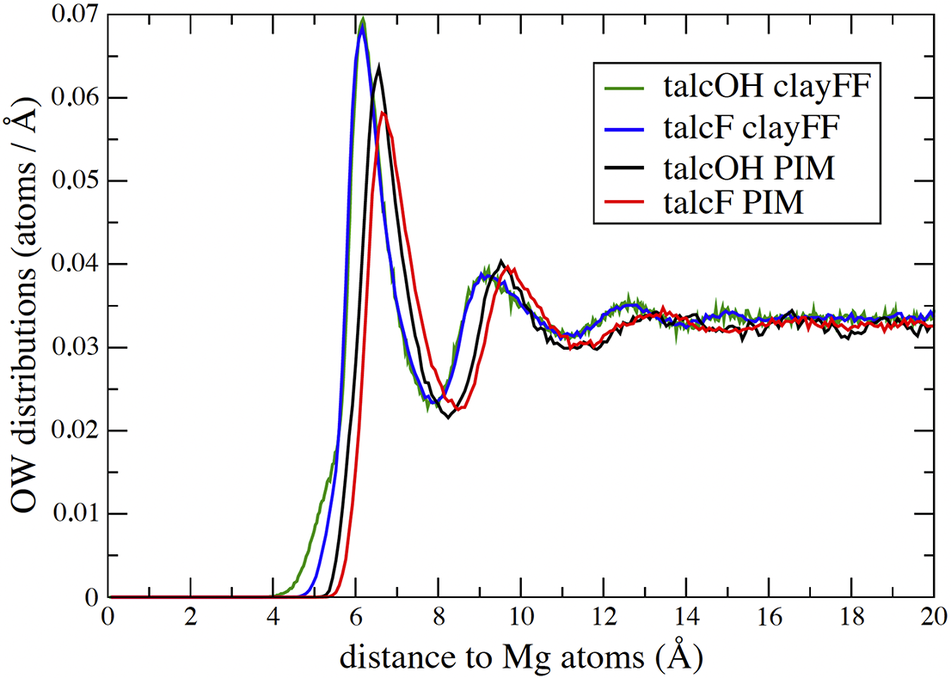
To study the structural organization of water at the water–clay interface, the atomic distributions of water oxygens with respect to the different surfaces were studied (Fig. 3). To avoid taking into account water molecules at the water–vapor interface that may have behaved differently from molecules at the heart of the drop, only molecules located inside a cylinder of radius 25 Å, the axis of which, perpendicular to the surface, passed through the drop’s center of gravity, were taken into account.
Atomic distributions of the oxygen atoms of the water molecules (OW) in the direction perpendicular to the talc surfaces. Black: talc-OH with PIM, Green: talc-OH with ClayFF, Red: talc-F with PIM, Blue: talc-F with ClayFF. The two curves obtained with ClayFF were the same, except for the shoulder in the case of talc-OH at ~5 Å. The distance to the surface was calculated as the difference between the vertical position
 $ z $
of the OW atoms and that of the Mg atoms in the middle of the clay layer.

The presence of peaks close to surfaces was a sign of layered water structuring, which is commonly present on the surface of many materials, even hydrophobic ones (Jamadagni et al., Reference Jamadagni, Godawat and Garde2011; Monroe et al., Reference Monroe, Barry, De Stefano, Aydogan Gokturk, Jiao, Robinson-Brown, Webber, Crumlin, Han and Shell2020). As revealed in Fig. 3, water molecules were located closer to the surface for ClayFF than for PIM. Furthermore, the first distribution peak was less intense in the case of PIM than ClayFF. It has already been observed that PIM induced a more disordered organization of water molecules compared to the ClayFF force field, probably responsible for the slightly better reproduction of XRD patterns with PIM model (Hånde et al., Reference Hånde, Ramothe, Tesson, Dazas, Ferrage, Lanson, Salanne, Rotenberg and Marry2018; Tesson et al., Reference Tesson, Louisfrema, Salanne, Boutin, Ferrage, Rotenberg and Marry2018). On the other hand, the first minimum at ~8 Å and second peak at ~9–10 Å were more pronounced in PIM, suggesting longer-range fluid structuring.
For PIM, fluorinated talc repelled water molecules slightly further than hydroxylated talc, and the first peak was less pronounced. For ClayFF, distributions were very similar for both talcs with the exception of a pronounced shoulder near the surface in the case of hydroxylated talc. The Si-O-Si basal surface of talc has already been shown to be rather hydrophobic, the OH sites of the hydroxylated talc being the only hydrophilic parts that account for the adsorption of more water at low relative humidity on talc-OH compared with talc-F (Michot et al., Reference Michot, Villieras, Francois, Yvon, Le Dred and Cases1994; Rotenberg et al., Reference Rotenberg, Patel and Chandler2011). The hydroxyl group may add, through the presence of an additional dipole, an overall attraction with the fluid, which translates differently depending on the force field. In the case of ClayFF, the orientation of the hydroxyl group, which depends on whether the layers are trioctahedral or dioctahedral, or its replacement with fluorine, was shown to have an effect on water at the interface (Bourg et al., Reference Bourg, Lee, Fenter and Tournassat2017; Koishi et al., Reference Koishi, Lee, Fenter, Fernandez-Martinez and Bourg2022). However, this effect was observed with mica surfaces which are highly charged clays, where the electrostatic field at the surface orients water molecules with their hydrogen toward the surfaces. Consequently, these results are not directly comparable to the results of the present study. In the case of PIM, a detailed study of the induced atomic dipoles could perhaps provide a better understanding of the effect of replacing the hydroxyl with fluorine.
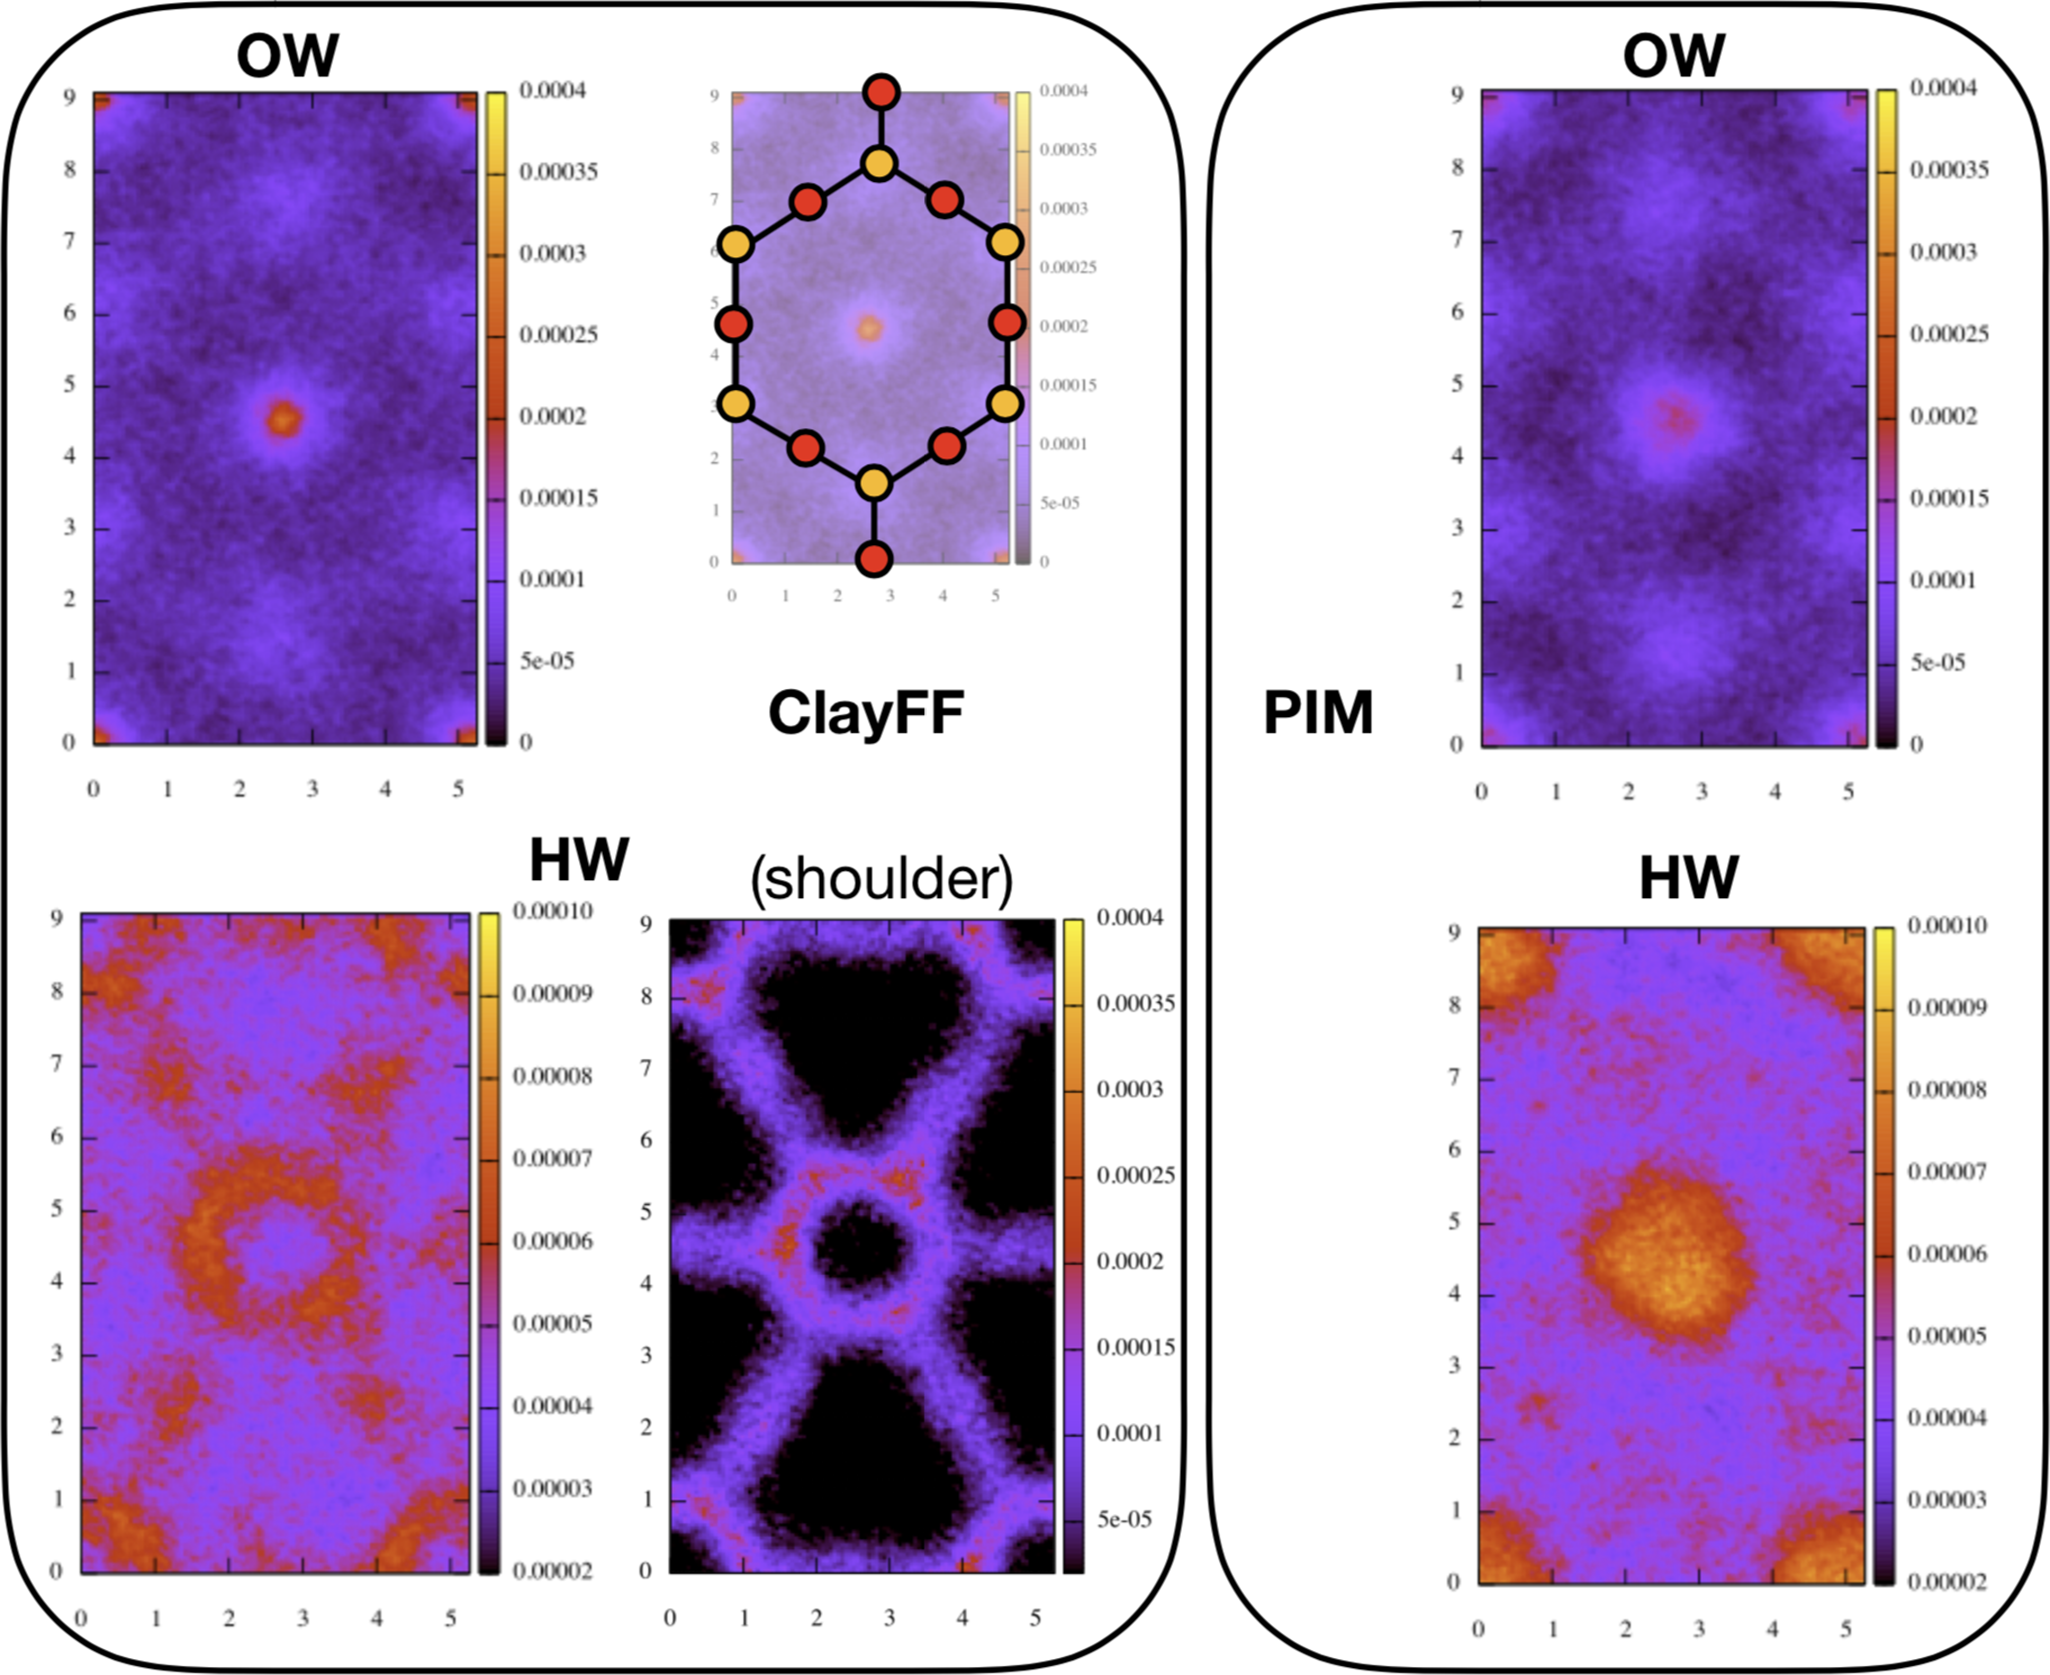
Distribution maps parallel to the clay layers were calculated for oxygen (OW) and hydrogen (HW) atoms of H2O molecules contained in the first peak of the vertical distributions. They are shown in Fig. 4 for talc-OH. The maps were reduced to a unit cell represented schematically on the figure by its surface O (in red) and Si (in yellow) atoms. For ClayFF, the distributions of HW in the shoulder of the first distribution peak were also plotted.
Atomic distributions of OW and HW in talc-OH, parallel to the surface and reduced to a unit cell, represented schematically by its surface O (in red) and Si (in yellow) atoms, shown at a smaller size in the left frame. The color scale goes from black (corresponding to the absence of atoms) to yellow (maximum concentration). Maximum concentrations were set at the same value for both force fields for each atom type. Only the scale for HW contained in the shoulder of the first distribution peak for ClayFF only (bottom right of the left frame) is different.

For both force fields, the OWs tended to be positioned above the surface Si and especially above the centers of the hexagonal cavities. The distributions for both force fields had characteristics similar to those obtained on the surface of montmorillonite, a charged clay (Le Crom et al., Reference Le Crom, Tournassat, Robinet and Marry2020). However, the preferential positions were less pronounced than in the case of charged clays, especially in the case of PIM force field, because in charged clays, H2O molecules orient themselves toward the surface to form hydrogen bonds with surface O atoms under the action of the electrostatic field created by the charges. The difference in intensity of OW distributions at the center of the cavity between the two force fields (slightly more intense for ClayFF than for PIM) was only due to H2O contained in the shoulder of ClayFF first peak distribution (Fig. 3). Indeed, these molecules featured pronounced structuring, as evidenced by the distribution of their HW atoms along the surface. In the case of talc-F (Fig. S3), no such structural organization is observed. On the other hand, there was an overconcentration of HW above the center of the cavity in the case of PIM. It corresponded to H2O located above hexagonal cavities, with an OH bond perpendicular to the clay layer pointing its H towards the center of the cavity. This overconcentration remained in the case of talc-F, albeit to a lesser extent (Fig. S4).
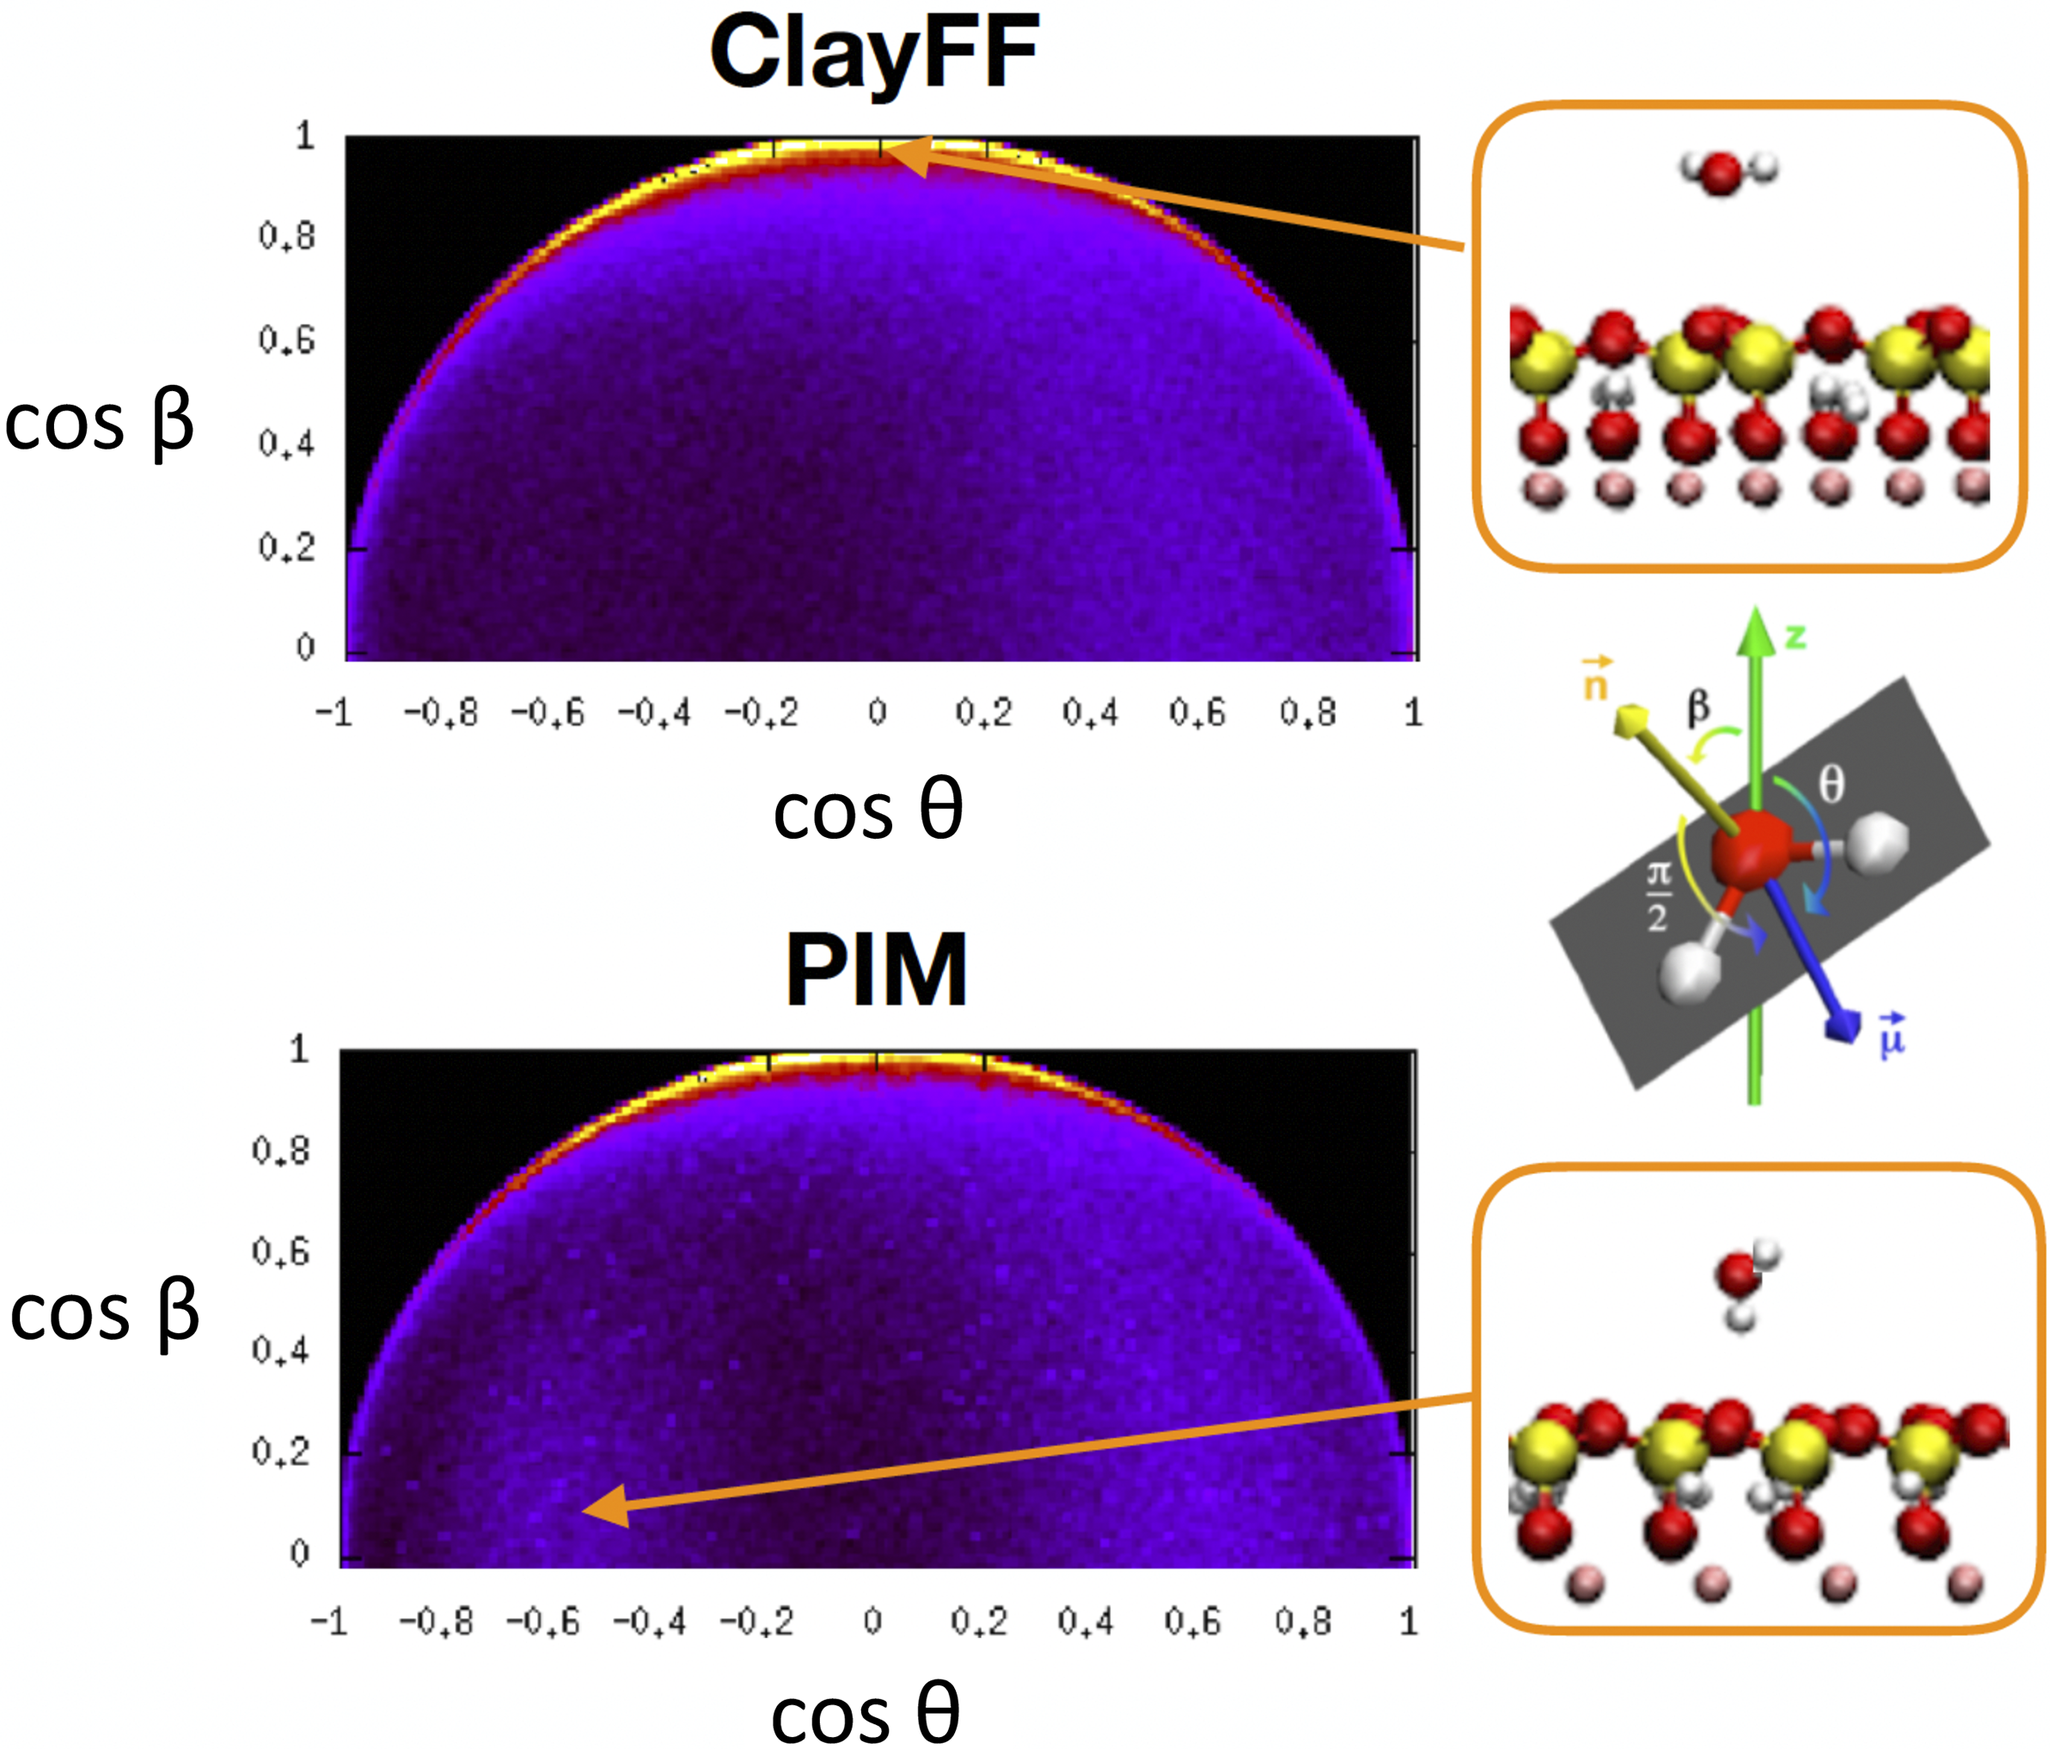
The preferential orientations were reflected in the distributions of H2O orientations. The orientation of a water molecule was defined by the angles
 $ \unicode{x03B8} $
and
 $ \unicode{x03B2} $
between the dipole vector
 $ \unicode{x03BC} $
and the dipole perpendicular to the plane of the molecule
 $ \mathbf{n} $
and perpendicular to the clay layer respectively, as shown on Fig. 5. When plotting cosβ as a function of cosθ for the molecules contained in the first peak of OW distribution, the two maps shown on Fig. 5 were obtained for talc-OH.
Orientational distributions for water molecules in the first distribution peak, i.e. the closest to the talc-OH surface. θ and β angles are defined on the diagram in the middle. The color scale is the same for both maps. It goes from black (zero probability) to yellow (maximum probability).

The greatest probability was obtained at θ ≈ 90° and β ≈ 0°, corresponding to molecules parallel to the surface. More generally, the preferential orientations seen on the circle cos2β + cos2θ = 1 corresponded to molecules with the plane defined by their two vectors μ and n perpendicular to the surface. Note that in the case of ClayFF, the few water molecules contained in the shoulder of the distribution peak (see Fig. 3) had their maximum probability on this circle, around cosθ = 0.4, or θ = 65° (Fig. S5). This corresponded to molecules with their two hydrogens slightly oriented towards the fluid and located at the same height. A relative maximum probability was also obtained around cosθ = 0.6 and cosβ = 0 for the two force fields, corresponding to a water molecule pointing an H vertically toward the fluid. A notable difference between the two force fields was the presence of a relative maximum for PIM at values cosθ = –0.6 and cosβ = 0. These values corresponded to water molecules pointing an H vertically towards the surface. These molecules were precisely those already observed on horizontal distributions pointing their H toward the center of the hexagonal cavities.
In the case of PIM, the distributions parallel to the clay surface with talc-F showed similar characteristics, although a little less marked. The main difference was for clayFF because the absence of water molecules in the cavities eliminated HW structuring and reduced the intensity of the OW distribution in the center of the cavities (Fig. S3). The orientations obtained with fluorinated talc were very similar to those in Fig. 5 and are not presented here.
Discussion
One of the thermodynamic quantities usually used to characterize the wetting behavior of a liquid on a solid surface is the work of adhesion, defined as the work per unit area required to remove a liquid from a solid surface:
 $$ {W}_{\mathrm{SL}}={\gamma}_{\mathrm{SV}}+{\gamma}_{\mathrm{LV}}-{\gamma}_{\mathrm{SL}} $$
where
 $ {\gamma}_{\mathrm{SV}} $
is the solid–vapor interfacial tension,
 $ {\gamma}_{\mathrm{SL}} $
the solid–liquid interfacial tension and
 $ {\gamma}_{\mathrm{LV}} $
the liquid surface tension.
Using Young’s equation (Young, Reference Young1805) which links the contact angle of a droplet of liquid on a solid surface with interfacial tensions:
 $$ {\gamma}_{\mathrm{LV}}\cos \theta ={\gamma}_{\mathrm{SV}}-{\gamma}_{\mathrm{SL}} $$
and knowing
 $ {\gamma}_{LV} $
, the work of adhesion can be calculated directly from the contact angle:
 $$ {W}_{\mathrm{SL}}={\gamma}_{\mathrm{LV}}\left(1+\cos \theta \right) $$
Experimentally, measuring the contact angle of a drop deposited on a surface is the most direct way of obtaining
 $ {W}_{\mathrm{SL}} $
. On the other hand, molecular simulations provide various ways of calculating
 $ {W}_{\mathrm{SL}} $
, including the measure of a contact angle on a solid surface. Bistafa et al. (Reference Bistafa, Surblys, Kusudo and Yamaguchi2021) have shown that these different methods give similar values of
 $ {W}_{\mathrm{SL}} $
to within a few percent for flat surfaces.
From statistical thermodynamics developments, it can be shown that
 $ {W}_{SL} $
depends only on solid/liquid interactions as:
 $$ {W}_{\mathrm{SL}}=-\left\langle {u}_{\mathrm{SL}}\right\rangle -T\Delta {s}_{\mathrm{SL}} $$
where
 $ \left\langle {u}_{\mathrm{SL}}\right\rangle $
is the mean solid–liquid interaction energy per unit area and has negative value. The minus sign in equation 11 comes from the fact that these interactions must be overcome to separate the liquid from the solid.
 $ \Delta {s}_{\mathrm{SL}} $
is the corresponding entropy increase upon the solid/liquid separation. As a result,
 $ {W}_{\mathrm{SL}} $
is the sum of a positive energetic term and a negative entropic term. It has been shown in the literature that two systems with the same average potential energy
 $ \left\langle {u}_{\mathrm{SL}}\right\rangle $
but different types of interaction (Lennard-Jones vs. Coulomb) could exhibit quite different work of adhesion values, with Coulomb interactions accentuating the entropy loss
 $ -\Delta {s}_{\mathrm{SL}} $
due to the presence of the interface and leading to smaller work of adhesion and then bigger values of θ (Surblys et al., Reference Surblys, Leroy, Yamaguchi and Müller-Plathe2018).
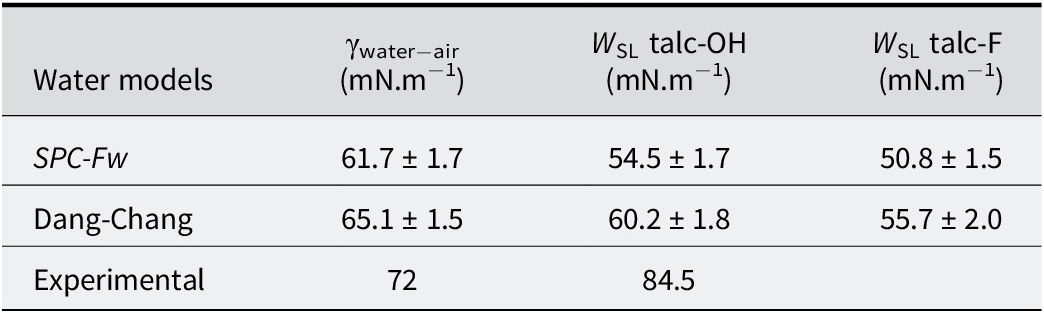
From a thermodynamic point of view, in order to understand the differences observed between force fields and experiment, it makes more sense to compare works of adhesion rather than contact angles. Indeed, while the work of adhesion is linked directly to the interactions between solid and liquid (equation 11), contact angle also depends on the interfacial tension of water, which can differ from one water model to another (equation 10). Then the interfacial tension of the two water models used in the present study were first calculated: flexible SPC for ClayFF (Teleman et al., Reference Teleman, Jšnsson and Engstršm1987) and Dang-Chang for PIM (Dang and Chang, Reference Dang and Chang1997). The method used to calculate these interfacial tensions is given in section 6 of SI. The calculated and experimental surface tension values are reported in Table 5. The value of
 $ {\unicode{x03B3}}_{\mathrm{water}-\mathrm{air}} $
obtained with the flexible SPC model was within the range of surface tensions obtained with other flexible models (52-70 mN/m) (Yuet and Blankschtein, Reference Yuet and Blankschtein2010). For the Dang-Chang model, the obtained
 $ {\unicode{x03B3}}_{\mathrm{water}-\mathrm{air}} $
value was well below that found by Dang and Chang (Reference Dang and Chang1997), i.e. 92 mN/m, but in their original article, the authors cut the interactions at 9 Å, without using the Ewald sum for coulombic interactions, and the simulation time was short (300 ps).
Water–air interfacial tension calculated for both water models used in this study. The works of adhesion values have been calculated with γwater−air estimated with the highest cutoff. Error bars include
 $ \gamma $
and contact angle errors

Using the
 $ {\unicode{x03B3}}_{\mathrm{water}-\mathrm{air}} $
values in Table 5 and contact angles values in Table 4, values for work of adhesion were calculated. They followed the same trends as contact angles (the greater the contact angle, the smaller the work of adhesion), except for talc-F with PIM which had a slightly greater work of adhesion than talc-OH with ClayFF, although the contact angle was slightly greater. These values were nevertheless very close, and this difference, due to the different values of
 $ {\unicode{x03B3}}_{\mathrm{water}-\mathrm{air}} $
did not change the qualitative conclusions: for both force fields, the work of adhesion was smaller for talc-F than for talc-OH. Moreover, both force fields yielded smaller values of works of adhesion than the experiment, i.e. the simulated surfaces were more hydrophobic, even though PIM was a little closer to the experiment.
Nevertheless, given that the error bars on
 $ {W}_{\mathrm{SL}} $
were of the order of 2 mN.m−1, i.e. only slightly smaller than the difference between
 $ {W}_{\mathrm{SL}} $
obtained for the different systems, the results were checked by calculating the difference in
 $ {W}_{\mathrm{SL}} $
between talc-OH and talc-F in another way, at least for ClayFF, using the alchemy command available in LAMMPS. Along a single simulation, the hydroxyl groups of the talc-OH were transformed into fluorine in order to calculate a free energy difference
 $ \Delta F $
(OH
 $ \to $
F). This transformation was done for dry and wet talc and the
 $ \Delta {W}_{\mathrm{SL}}={W}_{\mathrm{SL}}^{\mathrm{F}}-{W}_{\mathrm{SL}}^{\mathrm{OH}} $
was therefore obtained from the difference between wet and dry
 $ \Delta F $
. The procedure used is described in section 7 of SI. Using this procedure, a value for
 $ \Delta {W}_{\mathrm{SL}}=-3.1\pm 0.2 $
mN.m−1 was obtained, which was a little smaller in absolute value than the value obtained with contact angles, i.e. -3.7 mN.m−1, but it confirmed the order of magnitude and supports the conclusion that the fluorinated talc was slightly more hydrophobic than the hydroxylated one.
The work of adhesion is linked directly to the interaction energy between water and the surface through the first term of equation 11. In the case where solid–water interactions were represented by Lennard-Jones only, previous works showed an almost proportional relationship between
 $ {W}_{\mathrm{SL}} $
and –
 $ \left\langle {u}_{\mathrm{SL}}\right\rangle $
that was independent of the type of surface and water model (graphite, graphene, silica) (Leroy et al., Reference Leroy, Liu and Zhang2015; Surblys et al., Reference Surblys, Leroy, Yamaguchi and Müller-Plathe2018). As a result, the negative entropic term -
 $ T\Delta {S}_{\mathrm{SL}} $
in equation 11 was also almost proportional to –
 $ \left\langle {u}_{\mathrm{SL}}\right\rangle $
and its absolute value increased with –
 $ \left\langle {u}_{\mathrm{SL}}\right\rangle $
: the more the liquid was attracted by the solid, the more the fluid was constrained to the surface and lost entropy. However, this entropy loss varied according to the type of interaction between fluid and solid. Thus, for two interfaces with the same interaction energy
 $ \left\langle {u}_{\mathrm{SL}}\right\rangle $
, the entropic term could be very different, depending on whether the interaction between the solid and the fluid molecules was of the Lennard-Jones type only, or whether there were also coulombic interactions (Surblys et al., Reference Surblys, Leroy, Yamaguchi and Müller-Plathe2018). In the latter case, the entropy loss was greater and the work of adhesion smaller. Separating the energy term from the entropy term requires calculation of –
 $ \left\langle {u}_{\mathrm{SL}}\right\rangle $
. Such a calculation is not straightforward, as it requires separation of the different energy terms according to the different groups of atoms in the overall energy calculation, a procedure that is not implemented in Metalwalls. Still, –
 $ \left\langle {u}_{\mathrm{SL}}\right\rangle $
could be calculated with LAMMPS, in the case of ClayFF force field. Values of –
 $ \left\langle {u}_{\mathrm{SL}}\right\rangle $
= 92.7 mN.m−1 for talc-OH and 80.1 mN.m−1 for talc-F were found, which indicated that the attraction between water and talc was stronger when talc was hydroxylated. From
 $ {W}_{\mathrm{SL}} $
and
 $ \left\langle {u}_{\mathrm{SL}}\right\rangle $
, the loss of entropy linked to the formation of the solid/liquid interface could be calculated: –
 $ T\Delta {s}_{\mathrm{SL}} $
= –38.2 mN.m−1 and –29.3 mN.m−1 for talc-OH and talc-F respectively. Entropy loss actually increased (in absolute value) as the energy of attraction between solid and fluid increased. A similar trend was also observed in highly charged clays such as micas (Koishi et al., Reference Koishi, Lee, Fenter, Fernandez-Martinez and Bourg2022).
When these results were compared with those obtained by other teams who have worked on similar surfaces, i.e. moderately hydrophobic, striking analogies could be found. In particular, Surblys et al (Reference Surblys, Leroy, Yamaguchi and Müller-Plathe2018) studied in detail the dependence of work of adhesion and entropy loss on the intensity of interatomic interactions at the interface between silica (SiO2) and water. By progressively turning on the Lennard-Jones interactions between solid and fluid with a coupling parameter
 $ \unicode{x03BA} $
such that
 $ {V}_{\mathrm{LJ}}=\unicode{x03BA} (4{\varepsilon}_{ij}[{\sigma}_{ij}^{12}/{r}_{ij}^{12}-{\sigma}_{ij}^6/{r}_{ij}^6]) $
(
 $ \unicode{x03BA} $
ranging from almost 0 to 2), then the coulombic interactions with a coupling parameter
 $ \unicode{x03BB} $
, such as
 $ {V}_{\mathrm{Coulomb}}=\unicode{x03BB} {\sum}_{i,j}{q}_i{q}_j/(4{\pi \varepsilon}_0{r}_{ij}) $
(
 $ \unicode{x03BB} $
ranging from 0 to 2), they were able to study the evolution of
 $ {W}_{\mathrm{SL}} $
and -
 $ T\Delta {s}_{\mathrm{SL}} $
with increasing values of -
 $ \left\langle {u}_{\mathrm{SL}}\right\rangle $
corresponding to various couples (
 $ \unicode{x03BA} $
,
 $ \unicode{x03BB} $
). In particular, they found that
 $ {W}_{\mathrm{SL}} $
and -
 $ T\Delta {s}_{\mathrm{SL}} $
were different affine functions of -
 $ \left\langle {u}_{\mathrm{SL}}\right\rangle $
depending on whether
 $ \unicode{x03BA} $
was varied while
 $ \unicode{x03BB} $
was fixed to 0 (i.e. varying LJ interactions and no coulombic interactions), or
 $ \unicode{x03BB} $
was varied while
 $ \unicode{x03BA} $
was fixed to 1 (i.e. varying coulombic interactions and full LJ interactions). So two systems (
 $ \unicode{x03BA} $
, 0) and (1,
 $ \unicode{x03BB} $
) having the same average interaction energy -
 $ \left\langle {u}_{\mathrm{SL}}\right\rangle $
had different
 $ {W}_{\mathrm{SL}} $
and -
 $ T\Delta {s}_{\mathrm{SL}} $
. To be more precise, the system with Lennard-Jones interactions only (corresponding to (
 $ \unicode{x03BA} $
, 0)) had a lower entropy loss and therefore greater work of adhesion.
Surprisingly the values of
 $ {W}_{\mathrm{SL}} $
and –
 $ T\Delta {s}_{\mathrm{SL}} $
for both talcs simulated with ClayFF were located on exactly the same linear function as Surblys et al. (Reference Surblys, Leroy, Yamaguchi and Müller-Plathe2018), i.e. that corresponding to a
 $ \unicode{x03BB} $
that varied, with the value of
 $ \unicode{x03BA} $
fixed at 1. More precisely,
 $ {W}_{\mathrm{SL}} $
and –
 $ T\Delta {s}_{\mathrm{SL}} $
were the same for talc-F and the couple (
 $ \unicode{x03BA} =1 $
,
 $ \unicode{x03BB} =1 $
), which corresponded to the silica/water interface with full Lennard-Jones and full coulombic interactions. In comparison, values for talc-OH corresponded to silica–water interface with coupling parameters
 $ \unicode{x03BA} =1 $
and
 $ \unicode{x03BB} =1.4 $
, i.e. full LJ interactions and increased coulombic interaction compared to silica–water interface. As both solid surfaces (silica and talc) are made of silicon oxide, with oxygens slightly closer to the fluid than silicons, it was reasonable to assume that the effects of both surfaces on water were similar, even if Si-O-Si patterns on the surface were different. Moreover, as Lennard-Jones interactions are short-range, they are governed more by surface atoms in direct contact with the fluid. These two reasons may explain why the two talcs had same
 $ {W}_{\mathrm{SL}} $
and –
 $ T\Delta {s}_{\mathrm{SL}} $
values as silica with full Lennard-Jones interactions (
 $ \unicode{x03BA} =1 $
). The effect of OH/Fs located deeper in the talc layer on the fluid was more likely to be of coulombic origin: the presence of the additional dipole due to the hydroxyl group (with its H oriented towards the surface) would be at the origin of an additional attraction responsible for the shoulder visible on the OW distributions which would explain the increased value of
 $ \unicode{x03BB} $
for talc-OH.
Consider now the results obtained with the PIM force field. Even if the
 $ \left\langle {u}_{\mathrm{SL}}\right\rangle $
energy in the case of the PIM polarizable force field could not be calculated, the results could, nevertheless, be commented on, in the light of Surblys’ (Reference Surblys, Leroy, Yamaguchi and Müller-Plathe2018) work on silicas. The structure of the fluid at the interface reflected to some extent the attraction of the fluid to the surface. When similar systems with the same types of interactions were compared, the greater the interaction, the closer the fluid was expected to approach the surface (Godawat et al., Reference Godawat, Jamadagni and Garde2009), and the greater the distribution peaks, particularly the first peak (Maibaum and Chandler, Reference Maibaum and Chandler2007). However, the distribution of molecules in the vicinity of the surface varied significantly with the type of interactions between the fluid and the surface. Surblys thus obtained very different OW distributions for silicas with LJ interactions only (
 $ \unicode{x03BB} $
fixed to 0) and with mixed LJ and coulombic interactions (
 $ \unicode{x03BA} $
fixed to 1). For two systems having the same average interaction energy
 $ \left\langle {u}_{\mathrm{SL}}\right\rangle $
, Lennard-Jones interactions gave distribution peaks further from the surface, but also more pronounced than a mixture of Lennard-Jones and Coulombic interactions. Similar differences were also observed when comparing profiles obtained with PIM and ClayFF. The fact that PIM gave profiles further from the surface was not synonymous with less attraction.
Nevertheless, regardless of the interaction, Surblys also found that the surface density of water in the surface layer (corresponding to the number of water molecules in the first adsorption layer per surface unit) increased with
 $ -\left\langle {u}_{\mathrm{SL}}\right\rangle $
and followed the same increasing function of
 $ -\left\langle {u}_{\mathrm{SL}}\right\rangle $
regardless of the intensity and type of solid/liquid interaction (LJ only or mixed LJ and coulombic interactions). By counting the number of water molecules contained in the first distribution peaks, average surface densities
 $ \left\langle {n}_{\mathrm{ads}}\right\rangle $
of 10.7 and 10.4 molecules per nm2 for ClayFF in talc-OH and talc-F respectively, and 9.8 and 9.4 molecules per nm2 for PIM in talc-OH and talc-F, respectively, were obtained: a greater density for ClayFF than for PIM (which was consistent with a more intense first peak in ClayFF distributions) suggested a lower interaction energy –
 $ \left\langle {u}_{SL}\right\rangle $
for PIM than for ClayFF. If this assumption was correct, then the origin of the larger value for work of adhesion obtained with PIM was necessarily entropic, in the same way that silicas interacting with the fluid via LJ potentials alone caused an entropy loss of the fluid lower than that interacting via a mixture of LJ and coulombic potentials. It could be assumed therefore that the fluid was less constrained, and therefore lost less entropy when located further away from the surface, as was the case for PIM and for silicas with LJs interactions only.
The measurement of local density fluctuations at the surface has often been used to characterize the solvophobicity of surfaces: the more solvophobic a surface, the greater the local fluctuations (Acharya et al., Reference Acharya, Vembanur, Jamadagni and Garde2010; Ashbaugh et al., Reference Ashbaugh, Vats and Garde2021; Evans and Stewart, Reference Evans and Stewart2015; Jamadagni et al., Reference Jamadagni, Godawat and Garde2011; Wilding et al., Reference Wilding, Evans and Turci2024; Willard and Chandler, Reference Willard and Chandler2014). The fluctuations in the number of water molecules in the surface layer containing the first peak of distribution of OW atoms were calculated. The values obtained were
 $ \langle {({n}_{\mathrm{ads}}-\langle {n}_{\mathrm{ads}}\rangle )}^2\rangle /\langle {n}_{\mathrm{ads}}\rangle = $
0.180 and 0.179 for talc-OH and talc-F simulated with ClayFF respectively, and 0.169 and 0.173 for talc-OH and talc-F simulated with PIM respectively. The fluctuations were noticeably lower in the case of PIM, which was consistent with a more hydrophilic surface with this force field.
Conclusions
Two talcs, hydroxylated and fluorinated, were studied in a first attempt to understand the difference in hydrophilicity due to the exchange of the hydroxyl group by fluorine, observed in a number of clays.
To this end, careful measurements of contact angles on single crystals were undertaken, as well as molecular simulations with two different force fields (one non-polarizable and one polarizable). Whatever the force field used, the calculated contact angles overestimated values found by experiment. Moreover, fluorinated talc was found to be slightly more hydrophobic than hydroxylated talc for both of the force fields considered. Despite the fact that the properties of the fluid at the interface were quite, or even very different between the force fields, the contact angles (and related work of adhesion values) remained quite close to each other, and similar to those obtained on similar silica-type surfaces. This would seem to indicate that obtaining smaller angles in the case of experiment was due to the presence of steps on monocrystal surfaces, which rendered the real surface more hydrophilic than the ideal one.
When comparing the two force fields, it is obvious that the density of water near a surface was not a good indicator of the surface’s hydrophilicity: despite the fact that the density peaks were closer to the surface and more intense in the case of ClayFF, ClayFF produced the most hydrophobic surfaces. Indeed, more depletion close to the surface in the case of PIM, which could be the sign of less attraction between the fluid and the solid on one hand, could be responsible for less contraint for the fluid on the other hand, leading to less entropy loss and therefore to greater work of adhesion. Then, although the two force fields finally produced relatively close contact angles, the properties of the fluid at the interface were significantly different from a thermodynamic point of view, and in particular from the point of view of the balance between energy and entropy.
In the future, the differences in hydrophilicity between charged clays will be investigated, in particular to understand the origin of the more hydrophobic behavior of fluorinated clays compared with hydroxylated clays (Malikova et al., Reference Malikova, Cadone, Dubois, Marry, Durand-Vidal, Turq, Breu, Longeville and Zanotti2007; Michot et al., Reference Michot, Villieras, Francois, Yvon, Le Dred and Cases1994). In the case of charged clays, which are more hydrophilic due to the presence of counter ions on their surface, the contact angle is not a good indicator because the drop spreads over the surface. Other methods, such as the thermodynamic integration used in the present article (see Supplementary Information, section ‘Alchemy transformation with ClayFF force field’) will then have to be considered in order to calculate differences in free energy between clays containing F or OH, or different cations. Note that it could also be interesting to test force fields other than those in the present study, such as the recently developed ReaxFF for use with earth materials (Gao et al., Reference Gao, Zhang, Liu and Lu2024; Zhang et al., Reference Zhang, Liu, van Duin, Lu and Meijer2024).
Supplementary material
The supplementary material for this article can be found at http://doi.org/10.1017/cmn.2025.8.
Author contributions
L. Guérin carried out the experimental measurements under the direction of L. Michot and the molecular dynamics simulations of contact angles under the direction of V. Marry. T. Bernhard carried out the thermodynamic integration to determine the work of adhesion under the supervision of V. Marry. E. Ferrage provided the talc samples and supervised and advised L. Guérin throughout this work, as did F. Claret. All authors provided quality feedback and significantly influenced the research and manuscript.
Acknowledgements
This work was granted access to the HPC resources of IDRIS under the allocation 2021-A0100412473 made by GENCI. The authors are grateful to the CNRS interdisciplinary ‘défi Needs’ program (Project DARIUS). V. Marry thanks R. Vuilleumier for fruitful discussions.
Financial support
L. Guérin’s work was funded by the CNRS interdisciplinary ‘défi Needs’ program (Project DARIUS).
Competing interests
The authors declare that they have no competing interests.