1 INTRODUCTION
For several decades, economists and historians have paid special attention to the social savings of railroadsFootnote 1. Railroads yielded social savings because they provided lower cost and faster transportation than the best alternative. Shippers and passengers saved on transport costs and therefore experienced an increase in their surplus by using railroad services. In a seminal article, Fogel (Reference Fogel1964) indicated that railroads led to a reduction in transportation costs in the United States in the 19th century, but the savings in transport costs (social savings of the railroad) were relatively lowFootnote 2. Railroads did not have a large impact on transportation costs because there was a system of navigable rivers and canals, which tended to provide fast and low-cost transportation for long distancesFootnote 3. Other studies extended the analysis to other countriesFootnote 4. In general, it seems that social savings were low in countries where waterways were available. In most of Europe, a system of rivers, canals and coastal routes was also available and, consequently, the social saving of the railroad was usually as low as in the United States. In England and Wales, for example, prior to the railroad, freight was carried by a system of canals and only occasionally by the most expensive system of non-rail land transportFootnote 5.
On the other hand, the evidence indicates that the social savings of the railroad in some Latin American countries was large due to the lack of waterways. For Mexico, Coatsworth (Reference Coatsworth1979) indicates that the social saving of the railroad was larger than in industrialised economies due to the lack of navigable rivers and canalsFootnote 6. Most transportation in Mexico was then conducted by wagons and mules. «Except for local freight across three large lakes near highland population centers and short hauls up several rivers from the Gulf to the base of the mountains, internal water transport was unknown» (Coatsworth Reference Coatsworth1979, p. 947). Also, considering that most Mexicans lived far from the two coasts, coastal shipping did not play the same role as it did in the United States and in Europe. In these circumstances, the construction of railroads led to a large reduction in transportation costs. Similarly, in Brazil, the social savings of Brazilian railroads were largeFootnote 7. As indicated by Summerhill (Reference Summerhill2005), prior to the railroad, freight had to travel over Brazil's coastal mountain range on the backs of mules, or at best on wagons or carts. This system of transportation was costly, so the construction of railroads had a large impact on transportation costs.
The aim of this article is to estimate the social savings of the railroad in Peru for the period 1890-1918. Our estimates indicate that the social savings of the railroad ranged between 0.3 per cent and 1.3 per cent of GDP in 1890, but then increased to a range between 3.6 per cent and 9.4 per cent of GDP in 1918. These social savings were similar to those in the United States and other industrialised economies, but were much lower than in Mexico, Brazil and Argentina.
The Peruvian case is interesting because it challenges our view on the factors that influenced the social savings of the railroad. From the studies for the United States, Western Europe and Latin America one might conclude that the social savings of the railroad were large if waterways were not available. The lack of waterways implied that transportation was conducted by the expensive system of overland transportation in wagons or on the backs of animals and men. When looking at the case of Peru, however, one finds that the lack of canals and navigable rivers was not a sufficient condition for large social savings. Peru lacked waterways, but the social savings of railroads were not very high. In fact they were similar to those in the United States and other industrialised economiesFootnote 8, and were much lower than in Mexico, Brazil and Argentina.
Railroads were built in Peru from 1850. At that time, the construction of railroads was considered promising by Peruvians. Several argued that Peru would be able to take advantage of its great endowments of natural resources (mining resources and land) with the introduction of the railroad. In the 1850s, Ernest Malinowski argued that with reliable rapid transportation, Peruvians «should be able to compete with analogous goods from other countries. And not just in foreign markets, but even in this country, as wheat, coffee, cacao, and so on prove, which for the coastal consumer now come largely from abroad — even when interior growers can supply them in sufficient quantity, even superior quality»Footnote 9. Later in 1860, Manuel Pardo indicated that the construction of railroads would reduce transportation costs dramatically, allowing the exploitation of natural resources, especially in the central highlandsFootnote 10. According to Pardo, «if the locomotive, in other countries, facilitated production and commerce, in ours its mission is much higher: to create what today does not exist; to fertilise and give life to the elements of wealth, which today lie in an embryonic, latent state»Footnote 11. In the following decades, several million dollars were invested in rail constructionFootnote 12. The total number of kilometres of railway track increased from only 25 in 1855 to 1,792 in 1875Footnote 13.
Several historians have questioned the assertion that railroads had a large positive impact on the growth of the Peruvian economy. In his encyclopedic Historia de la República del Perú, Jorge Basadre argued that railroads were not as beneficial as believed in the 19th century, and that Peru required much more than only investing fiscal resources in large rail investment projects. According to Basadre, «it was not enough with spilling the public fortunes to stimulate and develop work, to give to the laborer the conscience of his own strength, to multiply the value of properties and to assimilate the public and private welfare, as it was believed back then»Footnote 14. More recently, Contreras (Reference Contreras2004) argued that railroads may have helped to solve transport problems in the central highlands, but the mining sector faced other bottlenecks, such as the lack of disciplined working force and irregularities in provision of inputs (Contreras Reference Contreras2004, p. 172). Moreover, Miller (Reference Miller1976b) argued that the Central Railway only favoured the copper industryFootnote 15. Overall the railway's impact on the economy was much lower than in the copper sectorFootnote 16. For instance, little development in arable agriculture took place in the central highlands.
This article complements previous historical studies on Peru by calculating the social saving of the railroad. By calculating the social savings one can determine whether the effects of railroads on transport costs were large or rather small in comparison to the size of the overall economy. The structure of the article is as follows. Section 1 describes the transport system in Peru in the 19th and early 20th century. Section 2 estimates the freight savings, that is the savings in transport costs of shippers due to the railroad. Section 3 estimates the passenger savings, making a distinction between savings on travel fares and time savings. Section 4 compares our results for Peru with those for other Latin American countries. Section 5 concludes the paper.
2 RAILROADS AND ALTERNATIVE MODES OF TRANSPORTATION
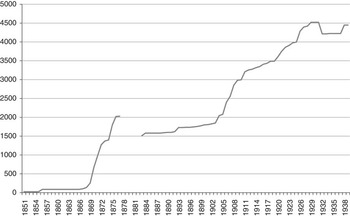
Railroads have operated in Peru since the mid-19th century. The first railroad, which ran between Lima and Callao, started to operate in 1850. Several railroads were then built in the north, centre and south of Peru, especially during the government of José Balta (1868-1872). In the 1860s and 1870s there was much optimism surrounding the construction of railroads. There seemed to be almost a consensus that with the construction of railroads Peru could exploit its vast natural resources in mining and agriculture, and foster economic prosperity. The state invested large sums of money, mostly obtained during the guano boom. In 1865-1878, the state invested more than 100 million dollars in building railroads. The railway network then increased from only 87 km in 1865 to 1,792 km in 1875 (Figure 1).
RAILROAD LENGTH (KM).
Source: Extracto Estadístico (1939).

The decline in guano reserves and fiscal revenues in the mid-1870s slowed down railroad construction. Moreover, several railroads were destroyed during the War of the Pacific (1879-1883) between Peru and ChileFootnote 17. Railroad length then declined from 2,030 km in 1877 to 1,509 km in 1883. Furthermore, the war caused a severe economic contraction in Peru and damaged its fiscal finances, making it practically impossible to continue with the construction of railroads for several years.
With the signing of the Grace Contract between the Peruvian state and the Peruvian Corporation in 1889, this foreign corporation took over the administration of state railroads and was committed to investing in reconstructing the damaged lines and expanding the railway trackFootnote 18. A British Vice-consul of the time saw the future of Peru with optimism: «The prolongation of the railroads of Peru, consequent on the Bondholders’ contract with the government», argued the Vice-consul, «will lead to the opening up of immense agricultural and mining fields, and will give life to all the great national industries of the interior, which so long have been awaiting the means of communication with the coast in order to spring into activity… Peru may reasonably look forward to a prosperous future»Footnote 19. Overall, however, the construction of railroads was a slow process in the 1890s and early 1900s. The railway network increased from 1,509 km in 1883 to only 1,848 km in 1903.
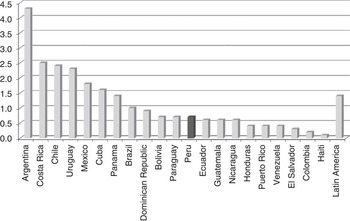
The process of building railroads gathered pace from 1905. The total railroad network increased to almost 3,000 km in 1910 and 3,487 km in 1918. However, in terms of railroad density, Peru was far behind many countries in Latin America. By 1913, for example, Peru only had 0.7 km (around 0.4 miles) of railway track per 1,000 inhabitants, below the Latin American average of 1.4 km/1,000 inhabitants (Figure 2). Peru was far behind Argentina, which had 4.3 km/1,000 inhabitants, around seven times more than Peru. Other countries with a clear lead over Peru were Chile, Costa Rica and Uruguay. All of these countries had more than 2 km/1,000 inhabitants. Other countries with more railway length per-capita than Peru were Mexico, Brazil, Cuba, the Dominican Republic and Panama. In South America, Peru only performed better than Colombia, Ecuador and Venezuela.
RAILWAY LENGTH PER 1,000 INHABITANTS (KM).
Source: Bulmer-Thomas (Reference Bulmer-Thomas2003).

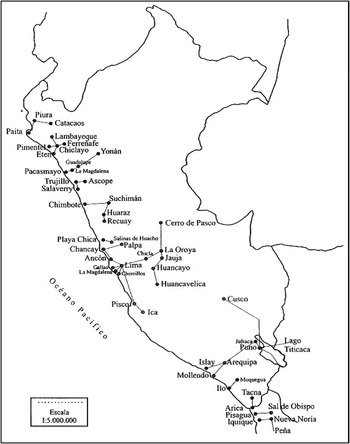
The railroad system of Peru of the early 20th century consisted of a long list of railroads, but most of them were very short and were not part of a unified network (Figure 3). Of all the railroads, only two linked the coast and the sierra: the Central Railway and the Southern Railway. The Central Railway connected the port of Callao with the city of Lima and several towns in the central highlands, largely dedicated to miningFootnote 20. The main line of the railway was Callao-Lima-La Oroya. The Peruvian Corporation then built a branch from Ticlio to Mororocha in 1900; the Cerro de Pasco Railway Co. built another line from La Oroya to Cerro de Pasco in 1904, extending the area of influence of the Central Railway far beyond La Oroya. The railroad then reached Jauja and Huancayo in 1908. Another railway system, the Southern Railway, connected the coast and the highlands in the south: it linked the port of Mollendo with the departments of Arequipa, Puno and Cuzco. In addition, there were a number of short railroads that connected coastal valleys, the main coastal cities and the Pacific seaboardFootnote 21.
MAP OF RAILROADS OF PERU, 1850-1930
Source: Taken from Deustua (2010), p. 191.

Most Peruvian territory lacked railroad facilities and waterways, and relied on the traditional system of mules and llamas. Dávalos and Lissón (1919) indicates that, according to a study by the engineer Tizón and Bueno, there were around 10,000 towns in Peru in the 1910s and that only 300 of them were connected by railroad in the late 1910s. Similarly, Milstead (Reference Milstead1928) indicates that railroad infrastructure was very deficient not only in the highlands but also on the coast. According to Milstead, in the early 1920s primitive transportation facilities persisted in around 85 per cent of the country. Although some railways had been constructed from the 1850s, there was no integrated railway network: «…most of the railways consist of short isolated lines of varying gauges connecting an ocean port with the chief towns and plantations of the adjacent irrigated valleys» (Milstead Reference Milstead1928, p. 68).
The traditional system of mules and llamas was the closest substitute for railroads in the early 20th century. Several sources indicate that in the absence of railroads in most of the Peruvian territory, mules and llamas were widely used for transportation. The road system in most of the territory was inadequate for wagons. In 1906, Carlos Cisneros indicated that «most transportation was conducted on the backs of mules» (Cisneros Reference Cisneros1906, p. 123). In 1921, E. C. Vivian indicated that «the cross-country roads are in general nothing but steep ill-made pack-mule trails» (Vivian Reference Vivian1921, p. 111). In 1927, Clarence Jones indicated that most towns largely depended on the traditional system of mules and llamas (Jones Reference Jones1927, p. 24). Horses could also be used for transportation along the coast; however, in the extreme conditions of Peru's sandy and dry deserts, mules were probably more suitable than horsesFootnote 22. Even on the Lima-Callao route, traffic was «unthinkable without mule trains» (Waszkis Reference Waszkis1993, p. 137).
Railroads represented a much faster mode of transportation than mules and llamas. In the central region, for example, a train only took 11 hours to complete the route Lima-Cerro de Pasco, traversing the Andes Mountains. In the south, the Pisco-Ica railroad completed the 48-mile route in <4 hours. In contrast, travellers could take nearly a day by horse through the desert. In addition, freight rates were usually lower for railroads than mules, especially for long routes (Zegarra Reference Zegarra2011). Llamas could only compete with railroads in terms of costs: for some routes llamas offered a cheaper system of transportation, which probably explains why a large proportion of bulky products were transported on the backs of llamas even after the construction of railroadsFootnote 23.
Mules had some advantages and disadvantages in comparison with llamas. One of the advantages of mules with respect to llamas is that mules could carry up to 300 pounds, whereas llamas could not carry more than 125 pounds, and even 100 pounds was usually considered a full load (Hills Reference Hills1860, p. 101). Mules, then, were more appropriate for carrying heavy items. In addition, mules were faster than llamas: mules could complete as much as 60 km/day, whereas llamas could only cover ≤25 km. Finally, mules could stand the heat of the coastal desert; llamas could not. For journeys to or from the coast, then, mules were required at least for part of the route. On the other hand, llamas were more suitable than mules for the difficult terrain and weather of the AndesFootnote 24, and did not require much care since they were mostly fed from any herbage, which lowered their maintenance costs (Cisneros Reference Cisneros1906, p. 124).
Waterways, more efficient than roads, have been widely used wherever they are available. However, in Peru the government never built canals, and rivers were not navigable in the habitable regions. Jones (Reference Jones1927) indicated that the lack of navigable rivers imposed enormous trade handicaps. «No large navigable rivers offer routes into the interior and other means of entering the mountain zone are not easily provided. Between latitudes 5 degrees and 35 degrees south no pass in the Andes lies at an elevation of less than 11,000 feet. The trade handicap because of this situation is enormous» (Jones Reference Jones1927, p. 151). The Pacific Ocean constituted a faster and cheaper mode of transportation than mules and llamas, especially after the invention of the steam machine. However, its use was naturally constrained to coastal towns. Ocean transportation was as fast and cheap as railroads; however, ocean transportation was not a substitute for railroads: only one railroad ran parallel to the shoreFootnote 25.
3 FREIGHT SAVINGS
The freight saving of the railroad measures the increase in consumer surplus for freight transportation due to the railroad. Shippers saved in freight transport costs due to the railroad, because railroads charged less than mules and llamas. Two elements have a determinant influence on the size of these freight savings: the difference in freight rates between railroads and the best alternative to railroads, and the demand for freight transportation. I calculate the freight savings for 1890-1918. Data on freight services come from Anales de las Obras Públicas (1890-1918)Footnote 26, and information on rail freight rates comes from Miller (Reference Miller1979) and the magazine Economista Peruano Footnote 27.
Considering that most roads were not appropriate for the traction of the wheel, I assume that in the absence of railroads all freight transportation would have been conducted on the backs of mules and llamas. Two alternative scenarios have been considered: the first scenario assumes that only mules could be used instead of railroads, and the second scenario assumes that llamas (cheaper but slower than mules) were used as much as possible in the absence of railroads. The first scenario yields an upper bound for freight savings, and the second scenario yields a lower bound for freight services.
A study for the Peruvian government indicates that renting a mule cost 31.7 cents/tonne-km in 1900 pricesFootnote 28. An alternative method for estimating the cost of mule transport provides similar resultsFootnote 29. For the second scenario, I assume that llamas were used for transportation in the highlands, but not on the coast. Llama freight rates were usually lower than mule ratesFootnote 30. Following Tizón and Bueno (1909), I assume that llama rates were half of mule rates. To calculate the cost of transportation in the second scenario, I assume that mules would have carried 30 per cent of freight, and llamas 70 per cent. These percentages reflect the relative importance of highland and coastal freight service, and consider the fact that llamas could not transport freight on the coastFootnote 31.
Let us define Q as the total freight service in tonne-km, P as the freight rate per tonne-km, and Q = Q(P) as the demand function for freight transportation. The freight saving of the railroad (FS) can be calculated as  $$$FS = {\int}_{{P_{R}^{F} }}^{{P_{N}^{F} }} {Q\left( P \right)dP} $$$
, where
 $$$P_{R}^{F} $$$
is the freight rate of railroads, and
 $$$P_{N}^{F} $$$
is the freight rate of the second-best alternative to railroad in freight transportation. In the special case in which the demand for freight transportation is perfectly inelastic, the introduction of the railroad does not increase the volume of freight service. Then the saving of the railroad can be calculated as
 $$$FS = \left( {P_{N}^{F} {\rm{ - }}P_{R}^{F} } \right)Q$$$
.
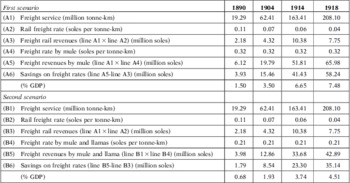
Table 1 reports the estimation of freight saving for 1890-1918, assuming that the demand for freight transportation was perfectly inelastic, that is, that mules and llamas would have transported the same freight as railroads. Our estimations indicate that freight rail services increased from 19 million tonne-km in 1890 to 208 million in 1918. Railroad revenues then increased from 2.2 million soles in 1890 to 7.8 million soles in 1918. The system of mules and llamas was more costly than railroads for carrying freight. In the first scenario, freight savings increased from only 1.5 per cent of GDP in 1890 to 3.5 per cent in 1904 and 7.5 per cent in 1918Footnote 32. In the second scenario, freight savings were 0.68 per cent of GDP in 1890, 1.9 per cent in 1904 and 4.5 per cent in 1918Footnote 33.
FREIGHT SOCIAL SAVINGS, 1890-1918

Notes: Figures in soles are in 1900 prices. The freight social savings have been calculated assuming that the demand for freight transport was perfectly inelastic.
To understand the changes in freight social savings over this period, let us decompose total freight savings. Denoting PN as the price of non-rail transport, PR as the price of railroads, and QR as the total rail freight service, then freight social savings (FSS) can be decomposed as follows:
 $$\frac{{FSS}}{{GDP}}\, = \,\frac{{\left( {PN{\rm{ - }}PR} \right)\left( {{{Q}_R}} \right)}}{{GDP}}\, = \,\left\lfloor {\frac{{\left( {PR} \right)\left( Q \right)}}{{GDP}}} \right\rfloor \left[ {\frac{{PN}}{{PR}}{\rm{ - }}1} \right]$$
The first element in the last expression,  $$$\frac{{\left( {PR} \right)\left( Q \right)}}{{GDP}}$$$
, measures the size of the railroad sector (as percentage of GDP); and the second element,
 $$$\frac{{PN}}{{PR}}{\rm{ - }}1$$$
, measures the relative difference in freight rates between non-rail and rail transportation. The freight social savings are large if the size of the railroad sector is high and/or if the difference in prices between non-rail transport and railroads is large.
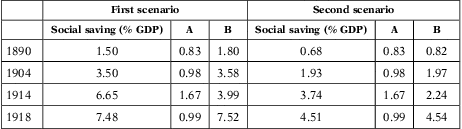
Table 2 shows the decomposition of freight social savings. The results indicate that the size of the railroad sector remained below 2 per cent of GDP over this period of time. In fact, although the size of the railroad sector increased from 0.8 per cent of GDP in 1890 to 1.7 per cent in 1914, it then declined to 1 per cent in 1918. The main factor that explains the changes in the FSS is the relative price of non-rail transport with respect to railroads. In the first scenario, the ratio  $$$\frac{{PN}}{{PR}}{\rm{ - }}1$$$
was 1.8 in 1890, was above 3.5 in 1904 and 1914, and then increased to almost 8 in 1918. These changes in the relative price of non-rail transportation with respect to railroads is explained by the decline in constant soles of the rail freight rate 0.11 soles/tonne-km in 1890 to 0.07 in 1904 and then to 0.04 in 1918. In contrast, our estimates of mule and llama rates are the same over this period of timeFootnote 34.
DECOMPOSITION OF FREIGHT SOCIAL SAVINGS
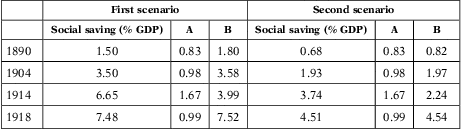
Notes: The computation of the freight social savings assumes that the demand for transportation in perfectly inelastic. The first scenario assumes that only mules would have transported freight in the counterfactual economy. The second scenario assumes that llamas would have been used on the highland routes.
A = Size of the railroad sector (% GDP). B = (PN−PR)/PR.
The assumption that mules and llamas would have transported the same freight as the railroad is questionable. This assumption implies that the demand for freight transportation was perfectly inelastic. However, the demand for freight transportation may be elastic to the freight rate; so in the absence of the railroad, the more expensive system of mules and llamas would probably have carried a lower volume of freight. Facing a higher cost of transportation, the economy would have optimally chosen a lower volume of transportation. Therefore, the assumption of null price elasticity may overestimate the total freight transport cost for using the alternative system of mules and llamas, and may then overestimate the lower bound of the freight consumer savings of the railroad. To calculate the true lower bound of the freight savings, we need to use an upper bound of the price elasticity of the demand for freight transportation.
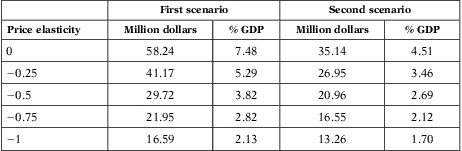
Table 3 reports the estimates of freight savings for alternative assumptions about the price elasticity of the demand for freight services for 1918, employing the formula  $$$FCS = {\int}_{{P_{R}^{F} }}^{{P_{N}^{F} }} {Q\left( P \right)dP} $$$
to calculate freight savings. The values of the freight savings in the first scenario range from 17 million soles to 58 million soles. The values of freight savings in the second scenario range from 13 million soles to 35 million soles.
FREIGHT SAVINGS FOR ALTERNATIVE VALUES OF THE PRICE ELASTICITY OF THE DEMAND FOR FREIGHT SERVICES, 1918
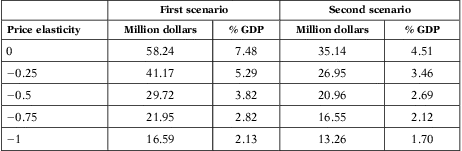
Notes: Figures are in soles of 1900.
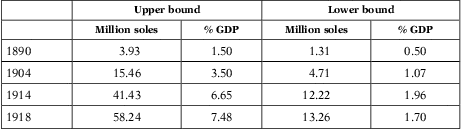
In the following sections, I will use a value of one as an upper bound of the price elasticity of the demand for freight transportFootnote 35. Therefore, I will use a price elasticity of one for the calculation of the lower bound of the freight saving of the railroad. Meanwhile, I will use a price elasticity of zero for the calculation of the upper bound of the freight social saving. Table 4 reports the upper and lower bounds of freight social savings for 1890-1918. Freight social savings ranged between 0.5 per cent and 1.5 per cent of GDP in 1890, increasing then to a range between 1.7 per cent and 7.5 per cent of GDP in 1918.
UPPER AND LOWER BOUNDS FOR FREIGHT SOCIAL SAVINGS
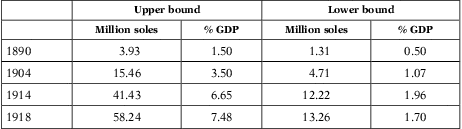
Notes: The table reports upper and lower bounds for freight social savings in million soles of 1900 and as percentage of GDP. The upper bound estimates assume that the demand for transportation was perfectly inelastic, whereas the lowest bound considers a price elasticity of −1.
4 PASSENGER SAVINGS
The passenger savings of the railroad measure the increase in consumer surplus for passenger transportation due to the railroad. I calculated the passenger savings for 1890-1918, considering savings on travel fares and time savingsFootnote 36. Passenger service (in passenger-km) was obtained from Anales de las Obras Públicas for 1890-1918Footnote 37. In addition, the magazine Economista Peruano reports the average passenger fare of the Peruvian Corporation for 1913-1914 and 1918-1919, without distinction between first- and second-class passengers. I used these average fares to estimate the total savings on travel fares for 1914 and 1918, respectivelyFootnote 38. I also assume that the cost of travelling by mule was 7.6 cents/person/km in 1900 pricesFootnote 39.
Railroad passengers had alternative modes of transportation at their disposal. The alternative for first-class rail passengers was to travel by mule, since this was the best alternative mode of travel (the other alternative was to walk). For second-class rail passengers, the mode of transportation in the counterfactual economy may have been walking. Travelling by mule was too costly for these passengers. In 1904, for example, an average rail trip covered around 12.6 kmFootnote 40. Such a trip took 3.1 hours on foot and 1.4 hours by muleFootnote 41. Considering the hourly salary, the opportunity cost of walking 12.6 km (the average journey) was 0.41 solesFootnote 42, whereas the opportunity cost of travelling by mule was 0.19 soles. Walking, however, implied no fare, whereas travelling by mule costs 0.96 soles. In sum, the total cost of travelling on foot was 0.41 soles, whereas the total cost of travelling by mule was 1.14 soles, almost three times as much. Considering these differences in total cost between riding a mule and walking, I assume that second-class rail passengers would have walked in the absence of railroads.
I also assume that the same number of rail passengers (in first and second class) would have continued travelling in the counterfactual economy. Savings on travel fares (PCSF) are calculated as follows:  $$$PCSF = \left( {P_{N}^{P} {\rm{ - }}P_{R}^{P} } \right)Q$$$
, where
 $$$P_{R}^{P} $$$
is the price of passenger service by railroad, and
 $$$P_{N}^{P} $$$
is the price of passenger services using the alternative mode of transportation.
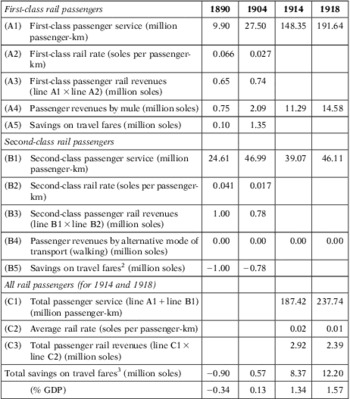
Table 5 reports the results. Our estimates indicate that first-class rail passenger service increased from 10 million passenger-km in 1890 to 192 million in 1918, and second-class rail passenger service increased from 25 million passenger-km in 1890 to 46 million in 1918. Savings on travel fares were always negative for second-class rail passengers and positive for first-class passengers. In total, savings on travel fares were negative in 1890 but exceeded 12 million soles in 1918 (or 1.6 per cent of GDP)Footnote 43.
SAVINGS ON TRAVEL FARES, 1890-1918

Notes: All figures in soles are in prices of 1900. Passenger revenues by mule in line A4 was calculated as line A1 times the estimated passenger rate by mule.
1For 1890 and 1904, savings on travel fares for first-class passengers are equal to line A4 –line A3.
2For 1890 and 1904, savings on travel fares for second-class passengers are equal to line B4 –line B3.
3For 1890 and 1904, total savings on travel fares are equal to line A5 + line B5. For 1914 and 1918, total savings are equal to line A4 + line B4 –line C3.
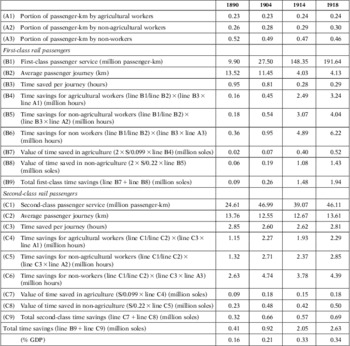
To calculate the value of the time saved by rail passengers, we need information on the speed of trains, mules and walking. I assume that passenger trains operated at 23 km/hourFootnote 44, mules covered around 8.8 km/hour, and walking took, on average, 15 minutes/kmFootnote 45. I assume that passengers participated in the labour force in the same proportion as the general populationFootnote 46. I also assume that the value of time was equal to the opportunity cost of time, that is the salaries foregone by travelling instead of working. I assume the following wages for rural and urban workers in prices of 1900: 7.9 cents per hour in agriculture, and 17.6 cents/hour in the rest of the economyFootnote 47. I also assume that second-class passengers earned on average those wages, and that first-class rail passengers earned on average twice as much as those wages.
Table 6 reports the main calculations. The average passenger journey for first-class passengers declined over time, especially after the construction of the electrical railroads in 1904, which were much shorter than other railroads and mostly had first-class passengers. For second-class passengers, however, the average passenger journey remained between 12 and 14 km. Peruvians increased their hour savings over time. The number of hours that Peruvians saved due to the railroads increased from <6 million hours in 1890 to 18 million hours in 1914 and 23 million hours in 1918. The value of time savings, however, was not very high: time savings were only 0.16 per cent of GDP in 1890; and although they increased over time, they were only 0.34 per cent of GDP in 1918.
TIME SAVINGS FOR RAIL PASSENGERS

Note: All figures in soles are in prices of 1900.
4 COMPARATIVE ANALYSIS
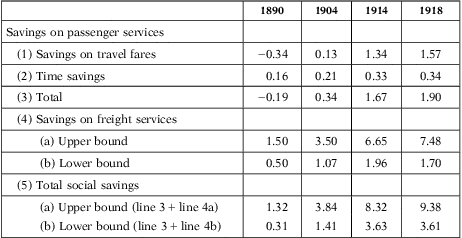
The introduction of railroads led to an increase in consumer surplus. The total social saving of the railroad is calculated as the sum of freight savings and passenger savings. Table 7 summarises the social savings of the railroads in 1890-1918, using the estimations from the previous two sections. Social savings ranged between 0.3 per cent of GDP and 1.3 per cent in 1890, increasing to a range between 3.6 per cent and 9.4 per cent in 1918.
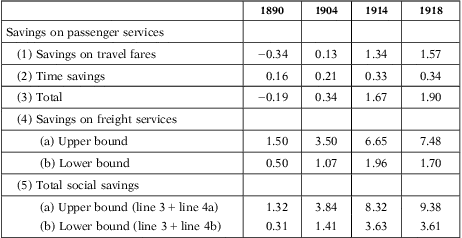
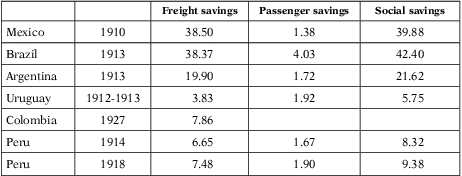
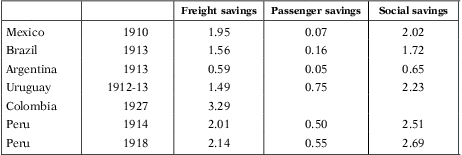
Table 8 compares our results with those for other countries, assuming that the demand for transportation was perfectly inelastic. The main difference in the Latin American sample is related to freight social savings. In all of these countries, passenger savings were usually much lower than freight savings. In fact, passenger savings were usually below 2 per cent of GDP. The only exception was Brazil, where passenger social savings were more than 4 per cent of GDP. There were some important differences in freight savings across countries. Freight social savings were much lower in Uruguay, Colombia and Peru than in Mexico, Brazil and Argentina. Whereas freight savings were higher than 19 per cent of GDP in Mexico, Brazil and Argentina, the corresponding figure was below 8 per cent in Uruguay, Colombia and Peru.
SOCIAL SAVINGS, UPPER BOUND (% GDP)
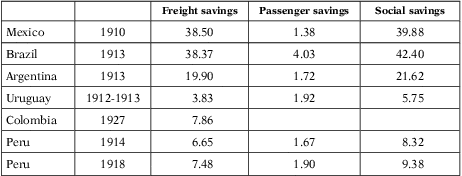
Notes: In all cases, it is assumed that the demand for transportation is perfectly inelastic.
Sources: For Mexico, Coatsworth (Reference Coatsworth1979); for Brazil, Summerhill (Reference Summerhill2005); for Argentina and Uruguay, Herranz-Loncán (Reference Herranz-Loncán2011); for Colombia, Ramírez (Reference Ramírez2000); for Peru, see Table 7.
The decomposition of freight savings into the size of the railroad sector and the relative price factor  $$$\frac{{PN}}{{PR}}{\rm{ - }}1$$$
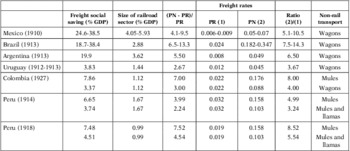
may help us understand the differences across countries. Table 9 shows the decomposition of freight savings. In Peru, the size of the railroad sector was always below 2 per cent of GDP, whereas the freight rate of non-rail transportation ranged between 3.2 and 5 times the average rail freight rate in 1914 and between 5.5 and 8.5 times in 1918. Peru had lower freight social savings than Mexico, Brazil and Argentina largely due to the smaller size of the railroad sector (as percentage of GDP). Uruguay and Colombia had similar social savings to Peru, mostly because the size of its railroad sector was, like Peru, very low.
DECOMPOSITION OF FREIGHT SOCIAL SAVINGS

Notes: Freight social savings are decomposed into the size of the railroad sector (as % of GDP) and the factor (PN-PR)/PR, where PN is the non-rail freight rate and PR is the rail freight rate. The size of the railroad sector is calculated as total freight rail revenues as percentage of GDP. Freight rates in (1) and (2) are in constant dollars of 1900. Original data are in pesos of 1900 for Mexico, milreis of 1913 for Brazil, sterling pounds of 1913 for Argentina and Uruguay, current pesos for Colombia and soles of 1900 for Peru. Sources: Coatsworth (Reference Coatsworth1979) for Mexico, Summerhill (Reference Summerhill2005) for Brazil, Herranz-Loncan (2011) for Argentina and Uruguay, Ramírez (Reference Ramírez2000) for Colombia, and Table 1, Table 5 and Table 6 for Peru.
The main explanation for the relatively low level of social savings of Peru is the small size of the railroad sector. In Peru, the size of the railroad sector was below 2 per cent of GDP, whereas it was more than 4 per cent in Mexico, almost 3 per cent in Brazil and 3.6 per cent in Argentina. Even with the reduction in freight rail rates in 1918, the revenues of the Peruvian railroad sector represented a much lower portion of the economy than in Mexico, Brazil and Argentina.
The size of the railroad sector may be explained by the low levels of investment in railroad construction. Railroad length increased in the early 20th century. However, rail density was very low by Latin American standards. In 1913, for example, railroad length per 1,000 inhabitants in Peru was 0.7 km, below the Latin American average of 1.4. In comparison with Mexico, Argentina, Brazil and Uruguay, Peru had a low railway density.
In fact, controlling for the length of railway system, Peru did not have a low social saving. Table 10 reports the ratio social savings (as percentage of GDP) divided by the total length of railroad system (in thousands of kilometres). This ratio was not relatively low for Peru. Compared to Brazil, Uruguay, Argentina and Mexico, Peru actually had a high social saving, once the length of the railroad system has been controlled. Therefore, it seems that a main reason for the low level of social savings of railroads in Peru (as percentage of GDP) was simply the lack of railway track.
RATIO SOCIAL SAVINGS/LENGTH OF THE RAILROAD SYSTEM
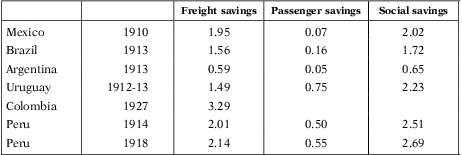
Notes: The ratio is calculated as the social savings (as % of GDP) divided by the total length of the railway system. In all cases, it is assumed that the demand for transportation is perfectly inelastic.
Sources: Social savings as percentage of GDP come from Coatsworth (1979) for Mexico, Summerhill (2005) for Brazil, Herranz-Loncán (2011) for Argentina and Uruguay, Ramírez (2000) for Colombia, and Table 7 for Peru. The length of the railroad system comes from Mitchell (1993).
Some evidence suggests that railroad companies did not face a high demand for rail transportation, which therefore led to low revenues and a small size of the railroad sector. This problem was certainly more severe in the 19th century. According to Bonilla (Reference Bonilla2005), for example, the demand for the Central Railway was limited prior to the operations of the Cerro de Pasco Corporation. The Central Railway incurred losses in 1892, and from 1894 to 1899. Similarly, the Southern Railway incurred losses between 1893 and 1899. These problems were less severe in the 20th century, but profitability in the 1900s and 1910s was still low. Miller (Reference Miller1976a), for example, estimates that the rate of return of the Peruvian Corporation was below 2 per cent in the 1890s, remained between 2 per cent and 3 per cent in the 1900s and only exceeded 5 per cent in the 1920s. There were, then, low incentives to invest in this sector.
Most of the demand for rail transportation came from exports. Railroads mostly served the copper export sector of the central highlands, and the sugar and cotton haciendas on the coast, especially in the northern coastal departments. For example, more than 50 per cent of the freight transported by the Central Railway in 1923-1924 was silver and copper. In contrast, agricultural products from the Mantaro Valley in the department of Junin represented only a small fraction of the volume of freight transported by the Central Railway. In 1923-1924, agricultural products only represented 5 per cent of the volume of freight and represented 10 per cent of the revenues of the railroad for transporting freightFootnote 48. As Miller (Reference Miller1979) indicates, «The [Central] railway, against expectations, provided no incentive to export to Lima low-value, high-bulk crops. In pastoral farming, only a few haciendas were reorganised along capitalist lines while most remained in an archaic state, farming extensively, and with production increasing only slowly» (Miller Reference Miller1979, p. 47). It seems, then, that the railroads in Peru did not develop significant linkages with non-exporting sectors, which reduced the impact of the railroad on the Peruvian economy.
As Miller (Reference Miller1979) indicates, in pastoral farming only a few haciendas were truly capitalist. In general, it is possible that other factors (not necessarily related to transportation infrastructure) limited the growth of the economy beyond the traditional export sector. More research needs to be done, but if the Peruvian economy was too underdeveloped and therefore the gains from specialisation were not large enough, the demand for rail transport services (especially, for long routes) was probably not high enough. With a low demand, it is not surprising that only a few railroads were built.
Information about rail and non-rail freight rates may also be relevant to an understanding of the low social savings of railroads of Peru. The cost of non-rail transportation in Peru was high in comparison with other countries in the region. Mule rates were 0.15 dollars/tonne-km in 1914, whereas wagon rates were <0.1 dollar/tonne-km in Mexico, Argentina and Uruguay. Only in Brazil was the cost of non-rail transport higher than in Peru. However, in spite of these high pre-rail freight rates, the reduction in freight rates in Peru was not higher than that in other Latin American countries. In fact, around 1914, such reduction of freight rates in Peru was lower (although only slightly) than in Mexico and BrazilFootnote 49.
The reason for this low reduction in freight rates in spite of the high non-rail price of transportation was that rail freight rates in Peru were relatively high by Latin American standards. By 1914, for example, the average rail rate in Peru was 0.03 dollars of 1900/tonne-km, greater than the Brazilian rate, and much higher than in Mexico, Argentina and Uruguay. The high rates of the railroads in Peru certainly generated discontent among the population. Peruvians usually complained that the Central Railways’ rates were very high, retarding the development of the economy. In an editorial, the newspaper El Pais indicated that it was notorious that the department of Junin (located in the central highlands) alone could supply not only Lima and Callao with potatoes, wheat, and other foodstuff, but also much of the Peruvian coast, but high transport costs did not make it possibleFootnote 50. In 1899, the Financial Times quoted the Peruvian government's position as expressed in an official publication: «The rates of freight charged by the [Peruvian] Corporation, especially on the Central line…are exorbitantly high, so much so that they are actually 16 times higher than those charged on the railway between Veracruz and Mexico. As a result of these high freights we still see in Peru the ridiculous competition of mules, asses and llamas with the railways in the carriage of produce and merchandise…»Footnote 51.
Railroad rates in Peru may have been high as a result (at least, partly) of high operating costs. Miller (Reference Miller1976b) indicates that, «on certain grounds the Peruvian Corporation could justify relatively high tariffs on the Central Railway. Both the mountain railways of Peru [the Central Railway and the Southern Railway] faced considerable technical problems that raised their costs, and led them to charge higher tariffs than elsewhere in South America. Both climbed to over 15,000 ft. In any circumstances the gradients involved would have increased the cost of locomotive power by raising fuel and maintenance costs»Footnote 52.
5 CONCLUSIONS
One might conclude from the literature that the lack of waterways led to large social savings of railroads. In the United States and Great Britain, for example, canals and rivers provided a low-cost transportation service; whereas in Brazil and Mexico, the lack of waterways implied that shippers and passengers would have had to rely on the costly wagon system if railroads had not been built.
In the case of Peru, however, waterways were not available, and the only substitute to railroads was the costly and inefficient system of mules and llamas. Contemporary sources indicate that transportation in most of the country was conducted on the backs of mules and llamas. This system was slow and expensive. Thus, the construction of railroads from the mid-19th century generated much optimism.
Peru devoted resources to the construction of railroads. However, its railroad length was highly limited. Only a few towns were linked by railroads, so most Peruvians had to rely on the traditional system of mules and llamas for their transportation. As a result, the size of the railroad sector was very small. In addition, the evidence indicates that railroads in Peru reduced freight rates. However, rail freight rates in Peru were relatively high, probably as a result of the complex geography of the Peruvian Andes and the consequently high operating costs.
Railroads certainly reduced transport costs, but their direct benefits were not as large as expected. In 1914, for example, social savings of the railroad ranged between 2 per cent and 7 per cent of GDP. The social savings were similar to those in the United States (even though the substitute to railroads in the United States was constituted by canals and navigable rivers), and were much lower than in Mexico, Brazil and Argentina. It seems then that railroads in Peru did not meet the expectations of their 19th century promoters.
This low level of social savings is largely explained by the low level of freight savings. Railroads yielded low freight savings largely because of the small size of the railroad sector. In the early 1910s, for example, the size of the railroad sector (measured as total rail freight revenues as percentage of GDP) was much greater in Mexico, Brazil and Argentina than in Peru. These differences in the size of the railroad sector are not surprising considering the low total length of railroad track of Peru. In spite of the differences in freight rates between railroads and the traditional system of transportation, it seems that the demand for rail transportation was not large enough to promote sufficient investment in railroad construction.