





%20--%3e%3c!DOCTYPE%20svg%20PUBLIC%20'-//W3C//DTD%20SVG%201.0//EN'%20'http://www.w3.org/TR/2001/REC-SVG-20010904/DTD/svg10.dtd'%3e%3csvg%20version='1.0'%20id='Layer_1'%20xmlns='http://www.w3.org/2000/svg'%20xmlns:xlink='http://www.w3.org/1999/xlink'%20x='0px'%20y='0px'%20width='64px'%20height='64px'%20viewBox='5.5%20-3.5%2064%2064'%20enable-background='new%205.5%20-3.5%2064%2064'%20xml:space='preserve'%3e%3cg%3e%3ccircle%20fill='%23FFFFFF'%20fill-opacity='0'%20cx='37.785'%20cy='28.501'%20r='28.836'/%3e%3cpath%20fill='%23595959'%20d='M37.441-3.5c8.951,0,16.572,3.125,22.857,9.372c3.008,3.009,5.295,6.448,6.857,10.314%20c1.561,3.867,2.344,7.971,2.344,12.314c0,4.381-0.773,8.486-2.314,12.313c-1.543,3.828-3.82,7.21-6.828,10.143%20c-3.123,3.085-6.666,5.448-10.629,7.086c-3.961,1.638-8.057,2.457-12.285,2.457s-8.276-0.808-12.143-2.429%20c-3.866-1.618-7.333-3.961-10.4-7.027c-3.067-3.066-5.4-6.524-7-10.372S5.5,32.767,5.5,28.5c0-4.229,0.809-8.295,2.428-12.2%20c1.619-3.905,3.972-7.4,7.057-10.486C21.08-0.394,28.565-3.5,37.441-3.5z%20M37.557,2.272c-7.314,0-13.467,2.553-18.458,7.657%20c-2.515,2.553-4.448,5.419-5.8,8.6c-1.354,3.181-2.029,6.505-2.029,9.972c0,3.429,0.675,6.734,2.029,9.913%20c1.353,3.183,3.285,6.021,5.8,8.516c2.514,2.496,5.351,4.399,8.515,5.715c3.161,1.314,6.476,1.971,9.943,1.971%20c3.428,0,6.75-0.665,9.973-1.999c3.219-1.335,6.121-3.257,8.713-5.771c4.99-4.876,7.484-10.99,7.484-18.344%20c0-3.543-0.648-6.895-1.943-10.057c-1.293-3.162-3.18-5.98-5.654-8.458C50.984,4.844,44.795,2.272,37.557,2.272z%20M37.156,23.187%20l-4.287,2.229c-0.458-0.951-1.019-1.619-1.685-2c-0.667-0.38-1.286-0.571-1.858-0.571c-2.856,0-4.286,1.885-4.286,5.657%20c0,1.714,0.362,3.084,1.085,4.113c0.724,1.029,1.791,1.544,3.201,1.544c1.867,0,3.181-0.915,3.944-2.743l3.942,2%20c-0.838,1.563-2,2.791-3.486,3.686c-1.484,0.896-3.123,1.343-4.914,1.343c-2.857,0-5.163-0.875-6.915-2.629%20c-1.752-1.752-2.628-4.19-2.628-7.313c0-3.048,0.886-5.466,2.657-7.257c1.771-1.79,4.009-2.686,6.715-2.686%20C32.604,18.558,35.441,20.101,37.156,23.187z%20M55.613,23.187l-4.229,2.229c-0.457-0.951-1.02-1.619-1.686-2%20c-0.668-0.38-1.307-0.571-1.914-0.571c-2.857,0-4.287,1.885-4.287,5.657c0,1.714,0.363,3.084,1.086,4.113%20c0.723,1.029,1.789,1.544,3.201,1.544c1.865,0,3.18-0.915,3.941-2.743l4,2c-0.875,1.563-2.057,2.791-3.541,3.686%20c-1.486,0.896-3.105,1.343-4.857,1.343c-2.896,0-5.209-0.875-6.941-2.629c-1.736-1.752-2.602-4.19-2.602-7.313%20c0-3.048,0.885-5.466,2.658-7.257c1.77-1.79,4.008-2.686,6.713-2.686C51.117,18.558,53.938,20.101,55.613,23.187z'/%3e%3c/g%3e%3c/svg%3e)
%20--%3e%3c!DOCTYPE%20svg%20PUBLIC%20'-//W3C//DTD%20SVG%201.0//EN'%20'http://www.w3.org/TR/2001/REC-SVG-20010904/DTD/svg10.dtd'%3e%3csvg%20version='1.0'%20id='Layer_1'%20xmlns='http://www.w3.org/2000/svg'%20xmlns:xlink='http://www.w3.org/1999/xlink'%20x='0px'%20y='0px'%20width='64px'%20height='64px'%20viewBox='5.5%20-3.5%2064%2064'%20enable-background='new%205.5%20-3.5%2064%2064'%20xml:space='preserve'%3e%3cg%3e%3ccircle%20fill='%23FFFFFF'%20fill-opacity='0'%20cx='37.637'%20cy='28.806'%20r='28.276'/%3e%3cg%3e%3cpath%20fill='%23595959'%20d='M37.443-3.5c8.988,0,16.57,3.085,22.742,9.257C66.393,11.967,69.5,19.548,69.5,28.5c0,8.991-3.049,16.476-9.145,22.456%20C53.879,57.319,46.242,60.5,37.443,60.5c-8.649,0-16.153-3.144-22.514-9.43C8.644,44.784,5.5,37.262,5.5,28.5%20c0-8.761,3.144-16.342,9.429-22.742C21.101-0.415,28.604-3.5,37.443-3.5z%20M37.557,2.272c-7.276,0-13.428,2.553-18.457,7.657%20c-5.22,5.334-7.829,11.525-7.829,18.572c0,7.086,2.59,13.22,7.77,18.398c5.181,5.182,11.352,7.771,18.514,7.771%20c7.123,0,13.334-2.607,18.629-7.828c5.029-4.838,7.543-10.952,7.543-18.343c0-7.276-2.553-13.465-7.656-18.571%20C50.967,4.824,44.795,2.272,37.557,2.272z%20M46.129,20.557v13.085h-3.656v15.542h-9.944V33.643h-3.656V20.557%20c0-0.572,0.2-1.057,0.599-1.457c0.401-0.399,0.887-0.6,1.457-0.6h13.144c0.533,0,1.01,0.2,1.428,0.6%20C45.918,19.5,46.129,19.986,46.129,20.557z%20M33.042,12.329c0-3.008,1.485-4.514,4.458-4.514s4.457,1.504,4.457,4.514%20c0,2.971-1.486,4.457-4.457,4.457S33.042,15.3,33.042,12.329z'/%3e%3c/g%3e%3c/g%3e%3c/svg%3e)
1. Introduction
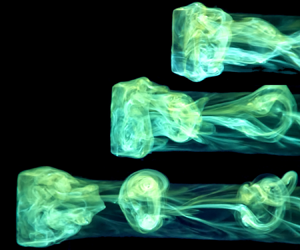
The free motion of a body rolling along a plane wall is of practical interest in many fluid dynamics applications, such as the transport of sediment in rivers, the design of viscous micro-pumps and the motion of leukocytes near vessel walls. Although these practical flows typically feature irregular and varied geometries, much research has focused on simplified geometries, including spheres (Carty Reference Carty1957; Jan & Shen Reference Jan and Shen1995) and infinite cylinders (see Thompson, Leweke & Hourigan (Reference Thompson, Leweke and Hourigan2021) for a detailed review). The present authors have recently highlighted the importance of surface roughness in determining the drag on rolling spheres (Nanayakkara et al. Reference Nanayakkara, Zhao, Terrington, Thompson and Hourigan2024). In particular, surface roughness elements generate an effective hydrodynamic gap between the sphere and the wall, and the drag coefficient ( $C_{D}$) can be approximately predicted based on this effective gap. We anticipate that this proposed mechanism of rolling motion applies to other rolling body geometries. Therefore, the present article presents an experimental investigation into the influence of surface roughness on the motion of finite-span rolling cylinders, where the contact area is far more extensive than for a sphere. Our results strongly support the hypothesis that surface roughness introduces an effective hydrodynamic gap between the cylinder and the wall, and the effective drag coefficient can be determined from this hydrodynamic gap using lubrication theory.
The paradox of rolling motion arises from the theoretical prediction for an incompressible fluid that a perfectly smooth sphere or cylinder should be incapable of rolling while in contact with a smooth wall. This theoretical expectation contradicts experimental observations of rolling motion for both spheres (Carty Reference Carty1957; Jan & Shen Reference Jan and Shen1995; Houdroge et al. Reference Houdroge, Zhao, Terrington, Leweke, Hourigan and Thompson2023) and cylinders (Rao et al. Reference Rao, Stewart, Thompson, Leweke and Hourigan2011). Specifically, analytic expressions for the force and moment applied to either a sphere (Goldman, Cox & Brenner Reference Goldman, Cox and Brenner1967; O'Neill Reference O'Neill1967; O'Neill & Stewartson Reference O'Neill and Stewartson1967) or cylinder (Jeffrey & Onishi Reference Jeffrey and Onishi1981; Merlen & Frankiewicz Reference Merlen and Frankiewicz2011) translating and rotating near a plane wall predict an infinite drag force when the body is in contact with the wall. A resolution to this paradox is to introduce an effective gap between the rolling body and the wall, thereby resulting in a finite drag force. Proposed mechanisms to introduce this effective gap include cavitation (Prokunin Reference Prokunin2003; Ashmore, Pino & Mullin Reference Ashmore, Pino and Mullin2005; Seddon & Mullin Reference Seddon and Mullin2006), compressibility (Terrington, Thompson & Hourigan Reference Terrington, Thompson and Hourigan2022) and surface roughness (Smart & Leighton Reference Smart and Leighton1989; Galvin, Zhao & Davis Reference Galvin, Zhao and Davis2001; Zhao, Galvin & Davis Reference Zhao, Galvin and Davis2002; Nanayakkara et al. Reference Nanayakkara, Zhao, Terrington, Thompson and Hourigan2024). Which of these mechanisms is relevant for establishing the effective gap depends on the experimental parameters (Terrington et al. Reference Terrington, Thompson and Hourigan2022). For example, although cavitation has been observed in some experiments, for both spheres (Ashmore et al. Reference Ashmore, Pino and Mullin2005; Yang et al. Reference Yang, Seddon, Mullin, Pino and Ashmore2006) and cylinders (Seddon & Mullin Reference Seddon and Mullin2006), cavitation is entirely absent in others (Houdroge et al. Reference Houdroge, Zhao, Terrington, Leweke, Hourigan and Thompson2023; Nanayakkara et al. Reference Nanayakkara, Zhao, Terrington, Thompson and Hourigan2024).
In cases where cavitation is responsible for the motion (Ashmore et al. Reference Ashmore, Pino and Mullin2005; Seddon & Mullin Reference Seddon and Mullin2006), the formation of a cavitation bubble produces a lift force that results in the sphere or cylinder losing contact with the wall. In such cases, there are no contact forces between the body and the wall, and the sphere or cylinder experiences a rotation rate different from that required to roll without slipping (Ashmore et al. Reference Ashmore, Pino and Mullin2005; Seddon & Mullin Reference Seddon and Mullin2006).
When cavitation and compressibility effects are either weak or absent, the effective gap is a result of surface roughness. The rolling body and the wall maintain contact via surface asperities, and this produces an average gap proportional to the height of surface asperities. In such cases, the body may roll without slipping along the wall, due to contact forces between the body and the wall. For the rolling sphere flow, this hypothesis is supported by experimental measurements in both the Stokes flow (Smart, Beimfohr & Leighton Reference Smart, Beimfohr and Leighton1993; Galvin et al. Reference Galvin, Zhao and Davis2001; Zhao et al. Reference Zhao, Galvin and Davis2002) and inertial flow regimes (Thompson et al. Reference Thompson, Leweke and Hourigan2021; Houdroge et al. Reference Houdroge, Zhao, Terrington, Leweke, Hourigan and Thompson2023; Nanayakkara et al. Reference Nanayakkara, Zhao, Terrington, Thompson and Hourigan2024). However, this proposed mechanism has not yet been shown to apply to other geometries, such as the rolling cylinder. Importantly, the nominal contact between a cylinder and the wall occurs at a line, whereas contact between a sphere and a wall occurs at a single point, and this could influence the mechanism of rolling motion. The present article presents experimental results that demonstrate the occurrence of the same mechanism in the motion of finite-span circular cylinders.
Although extensive experimental studies of isolated cylinders have been conducted, including both long-span (Bénard Reference Bénard1908; Von Kármán Reference Von Kármán1911; Taneda Reference Taneda1965) and finite-span (Norberg Reference Norberg1994; Williamson Reference Williamson1996) cylinders, experimental measurements of cylinders rolling in close proximity to a plane wall remain relatively scarce. Bearman & Zdravkovich (Reference Bearman and Zdravkovich1978) and Zdravkovich (Reference Zdravkovich1985) considered the related problem of flow past a stationary cylinder near a plane wall, with gap-to-diameter ratio ( $G/D$) in the range
 $0\leq G/D \leq 2$. The flow structures (Bearman & Zdravkovich Reference Bearman and Zdravkovich1978) and both the drag and lift coefficients (Zdravkovich Reference Zdravkovich1985) were found to vary significantly with
 $G/D$, whereas the Strouhal number (
 $St$) was insensitive to
 $G/D$.
Although few experimental investigations of rolling cylinders at low and moderate  $\overline {Re}$ have been performed, this problem has been widely examined using both analytical and computational approaches. Jeffrey & Onishi (Reference Jeffrey and Onishi1981) obtained expressions for the force and moment applied to a circular cylinder both rotating and translating near a plane wall in Stokes flow, which are valid for any
 $G/D$. Merlen & Frankiewicz (Reference Merlen and Frankiewicz2011) found corresponding expressions valid in the limit
 $G/D\ll 1$ using lubrication theory. These solutions are accurate only for Stokes flow (
 $\overline {Re} = 0$), and under-predict the drag coefficient at non-zero
 $\overline {Re}$, since inertial effects such as wake formation are neglected.
To account for inertial effects at non-zero  $\overline {Re}$, numerical simulations have been employed (Stewart et al. Reference Stewart, Hourigan, Thompson and Leweke2006, Reference Stewart, Thompson, Leweke and Hourigan2010b; Rao et al. Reference Rao, Stewart, Thompson, Leweke and Hourigan2011; Houdroge et al. Reference Houdroge, Leweke, Hourigan and Thompson2017, Reference Houdroge, Leweke, Hourigan and Thompson2020; Wang et al. Reference Wang, Liu, Zhu, Zhou, Bao and Xu2021). These studies typically consider only a single value of
 $G/D$, noting that the flow outside the gap region is insensitive to
 $G/D$, when
 $G/D$ is small. Although this approach is sufficient to determine the wake dynamics and transitions, the drag coefficient appears to be highly sensitive to
 $G/D$, and therefore simulations must be performed for a range of
 $G/D$ to completely determine the drag coefficient. To avoid performing simulations for multiple
 $G/D$, Terrington, Thompson & Hourigan (Reference Terrington, Thompson and Hourigan2023) have introduced a combined analytical–numerical approach, where the gap-dependent drag (
 $C_{D,pred, gap}$) for the two-dimensional flow over a circular cylinder is obtained using the analytical lubrication solution, whereas the wake drag (
 $C_{D,pred, wake}$), which is independent of
 $G/D$, is obtained using numerical simulations. The total predicted drag coefficient is the sum of the gap-dependent and wake drag coefficients; this predicted drag coefficient will be denoted as
 $C_{D,pred}$.
The gap-dependent drag coefficient obtained by Merlen & Frankiewicz (Reference Merlen and Frankiewicz2011) is for the infinite cylinder flow. Saintyves et al. (Reference Saintyves, Rallabandi, Jules, Ault, Salez, Schönecker, Stone and Mahadevan2020) computed the correction to this expression due to end effects for a finite-span cylinder with a large aspect ratio. Teng et al. (Reference Teng, Rallabandi, Stone and Ault2022) extended this analysis, computing the correction to the gap-dependent drag valid for all aspect ratios. The end effects result in a reduction in the gap-dependent drag coefficient compared with the two-dimensional theory, particularly for small aspect ratios and larger  $G/D$.
Although Teng et al. (Reference Teng, Rallabandi, Stone and Ault2022) provided expressions for the gap-dependent drag for a finite-span cylinder, solutions for the gap-independent wake drag for a finite-span rolling cylinder have not been obtained in the existing literature. Although both Pirozzoli, Orlandi & Bernardini (Reference Pirozzoli, Orlandi and Bernardini2012) and Javadi (Reference Javadi2022) performed numerical simulations for low-aspect-ratio finite-span cylinders (wheels) in contact with a plane wall, neither of these studies discussed the numerical treatment of the contact point, nor the infinite pressures that should arise in that region. Both studies reported finite  $C_{D,pred}$ at
 $G/D = 0$, in contrast with the infinite drag predicted by lubrication theory. As discussed by Terrington et al. (Reference Terrington, Thompson and Hourigan2023), this is likely due to low grid resolution at the point of contact. The
 $C_{D,pred}$ values reported by these works are therefore likely to be unreliable.
The effect of cylinder aspect ratio on the wake structures behind a freely rolling finite-span cylinder has also not been documented in the existing literature. Zdravkovich et al. (Reference Zdravkovich, Brand, Mathew and Weston1989) conducted experiments on isolated cylinders with  $AR \leq 1$ and showed that
 $\bar {C}_{D}$ increases for decreasing
 $AR$, for high
 $\overline {Re}$ (approximately
 $10^{5}$). Computational studies by Inoue & Sakuragi (Reference Inoue and Sakuragi2008) investigated the effects of both
 $Re$ and
 $AR$ on isolated stationary cylinders, and found five basic patterns of vortex shedding. The authors reported that these patterns are dependent on both
 $Re$ and
 $AR$ of the cylinders, and end effects also play a role in the flow patterns observed. Inoue & Sakuragi (Reference Inoue and Sakuragi2008) also observed double-sided hairpin-like vortex patterns for moderate
 $AR$ (2–10) and moderate
 $Re$ (50–200). Recent computational analysis by Yang, Feng & Zhang (Reference Yang, Feng and Zhang2022) found a similar behaviour for a cylinder with
 $AR$ ranging from
 $0.5$ to
 $2$, at lower
 $Re$ (0–300). It is noted that their results also indicate that the difference in
 $C_{D,pred}$ for varied
 $AR$ is higher at low
 $\overline {Re}$, and the curves seem to converge together at
 $Re \approx 500$. In the present article we experimentally investigate the effect of
 $AR$ on the wake structures formed behind a rolling circular cylinder.
Numerical studies (Stewart et al. Reference Stewart, Thompson, Leweke and Hourigan2010a; Rao et al. Reference Rao, Stewart, Thompson, Leweke and Hourigan2011; Houdroge et al. Reference Houdroge, Leweke, Hourigan and Thompson2017, Reference Houdroge, Leweke, Hourigan and Thompson2020) have also investigated the influence of gap size on the wake dynamics and vortex shedding of a freely rolling infinitely long cylinder. Although a vanishing gap size has a strong influence on the forces acting on the cylinder, at least for small gap ratios, the gap height has minimal effects on the wake and wake transitions. Houdroge et al. (Reference Houdroge, Leweke, Hourigan and Thompson2020) visualised the pressure distribution of a cylinder with large and small gaps, and showed that the pressure coefficients were nearly identical, at the top and sides of the cylinder, even when the gap size was reduced by a factor of 32. However, it is important to note that given the coupling between a freely rolling cylinder and the flow, where the cylinder motion responds to changes in drag forces as vortices are shed into the wake, the dependence of drag force on the gap size has an indirect effect on the wake dynamics. A detailed discussion of relevant literature regarding the wake–structure interaction of cylinders rolling on a plane is given in § 5.1.
In this study, we experimentally investigate the effects of surface roughness on the drag coefficient of finite-span cylinders freely rolling without slipping. Our primary focus is on the low- to moderate-Reynolds-number regime ( $30<\overline {Re}<1800$), where the present literature lacks experimental evidence of the dependence of
 $\bar {C}_{D}$ on surface roughness. We aim to provide experimental evidence that the time-mean drag coefficient (
 $\bar {C}_{D}$) is dependent on both cylinder and panel surface roughness, and the effective gap (
 $G_{eff}$) between the panel and cylinder can be estimated using roughness parameters. Moreover, we show that gap heights approximately equated to peak roughness (
 $R_{p}$) for rough cylinders, or one standard deviation above the mean peak roughness (
 $R_{p, 1\sigma }$) for smooth cylinders, yield predicted drag coefficients in general agreement with measured values. This is the main finding of the present investigation and forms a basis on which the drag coefficient of a cylinder can be predicted using a combined analytical–numerical approach and using peak surface roughness as the gap height. The difference between the two types of cylinders and the use of two different roughness statistics are discussed in § 4.5.2.
A limited set of experiments were conducted in air using foam cylinders to demonstrate that cavitation is not required to allow cylinder motion in this  $\overline {Re}$ range and that similar drag trends are observed. Additional dependence of
 $\bar {C}_{D}$ on cylinder aspect ratio (
 $AR$) is also investigated and compared with analytical predictions. Furthermore, experimental flow visualisations are employed to identify and validate critical flow transitions that have been previously observed in numerical studies.
This paper is organised as follows. Section 2 describes the problem and the existing analytical solutions, and § 3 presents a summary of the experimental method. Section 4 presents detailed experimental results of the investigation together with a discussion of results. Wake–structure interactions including experimental flow visualisations are given in § 5. Finally, § 6 draws final conclusions and points to future studies.
2. Problem description
Figure 1 illustrates a cylinder with a diameter  $D$ undergoing free rolling without slip on an inclined plane set at an angle
 $\theta$ relative to the horizontal axis. The cylinder density is denoted as
 $\rho _{s}$, and the fluid density is represented as
 $\rho _{f}$. The typical relationship
 $\rho _{s} > \rho _{f}$ indicates negative buoyancy and a mass ratio is given by
 $\beta = \rho _{s}/\rho _{f}$. The coordinate system is anchored at the centre of the body.
Schematic free body diagram of a freely rolling cylinder, on an inclined plane under the influence of gravity.

After the cylinder attains a quasi-steady state, it adopts a time-mean terminal velocity  $\bar {U}$ in the
 $x$ direction and a time-mean angular velocity
 $\bar {\omega }$ around the
 $y$ direction, as indicated in the figure (referred to as prograde rolling). Here, the
 $x$ direction corresponds to the down-slope, whereas the
 $y$ direction represents the cross-slope. The buoyant weight of the body, denoted as
 $W_{B}$, is calculated as
 $W_{B} = {\rm \pi}D^{2}L (\rho _{s}-\rho _{f})/4$, where
 $L$ is the span of the cylinder.
We assume that the cylinder is offset from the wall by an effective gap,  $G_{eff}$, which is characterised by the non-dimensional parameter
 $\hat {G}=G_{eff}/D$. We propose that the effective gap
 $\hat {G}$ can be determined from the measured surface roughness. This is discussed further in §§ 2.2 and 4.
Furthermore,  $F_D$,
 $F_L$ and
 $T_{y}$ are the instantaneous hydrodynamic drag, lift and torque, respectively, applied to the body, whereas the time-mean counterparts of these parameters are represented by
 $\bar {F}_D$,
 $\bar {F}_L$ and
 $\bar {T}_{y}$, respectively. Correspondingly,
 $N,\bar {N}$ and
 $F_C, \bar {F}_C$ are the instantaneous and time-mean normal and contact forces, respectively. Finally, the time-mean Reynolds number of the cylinder is expressed as
 $\overline {Re}= \bar {U}D/ \nu _f$, where
 $\nu _f$ is the kinematic viscosity of the fluid.
The drag coefficient considered in this study includes both hydrodynamic drag force  $\bar {F}_{D}$ and the contact force
 $\bar {F}_C$, as
 \begin{equation} \bar{C}_D = \frac{\bar{F}_{D}+\bar{F}_C}{\dfrac{1}{2}DL \rho_{f}\bar{U}^{2}}. \end{equation}
Considering the time-mean force balance parallel to the plane wall ( $\bar {F}_{D}+\bar {F}_{C}=W_B g \sin \theta$), the drag coefficient can be expressed as
 \begin{equation} \bar{C}_D = \frac{W_B g \sin\theta}{\dfrac{1}{2}DL \rho_{f}\bar{U}^{2}} = \frac{1}{2} \frac{D(\beta-1)g {\rm \pi}}{{ \bar{U}^{2}}}\sin \theta. \end{equation}
Equation (2.2) is used to calculate the drag coefficient in experiments.
2.1. Combined analytical–numerical predictions
Assuming the cylinder is rolling without slipping, the total drag coefficient can be determined from the hydrodynamic force and torque coefficients. Assuming quasi-steady motion, the balance of torques applied to the cylinder is
 \begin{equation} T_y - F_C \frac{D}{2} = 0, \end{equation}
and therefore the effective predicted drag coefficient is written as
 \begin{equation} {C}_{D, pred, num} = {C}_{F,fluid} + {C}_{T, fluid}, \end{equation}
where  ${C}_{F,fluid} = \bar {F}_D/(\frac {1}{2}DL \rho _{f}\bar {U}^{2})$ and
 ${C}_{T, fluid} = (\bar {T}_y/ {D}/{2})/(\frac {1}{2}DL \rho _{f}\bar {U}^{2})$ represent the hydrodynamic force and moment coefficients, respectively. In this study, (2.4) is used to predict the drag coefficient from numerical simulations.
For two-dimensional flow over a rolling circular cylinder, Terrington et al. (Reference Terrington, Thompson and Hourigan2023) decompose the force and moment coefficients into a gap-dependent term and a gap-independent ‘wake-drag’ term. Here, we express this result as a combined predicted drag coefficient:
 \begin{equation} C_{D,{pred}(2D)} = C_{D, pred,gap(2D)} + C_{D,pred,wake(2D)} \end{equation}
The gap-dependent drag for an infinite cylinder is obtained using lubrication theory, valid for small gap heights ( $G/D \ll 1$) (Merlen & Frankiewicz Reference Merlen and Frankiewicz2011; Terrington et al. Reference Terrington, Thompson and Hourigan2023):
 \begin{equation} C_{D, pred,gap(2D)} = \frac{8 {\rm \pi}}{Re \sqrt{G/D}}, \end{equation}
whereas the wake-drag term was obtained by Terrington et al. (Reference Terrington, Thompson and Hourigan2023) using numerical simulations for steady-state flow. We obtain the following empirical fit to their numerical data:
 \begin{equation} C_{D, pred, wake(2D)} = 14.9 - 11.0(Re)^{0.033}. \end{equation}
This equation is valid for  $10< Re<200$ (see Terrington et al. Reference Terrington, Thompson and Hourigan2023).
Teng et al. (Reference Teng, Rallabandi, Stone and Ault2022) compute the gap-dependent force and moment contributions for a finite-span circular cylinder, both translating and rotating near a plane wall. When expressed as an effective drag coefficient, their solution is given by
 \begin{equation} C_{D,pred, gap(3D)} = \frac{8 {\rm \pi}}{Re \sqrt{G/D}} - \frac{4\mathcal{I}}{Re\,AR}, \end{equation}
where the integral  $\mathcal {I}$ can be approximated using the following rapidly converging series:
 \begin{align} \mathcal{I} = \frac{64 }{3 {\rm \pi}} \sinh^{{-}1} \left(\frac{AR}{\sqrt{G/D}}\right) - 16 AR + \sum_{n=1,3,5,\ldots} 64 \exp({-n{\rm \pi}/2AR}) \left(\frac{1}{3n{\rm \pi}} + \frac{2AR}{n^{2} {\rm \pi}^{2}}\right). \end{align}
Equation (2.8) represents the influence of the lubrication flow in a narrow gap between the cylinder and the wall on the total predicted drag coefficient. The first term on the right-hand side is the drag coefficient corresponding to two-dimensional flow (infinite-span cylinder), whereas the second term is a correction representing the effect of a finite aspect ratio. However, this expression does not include the influence of outer-flow effects such as wake formation and shedding. To account for these effects, the total predicted drag coefficient will be given by
 \begin{equation} C_{D,pred} = C_{D,pred(3D)} = C_{D,pred, gap(3D)} + C_{D,pred, wake(3D)}, \end{equation}
where  $C_{D,pred, wake(3D)}$ is a function of both
 $Re$ and
 $AR$, but not
 $G/D$. Unfortunately, analytical or numerical results for
 $C_{D,pred, wake(3D)}$ have not been reported in the literature.
A detailed numerical study is required to obtain accurate estimates of  $C_{D,pred, wake(3D)}$, but is outside the scope of the present work. In the absence of a reliable estimate for
 $C_{D,pred, wake(3D)}$, we assume it will be approximately the same order of magnitude as the wake drag coefficient for the two-dimensional cylinder flow (
 $C_{D,pred, wake(2D)}$). This is a rough approximation only and is likely to introduce significant and unquantified errors into our estimate of the wake drag coefficient. Fortunately, at the low and moderate Reynolds numbers considered in the present study, the wake drag represents a relatively small contribution to the total drag (10–20 % depending on
 $\overline {Re}$), so reasonable predictions of the total drag coefficient may still be obtained.
In addition, we note that the wake drag coefficient for the two-dimensional cylinder flow is  $1.5\le C_{D,pred, wake(2D)} \le 3$ (Terrington et al. Reference Terrington, Thompson and Hourigan2023) and the wake drag coefficient for the rolling sphere flow is
 $1.0\le C_{D,sph, wake} \le 1.5$ (Houdroge et al. Reference Houdroge, Zhao, Terrington, Leweke, Hourigan and Thompson2023) for
 $10\le \overline {Re} \le 200$. Given that the three-dimensional sphere also exhibits a similar range of wake drag values as the two-dimensional cylinder, our assumption that the three-dimensional wake drag of a cylinder will be similar to the two-dimensional wake drag (
 $C_{D,pred, wake(3D)} \approx C_{D,pred, wake(2D)}$) is sufficiently accurate. This approximation will enable an effective comparison between measured
 $\bar {C}_{D}$ and
 $C_{D,pred}$.
2.2. Relationship between gap and surface roughness
The primary objective of this investigation is to establish the correlation between surface roughness parameters and the effective gap ( $G_{eff}$) required to determine the drag force acting on the cylinder. The British Standard Geometric Product Specifications (GPS) - Surface texture: Profile method - Terms, definitions, and surface texture parameters, BS ISO 4287:1997 provides a comprehensive framework to characterise surface roughness. Among these parameters, the most frequently used are the mean absolute deviation, root mean square (r.m.s.) and the peak roughness, which are denoted by
 $R_{a}$,
 $R_{q}$ and
 $R_{p}$, respectively. Figure 2 indicates these parameters for a sample profile from a cylinder. See Gadelmawla et al. (Reference Gadelmawla, Koura, Maksoud, Elewa and Soliman2002) for detailed descriptions and analytical expressions for typical roughness statistics.
Visual representation of the three roughness statistics on a sample cylinder profile.

Drawing upon these roughness parameters, a new non-dimensional relative roughness denoted by  $\xi$ is introduced as follows:
 \begin{equation} \xi = \frac{R_{panel} + R_{cylinder}}{D}, \end{equation}
where  $R_{panel}$ and
 $R_{cylinder}$ denote the roughness parameters corresponding to the panel and cylinder surfaces, respectively. A subscript is employed to indicate the specific surface-roughness statistic used to compute
 $\xi$. For instance,
 $\xi _p$, is the non-dimensional roughness determined using the peak roughness of both the panel (
 $R_{p,panel}$) and the cylinder (
 $R_{p,cylinder}$), whereas
 $\xi _a$ and
 $\xi _q$ are calculated using the mean absolute deviation and r.m.s. roughnesses, respectively.
Equation (2.11) assumes that the effective gap at the point of contact results from a linear summation of two simple roughness statistics. In general, elementary roughness statistics such as  $R_p$ may be insufficient to completely describe the complex nature of the surface, and a linear summation of surface roughness statistics may not fully describe the interaction between two complex surfaces. The accuracy of these assumptions and simplified measurements are discussed in detail in § 4.5.
3. Experimental set-up and methodology
The rolling cylinder experiments were conducted within the Fluids Laboratory for Aeronautical and Industrial Research (FLAIR laboratory) at Monash University. A detailed review of the experimental set-up and methodology used for the present study can be found in the previous work of Nanayakkara et al. (Reference Nanayakkara, Zhao, Terrington, Thompson and Hourigan2024). A summary is provided in the following.
3.1. Summary of experimental set-up and methodology
The present experiments were conducted in a water tank with a glass panel mounted on an adjustable stainless steel frame. Other test panels with various surface roughnesses were also adopted. The inclination angle ranged from  $1.5^{\circ }$ to
 $23^{\circ }$. Panel flatness was determined by measuring surface height variation at discrete points, revealing that panel non-flatness was negligible compared with the panel's downward slope. The test cylinders were pre-soaked underwater, with air bubbles removed by vibration and stirring, prior to carrying out the experiments. The cylinders were then placed on a collection port on the plane and gently released to minimise water surface disturbances. A waiting period of at least 2 min followed any water perturbation before measurements were taken, ensuring the water had adequately settled. Regular cleaning of the water tank prevented dust or fibre deposition on the panel surface.
The velocity of rolling cylinders was determined by timing their travel over a fixed distance. A minimum of  $20 D$ rolling distance was allowed prior to measurements to ensure the cylinders attained their time-mean terminal velocity. Initially, a stopwatch measured the time for a 200 mm distance on the removable panel (constituting
 $30\,\%$ of data). Later, a system with three laser-based object detectors was introduced for improved accuracy and efficiency (
 $70\,\%$ of data). The results presented in the present study incorporate both data sets, and an uncertainty analysis in Appendix B accounts for measurement errors from both methods. Specifications of the tested panels and cylinders are provided in tables 1 and 2, respectively, in Appendix A. Table 2 specifies unique identifiers for each group of cylinders used with the same diameter and aspect ratio. These identifiers are used herein to refer to distinct cylinders.
Panel types used as inclined planes are detailed here. Max. deviation is the maximum absolute deviation of surface height measurements from the mean plane. Max. gradient is the maximum cross-slope gradient over a minimum cross-slope measurement distance of 50 mm.

Specifications of cylinders used for experimental evaluation. Each cylinder diameter corresponds to a set of 10 individual cylinders, and 3 measurements of cylinder diameter and 1 measurement of cylinder span was measured for each cylinder. The mean values of diameter and span including the error for each set is shown above. Refer to Appendix B for details on error analysis.

The data outlined in § 4 represent average measurements obtained from eight separate runs using cylinders of similar diameter and density. Furthermore, occasional checks were performed at randomised locations on the curve to confirm the consistency of the data, even when the fluid temperature varied. Table 2 indicates that the uncertainty regarding the cylinder diameter within each group of cylinders was generally below  $1\,\%$. To prevent any distortion caused by water absorption, the cylinders and panels were regularly removed from the water tank outside measurement intervals and dried.
The uncertainty in cylinder diameter was used to estimate deviations in roundness. Given that the uncertainties in the diameter cylinders were generally below  $1\,\%$, it was assumed that deviations in the roundness of cylinders could be neglected.
Preliminary experiments were conducted with a selection of cylinders at various inclination angles ranging from  $2^{\circ }$ to
 $23^{\circ }$ to examine potential cylinder slippage in our trials. A marker was placed on the surface of the cylinder, and the cylinder rolling motion was then recorded using a digital camera. The calculated rotational speed was compared to the measured linear down-slope velocity, revealing no significant difference between the two velocities (less than
 $1\,\%$). As such, any slippage between the cylinder and the surface was considered to be negligible.
To establish the effects of cylinder deformation due to the normal contact force, Hertzian contact theory was used. A simple case of a two-dimensional spherical body in contact with a flat plate was assumed, and the formula for plastic deformation is found in textbooks such as Johnson (Reference Johnson1985). For an acrylic cylinder of  $D=19.7$ mm rolling at
 $\theta =2^{\circ }$ on a glass plate, where the largest normal contact force is acting on the cylinder, the calculated deformation of the cylinder was in the order of
 $10^{-12}$ m. This deformation is small compared with the height of asperities (typically
 $10^{-6}$ m), hence the effect of cylinder deformation on the gap imposed by surface asperities was deemed negligible.
3.2. Surface roughness measurements
Non-contact surface roughness measurements for both the cylinders and panels were acquired using an optical profilometer, specifically the Bruker Contour GT-I. This instrument is housed at the Melbourne Centre for Nanofabrication (MCN), situated within the Victorian Node of the Australian National Fabrication Facility (ANFF). The measurements were performed with a 50 $\times$ magnification, employing the vertical scanning interferometry (VSI) technique. VSI relies on a broadband light source and is particularly accurate for evaluating surfaces that are rough. The obtained measurements are detailed in tables 3 and 4 in Appendix A.
Measured surface roughness values of panels. Values presented are the arithmetic mean of five individual measurements. The measurement area of one measurement is  $0.25\times 0.25\,{\rm mm}^{2}$ (12 measurements under
 $50\times 1$ magnification joined together).

*Measurement area of  $10\times 10\,{\rm mm}^{2}$ was used for the rough ceramic panel which was obtained by stitching together 100 profile scans using a stylus profilometer. No waviness correction was used.
Measured surface roughness of cylinders. Values presented are arithmetic mean of four (or more) individual measurements of four separate cylinders of the same diameter. The measurement area of each presented measurement is  $0.4\times 0.4\,{\rm mm}^{2}$ for all diameters (24 measurements under
 $50\times 1$ magnification joined together). All measurements were corrected for cylinder curvature prior to obtaining roughness statistics.

In the present work, roughness statistics, such as  $R_p$, were obtained for a minimum of four different samples. Each sample was generated using the combination of 24 individual measurements conducted under
 $50 \times 1$ magnification of each surface. The reported values represent the average across all samples. This means that the peak roughness (
 $R_p$) reported in this study is a sample-averaged value, and does not represent the highest peak observed across all samples. In addition to the sample-averaged peak roughness, it is also useful to report the parameter
 $R_{p, 1\sigma }$, signifying one standard deviation above the sample-mean peak roughness. This parameter will be used to differentiate the gap imposed by two types of roughness textures observed, which will be elaborated on further in § 4.5.
Figure 3 presents the surface roughness measurements obtained from two panels and four cylinders that were employed in the present experimental investigations. The surface roughness profiles of the acrylic panel depicted in figure 3(a) span a range from  $-1.0$ to
 $0.7\,\mathrm {\mu } {\rm m}$, which is indicative of a typically smooth surface. The ceramic panel surface displayed in figure 3(b) displays notably higher asperities and deeper valleys, with some reaching heights as large as
 $2\,\mathrm {\mu } {\rm m}$ and valleys as deep as
 $-4.6\,\mathrm {\mu } {\rm m}$, characteristic of a typical rough surface.
Surface roughness profiles obtained using the optical profilometer, under 50 $\times$ magnification: (a) acrylic panel; (b) ceramic panel; (c) D4.7-A2.2 cylinder; (d) D7.7-A1.3 cylinder; (e) D11.7-A0.9 cylinder; (f) D19.7-A0.5 cylinder. The arrow at the top right corner of each panel image indicates the approximate down-slope direction, whereas for cylinder images, the arrow shows the direction of rolling of each cylinder, with respect to the directional surface textures.

The surface roughnesses observed in all four cylinders shown in figure 3 display pronounced directional characteristics, with a series of ridges and valleys aligned parallel to the direction of cylinder rolling. These ridges arise from the fabrication process, where the acrylic cylinders were produced using a lathe. Comparatively, the two smaller diameter cylinders shown in figures 3(c) and 3(d) possess a smoother surface compared to the larger cylinders in figures 3(e) and 3(f). In the case of the larger cylinders, the peaks of the ridge-like structures typically exceed  $4\,\mu {\rm m}$, whereas the smaller cylinders exhibit peaks within the
 $1\unicode{x2013}2\,\mathrm {\mu } {\rm m}$ range.
4. Results and discussion
This section presents the experimental results of the effect of surface roughness on the mean effective drag coefficient. The drag coefficient for experimental measurements is determined using (2.2), and it is compared with analytical evaluations under the assumption that the effective gap is equal to the peak surface roughness.
This section is structured as follows. First, we present the observed variations of  $\bar {C}_{D}$ with
 $\overline {Re}$ for a set of cylinders with a fixed span in § 4.1. Note that maintaining a constant cylinder span (
 $L$) while varying the cylinder diameter (
 $D$) leads to a variation in aspect ratios. Subsequently, the influence of aspect ratio (
 $AR$) on
 $\bar {C}_{D}$ is discussed in § 4.2. Furthermore, § 4.3 discusses the role of cavitation (or lack thereof) on cylinder motion and the limited set of results obtained for foam cylinders rolling in air. In § 4.4 the variation of
 $\bar {C}_{D}$ with
 $\xi$ is discussed, whereas § 4.5 discusses the relationship between peak roughness and effective gap. § 4.6 presents additional considerations that may influence cylinder
 $\bar {C}_{D}$. Finally, § 4.7 compares the
 $\bar {C}_{D}$–
 $\overline {Re}$ relationships between a cylinder and a sphere.
4.1. Measurements of  $\bar{C}_{D}$ as a function of $\overline {Re}$ for cylinders with a fixed span (in water)


To investigate the effects of surface roughness on  $\bar {C}_{D}$ of a rolling cylinder, a set of
 $\bar {C}_{D}$ measurements were obtained with a fixed span (
 $L=10.1\,\mathrm {mm}$), while the cylinder diameter and surface roughness of the panel were varied. This approach ensures that the contact region between the panel and cylinder remains constant which enables the comparison of the effects of surface roughness on
 $\bar {C}_{D}$ of cylinders with varying
 $D$. Figure 4 presents the measured
 $\bar {C}_{D}$ vs
 $\overline {Re}$ values within
 $20<\overline {Re}<1800$ for these fixed-span cases. Given the fixed span and variations in
 $D$, the
 $AR$ of these cylinders varies from 0.51–2.15. The influence of
 $AR$ on
 $\bar {C}_{D}$ is considered in § 4.2. Any variation in
 $\bar {C}_{D}$ with
 $AR$ is less than the scatter in the data, at least for the experimental parameters considered in this study.
Variation of  $\bar {C}_{D}$ with
 $\overline {Re}$ for the five types of panels,
 $\overline {Re} = 20\unicode{x2013}1800$ range in log–log scale. The cylinder span was fixed at 10.1 mm which results in varied
 $AR$ ranging from 0.51–2.15.

Figure 4 shows all of the data gathered, with the legend indicating the marker shapes corresponding to seven cylinder diameters, and marker colours corresponding to the five panels used. The measured  $\bar {C}_{D}$ data exhibit a clear inverse relationship with
 $\overline {Re}$, particularly evident at low
 $\overline {Re}$, as depicted by the grey dashed line in figure 4. In addition, there is a noticeable degree of scatter in the measured
 $\bar {C}_{D}$ with different surface finishes. This scatter is more significant at low
 $\overline {Re}$, but decreases with increasing
 $\overline {Re}$. Specifically, there is a difference of
 $70\,\%$ between the smallest and largest
 $\bar {C}_{D}$ values at
 $\overline {Re} = 100$; however, this scatter is reduced to
 $60\,\%$ by
 $\overline {Re} = 400$.
The results of foam cylinders are not included in figure 4, but are presented in § 4.3.1.
These observations can be explained using the decomposition of  $\bar {C}_{D}$ into gap-dependent and wake drag contributions (2.10). Specifically, the gap-dependent drag is approximately proportional to
 $1/\overline {Re}$, while the wake drag is expected to have an order of magnitude (
 $O(1)$) dependence on
 $\overline {Re}$ at moderate to large Reynolds numbers (Houdroge et al. Reference Houdroge, Zhao, Terrington, Leweke, Hourigan and Thompson2023; Nanayakkara et al. Reference Nanayakkara, Zhao, Terrington, Thompson and Hourigan2024). Therefore, the gap-dependent drag is dominant over the wake drag for small
 $\overline {Re}$, leading to the observed
 $1/\overline {Re}$ dependence and large scatter.
The scatter in the experimental  $\bar {C}_{D}$ data arises from differences in surface roughness. To illustrate this point, figure 5 depicts the
 $\bar {C}_{D}$ vs
 $\overline {Re}$ curves for a single cylinder D19.7-A0.5 rolling on five tested panels. Each of the panels yields a different
 $\bar {C}_{D}$ vs
 $\overline {Re}$ profile. In particular,
 $\bar {C}_{D}$ decreases with an increase in the panel roughness (or increasing
 $\xi _p$). Corresponding
 $\xi _p$ values are also indicated in the figure. This behaviour can be attributed to the larger roughness producing a larger effective gap, resulting in a reduction of gap-dependent drag.
Variation of  $\bar {C}_{D}$ against
 $\overline {Re}$ for a cylinder with a fixed diameter and aspect ratio, D19.7-A0.5, while varying the panel surface roughness. Least-squares lines of the form
 $a+b/Re$ have been fitted through data that correspond to individual panels. The coefficient of determination
 $R^{2}$ values are approximately
 $0.9$.

Figure 6 presents profiles of  $\bar {C}_{D}$ vs
 $\overline {Re}$ for cylinders of various diameters rolling on two separate panels. Figure 6(a) is for the cylinders rolling on a glass panel (
 $R_p=0.308\,\mathrm {\mu } {\rm m}$), while figure 6(b) is for the rough ceramic panel (
 $R_p=33.18\,\mathrm {\mu } {\rm m}$). The
 $\xi _p$ values corresponding to each cylinder are indicated in the figure legend. These figures demonstrate that, for a fixed panel roughness,
 $\bar {C}_{D}$ increases with increasing cylinder diameter. Despite an approximately 45-fold difference in peak roughness between the two panels, a similar increase of
 $\bar {C}_{D}$ with increasing
 $D$ was observed. This held true for all panels examined in this study.
Variation of  $\bar {C}_{D}$ with
 $\overline {Re}$ for cylinders of different diameter rolling on the (a) glass panel and (b) rough ceramic panel. Least-squares lines of the form
 $a+b/Re$ have been fitted through data that correspond to the individual diameters of the cylinders used. The
 $R^{2}$ values are approximately
 $0.9$. Error bar indicate bias error only.

Assuming the effective gap is proportional to the surface roughness, the dimensionless surface roughness  $\xi _p$ reduces with increasing cylinder diameter, resulting in increased gap-dependent drag.
Figure 7 presents a comparison between experimentally measured drag coefficients and analytical evaluations using lubrication theory. The dashed green lines represent the gap-dependent drag (as per (2.8)) using  $G/D = \xi _{p, 1 \sigma }$ for the D4.7-A2.2 cylinder, and
 $G/D = \xi _{p}$ for the D7.7-A1.3 cylinder. The difference in roughness statistics is associated with a difference between the surface textures of the two cylinders, as discussed further in § 4.5. It is worth noting that the gap-dependent drag generally under-evaluates the drag coefficient since it does not include the wake-drag effects and possibly other sources of drag such as rolling resistance that is discussed further in § 4.6. The wake-drag coefficients for a finite-span cylinder are not available in the literature. For now, we use the wake-drag coefficient for two-dimensional flow (2.7). The solid red lines in figure 7 represent the sum of the gap-dependent and wake drag components, which is in good agreement with the measured
 $\bar {C}_{D}$.
Comparison of  $\bar {C}_{D}$ vs
 $\overline {Re}$ of two cylinders rolling on a glass panel against analytical prediction (2.8). The total drag when two-dimensional
 $C_{D,pred, wake}$ predictions from (2.7) is added to (2.8) is also indicated in the figure. Physical parameters are (a)
 $\xi _{p, 1\sigma } = 0.00096$ and
 $AR = 2.16$ and (b)
 $\xi _{p} = 0.00035$ and
 $AR = 1.31$.

4.2. Effects of aspect ratio on $\bar {C}_{D}$ vs $\overline {Re}$


To investigate the effect of cylinder aspect ratio on  $\bar {C}_{D}$, a series of experiments was conducted with a consistent cylinder diameter of
 $D\approx 4.7\,{\rm mm}$ while the cylinder span
 $L$ was varied.
Figure 8(a) presents the relationship between  $\bar {C}_{D}$ and
 $\overline {Re}$ for cylinders with
 $AR$ ranging from
 $0.5$ to
 $6.02$ rolling on a glass panel (
 $R_p = 0.308\,\mathrm {\mu } {\rm m}$). In general, all cylinders with varying aspect ratios follow the previously observed
 $1/\overline {Re}$ trend outlined in § 4.1. In addition, the same convergence of
 $\bar {C}_{D}$ at high
 $\overline {Re}$ is observed, regardless of the cylinder aspect ratio. This behaviour implies that the influence of end effects on
 $\bar {C}_{D}$ also decreases with increasing
 $\overline {Re}$.
Cylinder  $\bar {C}_{D}$ variation with
 $AR$. (a) Variation of
 $\bar {C}_{D}$ vs
 $\overline {Re}$ for a fixed diameter cylinder (
 $D\approx 4.7\,{\rm mm}$) with varied
 $AR$. All measurements were obtained on the glass panel with
 $R_{p, {\rm 1}\sigma }=0.46\,\mathrm {\mu } {\rm m}$. Least-squares lines of the form
 $a/Re+b$ have been fitted through the data points corresponding to fixed
 $AR$. (b) Variation of
 $\bar {C}_{D}$ vs
 $AR$ for a fixed diameter (
 $D\approx 4.7\,{\rm mm}$) cylinder for three constant values of
 $\overline {Re}(50,100,150)$.
 $G/D=0.008$ value was used for
 $C_{D,pred}$ shown which corresponds to the cylinders rolling on the rough ceramic panel.

There is a significant amount of scatter in the experimental data shown in figure 8(a). To investigate whether this scatter is due to aspect ratio effects, figure 8(b) plots the variation of  $\bar {C}_{D}$ with
 $AR$ for three constant Reynolds numbers,
 $\overline {Re} = 50$,
 $100$ and
 $150$. Since the surface roughness values of the cylinders varied (table 4), the rough ceramic panel was used to obtain the data in this figure. The roughness of this panel is approximately 10 times larger than the cylinder roughness values, which maintains a consistent
 $\xi _p$ across the different
 $AR$s. The
 $\bar {C}_{D}$ values corresponding to each
 $\overline {Re}$ were determined through linear interpolation from the nearest neighbouring
 $\overline {Re}$. We observe no significant variation of
 $\bar {C}_{D}$ with
 $AR$.
Solid lines in figure 8(b) indicate the predicted drag obtained by adding the estimated wake drag to the gap drag (2.10). The approximate peak roughness of the rough ceramic panel  $R_{p}/D=0.008$ was used to approximate
 $G/D$ to calculate
 $C_{D,pred}$. We observe reasonable agreement between measured and predicted values, particularly at higher
 $AR$ and higher
 $\overline {Re}$. The predicted
 $C_{D,pred}$ increases with
 $AR$, and approaches a constant value in the limit
 $AR \rightarrow \infty$. However, the predicted change in
 $\bar {C}_{D}$ against
 $AR$, using (2.8), is relatively small over the range of
 $AR$ considered in this study and is within the variation in
 $\bar {C}_{D}$ observed. There is a marginal increasing trend in
 $\bar {C}_{D}$ against decreasing
 $AR$, in contrast to the decreasing trend predicted by theory. We attribute the difference in drag at small aspect ratios (
 $AR < 1$) to the use of two-dimensional wake drag in (2.10). While this assumption is valid for larger
 $AR$ cylinders, it becomes less accurate for smaller
 $AR$ cylinders where three-dimensional effects are more prominent. Further, the influence of the large roughness of the panel on the cylinder motion also increases for the smaller
 $AR$ cylinders. Small
 $AR$ cylinders were observed to change directions easily following collisions with large asperities, and increased vortex-induced oscillations were also observed. The theoretical model does not consider these added effects. Extending the range of
 $AR$ to smaller than 0.5 may produce useful insights, which we recommend as future works.
In addition, the wake drag was estimated by assuming it to be equal to the wake drag of an infinite cylinder. The true wake drag for a finite-length cylinder is unknown, and it may also vary with  $AR$. If the wake drag were to decrease with
 $AR$, then the total drag may be approximately constant with respect to
 $AR$. For a finite length cylinder in an unbounded flow, Yang et al. (Reference Yang, Feng and Zhang2022) observed a reduction of
 $\bar {C}_{D}$ from approximately
 $1.5$ to approximately
 $1$ for an increase of
 $AR$ from
 $0.5$ to
 $2.0$ at
 $\overline {Re}=100$. The wake drag behind a rolling cylinder might be expected to follow a similar trend in
 $AR$. However, the wake will be modified by both the presence of the wall and the rotation of the cylinder. Numerical simulations of the flow over finite-length cylinders rolling near plane walls are needed to determine the true variation of the wake drag with
 $AR$. Further, the numerical study on the variation of
 $\bar {C}_{D}$ with
 $AR$ for the same
 $G/D$ value will provide useful insight into the influence of end effects on
 $\bar {C}_{D}$. We recommend this as future work.
Additional experiments that were excluded from figure 8 were conducted using larger  $AR$ cylinders. A decline in
 $\bar {C}_{D}$ was observed for
 $AR>6$ which is likely attributed to the potential wobbling of the cylinders during rolling, which, in turn, increases the effective gap. Again, producing perfectly straight cylinders with large aspect ratios is difficult, and we cannot ensure that consistent contact along the span exists between the rolling cylinder and the plane. Given that the gap-dependent drag is extremely sensitive to the imposed gap height (see § 4.4), a twofold increase in gap height at
 $\overline {Re}=50$ could lead to a reduction in
 $\bar {C}_{D}$ on the order of 40–50 %, the same order of magnitude as observed in the reduction of
 $\bar {C}_{D}$. However, the high
 $AR$ cylinders were included in § 5 where cylinder wake is discussed. Gap height (or roughness) has minimal influence on the cylinder wake (see § 5.4), where the effects of the non-straightness of the large
 $AR$ cylinders on wake formation and shedding, will be minimal.
4.3. Effects of cavitation on $\bar {C}_{D}$

Merlen & Frankiewicz (Reference Merlen and Frankiewicz2011) tentatively propose that the mechanism allowing cylinder motion involves a gap induced by cavitation lift force, rather than a gap caused by surface roughness. This proposal is also supported by experimental observation of cavitation bubbles near the body–plane contact for steel cylinders in silicone oil (Seddon & Mullin Reference Seddon and Mullin2006). The formation of a cavitation bubble produces a lift force that allows the cylinder to travel along the wall without contacting the wall. Due to the absence of a contact force, the rotation rate of the cylinder is theoretically zero assuming an infinite cylinder in Stokes flow (Jeffrey & Onishi Reference Jeffrey and Onishi1981). This is supported by experimental measurements of Seddon & Mullin (Reference Seddon and Mullin2006), who find that the onset of cavitation results in a significant decrease in the cylinder rotational velocity compared with the translational velocity, and, in some cases, reverse rotation of the cylinder.
In our experiments, the cylinders were observed to roll without slipping. Contact forces are required to ensure the cylinder rolls without slip, and therefore our cylinders must remain in contact with the wall, via a distribution of surface asperities. Therefore, cavitation is not responsible for determining the effective gap in our experiments.
Merlen & Frankiewicz (Reference Merlen and Frankiewicz2011) give the condition for cavitation to occur as  $p_\infty < P_{min}$, where
 $p_\infty$ is the ambient pressure, and
 \begin{equation} P_{min} = \frac{3\sqrt{3}}{4\sqrt{2}} \frac{\mu_f (1+k) \bar{U}}{G} \sqrt{\frac{D}{2G}} \end{equation}
is the maximum magnitude of the pressure decrease in the lubrication region. In addition,  $k=\omega _{y} D/2U$ is the slip coefficient, equal to unity for our experiments, and
 $\mu _f = \rho _{f} \nu _{f}$ is the dynamic viscosity. Assuming
 $G$ is equal to either
 $R_{p}$ or
 $R_{p,1\sigma }$ as discussed in § 4.5, the maximum value of
 $P_{min}$ is approximately 1.3 kPa, which is below the ambient pressure
 $p_\infty \approx 101.7\,{\rm kPa}$. This confirms that cavitation is not likely to be significant in our experiments.
4.3.1. Measured relationship of $\bar {C}_{D}$ vs $\overline {Re}$ for foam cylinders in air


Additional experiments were performed using foam cylinders rolling down inclined surfaces in air. If cavitation, rather than surface roughness, indeed determines the effective gap, we would expect to observe significant differences in drag coefficient between air and water, given the absence of cavitation in air.
The profiles of measured  $\bar {C}_{D}$ vs
 $\overline {Re}$ for foam cylinders on a glass panel in air are shown in figure 9, along with the results for acrylic cylinders in water rolling on the same panel. The
 $\bar {C}_{D}$ for foam cylinders in air are generally lower compared with those for acrylic cylinders in water. As shown in table 4 in Appendix A, the
 $R_{p}$ roughness of foam cylinders (approximately
 $100\,\mathrm {\mu } {\rm m}$) is an order of magnitude greater than that of acrylic cylinders (approximately
 $5\,\mathrm {\mu } {\rm m}$). The
 $\xi _p$ values corresponding to each cylinder are indicated in the figure legend. This significant difference in roughness contributes to the observed differences between the two sets of results. Nevertheless, despite the large difference in surface roughness, the
 $\bar {C}_{D}$ values are within the same order of magnitude.
Variation of  $\bar {C}_{D}$ with
 $\overline {Re}$ for foam cylinders rolling in the air on the glass panel. The cylinder span was fixed for all measurements (
 $L=10.1\,{\rm mm}$) while the aspect ratio varied. The results of acrylic cylinders in water are also plotted for comparison.

As such, the relative consistency between the results of measurements conducted in air and water suggests that under present experimental conditions, effects of cavitation, if any, are negligible.
Furthermore, the  $\bar {C}_{D}$ results for foam cylinders in air (figure 9) also follow the same increasing trend with increasing cylinder
 $D$. Similar to the experiments in water, this observation can be attributed to the decrease in
 $\xi$ caused by the increase in
 $D$.
4.4. Variation of $\bar {C}_{D}$ with relative roughness $\xi$


Figure 10 shows the variation of  $\bar {C}_{D}$ with the relative roughness
 $\xi _p$ for two constant Reynolds numbers,
 $\overline {Re} = 100$ (figure 10a) and
 $\overline {Re} = 150$ (figure 10b). The data are presented in two figures at each corresponding
 $\overline {Re}$ to highlight the overall trend at each
 $\overline {Re}$, and enable comparison with lubrication theory predictions, without data clustering. The cylinder
 $AR$ was maintained close to unity (
 $0.8< AR<1.2$) and only larger cylinders (
 $D>6$ mm) were used in the figure.
Variation of  $\bar {C}_{D}$ with
 $\xi _p$ for
 $AR\approx 1$ at (a)
 $\overline {Re}=100$ and (b)
 $\overline {Re}=150$. A line of best fit of the form
 $a + b/\sqrt {\xi }$ is used to show the general trend with
 $R^{2}$ approximately 0.9.

The corresponding  $\bar {C}_{D}$ values for each
 $\overline {Re}$ were determined through linear interpolation from the nearest neighbouring
 $\overline {Re}$ values. Error bars indicate the bias (formal) error of measurements, which are approximately
 $2\,\%$ for
 $\bar{C}_{D}$ and
 $5\,\%$ for
 $\xi$. Analytical evaluations of the gap-dependent drag (2.8) (dashed green) are also plotted in this figure, as well as the sum of the gap-dependent and two-dimensional wake drag (solid green) for
 $AR=1$ cylinder.
In figure 10, the general trend of decreasing  $\bar {C}_{D}$ with increasing
 $\xi$ for the experimental data is shown using a line of best fit of the form
 $a + b/\sqrt {\xi }$. A dashed line in blue is used in figures 10(a) and 10(b), respectively. The
 $R^{2}$ values of the curve fit were approximately
 $0.9$, indicating that variations in
 $\xi _p$ account for the majority of the variation in
 $\bar {C}_{D}$.
As shown in the figure 10, it is evident that as  $\xi$ decreases,
 $\bar {C}_{D}$ tends to increase for both Reynolds numbers. A smaller gap leads to a higher
 $\bar {C}_{D}$, in agreement with lubrication theory and numerical predictions. However, figure 10 shows that the predictions made by Teng et al. (Reference Teng, Rallabandi, Stone and Ault2022) ((2.8), dashed green line) underestimate
 $\bar {C}_{D}$ for both Reynolds numbers, due to the omission of wake-drag effects and other sources of drag such as rolling resistance that is discussed further in § 4.6. At
 $\overline {Re}=100$, for a 10-fold increase in
 $\xi$ (
 $0.0005$ to
 $0.005$), an approximate
 $65\,\%$ reduction in
 $\bar{C}_{D}$ is observed. However, at
 $\overline{Re} =150$, the same increase in
 $\xi$ causes only an approximate
 $60\,\%$ decrease in
 $\bar{C}_{D}$. This observation is in agreement with analytical evaluations, where the gap-dependent drag is inversely proportional to
 $\overline {Re}$.
When an approximate wake drag contribution is added (solid green line), we observe better agreement between experimental  $\bar {C}_{D}$ and combined analytical and numerical predictions. The observed reduction in
 $\bar {C}_{D}$ at both
 $\overline {Re}$ is larger than the experimental uncertainty of the measured
 $\bar {C}_{D}$ values. This observation coupled with the relative agreement between
 $\hat {G}$ and roughness statistics, discussed in § 4.5, supports the present argument that surface roughness provides the gap required by lubrication theory, and is dependent on both cylinder and panel roughness. Despite the scatter in data, the measured and predicted trends follow a similar curve. The inclusion of wake drag improves the agreement between results. Although the measured and predicted curves do not agree for all
 $\xi$ values when
 $G/D = R_p/D$ is assumed, it gives a simple approximate solution that is valid for a large range of
 $G/D$ values. That is,
 $R_p$ roughness is a good approximation of the gap height, despite the limited accuracy at low
 $\overline {Re}$ and small
 $AR$. A more comprehensive model including additional sources of drag such as rolling resistance will likely improve the accuracy of the model.
4.5. Roughness analysis
Up to this point, we have progressed under the assumption that the effective gap ( $G_{eff}$) is of the same order of magnitude as the peak roughness (
 $R_{p}$) or the peak roughness plus one standard deviation of the cylinder and panel (
 $R_{p, 1 \sigma }$). However, as mentioned previously, simple statistical measures such as
 $R_{p}$ or
 $R_{p, 1 \sigma }$ may not adequately account for various scales of surface roughness. To further explore these effects, we examine four specific cases in detail: the four cylinders D4.7-A2.2, D7.7-A1.3, D9.7-A1.0 and D11.7-A0.9, all rolling on a glass surface. Given that the roughness of the glass panel (
 $R_{p}=0.3\,\mathrm {\mu } {\rm m}$) is approximately 10 times smaller than those of the cylinders (
 $R_{p}\approx 3\,\mathrm {\mu } {\rm m}$), we anticipate that the dominant factor determining the gap will be the roughness of the cylinders.
4.5.1. Relationships between dimensionless effective gap ($G_{eff}/D$), $\xi _{p}$ and $\xi _{p, 1 \sigma }$


Let us introduce  $\hat {G}=G_{eff}/D$ as the non-dimensional effective gap required to match the analytical predictions of the drag coefficient (2.8) with the experimental measurements.
Figure 11 presents a comparison between the measured surface roughness statistics and the  $\hat {G}$ values. Two scenarios are considered here. First, the non-dimensional effective gap without wake drag is shown (
 $\hat {G}$ and
 $\hat {G}_{mean}$). The effective gap including wake drag approximated using (2.7) (
 $\hat {G}_{(2D\,wake)}$ and
 $\hat {G}_{(2D\,wake), mean}$) is presented to enable an effective comparison between experimental and analytical–numerical predictions including wake drag.
(i)
$\hat {G}$ and $\hat {G}_{mean}$: Red markers and red dashed line in figure 11.
Figure 11.Non-dimensional effective gap (
$\hat {G}=G_{eff}/D$) vs $\overline {Re}$ for four cylinders rolling on a smooth glass panel: (a) D4.7-A2.2 cylinder; (b) D7.7-A1.3 cylinder; (c) D9.7-A1.0 cylinder; (d) D11.7-A0.9 cylinder. Cylinder span $L=10.1\,{\rm mm}$ for all diameters. The measured roughness parameters of the cylinders are plotted in the figure.Note that the wake drag is not considered by (2.8), so the
$\hat {G}$ will be smaller than the actual gap introduced by surface roughness. The $\hat {G}$ is presented in figure 11 for the four cases introduced earlier. In general, the $\hat {G}$ is approximately independent of $\overline {Re}$, and the mean effective gap $\hat {G}_{mean}$ is also shown in the figure.(ii)
$\hat {G}_{(2D\, wake)}$ and $\hat {G}_{(2D\, wake), mean}$: Cyan markers and cyan dashed line in figure 11.Since the
$\hat {G}$ does not consider the wake drag, an additional parameter, $\hat {G}_{(2D\, wake)}$, is also shown in figure 11 for comparison. $\hat {G}_{(2D\, wake)}$ predicts the effective gap when two-dimensional wake drag (2.7) is also considered. We use $\hat {G}_{(2D\, wake), mean}$ to denote the mean $\hat {G}_{(2D\, wake)}$. In general, $\hat {G}_{(2D\, wake), mean} > \hat {G}_{mean}$ as a larger gap is required for agreement between experimental and analytical solutions when wake drag is considered. We consider $\hat {G}_{(2D\, wake)}$ a better estimate of the effective gap than $\hat {G}$, since it includes an estimate of the wake drag effect. The value of $\hat {G}_{(2D\, wake)}$ increases with $\overline {Re}$, indicating that the effective gap increases with $\overline {Re}$. A similar observation was made for the rolling sphere by Nanayakkara et al. (Reference Nanayakkara, Zhao, Terrington, Thompson and Hourigan2024). However, this trend may be due to the limitations of using the two-dimensional wake drag.(iii) Roughness statistics
$\xi _{p}$ and $\xi _{p, 1 \sigma }$: Purple and green solid lines in figure 11.The measured relative roughnesses
$\xi _{p}$ and $\xi _{p, 1 \sigma }$ for each cylinder (including panel roughness) are also shown in figure 11. For each case, $\hat {G}$ is of the same order of magnitude as the measured relative roughnesses. This supports our hypothesis that surface roughness produces the effective gap responsible for allowing the cylinder to roll. Other roughness parameters (such as $R_{a}$ and $R_{q}$, which are smaller than $R_p$) were also considered; however, they were found to significantly underestimate $\hat {G}$.For the three larger cylinders (D7.7-A1.3, D9.7-A1.0 and D11.7-A0.9),
$\xi _p$ provides a excellent approximation for $\hat {G}_{(2D\, wake), mean}$. However, $\xi _p$ underestimates the effective gap for the smallest cylinder (D4.7-A2.2), and better agreement is obtained by using the parameter $\xi _{p, 1 \sigma }$, especially in the range $\overline {Re}<80$. The use of different roughness statistics for the larger and smaller cylinders is reasonable, given the qualitative differences in the surface textures of smaller and larger cylinders (see § 4.5.2).


It should also be noted that with increasing cylinder diameter, the range of  $\overline {Re}$ of the data increases while the
 $AR$ decreases. The effects of varying
 $AR$ on these results will be minimal as shown in § 4.2. In addition, (2.7) is only valid for
 $10<\overline {Re}<200$; as such, the
 $\hat {G}$ beyond
 $\overline {Re}>200$ will be unreliable.
4.5.2. Comparison of surface textures of the two cylinders with different roughness characteristics
In § 4.5.1, we found that different surface roughness parameters,  $\xi _p$ and
 $\xi _{p,1 \sigma }$, give the best agreement between experimental measurements and analytical–numerical predictions of the drag coefficient for larger- and small-diameter cylinders, respectively. We propose that this difference can be attributed to a difference in the surface finish between the small- and large-diameter cylinders examined in this study.
Figures 12 compares the surface textures of a cylinder D4.7-A2.2 (figure 12a) with cylinder D9.7-A1.0 (figure 12b). Two-dimensional excerpts of each three-dimensional measurement are also shown in figures 12(c) and 12(d). Sections A–A were selected at the location with the largest observed asperity.
Detailed review of D4.7-A2.2 and D9.7-A1.0 cylinders. The direction of the cylinder rolling with respect to the surface elements is indicated in the arrow at the top right corner. (a) Three-dimensional surface of D4.7-A2.2 cylinder. Measurement  $R_{p}=3.16\,\mathrm {\mu } {\rm m}$,
 $R_{q}=0.27\,\mathrm {\mu } {\rm m}$. (b) Three-dimensional surface of D9.7-A1.0 cylinder. Measurement
 $R_{p}=5.72\,\mathrm {\mu } {\rm m}$,
 $R_{q}=1.79\,\mathrm {\mu } {\rm m}$. (c) Section A–A of figure 12(a). The two-dimensional surface profile of D4.7-A2.2 cylinder. (d) Section A–A of figure 12(b). The two-dimensional surface profile of D9.7-A1.0 cylinder.

The surface textures of the two cylinders shown in figure 12 are notably different from each other. Although both surfaces are highly directional, covered with regularly spaced grooves and ridges, the height of these ridges differs significantly between the two cylinders. The D4.7-A2.2 cylinder is relatively smooth ( $R_{q}=0.27\,\mathrm {\mu }$m), with a sparse distribution of surface asperities that are much larger than the directional ridges. The ridges on the D9.7-A1.0 cylinder are much larger and are of comparable height to the largest asperities. Therefore, the D4.7-A2.2 cylinder will contact the wall via a sparse distribution of large asperities, whereas the D9.7-A1.0 cylinder contacts the plane via the regularly spaced large ridges. This difference in microscopic surface features is likely responsible for the different roughness statistics required to predict the effective gap.
This observed variation of the roughness statistic that best describes the effective gap between two types of cylinders further highlights that simple roughness measures such as  $R_{p}$ do not capture all effects of surface roughness sufficiently. However, they do provide a simple approximation of
 $G/D$ within an order of magnitude, which may be useful for some applications. Further detailed analysis of the surface roughness, especially while under contact, is required to effectively capture the exact mechanism through which surface-to-surface contact occurs.
Recall that the peak roughness  $R_p$ is an ensemble average of the largest peaks observed over 4 or more different samples, each consisting of 24 combined measurements under
 $50\times$ magnification. For the small-diameter cylinder (figure 12a), there are only two large surface features in the sample area, whereas for the large-diameter cylinder (figure 12b), there are a large number of large surface features (the directional grooves). Therefore, fewer large peaks are sampled when measuring the small-diameter cylinder, as compared with the large-diameter cylinders. We expect only the largest peaks to contact the wall and, hence, govern the effective hydrodynamic gap. The use of
 $R_{p,1\sigma }$ for the small-diameter cylinders represents a ‘larger-than-average’ representative asperity contacting the surface. For the small-diameter cylinder, as more measurements are obtained, a larger portion of tall peaks could be captured and the average peak height (
 $R_{p}$) could be larger than the reported value. However, obtaining a larger data set was found to be impractical due to time constraints, and the use of
 $R_{p,1\sigma }$ is a sufficiently accurate approximation to represent the largest peaks in small cylinders or, more particularly, those with this type of surface roughness pattern. Again, we note that one standard deviation peak roughness for smaller cylinders was chosen based on the agreement between
 $\hat {G}$ values shown in figure 11(a) and the discussion provided in § 4.5.1. If other roughness statistics were used, such as two standard deviation peak roughness, it would significantly overestimate the gap height. Therefore, one standard deviation peak height was chosen to yield an approximate agreement between the gap height required by theory and roughness measurements for smaller, smoother cylinders.
Note that for the rolling sphere problem, the r.m.s. roughness  $R_q$ was found to give the best predictions of the drag coefficient (Nanayakkara et al. Reference Nanayakkara, Zhao, Terrington, Thompson and Hourigan2024). This is due to only a small contact area for the sphere, whereas the cylinder contacts the plane over a line of contact. Therefore, it is much more likely for the cylinder to contact a large asperity at any given time, whereas the sphere may often be in contact with small asperities. Hence, the effective gap for the cylinder is of the order of the peak roughness
 $R_p$, whereas the effective gap for the sphere will generally be substantially less than the peak roughness.
In addition, the direction of the grooves on the cylinder surface (see figures 3(e), 3(f) and 12) with respect to the rolling direction may influence the gap height. However, since the gap is determined by the peak height of roughness asperities, and is larger than the grooves, this effect is likely to be negligible.
4.6. Other considerations
In addition to surface roughness effects, there are additional mechanisms that have not been considered in the analytical analysis. These mechanisms could potentially influence the disparities observed between experimental and analytical predictions.
First, the effects of rolling resistance have not been considered. Bikerman (Reference Bikerman1949) and Halling (Reference Halling1958) have highlighted several mechanisms that are characterised as rolling resistance on a rolling sphere, whereas Sharma & Reid (Reference Sharma and Reid1999) discussed a general case applicable for a rolling sphere or disc. Some of these mechanisms include continuous collisions, elastic deformation, capillary action, hysteresis effects, inter-facial slip and molecular adhesion. Exploring the contribution of each of these mechanisms is beyond the scope of the present work; however, a summary of experimental results is given here to highlight the potential contribution of rolling resistance to the total drag coefficient. Typically, rolling resistance is expressed as a non-dimensional rolling resistance coefficient,  $\mu _{roll}$. Experimental measurements of
 $\mu _{roll}$ ranges from
 $0.0002$ for spheres rolling on relatively smooth panels (Cross Reference Cross2016) to
 $0.04$ for teethed gears rolling on smooth panels in air (Cross Reference Cross2015). For acrylic cylinders assuming a rolling resistance of
 $0.001$, if treated as a drag coefficient (
 $\bar {C}_{D,roll} = \bar {F}_{roll}/(\frac {1}{2}DL \rho _{f}\bar {U}^{2})$), where
 $\bar {F}_{roll} = \mu _{roll} (W_B g \cos \theta -\bar {F}_{L})$. This
 $\bar {C}_{D,roll}$ contribution would likely fall within the order of
 $0.5$. However, accurately determining the precise contribution of rolling resistance to
 $\bar {C}_{D}$ without a dependable analytical model is challenging. Developing such a model is not within the scope of the present study and is recommended for future research.
Further, it should be highlighted that the rolling resistance force ( $\bar {F}_{roll}$) is distinct from the contact force (
 $\bar {F}_{C}$) described in § 2. The frictional force at the point of contact is essential for the cylinder to roll without slip; however, it does no work on the cylinder and therefore does not reduce the cylinder's total kinetic energy. Instead, it transfers the cylinder's total kinetic energy between translation and rotation to maintain no slip.
Second, the analytical predictions using lubrication theory have assumed ideally smooth surfaces. Surface roughness generally results in an increased resistance to fluid flow through the lubrication film (Patir & Cheng Reference Patir and Cheng1978), which may result in an increased drag force which has not been considered in the present study. Further analytical and numerical studies would yield insights into the variation of the drag on a cylinder due to the rough lubrication layer.
Third, it is important to highlight that the area used for measuring roughness can influence the statistical data of roughness presented in this study. A larger area of measurement may encompass more peaks, leading to more accurate  $R_p$ and
 $R_{p, 1 \sigma }$ values. To acquire roughness measurements that accurately represent the surfaces of the cylinders and panels, a considerably larger set of measurements would be necessary. However, this was considered impractical due to time constraints and other considerations.
In addition, experimental limitations will introduce errors into the presented results. Local gradients on the panel surface and unevenness of cylinder diameters and spans lead to perturbations to the cylinder rolling path. Dust deposited on the panel surface, and micro air bubbles although (mostly) systematically removed, may also lead to systematic errors.
Finally, although surface roughness provides an effective gap for fluid flow allowing for a finite effective drag coefficient, contact occurs via asperities. Lubrication theory predicts infinite pressure peaks at these contact points, due to zero gap, which restricts cylinder motion (‘the rolling paradox’). Goldman et al. (Reference Goldman, Cox and Brenner1967) argued that non-continuum flow could be a probable mechanism that allows sphere motion, which may be applicable to the rolling cylinder problem as well. Goldman et al. (Reference Goldman, Cox and Brenner1967) states that effects of surface roughness, with larger length scales, should be evident prior to the effect of non-continuum flow. Since we have observed the effects of surface roughness on  $\bar {C}_{D}$, an inter-asperity level gap height could be sufficiently small that lubrication theory is no longer valid and wall slip corrections to the Navier–Stokes equation should be considered. On the length scale of asperities, if fluid–wall slip occurs (non-zero fluid velocity at the wall–fluid boundary), it will provide an alleviation of the large pressure peaks generated at the contact points, which will allow cylinder motion. However, these considerations are beyond the scope of the present study.
4.7. Comparison of $\overline {Re}$ vs $\bar {C}_{D}$ of a rolling cylinder and rolling sphere with the same diameter


Figure 13 illustrates the  $\overline {Re}$ vs
 $\bar {C}_{D}$ curves for a freely rolling cylinder with an aspect ratio close to unity (1.07), and a sphere of similar diameter. The freely rolling cylinder has an estimated gap–diameter ratio of
 $G/D \approx \xi _{p} = 5.8\times 10^{-4}$, whereas the rolling sphere has an estimated gap–diameter ratio of
 $G/D \approx \xi _q = 6.1\times 10^{-5}$. In addition, numerical data from Yang et al. (Reference Yang, Feng and Zhang2022) for an isolated cylinder and from Johnson & Patel (Reference Johnson and Patel1999) for an isolated sphere are included for comparison.
Comparison of  $\bar {C}_{D}$ vs
 $\overline {Re}$ variation for a cylinder (D9.7-A1.0) with the aspect ratio of 1 and a sphere, both with diameter
 $D \approx 9.7\,{\rm mm}$ on the glass panel. Least-squares lines have been fitted through the data points corresponding to cylinders and spheres. The relative roughnesses are
 $\xi _p = 5.8 \times 10^{-4}$ for cylinders and
 $\xi _q = 6.1\times 10^{-5}$ for spheres. Data corresponding to isolated spheres for both spheres and cylinders are also presented for comparison.

The isolated cylinder and isolated sphere have a similar drag coefficient, whereas the drag coefficient for the rolling cylinder is nearly double that of the rolling sphere for all  $\overline {Re}$. Moreover, both of the freely rolling bodies exhibit much higher drag coefficients than the isolated sphere and cylinder. The increase in drag for freely rolling bodies is largely due to the gap-dependent drag, which characterises the effects of the lubrication flow in the inner region.
For the cylinder flow, the gap-dependent drag is given by (2.8), and is inversely proportional to  $(G/D)^{1/2}$. For the sphere, the gap-dependent drag is given by (Goldman et al. Reference Goldman, Cox and Brenner1967; Houdroge et al. Reference Houdroge, Zhao, Terrington, Leweke, Hourigan and Thompson2023)
 \begin{equation} C_{D,{pred, gap, sphere}} = \frac{1}{Re}({-}44.2\log_{10} (G/D) + 34.0), \end{equation}
and depends logarithmically on  $1/(G/D)$. The gap-dependent drag coefficients for both the cylinder and the sphere are indicated by solid lines in figure 13, and wake drag is indicated by dashed lines. Here, the wake drag was estimated by subtracting the gap-dependent drag from the measured drag coefficient, for both sphere and cylinder. The wake drag of the cylinder and the sphere are similar to each other, within the
 $\overline {Re}$ range considered here. For the cylinder, the gap-dependent drag is more prominent than the wake drag; however, at a lower range of
 $\overline {Re}$, the same could be true for the sphere as well (
 $\overline {Re}<50$). The relative contribution of wake drag to gap-dependent drag on total drag will be dependent on
 $G/D$. The
 $G/D$ values are fixed in the examples shown here and under different
 $G/D$, gap-dependent drag will be different for both the cylinder and sphere. However, the gap-independent wake drag is similar in magnitude for both sphere and cylinder, which is not surprising owing to their geometrical similarities.
With increasing  $\overline {Re}$, the wake drag and gap-dependent drag converge for the cylinder and diverge for the sphere. The point of intersection between gap-dependent and wake-dependent drag is
 $\overline {Re} \approx 800$ (approximated by extrapolating the observed trends) for the cylinder and
 $\overline {Re} \approx 80$ for the sphere. Although the
 $\overline {Re}$ at which the transition from gap-dependent drag dominant to wake drag dominant varies for the cylinder and sphere, both display the same general trends of behaviour.
Although the drag coefficient for both spheres and cylinders approaches infinity in the limit  $G/D \rightarrow 0$, the sphere
 $\bar {C}_{D}$ diverges only logarithmically (4.2), whereas the cylinder
 $\bar {C}_{D}$ diverges much faster, with an inverse square-root (power law) behaviour (2.8). Therefore, for a sufficiently small
 $G/D$, the cylinder will exhibit a much larger drag coefficient than the sphere. Physically, we attribute this difference in behaviour to the much larger contact region for the cylinder, which results in a larger region over which lubrication forces act.
5. Wake–structure interactions
Due to the influence of wake shedding, the velocity of a freely rolling cylinder varies in the down-slope ( $x$) and cross-slope (
 $y$) directions and these variations have a direct influence on
 $\bar {C}_{D}$. As such, we have conducted an analysis of the cylinder wake–structure interaction to visualise the wake of a freely rolling cylinder, and its variation with
 $\overline {Re}$,
 $AR$ and
 $\xi$. A UV-induced fluorescent dye visualisation technique was used to visualise the wake structures behind the freely rolling finite-span cylinders. High-resolution (Nikon D7100 and GoPro Hero 10) cameras were used to capture images of wake formations.
5.1. Background of wake–structure interaction of cylinders
An isolated stationary cylinder in free flow transitions from steady two-dimensional to unsteady periodic shedding at  $\overline {Re}=46$ (Bénard–von Kármán shedding), and further three-dimensional instabilities occur at
 $\overline {Re}=190$ and
 $\overline {Re}=260$ (Taneda Reference Taneda1956; Barkley and Henderson Reference Barkley and Henderson1996; Williamson Reference Williamson1996; Henderson Reference Henderson1997). It is also well known that at
 $\overline {Re} \approx 1200$, the shear layers separating from the cylinder surface becomes unstable, and the boundary layer becomes turbulent before separation beyond
 $\overline {Re} \geq 3 \times 10^{5}$. Adding cylinder rotation to this problem gives rise to a range of additional modes of shedding and instabilities, dependent on
 $\overline {Re}$, of which a thorough review has been presented by Rao et al. (Reference Rao, Radi, Leontini, Thompson, Sheridan and Hourigan2015a). Interestingly, at a rotation rate (the ratio of the cylinder surface speed to the relative free stream speed) of unity, the wake transitions are similar to those of an isolated non-rotating cylinder.
The presence of a plane or a boundary near the cylinder acts to stabilise the flow (Taneda Reference Taneda1965), and delays the onset of vortex shedding to  $\overline {Re}=100$ for
 $G/D \le 0.3$ (Lei, Cheng & Kavanagh Reference Lei, Cheng and Kavanagh1999). At much smaller gap ratios (
 $G/D\leq 0.1$), the vortices are generated from the interaction between the separating shear layer at the top of the cylinder and the secondary vorticity formed by the wall boundary layer (Stewart et al. Reference Stewart, Thompson, Leweke and Hourigan2010a).
The addition of rotation to this system further complicates the flow dynamics. Stewart et al. (Reference Stewart, Thompson, Leweke and Hourigan2010a) and Rao et al. (Reference Rao, Stewart, Thompson, Leweke and Hourigan2011) found that the direction of rolling, prograde or retrograde, acts to either destabilise the flow or delay instabilities, respectively. Houdroge et al. (Reference Houdroge, Leweke, Hourigan and Thompson2020) investigated numerically the wake of a freely rolling cylinder with a small gap ( $G/D=0.005$), and discovered that as
 $\overline {Re}$ increases, the cylinder wake becomes unsteady and leads to cylinder oscillations. Previous studies (Stewart et al. Reference Stewart, Thompson, Leweke and Hourigan2010a; Rao et al. Reference Rao, Stewart, Thompson, Leweke and Hourigan2011; Houdroge et al. Reference Houdroge, Leweke, Hourigan and Thompson2017) have found that a uniformly rolling cylinder transitions from steady to unsteady vortex shedding at
 $\overline {Re}=88$. Rao et al. (Reference Rao, Thompson, Leweke and Hourigan2015b) found numerically that the presence of the wall alters the centreline symmetry of the wake, and as such significantly modifies the transitions. When the gap height approaches small values (
 $G/D \approx 0.2$), they observed that the steady flow transitions to mode E instability prior to the transition to unsteady base flow. At such gap heights, more common instabilities, such as modes A and B, were not observed in the
 $\overline {Re} < 400$ range. We note that mode A is three-dimensional spanwise instability with an approximate four-diameter wavelength, whereas mode B has a shorter (one-diameter) spanwise wavelength (Williamson Reference Williamson1996).
Pirozzoli et al. (Reference Pirozzoli, Orlandi and Bernardini2012) investigated the flow around a wheel of  $AR=0.4$ at various
 $Re$, and observed steady laminar flow up to
 $Re\approx 300$, followed by unsteady planar symmetric flow, with the shedding of hairpin vortices up to
 $Re\approx 400$. The first transition from periodic, planar symmetric flow to quasi-periodic, asymmetrical flow was found to occur at
 $Re\approx 500$, with further increase in
 $Re$ leading to increase in turbulence in the wake of the rolling cylinder. Pirozzoli et al. (Reference Pirozzoli, Orlandi and Bernardini2012) also attributed the formation of the hairpin vortices to a combination of spanwise, streamwise and wall-normal vorticity around the rolling cylinder. Through iso-surface vorticity visualisations, they have shown that spanwise vorticity forms the upper part of the hairpin vortices, whereas streamwise vorticity provides the legs and wall-normal vorticity contributing to the necks. Although these critical transitions have been observed numerically for a cylinder of
 $AR=0.4$, variations in cylinder
 $AR$ may influence the
 $\overline {Re}$ at which these transitions occur. We experimentally investigate these phenomena further in the present study.
Wang et al. (Reference Wang, Zhu, Zhou, Bao, Ping, Han and Xu2020) studied numerically (three-dimensional) the wake of an infinite cylinder near a moving wall, at  $G/D=0.2$ and
 $150 < \overline {Re} < 300$. They observed three different modes of shedding and concluded that the transition to chaotic flow at high
 $\overline {Re}$ occurs due to the strong nonlinear interaction between these modes with different spanwise wavelengths. We expect similar spanwise modes for the large
 $AR$ cylinders for the freely rolling case studied here; however, cylinder end effects will also contribute to the wake structures formed.
Houdroge et al. (Reference Houdroge, Leweke, Hourigan and Thompson2020) reported on the Strouhal number,  $St$, of two-dimensional freely rolling cylinders, and observed
 $St$ decreasing from
 $0.065$ at
 $Re =100$ to
 $0.051$ at
 $Re=300$ for
 $G/D=0.0003125$. With increasing
 $G/D$,
 $St$ was observed to increase at a given
 $Re$. A similar observation was made for the three-dimensional case, with a weak dependence on the mass ratio of the cylinders. Stewart et al. (Reference Stewart, Thompson, Leweke and Hourigan2010a) also observed
 $St$ for the two-dimensional cylinders within the same range, with
 $St$ increasing with decreasing rotation rate of the cylinder. The largest
 $St (\approx 0.1)$ was observed for a non-rotating cylinder at
 $160< Re<200$. Experimental flow visualisations obtained in this study are compared against these numerically observed values.
5.2. Variations in the cylinder wake with $\overline {Re}$

Figure 14 displays the evolution of the wake behind a freely rolling cylinder with a fixed  $AR\approx 1$, as
 $\overline {Re}$ is increased. As observed in figures 14(a) and 14(b) at lower
 $\overline {Re}$, the wake of the cylinder is steady and attached. The shear layer separating from the top of the cylinder forms a recirculation zone comprising a counter-rotating vortex pair which is attached to the cylinder. As the cylinder moves down the panel, this recirculation zone oscillates, causing some minor fluctuations in the cylinder path. Figure 14(c) presents the first instance that we observed unsteadiness in the wake of the cylinder. This corresponded to the detachment of the shear layer from the top of the cylinder to form hairpin vortex loops. This image indicates that the first critical transition to unsteady periodic flow occurs in the range
 $95<\overline {Re}<116$. The observed hairpin loop appears symmetrical. From figures 14(d) to 14(j) as
 $\overline {Re}$ is increased, the wake of the cylinder becomes progressively more unstable and chaotic. The frequency of shedding of hairpin vortices also increases with
 $\overline {Re}$, and we observe some degree of cross-slope movement, generated by this shedding.
Plan view of experimental flow visualisation using UV-induced fluorescent dye technique for a cylinder with  $AR\approx 1$ with
 $\overline {Re}$ ranging from 79–598: (a)
 $\overline {Re} = 79(\pm 1)$, (b)
 $\overline {Re} = 95(\pm 1)$, (c)
 $\overline {Re}=116(\pm 1)$, (d)
 $\overline {Re} = 134(\pm 2)$, (e)
 $\overline {Re} = 157(\pm 2)$, (f)
 $\overline {Re} = 275(\pm 3)$, (g)
 $\overline {Re} = 317(\pm 4)$, (h)
 $\overline {Re} = 368(\pm 4)$, (i)
 $\overline {Re} = 469(\pm 6)$ and (j)
 $\overline {Re} = 598(\pm 9)$. Images were captured using a GoPro camera and post-processed. The cylinder is rolling from right to left. The video recordings are provided as supplementary movie 1 available at https://doi.org/10.1017/jfm.2024.833.

Figure 15 visualises the near-wake of a freely rolling cylinder D4.7-A10.7, while  $\overline {Re}$ was varied. As the
 $\overline {Re}$ is increased from
 $28$–
 $134$, the near wake becomes more chaotic. At
 $\overline {Re}=28$, the wake is shorter and no hairpin structures are observed. At
 $\overline {Re}=45$, we note one hairpin-like structure with increased vorticity in the remaining wake as well. Unlike the
 $AR=1$ case shown in figure 14, for this cylinder with a higher
 $AR$, the transition to unsteady periodic shedding of hairpin vortices occurs at a much lower
 $\overline {Re}$ (
 ${\approx }45$). This indicates that the cylinder
 $AR$ plays an important role in the wake characteristics of a rolling cylinder.
Plan view of experimental flow visualisation using UV-induced fluorescent dye technique. Comparison of the near wake of a freely rolling cylinder D4.7-A10.7 with  $\overline {Re}$ ranging from 28–134, for a constant D (4.69 mm). Cylinder rolling from right to left. The video recordings are provided as supplementary movie 2 available at https://doi.org/10.1017/jfm.2024.833.

In addition to the streamwise hairpin vortices, there is an increase in spanwise vorticity with increasing  $\overline {Re}$. Following the transitions to periodic shedding of hairpin vortices first observed at
 $\overline {Re}=45$, two distinct structures are observed at
 $\overline {Re}=50$ and
 $\overline {Re}=89$. As
 $\overline {Re}$ is increased further, the wake becomes more chaotic and distinct hairpins are no longer visible; rather, multiple vortices are observed. As discussed by Wang et al. (Reference Wang, Zhu, Zhou, Bao, Ping, Han and Xu2020), the nonlinear interaction of different spanwise modes may contribute to the evolution of the wake to the chaotic state observed at
 $\overline {Re}=134$. The shape of the near wake also changes with increasing
 $\overline {Re}$. At low
 $\overline {Re}$
 $(28<\overline {Re}<50)$, the near wake appears to be shorter than the span of the cylinder. However, at higher
 $\overline {Re}$, the near-wake vortices are observed across its full span.
5.3. Cylinder wake variations with $AR$

In this section, we investigate the variation of a cylinder wake with  $AR$. The wake of a three-dimensional cylinder (limited span) differs from that of a two-dimensional cylinder (infinitely long) primarily due to the flow around the ends, more commonly categorised as end effects. End effects are an important consideration for limited-span bodies, where a pressure difference between opposing sides drives the fluid around its ends. To visualise these effects, the wake of a cylinder with a fixed
 $D\approx 4.7\,{\rm mm}$ and with varying
 $AR (1.01\unicode{x2013}29.84)$ was visualised while rolling down a plane at a fixed angle of inclination.
Figure 16 shows the images of the near wake of the cylinders. First, even at the same angle of inclination, the induced  $\overline {Re}$ of the cylinders generally increases with increasing
 $AR$. The smaller
 $AR$ cylinder displays a steady attached wake whereas the larger
 $AR$ cylinders display a high degree of unsteady shedding of hairpin vortices and turbulence in the wake. The wakes of the cylinders are clearly distinct, indicating that the cylinder
 $AR$ has a significant effect on the cylinder wake shedding.
Plan view of experimental flow visualisation using UV-induced fluorescent dye technique. Comparison of the near wake of a freely rolling cylinder, for different  $AR$ ranging from 1.01 to 29.84, for a constant
 $D$ (4.7 mm) and
 $\theta =14^{\circ }$. Cylinder rolling from right to left. White arrows indicate the shedding of a pair of vortices per shedding cycle. The video recordings are provided as supplementary movie 3 available at https://doi.org/10.1017/jfm.2024.833.

Similar to the observations made by Inoue & Sakuragi (Reference Inoue and Sakuragi2008) for an isolated stationary cylinder, we observe a range of patterns within the wake as the  $AR$ of the cylinder is varied. One important difference to the observations made by Inoue & Sakuragi (Reference Inoue and Sakuragi2008) is that the wake is one-sided, due to the presence of the plane wall. However, similar to Inoue & Sakuragi (Reference Inoue and Sakuragi2008), for a low
 $\overline {Re}\, (67\unicode{x2013}113)$, we observe a counter-rotating vortex pair, which transitions to periodic shedding of hairpin vortices (referred to as type IV shedding by Inoue & Sakuragi Reference Inoue and Sakuragi2008) as
 $AR$ is increased. As
 $AR$ is further increased to
 $19.72$ and
 $29.84$, we observe some remnants of oblique vortex shedding (type I) with a combination of hairpin vortices. Spanwise wavelengths are also visible for the high
 $AR$ cylinders; at
 $AR=29.84$, two pairs of hairpins are shed per shedding cycle. This pair of hairpins is shown in figure 16 using two white arrows for the
 $AR=29.84$ case.
Another key observation that can be made from figure 16 is the streamwise length of the near wake, compared with its span, decreasing with increasing  $AR$. For the first three cases (
 $AR=1.01,2.16,4.29$), we note that the near wake spans the full length of the cylinder. However, at the higher
 $AR$ (
 $AR=10.68,19.72,29.84$), the near wake gradually becomes narrower compared with the cylinder span. That is, we see more fluid flow around the ends to the low-pressure region downstream of the cylinder. This phenomenon could reduce the pressure differential between the front and rear of the cylinder, reducing pressure drag. The near wake of the high-
 $AR$ cylinders is also increasingly turbulent, with multiple hairpin-like structures observed in the wake. For the lower-
 $AR$ cases, the near wake comprised a pair of attached counter-rotating vortices, with no hairpin structures shed into the wake.
5.4. Cylinder wake variations with $\xi$

To establish the effects of surface roughness on the cylinder wake, visualisations of the same cylinder (D9.7-A1.0) rolling on two panels with different surface roughnesses were obtained. Figure 17 shows the wake of the cylinder rolling on a glass panel ( $R_{p} = 0.308\,\mathrm {\mu }$m) and a frosted glass panel (
 $R_{p} = 5.96\,\mathrm {\mu }$m), which is
 $20$ times rougher than the glass panel. As observed in the figure, the wake of the cylinders shows a high degree of similarity and the
 $St$ are also nearly identical. This observation indicates that the panel surface roughness, or the gap imposed by roughness, has little influence on the wake of a rolling cylinder. The same observation was made from the numerical studies of Merlen & Frankiewicz (Reference Merlen and Frankiewicz2011) and Houdroge et al. (Reference Houdroge, Leweke, Hourigan and Thompson2020).
Plan view of experimental flow visualisation using UV-induced fluorescent dye technique of the cylinder D9.7-A1.0: (a) glass panel ( $R_{p}=0.308\,\mathrm {\mu }$m) at
 $\overline {Re} = 275(\pm 3)$,
 $St=0.13$; (b) frosted glass panel (
 $R_{p}=5.96\,\mathrm {\mu }$m) at
 $\overline {Re} = 277(\pm 3)$,
 $St=0.13$. Comparison of flow structures between glass panel and frosted glass panel
 $R_{p}$ roughness of the frosted glass panel is approximately
 $20$ larger than the glass panel. The cylinder is rolling from right to left.

5.5. Temporal evolution of the wake of a cylinder
The wake of a freely rolling finite-span cylinder is complex, varying with cylinder  $\overline {Re}$ and
 $AR$. At higher
 $\overline {Re}$, the wake also exhibits a high degree of unsteadiness which increases with
 $\overline {Re}$, and the hairpin vortices are shed at a higher frequency. To further investigate this unsteadiness, we have captured the temporal evolution of the wake of three cylinders under varied flow conditions. First, in figure 18, we present snapshots taken of a cylinder D4.7-A10.7 at
 $\overline {Re}=89(\pm 1)$. Then, the flow around a larger cylinder D9.7-A5.16 (
 $D=9.7\,{\rm mm}$ and
 $AR=5.16$) at
 $\overline {Re}=205(\pm 3)$ is presented. Finally, the flow around a cylinder D19.7-A0.5 at a much higher
 $\overline {Re}=558(\pm 9)$ is shown to highlight the increased unsteadiness in the wake at higher
 $\overline {Re}$.
Plan view of experimental flow visualisation using UV-induced fluorescent dye technique. Temporal evolution of the wake of a freely rolling cylinder D4.7-A10.7 at  $\overline {Re}=89(\pm 1)$. The images depict the evolution of the wake from
 $t=0\,{\rm s}$ (
 $t^{*}=0$) to
 $t=6\,{\rm s}$ (
 $t^{*}=23.3$). Three hairpin vortices are shed into the wake within this time period. Cylinder rolling from right to left. The video recordings are provided as supplementary movie 4 available at https://doi.org/10.1017/jfm.2024.833.

Figure 18 depicts the temporal evolution of the near and far wake of a freely rolling cylinder D4.7-A10.7 at  $\overline {Re}=89(\pm 1)$. Snapshots were taken at varied time intervals over three fundamental shedding cycles, both dimensional (
 $t$) and non-dimensional (
 $t^{*}=t\bar {U}/D$) timescales have been used to describe the flow. At
 $t=0$ s (
 $t^{*}=0$), we observe the initial development of the vorticity within the near wake of the cylinder. Two distinct hairpin structures are observed developing, with their corresponding ends attached to the ends of the cylinder and joined in the middle. The vorticity generated by end effects appears to feed each of the hairpins developed. At
 $t=1\,{\rm s}$ (
 $t^{*}=3.9$) and
 $t=2\,{\rm s}$ (
 $t^{*}=7.8$), the two structures grow in size and move further away from the cylinder surface. At
 $t=3\,{\rm s}$ (
 $t^{*}=11.6$), the individual hairpins intertwine and form a single larger hairpin structure, which is detached from the cylinder and shed into the wake at
 $t=4\,{\rm s}$ (
 $t^{*}=15.5$). At the same time, we note that another set of hairpin vortices are being developed, grow and join from
 $t=3\,{\rm s}$ (
 $t^{*}=11.6$) to
 $t=4\,{\rm s}$ (
 $t^{*}=15.5$) and shed into the wake at
 $t=6\,{\rm s}$ (
 $t^{*}=23.3$). At
 $t=6\,{\rm s}$ (
 $t^{*}=23.3$), three such vortices are observed in the far wake of the rolling cylinder, and another is still attached to the rear end of the cylinder. These shed vortices move away from the panel and dissipate downstream of the cylinder. In addition, we note that in figure 14, the transition to unsteady vortex shedding occurs at
 $\overline {Re}\approx 100$; however, at this larger
 $AR$, this transition appears to occur at a lower
 $\overline {Re}$.
Figure 19 depicts the temporal evolution of the near and far wake of a freely rolling cylinder D9.7-A5.16 at  $\overline {Re}=205(\pm 3)$. This case is at a higher
 $\overline {Re}$ than figure 18, with a larger
 $D$ and half the
 $AR$. Two dyes with different shades of green were used on either end of the cylinder, to visualise the interaction between opposite vorticity generated by opposing ends of the cylinder. We observe that the wake is more chaotic than figure 18; however, hairpin vortices are shed periodically. The streamwise distance between consecutive hairpins is also reduced. The intertwining of the two opposite vortices generated by each end of the cylinder is more clearly observed in this figure. At
 $t=0\,{\rm s}$ (
 $t^{*}=0$), we observe the two dyes are coating each end of the cylinder, but as time progresses, there is significant mixing induced by the rolling motion of the cylinder. There is some degree of separation between the two dyes, even in the shed vortices, but as the wakes move downstream, there appears to be a remnant of a single colour.
Plan view of experimental flow visualisation using UV-induced fluorescent dye technique. Temporal evolution of the wake of a freely rolling cylinder D9.7-A5.16 ( $D=9.7\,{\rm mm}$ and
 $AR=5.16$) at
 $\overline {Re}=205(\pm 3)$. The images depict the evolution of the wake from
 $t=0\,{\rm s}$ (
 $t^{*}=0$) to
 $t=7\,{\rm s}$ (
 $t^{*}=16.1$). Two dyes of different shades of green have been used to indicate opposite vorticity generated due to the rolling motion. Cylinder rolling from right to left. The video recordings are provided as supplementary movie 4 available at https://doi.org/10.1017/jfm.2024.833.

Figure 20 depicts the temporal evolution of the near and far wake of a cylinder D19.7-A0.5 at  $\overline {Re}=558(\pm 9)$. Shedding of hairpin vortices is pseudo-periodic, with varying angles to the streamwise direction. The cylinder wake is chaotic and clear hairpin structures are no longer observed. However, some resemblance of hairpin structures is noted. The frequency of shedding is further increased compared with figures 18 and 19, and the streamwise distance between each vortex is also reduced. As the vortices move away from the cylinder, they grow in size and dissipate downstream. The vortical structures numerically visualised by Pirozzoli et al. (Reference Pirozzoli, Orlandi and Bernardini2012) at
 $Re=500$ for a cylinder with a similar
 $AR$ were compared against the structures observed in figure 20. They were in excellent agreement with the structures observed here. They observed numerically that the alternately shed vortices under these conditions have a tendency to bend to alternating sides in the cross-slope direction, which also corresponds to peaks in the frequency spectra of force coefficients. The shedding of these vortices can be used to calculate the
 $St$ of the cylinders, which is presented in § 5.5.1.
Plan view of experimental flow visualisation using UV-induced fluorescent dye technique. Temporal evolution of the wake of a freely rolling cylinder D19.7-A0.5 at  $\overline {Re}=558(\pm 9)$. The images depict the evolution of the wake from
 $t=0\,{\rm s}$ (
 $t^{*}=0$) to
 $t=8\,{\rm s}$ (
 $t^{*}=12.1$). Cylinder rolling from right to left. The video recordings are provided as supplementary movie 4 available at https://doi.org/10.1017/jfm.2024.833.

It should be noted that in experimental visualisations, even a small perturbation in the initial conditions can break the wake symmetry. It has been difficult to capture a purely symmetrical wake, due to cylinder oscillations and the lateral movement across the plane. Pirozzoli et al. (Reference Pirozzoli, Orlandi and Bernardini2012) observed a symmetrical wake up to  $Re=400$; however, we have not been able to observe that experimentally.
5.5.1. Strouhal number ($St$) calculations

The shedding of hairpin vortices into the wake of a freely rolling cylinder allows the calculation of the Strouhal number  $(St=fD/\bar {U})$. Here,
 $f$ is the vortex shedding frequency,
 $D$ is the cylinder diameter and
 $\bar {U}$ is the mean down-slope velocity.
Figure 21 depicts the variation of cylinder  $St$ with
 $\overline {Re}$ for cylinders of varied aspect ratios (0.5–29) and diameters. The numerical results of Houdroge et al. (Reference Houdroge, Leweke, Hourigan and Thompson2020) for a two-dimensional cylinder with
 $G/D=0.0003125$ and two-dimensional results of Stewart et al. (Reference Stewart, Thompson, Leweke and Hourigan2010a) for
 $G/D=0.004$ are also shown in the figure. Three-dimensional numerical
 $St$ determined from the peak
 $St$ from the lift coefficient time histories given by Pirozzoli et al. (Reference Pirozzoli, Orlandi and Bernardini2012) for a cylinder with
 $AR=0.4$ are also indicated in the figure for comparison.
Comparison of  $St$ vs
 $\overline {Re}$ variation for a freely rolling cylinder with varied aspect ratios (
 ${\approx }0.5\unicode{x2013}30$) and diameters. For experimental data, Stewart et al. (Reference Stewart, Thompson, Leweke and Hourigan2010a) and Yang et al. (Reference Yang, Wang, Guo and Zhang2023) the
 $St$ of vortex shedding in shown. For Houdroge et al. (Reference Houdroge, Leweke, Hourigan and Thompson2020) and Pirozzoli et al. (Reference Pirozzoli, Orlandi and Bernardini2012) the
 $St$ of oscillations is indicated. Numerical predictions from previous literature have also been plotted for comparison.

The experimental  $St$ of the present study shows a clear increasing trend with increasing
 $\overline {Re}$. There is general agreement between the results of the present study and numerical results in the range
 $100<\overline {Re}<200$, but diverge beyond
 $\overline {Re}>200$. Experimental results indicate an increasing
 $St$ with increasing
 $\overline {Re}$, whereas the numerical studies predict a decrease in
 $St$. Three-dimensional effects, which are not effectively captured in the two-dimensional numerical studies by Houdroge et al. (Reference Houdroge, Leweke, Hourigan and Thompson2020) and Stewart et al. (Reference Stewart, Thompson, Leweke and Hourigan2010b), likely play a significant role in this observed divergence. As observed in figure 16, higher
 $AR$ cylinders display increased unsteadiness in the wake and pronounced wake shedding, even at the same angle of panel inclination and at similar
 $\overline {Re}$. Experimental data presented in figure 21 contain a large range of
 $AR$s (
 ${\approx }0.5\unicode{x2013}30$) and cylinder diameters, which also likely contributes to the divergence, and also the scatter observed in the figure. Yang et al. (Reference Yang, Feng and Zhang2022) numerically observed a similar increase in
 $St$ from
 $0.12$ to
 $0.22$ for an increase of
 $Re$ from
 $50$ to
 $500$ for an isolated three-dimensional cylinder for similar
 $AR$ (also shown in figure 21). We anticipate that the introduction of a plane will alter the shedding behaviour, but will retain the general
 $\overline {Re}$ dependence. Therefore, the observed increase in
 $St$ with
 $\overline {Re}$ in figure 21 is generally within the expected range of
 $St$ for a three-dimensional cylinder.
Given the complex coupling of contact forces, fluid forces, frictional forces, three-dimensional effects, gap effects and other minor experimental factors such as plate unevenness, dust and air bubbles, the mechanisms that affect cylinder motion and wake shedding are difficult to quantify. Experimentally, we cannot measure the forces acting on a freely rolling cylinder; as such, a detailed explanation of the observed behaviour is not presented here. We simply present the measured  $St$ data, which highlight the general behaviour of a freely rolling cylinder. We acknowledge that some of the experimental factors mentioned earlier will affect the presented results. A detailed three-dimensional numerical investigation (including a numerical stability analysis), with sufficiently small gap ratios, of the effects of
 $AR$ and
 $\overline {Re}$ on
 $St$ is required to obtain a deeper understanding of these observed behaviours, and the mechanisms contributing to the observed periodic fluctuations of the freely rolling cylinder problem. To the best of the authors’ knowledge, such an investigation has not yet been reported in the current literature, and it is considered to be beyond the scope of the present study, which we recommend for future work.
6. Conclusions
We have investigated the effects of surface roughness on the time-mean drag coefficient ( $\bar {C}_{D}$) of a finite-span cylinder rolling, without slip, down an inclined plane due to gravity. In addition, we have also considered the effects of time-mean Reynolds number (
 $\overline {Re}$), cylinder aspect ratio (
 $AR$), wake dynamics and the potential influence of cavitation on cylinder
 $\bar {C}_{D}$.
The most noteworthy discovery was the dependence of the  $\bar {C}_{D}$ vs
 $\overline {Re}$ relationship on surface roughness. Increased roughness, represented by the parameter
 $\xi$, resulted in reduced
 $\bar {C}_{D}$, aligning with lubrication theory predictions, assuming that roughness creates an effective gap between the cylinder and the plane. Both cylinder and panel surface roughness contributed to
 $\bar {C}_{D}$ variations. For instance, when
 $\xi$ increased by a factor of
 $10$, approximate
 $\bar {C}_{D}$ reductions of
 $65\,\%$ and
 $60\,\%$, at
 $\overline{Re}$ values of
 $100$ and
 $150$ were observed.
The experimental results of the study aligned well with the three-dimensional analytical model of Teng et al. (Reference Teng, Rallabandi, Stone and Ault2022). This model divided  $\bar {C}_{D}$ into two components: gap-dependent drag (
 $C_{D,{pred, gap(3D)}}$) and wake drag (
 $C_{D,{pred, wake(3D)}}$).
 $C_{D,{pred, gap(3D)}}$ can be predicted using three-dimensional lubrication theory (2.8) and is a function of
 $\overline {Re}$,
 $AR$ and
 $\xi$. Here
 $C_{D,{pred, wake(3D)}}$ should be calculated numerically, and depends on
 $\overline {Re}$ and
 $AR$. Teng et al. (Reference Teng, Rallabandi, Stone and Ault2022) do not provide the numerical estimates of
 $C_{D,{pred, wake(3D)}}$ but Terrington et al. (Reference Terrington, Thompson and Hourigan2023) provide results for a two-dimensional cylinder
 $C_{D,{pred, wake(2D)}}$ (2.7), which have been used as baseline values in this study to enable effective comparison. It is assumed that
 $C_{D,{pred, wake(3D)}}$ will be of the same order of magnitude as
 $C_{D,{pred, wake(2D)}}$.
Matching drag coefficients for an ideally smooth cylinder with an imposed gap with rough cylinders in contact with the plane demonstrated agreement between the effective gap ratio ( $\hat {G}=G_{eff}/D$) and the measured relative peak roughness (
 $\xi _{p}=R_{p}/D$). For the comparatively smoother
 $D\approx 4.7\,{\rm mm}$ cylinders,
 $R_{p, 1 \sigma }/D$ was observed to better represent the value of
 $\hat {G}$. Differences in the value of
 $\hat {G}$ and measured roughness between cylinders were attributed to limitations in using simple statistical roughness measures. Smaller cylinders were generally smoother with a sparse distribution of tall asperities, whereas larger cylinders exhibited more uniform directional asperities, leading to discrepancies in estimated effective gaps. However, it was promising that the gap required by lubrication theory can be estimated using a simple roughness statistic such as
 $R_{p}$ roughness, with a high degree of accuracy. This agreement provides evidence to the assertion that surface roughness is a primary mechanism that allows cylinder motion under solid–solid contact, while providing a finite gap required for lubrication theory, within the
 $\overline {Re}$ range considered in this study.
The  $\bar {C}_{D}$ vs
 $\overline {Re}$ curves for individual panels and cylinders diameters corresponding to distinct
 $\xi$ values were observed to converge with increasing
 $\overline {Re}$. This observation can be explained by using the decomposed version of the total drag coefficient. The contribution to total drag from gap-dependent drag decreases with increasing
 $\overline {Re}$ whereas the wake drag remains relatively constant. As such, at higher
 $\overline {Re}$, wake drag begins to dominate. The observed convergence at high
 $\overline {Re}$ is due to this effect, where the gap-dependent drag is small and the wake drag is more prominent.
The analytical predictions of Teng et al. (Reference Teng, Rallabandi, Stone and Ault2022) predicts  $C_{D,pred}$ to decrease with decreasing
 $AR$; however, the experimental results of the present study indicate that
 $\bar {C}_{D}$ remains relatively constant to variations in cylinder
 $AR$. This may be due to the effects of
 $AR$ on the wake drag coefficient, which are currently unknown. Alternatively, the increased contact area with increasing
 $AR$ may result in a larger effective gap. The drag coefficient decreased with increasing
 $AR$ beyond
 $AR>6$, due to imperfect contact between the cylinder and panel for large
 $AR$ cylinders.
Calculation of the minimum pressure in the gap region using a formula derived by Merlen & Frankiewicz (Reference Merlen and Frankiewicz2011) for the experiments conducted in water suggests that cavitation is unlikely to occur for our range of experimental parameters. The relative agreement of the observed trends between  $\bar {C}_{D}$ for foam cylinders rolling in the air to acrylic cylinders in the water suggested cavitation was not a necessity for cylinder motion, contrary to previous suggestions (Merlen & Frankiewicz Reference Merlen and Frankiewicz2011), as cavitation does not occur in the air.
Investigation of the wake–structure interaction of a freely rolling cylinder with  $AR$ approximately
 $1$ indicated that the wake becomes increasingly unsteady with increasing
 $\overline {Re}$. The first transition to unsteady periodic shedding of hairpin vortices was observed at
 $\overline {Re}\approx 100$, with the wake prior to the transition being steady with a pair of counter-rotating vortices attached to the cylinder. Following this critical transition, the shedding of hairpin vortices becomes prominent with increasing
 $\overline {Re}$, and the wake becomes increasingly chaotic and turbulent.
Cylinder  $AR$ was also found to influence critical transitions to unsteady flow. Decreasing
 $AR$ was observed to delay this first critical transition. A cylinder with
 $AR=1.01$ was observed to transition at
 $\overline {Re}\approx 100$ whereas a cylinder with
 $AR=10.68$ was observed to transition at
 $\overline {Re}\approx 50$. Visualisation of the transient variations of the wake of a cylinder highlighted the interaction of opposite vortices generated from the end effects which merge to form the hairpin vortices that are shed into the wake. Cylinder wake shedding
 $St$ was observed to increase with increasing
 $\overline {Re}$, and general agreement with previous numerical results was observed at
 $\overline {Re}\approx 100$, whereas experimental results diverged from numerical predictions at higher
 $\overline {Re}$. This divergence was attributed to three-dimensional effects which were not effectively captured in two-dimensional numerical investigations.
Overall, further research is needed to understand the effects of rolling resistance generated by energy losses due to collision between asperities, or other mechanisms (such as interfacial slip or hysteresis) and the contribution that makes to the overall drag coefficient. In addition, the three-dimensional effects of wake drag should be studied further, and the development of these mechanisms may lead to a more comprehensive model to describe cylinder motion.
Supplementary movies
Supplementary movies are available at https://doi.org/10.1017/jfm.2024.833.
Acknowledgements
This work was performed in part at the Melbourne Centre for Nanofabrication (MCN) in the Victorian Node of the Australian National Fabrication Facility (ANFF).
Funding
This research was supported under Australian Research Council Discovery Project funding scheme (DP190103388, DP200100704, DE200101650 and DP210100990).
Declaration of interests
The authors report no conflict of interest.
Appendix A. Measurement data tables
The properties of panels and cylinders used during the experimental process are described in tables 1 and 2. Tables 3 and 4 present the measured surface roughness values.
Appendix B. Uncertainty analysis
Accurate estimation of experimental uncertainties for both measured and calculated parameters is crucial for establishing the reliability of observed behavioural trends. In figures 5–7, the error bars on data points represent the uncertainty in calculated values of  $\overline {Re}$ and
 $\bar {C}_{D}$. This section outlines the methodology used to calculate these error bars, illustrated with an example calculation.
For each variable of interest, the total error ( $\delta$) is assumed to be the sum of two components: bias error (
 $\delta _{B}$) and random error (
 $\delta _{R}$). In figures 5–7, only bias error is depicted as error bars. To perform error propagation analysis, the Python uncertainties package (Lebigot Reference Lebigot2023) was used. This package calculates the standard deviation of variables using the linear approximation of error propagation theory. An example calculation is provided here, and table 5 summarises the reference values utilised for a cylinder rolling on a glass panel. This approach ensures that the figures accurately represent the uncertainties associated with the presented data, helping readers understand the reliability of the observed trends in the behaviour of the parameters.
Reference values for uncertainty calculations. IR  $=$ Instrument resolution, STD
 $=$ Standard deviation of measurements.

The values of  $\overline {Re}$ and
 $\bar {C}_{D}$ are given by the following equations:
 $$\begin{gather} \bar{Re} = \frac{\bar{U}D}{\nu} = \frac{LD}{t\nu}, \end{gather}$$
 $$\begin{gather}\bar{C}_{D} = \frac{D(\beta-1)g {\rm \pi}\sin(\theta)}{{2 U}^{2}}. \end{gather}$$
Based on the reference values given in table 5, the measured  $\overline {Re}$ and
 $\bar {C}_{D}$ are
 $$\begin{gather} \overline{Re} = 106 \pm 2\ (1.9\,\%), \end{gather}$$
 $$\begin{gather}\bar{C}_{D} = 9.8 \pm 0.4 \;(4.1\,\%). \end{gather}$$
Approximately  $50\,\%$ of the measured error in
 $\overline{Re}$ and
 $\bar{C}_{D}$ is due to the natural variation of the rolling cylinder velocity. The bias error (error due to measurement uncertainty) is approximately
 $1\,\%$ for
 $\overline{Re}$ and
 $2\,\%$ for
 $\bar{C}_{D}$ in this instance, and only the bias error is shown as error bars in all figures.


 Open access

