


Introduction
Since Reference MercerMercer’s (1978) hypothesis that ice shelves fringing the Antarctic Peninsula would start disintegrating as atmospheric warming increased, both an increase in warming trend and the demise of ice shelves in this region have been widely reported (Reference Doake and VaughanDoake and Vaughan, 1991; Reference KingKing, 1994; Reference Rott, Skvarca and NaglerRott and others, 1996; Reference Vaughan and DoakeVaughan and Doake, 1996; Reference SkvarcaSkvarca and others, 1998, Reference Skvarca, Rack and Rott1999b).
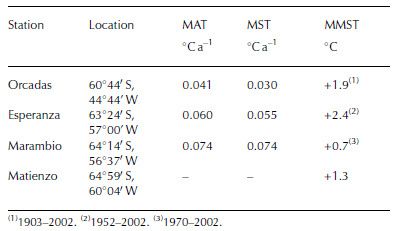
The disintegration of northern Larsen Ice Shelf sections known as Prince Gustav Channel, Larsen Inlet, Larsen A and Larsen B did more than simply support Mercer’s hypothesis; they also revealed the unexpected rapidity and catastrophic nature of ice-shelf response to warming conditions. For instance, in late January 1995, about 856 km2 of Larsen A disintegrated in only 2 days, the total loss being 1600 km2 in 39 days (Reference Rott, Skvarca and NaglerRott and others, 1996). Even more dramatic was the Larsen B event, when 3211 km2 of the ice shelf disintegrated in 41 days (Skvarca and Reference De Angelis and SkvarcaDe Angelis, 2003). In February– March 2002 about 70% of this ice shelf shattered within days into thousands of icebergs of different sizes and shapes. From 1975 to 2002 the Larsen Ice Shelf lost >12 000 km2. Most of this loss occurred as disintegration in only 7 years (1995–2002), coinciding with the warmest summers ever recorded in the region (Table 1).
Temperature trends at selected stations on the northeastern AP. MAT: mean annual surface air temperature, 1971–2001; MST: mean summer surface air temperature, 1970–71/2001–02; MMST: maximum mean summer surface air temperature
The retreat and disintegration of ice shelves around the Antarctic Peninsula has been described elsewhere (Reference SkvarcaSkvarca, 1994; Reference Rott, Skvarca and NaglerRott and others, 1996, Reference Rott, Rack, Skvarca and de Angelis1998; Vaughan and Reference Doake, Corr, Rott, Skvarca and YoungDoake, 1996; Reference Lucchitta and RosanovaLucchitta and Rosanova, 1998; Reference Skvarca, Rack, Rott, Ibarzábal and DonángeloSkvarca and others, 1999a; Reference RackRack, 2000; Reference Scambos, Hulbe, Fahnestock and BohlanderScambos and others, 2000, Reference Scambos, Hulbe, Fahnestock, Domack, Burnett, Leventer, Conley, Kirby and Bindschadler2003; Skvarca and Reference Doake and VaughanDe Angelis, 2003). The causes of disintegration have been mostly associated with the increasing atmospheric warming and the production of surface meltwater, which plays a fundamental role in fracturing and rifting processes (Reference WeertmanWeertman, 1973; Reference Scambos, Hulbe, Fahnestock and BohlanderScambos and others, 2000, Reference Scambos, Hulbe, Fahnestock, Domack, Burnett, Leventer, Conley, Kirby and Bindschadler2003). However, the recently detected rapid bottom melting near the grounding lines around Antarctica due to increased ocean warming is considered relevant for the stability of ice shelves (Reference Rignot and JacobsRignot and Jacobs, 2002; Reference Rignot and ThomasRignot and Thomas, 2002).
On only a few occasions were direct field data provided on conditions immediately before the collapse of an ice shelf; the last field campaign over Larsen B took place only a
few months before disintegration. As reported here, critical glaciological variables were observed and monitored. Field measurements included surface mass balance, ice-flow velocity and strain rate in the central part of Larsen B as well as on an almost stagnant ice-shelf section which remains confined within Seal Nunataks.
The purpose of this paper is to present basic glaciological data collected over Larsen B prior to its sudden collapse. This may contribute to prediction of the disintegration of Larsen C and other ice shelves surrounding Antarctica. The disintegration of ice shelves is especially important in view of the detected acceleration and surges of former tributary glaciers (Rott and others, 2002; Reference De Angelis and SkvarcaDe Angelis and Skvarca, 2003), confirming the early theory on the stabilizing role of ice shelves (Reference HughesHughes, 1973).
Regional Climate And Recent Weather Conditions
The mean annual surface air temperature (MAT) on the Antarctic Peninsula shows an increase of 2.5˚C over the last 50 years (Reference KingKing, 1994). In the northeastern region of the peninsula, the atmospheric warming extends from 1930 onwards (Hoffman and others, 1997). Based on analysis of Orcadas (or South Orkney Islands) temperature series, Skvarca and Reference De Angelis and SkvarcaDe Angelis (2003) reported the last two decades as the warmest of the 20th century. Climatic warming increases towards the south, as shown by the MAT and mean summer surface air temperature (MST) trends at the stations listed in Table 1. Similar trends in both MAT and MST may be observed over the last 30 years in the region. Furthermore, the summer of 2001/02 was the warmest on record since the initiation of meteorological measurements at different stations (Table 1).
(1)1903–2002. (2)1952–2002. (3)1970–2002.
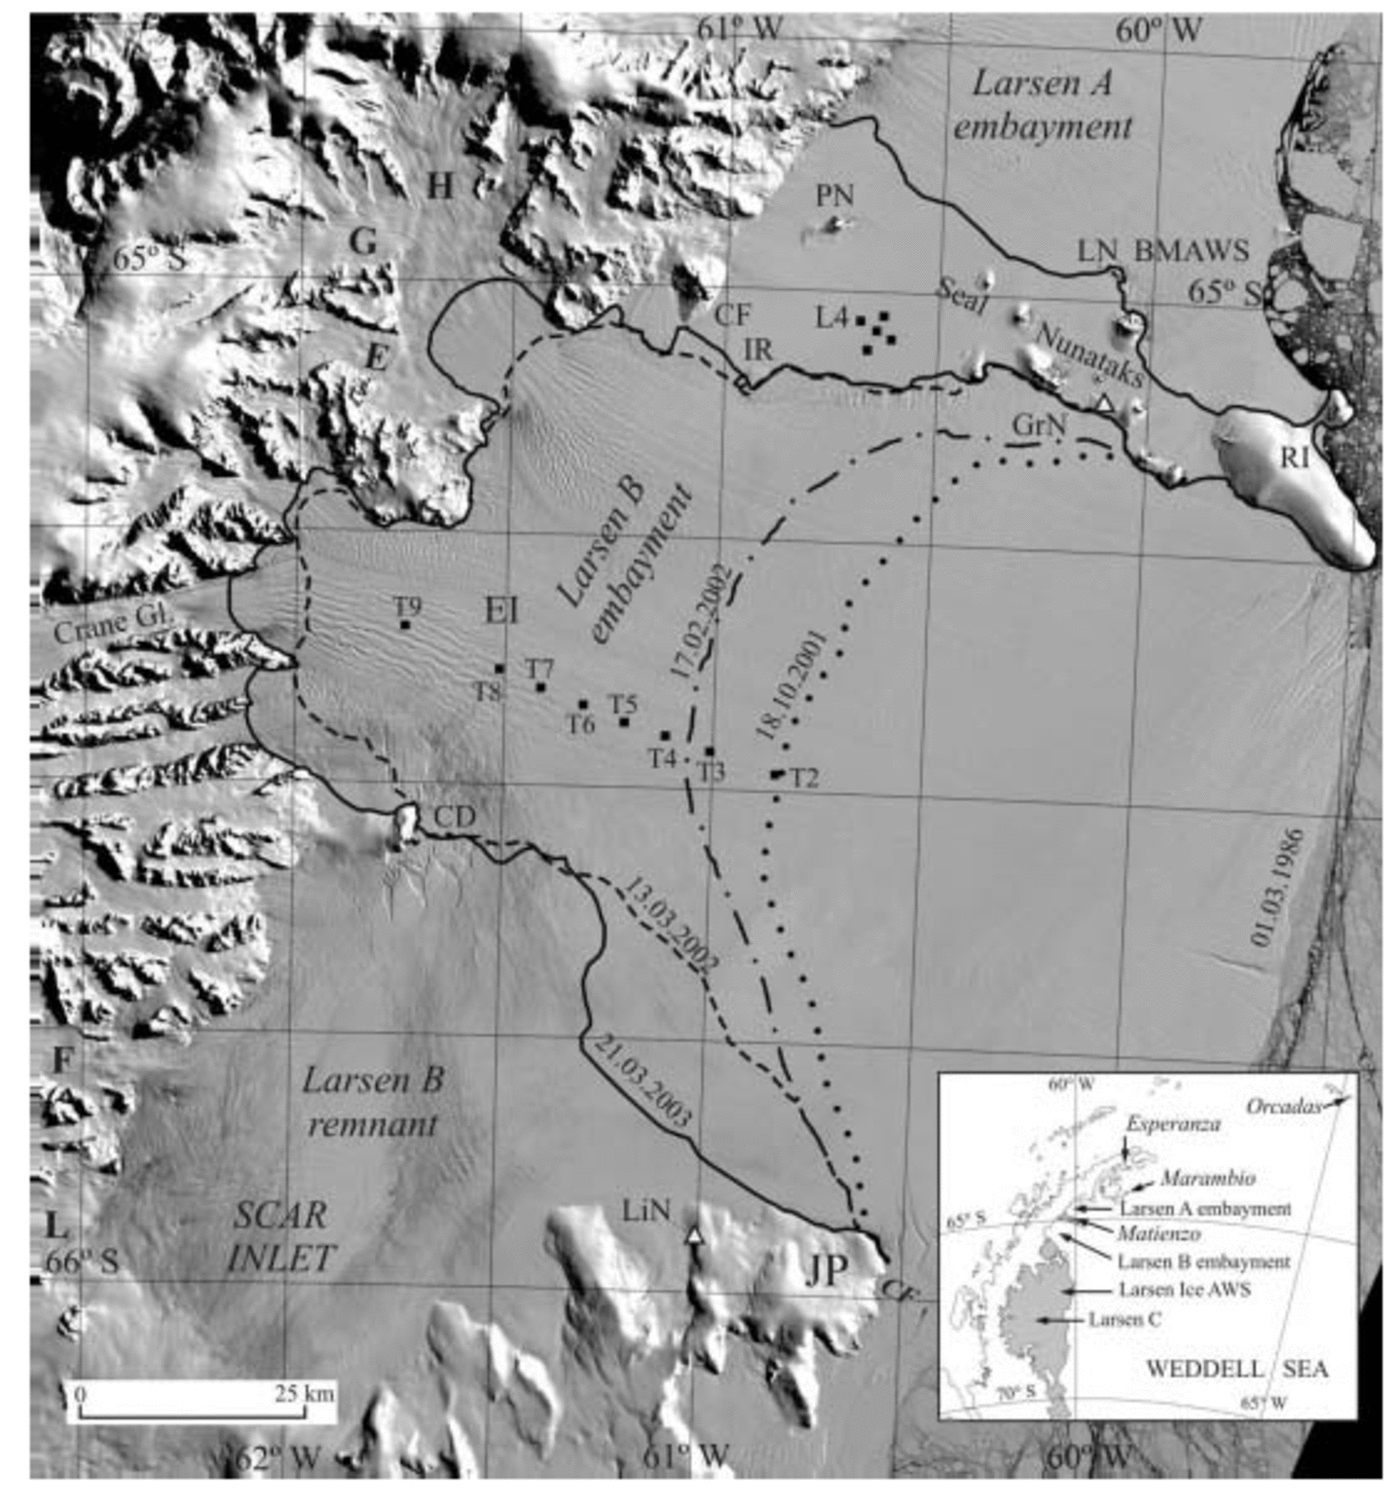
The closest weather station to Larsen B is Matienzo, located on Larsen Nunatak (LN in Fig. 1). Unfortunately the temperature series for this station since the early 1960s is discontinued, with a large gap. Since meteorological data are relevant to the investigation of ice–climate interaction, we installed an automatic weather station (AWS) at Base Matienzo (BM-AWS in Fig. 1) in early 1999. The analysis of available temperature data indicates a high correlation between MST at Marambio and that at Matienzo (Reference SkvarcaSkvarca and others, 1998), allowing us to infer that Larsen B has been subject to an increasing summer warming trend during the past three decades.
Section of Landsat TM image of 1 March 1986, showing the extent of Larsen B on: 1 March 1986 (image), 18 October, 2001 (GPS survey; dotted line), 17 February 2002 (GPS survey; dash-dotted line), 13 March 2002 (dashed line) and 21 March 2003 (MODIS image; full line). T2–T9 indicate positions of stakes along T-profile. PN, Pedersen Nunatak; LN, Larsen Nunatak; BM-AWS, Base Matienzo automatic weather station; GrN, Gray Nunatak; CF, Cape Fairweather; IR, ice rise; H, Hektoria Glacier; G, Green Glacier; E, Evans Glacier; EI, Exasperation Inlet; CD, Cape Disappointment; F, Flask Glacier; L, Leppard Glacier; JP, Jason Peninsula; LiN, Lisignoli Nunatak. Inset map shows the Larsen Ice Shelf with collapsed sections and weather stations considered in the text.
To investigate the impact of meteorological conditions on the mass balance of Larsen B prior to its disintegration, we analyzed mean daily surface air temperature (MDT) from BM-AWS and from Larsen Ice (LI-AWS), located 220 km further south on Larsen C ice shelf (66˚56' S, 60˚54' W). The MDT values recorded at both stations from October 2001 to early March 2002, i.e. immediately before and during disintegration, are shown in Figure 2. The MDT comparison derived over the 7 month period indicates a high correlation between BM-AWS and LI-AWS (R = 0.89). According to the BM-AWS record, the MDT in the region was close to zero or positive throughout the summer (December–February), with many warm periods near +5˚C. The mean temperature throughout summer 2001/02 was +1.3˚C, with mean monthly air temperature (MMT) of +1.5˚C in December, +0.7˚C in January and as high as +1.7˚C in February, when most of Larsen B disintegrated.
Mean daily temperatures before and during collapse, recorded at BM-AWS and LI-AWS from 1 August 2001 to 10 March 2002.
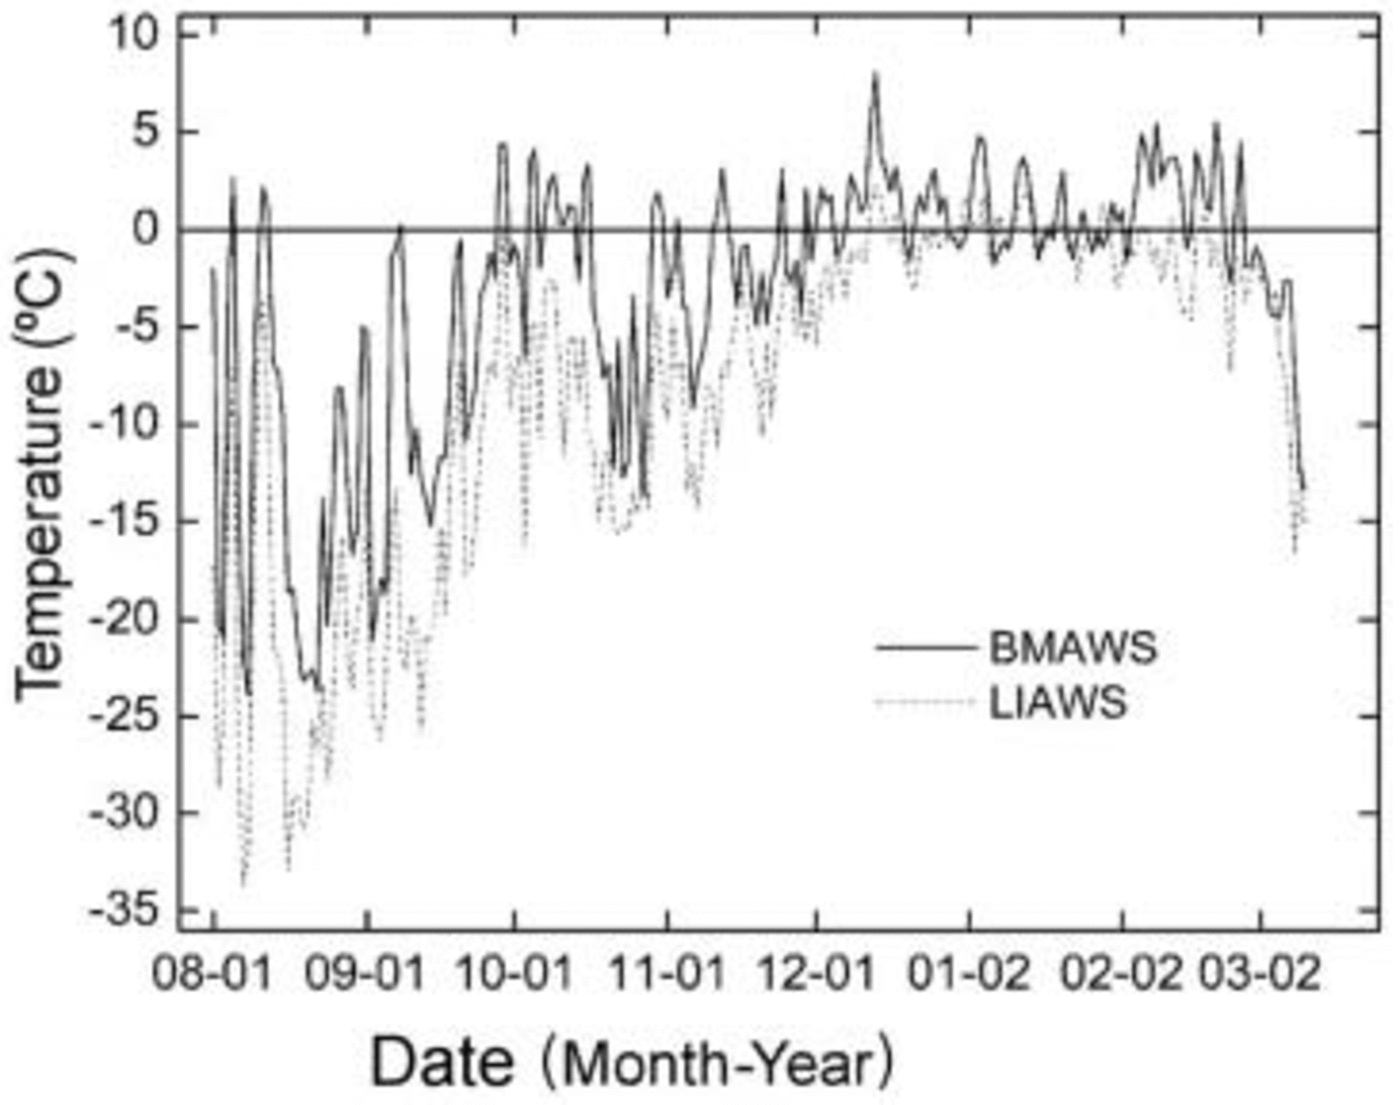
The January 0˚C isotherm has been proposed as a ‘thermal limit’ for the viability of ice shelves Reference Mercer(Mercer, 1978). According to the BM-AWS record, the thermal limit (0˚C) was reached for the first time in January 2002. The final collapse of Larsen B occurred almost immediately afterwards, during February 2002, the warmest month of summer 2001/02. At LI-AWS, the MMT was –1.0˚C in December 2001, –0.2˚C in January 2002 and –1.8˚C in February 2002, yielding a MST of –1.0˚C, a few degrees lower than that at BM-AWS. We attribute this difference to the latitudinal temperature gradient.
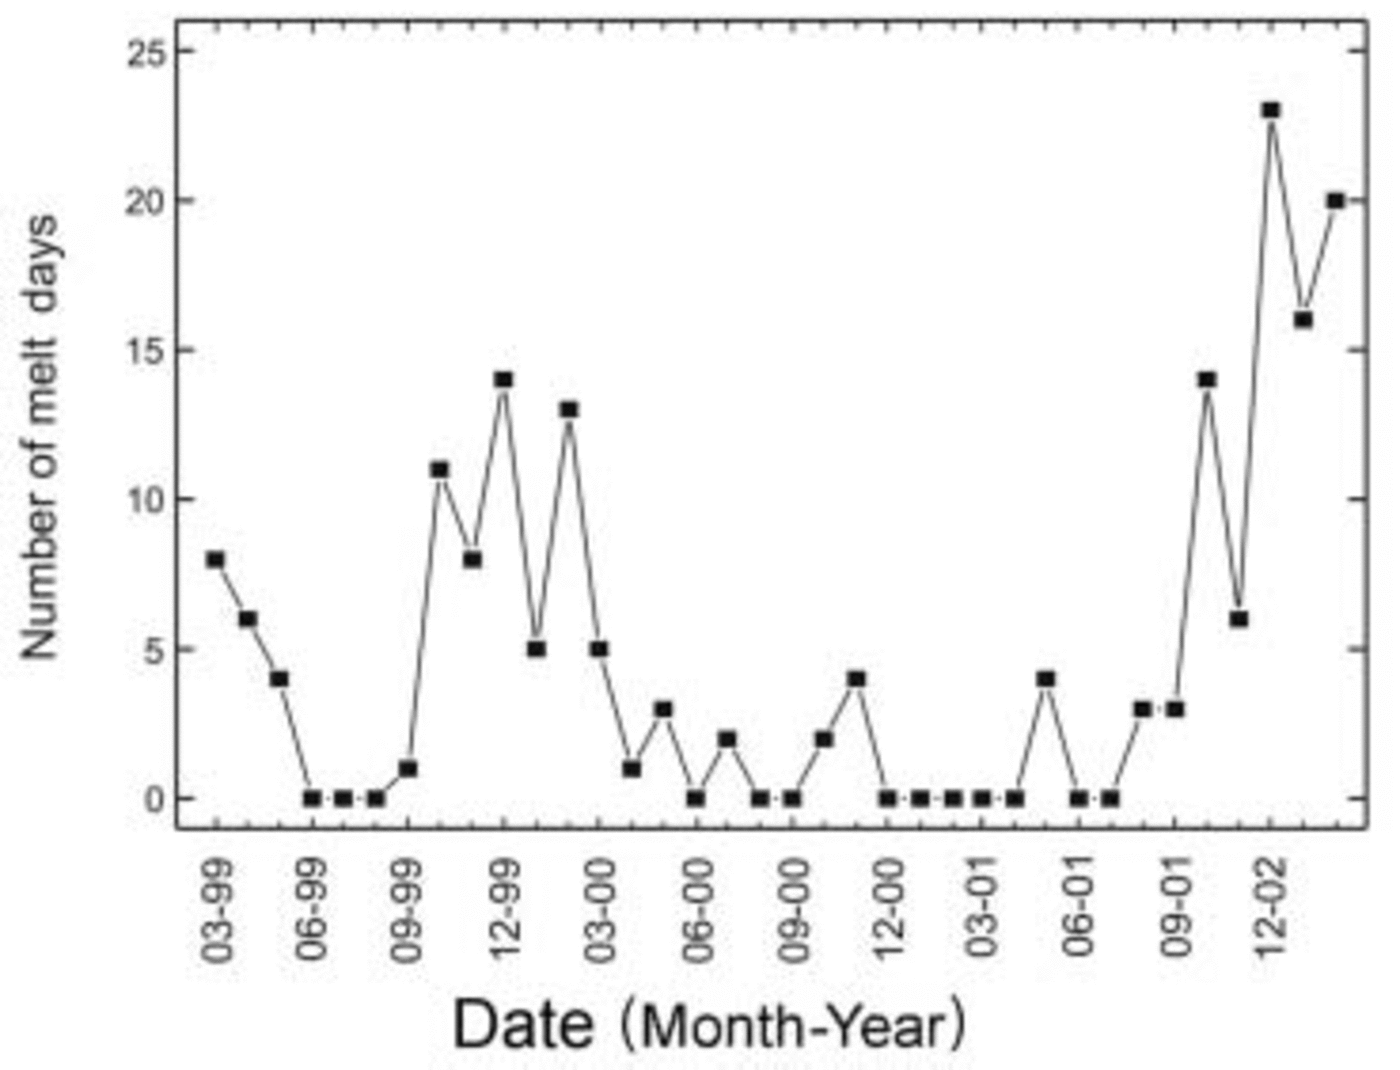
The BM-AWS data also allowed us to compute the number of melt days (days with MDT >0) from February 1999 to February 2002, a period including the coldest and warmest summers (Fig. 3). This parameter is of importance for mass-balance studies and the formation–abundance of meltwater over the ice-shelf surface. Figure 3 shows peaks in the number of melt days from October 1999 to February 2000, with a maximum of 14 melt days in December 1999 and a minimum of 5 in January 2000. The total of melt days over summer 1999/2000 was 32. During the year 2000 there were only 35 melt days. The following summer, 2000/01, had no melt days because MST was very low (–3.2˚C). The maximum number of melt days over the 4 year period occurred during the warmest summer, 2001/02. Melting started in August 2001, with peaks of 23, 16 and 20 melt days in December, January and February 2002, respectively, a total of 59 melt days over the whole summer. For the same period, melt days at LI-AWS, calculated from mean daily temperatures, occurred only during the summer months, 7 in December, 12 in January and 4 in February.
Number of monthly melt days, March 1999–February 2002, derived from BM-AWS.
Surface Mass Balance
Method
Surface mass balance on the northeastern AP is dependent on surface melting, which is mainly determined by MST. Therefore, we defined a balance year by considering the period extending from 1 March of a given year to 28 February of the following year, in order to start the balance year as close as possible to the end of the austral summer. However, particularly due to the presence of surface meltwater ponds, field measurements could not be made at the end of February. A comparison of melt days calculated for the periods March–February and October–September 1999–2003 shows a very high correlation (R = 0.99), allowing us to assume that large methodological errors were not introduced in our approximation. For field mass-balance methodology, we used a simplified stratigraphic–annual mass-balance procedure described by Reference Mayo, Meier and TangbornMayo and others (1972). This method was well suited to our study since only sporadic visits to the area were possible.
Mass balance along T-profile
The latest information on the surface mass balance of Larsen B comes from a number of stakes set in October 1996 along the central flowline corresponding to the discharge of Crane Glacier. The set of stakes (T2–T9) is plotted in Figure 1 and referred to as the T-profile. The net balance of the T-profile was computed for the periods 1996/97, 1997–99 and 1999– 2001. The annual net balance b n for each balance period resulted from averaging the values obtained at each stake along the T-profile (stakes T4–T8). The results are shown in Figure 4.
Net surface mass balance along T-profile on Larsen B from 1996/97 to 2000/01 (for location see Fig. 1).
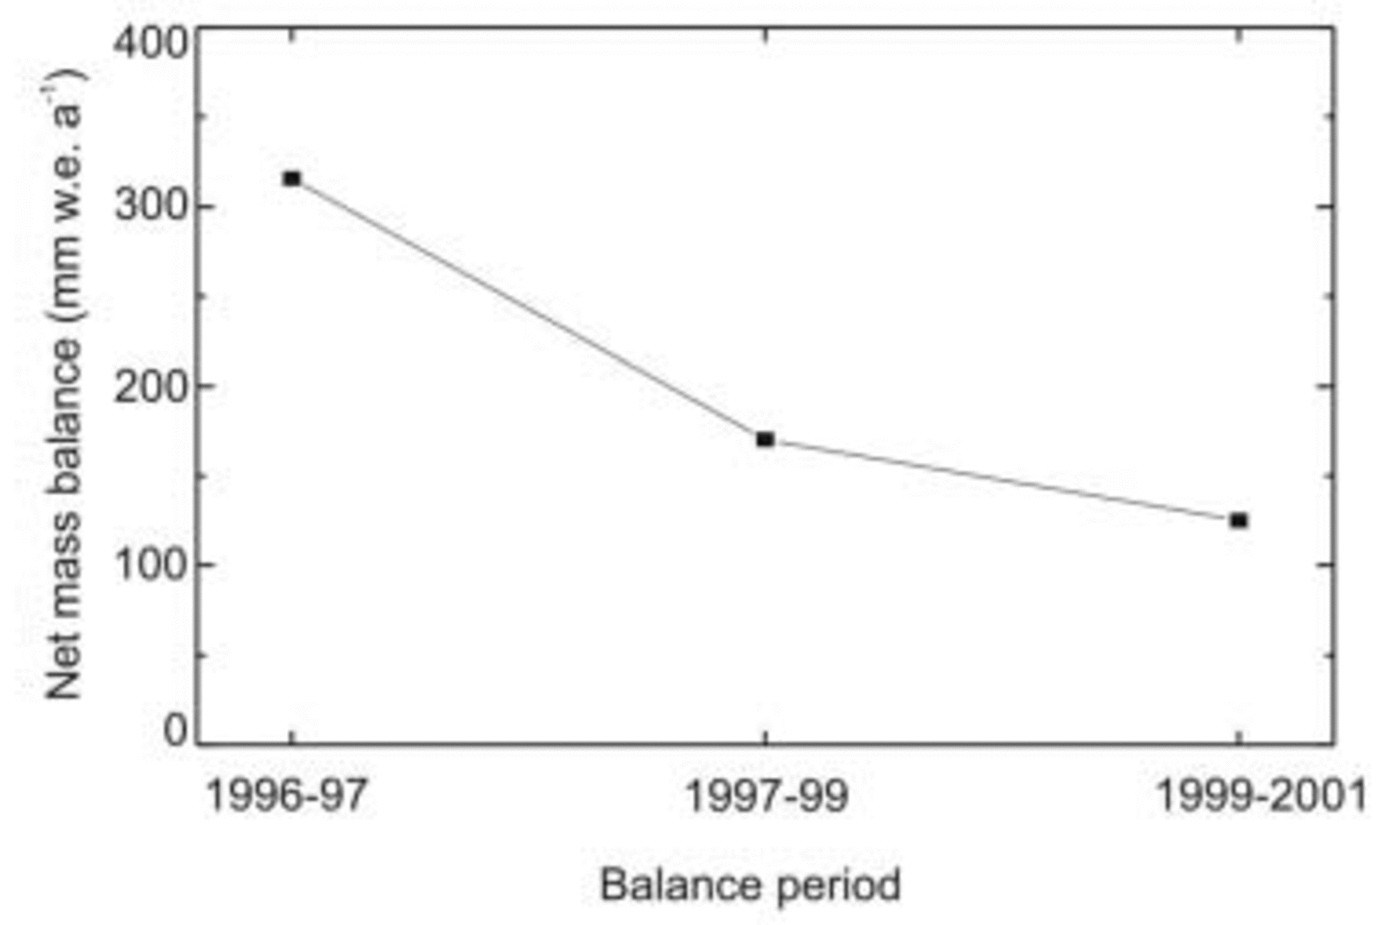
An annual net balance of 316 mm w.e. was obtained for 1996/97, 170 mm w.e. for 1997–99 and 125 mm w.e. for 1999–2001. Though b n decreases steadily on the central part of Larsen B from 1996/97 to 2000/01, its average over the 5 year period was positive, 181 mm w.e. a–1. Because measurements were not possible in 1998 and 2000, the resulting b n may not reflect the actual mass-balance conditions throughout the study period, particularly during the period 1999–2001. This is inferred from the large negative mass balance measured in balance year 1999/2000 at the nearby Seal Nunataks section (Fig. 5). It should also be noted that the period 1999–2001 includes two contrasting summers: a relatively warm summer (1999/2000, MST = –0.5˚C) with 32 melt days, and an extremely cold summer (2000/01, MST= –3.2˚C) with no melt days, and only 17 melt days during the full balance year 2000/01 (Fig. 3).
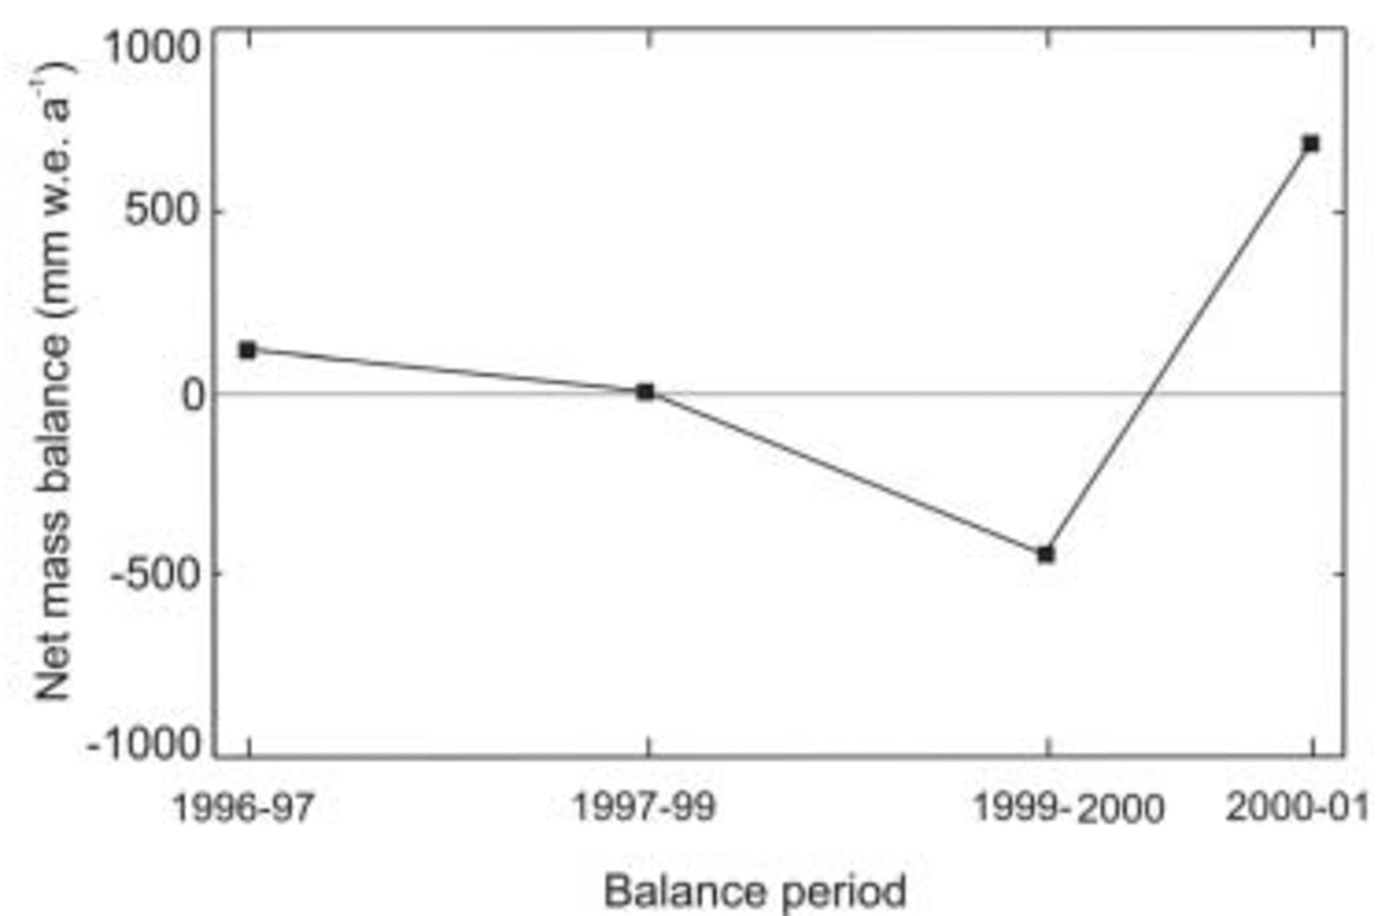
Net surface mass balance derived from the set of stakes near Pedersen Nunatak from 1996/97 to 2000/01 (for location see Fig. 1).
Mass balance at Seal Nunataks
The Seal Nunataks section is a narrow remnant of the former northern Larsen Ice Shelf, confined between the Larsen A and Larsen B embayments (Fig. 1). Flow here is almost stagnant (around 25 ma–1) because the ice is constrained by the nunataks. A diamond figure composed of five stakes spaced about 2 km apart was installed in the vicinity of Pedersen Nunatak in early 1978 (Fig. 1). Mass-balance conditions at Seal Nunataks from 1978 to 1996 have been described and analyzed by Reference Rott, Skvarca and NaglerRott and others (1996, Reference Rott, Rack, Skvarca and de Angelis1998) and Reference RackRack (2000). The results of b n for balance periods 1996/97, 1997–99, 1999/2000 and 2000/01 are plotted in Figure 5. They show a decrease in b n from 1996/97 to 1999/2000, with near-zero mass balance during the period 1997–99, reverting to a significant increase in 2000/01. The mean net mass balance over the period 1996–2001 is slightly positive, 83 mm w.e. a–1. The negative mass balance in 1999/2000 corresponds to a relatively warm summer (MST = –0.5˚C), with 70 melt days during the balance year. During the cold summer of 2000/01 (MST = –3.2˚C), there was no melt. However, two warm periods with four melt days each occurred in November 2000 and May 2001, respectively (Fig. 3). The temporal variability of b n at the stake network reflects the strong temperature variations, which show striking differences in MST (–0.5˚C in 1999/2000, –3.2˚C in 2000/01 and +1.3˚C in 2001/02), as recorded at BM-AWS. On 10 March 2002 it was only possible to measure the height of stake L4 (Fig. 1). A large difference of –1610 mm was measured in comparison to October 2001, suggesting that strongly negative b n probably affected the Seal Nunataks section during this period, in response to the warmest summer recorded in the region in the last three decades (see MMST in Table 1).
Dynamic Conditions
Surface ice velocity
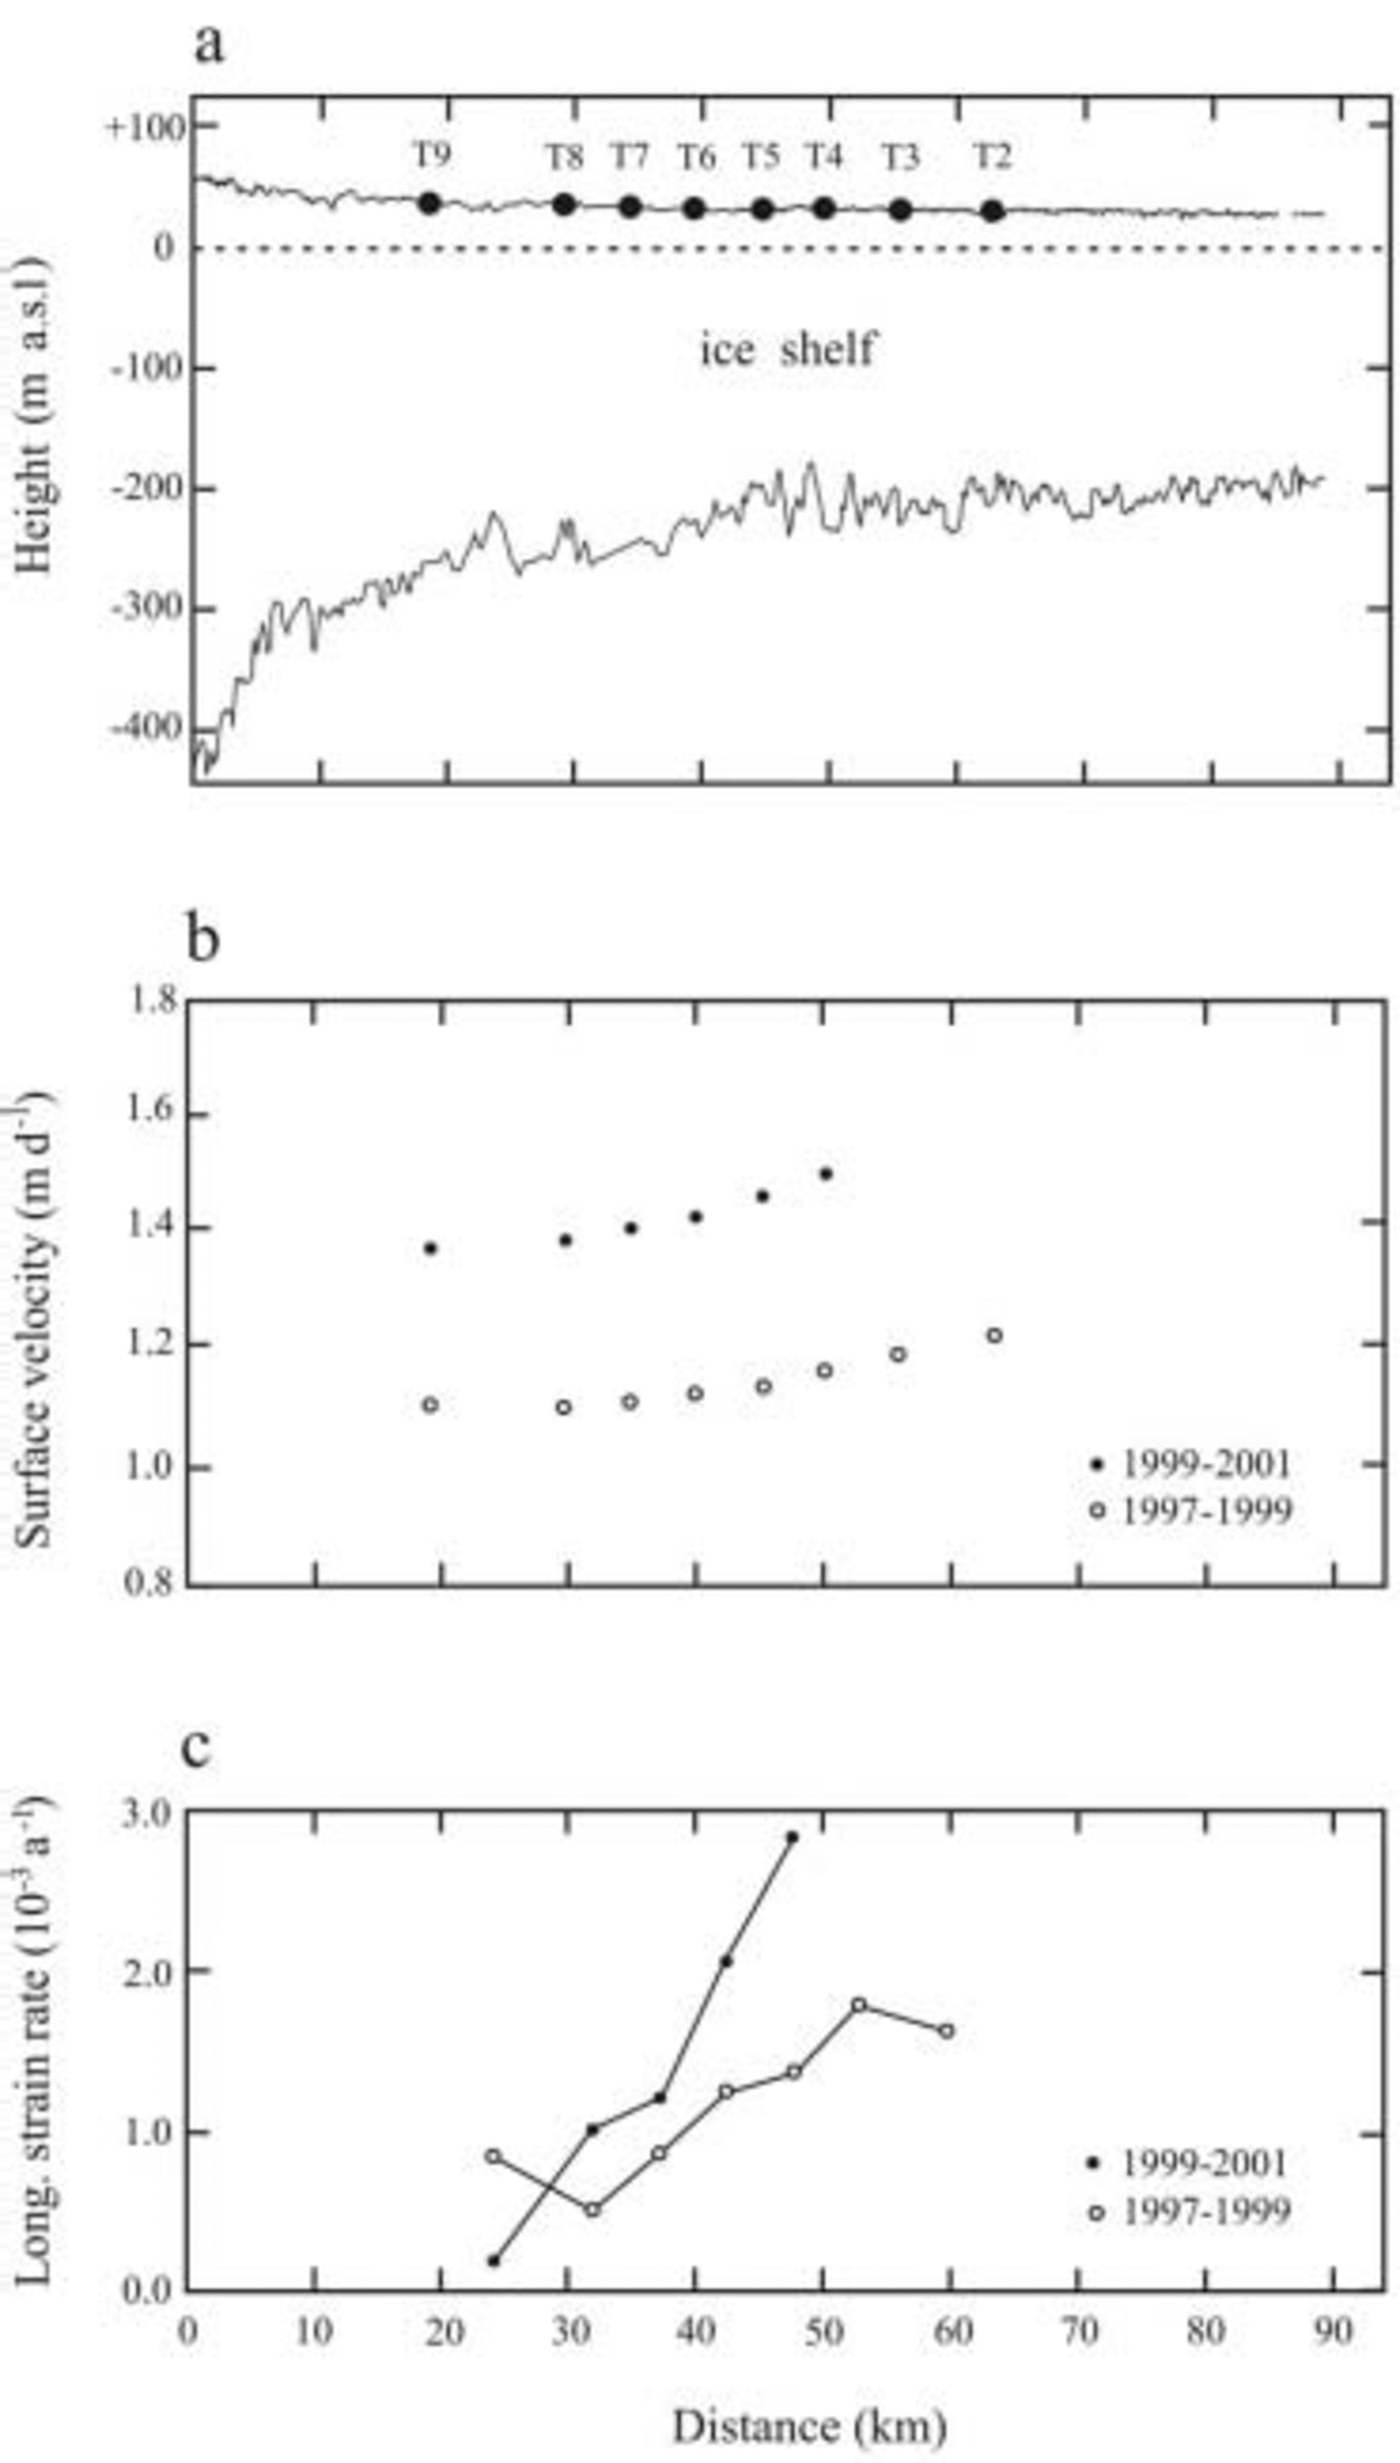
In September–October 2001 the last field campaign was carried out over Larsen B. Only six stakes set along the T-profile extending from Exasperation Inlet to the ice front along the central flowline of Crane Glacier (Fig. 1) could be reached and measured; stakes T3 and T4 were not accessible due to rifting. Figure 6a shows the ice-shelf thickness along the T-profile, resulting from the joint British Antarctic Survey (BAS)–Instituto Antártico Argentino (IAA) airborne radio-echo sounding (RES) project carried out in early 1998 over Larsen B and Larsen C. Velocities measured in the field during the periods 1997–99, 1999–2001 and in October 2001 are shown in Table 2 and plotted in Figure 6b. The analysis reveals that ice-flow velocity averaged between stakes T4 and T9 increased from 1.12 md–1 in 1997–99 to 1.42 md–1 in 1999–2001, an average increase of 26% between the two periods. The velocity measured along the same profile from 1996–97 to 1997–99 increased by only about 10% (Reference RackRack, 2000; Skvarca and Reference De Angelis and SkvarcaDe Angelis, 2003). A similar increase in ice velocity was observed over Larsen A prior to disintegration (Reference Bindschadler, Fahnestock, Skvarca and ScambosBindschadler and others, 1994; Reference Rack, Rott, Siegel and SkvarcaRack and others, 1999).
(a) Ice-shelf thickness along a central flowline of Crane Glacier derived from BAS–IAA airborne RES. (b) Velocity along T-profile, 1997–99 and 1999–2001. (c) Strain rates along T-profile, 1997–99 and 1999–2001.
Surface ice-flow velocity (m d–1) of Larsen B along T-profile during the periods 1997–99 and 1999–2001

Reference Rott, Rack, Nagler and SkvarcaRott and others (1998) and Reference Skvarca, Rack, Rott, Ibarzábal and DonángeloSkvarca and others (1999a) reported a 10–20% increase in ice velocity between the periods 1984–94 and 1994–96/97 in the central part of Larsen B along a transect extending between Gray and Lisignoli Nunataks. This large increase was detected by measurements made a few years after the January 1995 calving of the large tabular iceberg A-32. The increase was, in part, attributed to the formation and opening of rifts after the ice front retreated inland beyond the ‘compressive arch’, described by Reference Doake, Corr, Rott, Skvarca and YoungDoake and others (1998). The acceleration measured along the T-profile was even more significant prior to the collapse.
Strain rates and thinning
Corresponding to the observed acceleration, a significant increase in longitudinal strain rate was detected along the T-profile between 1997 and 2001 (Fig. 6c). It is interesting to note a strong gradient in longitudinal strain rates in the period prior to disintegration. The average strain rate between T4 and T9 increased by about 50% during the study period, from 1.0×10⁻³ a–1 in 1997–99 to 1.47×10⁻³ a–1 in 1999–2001. The maximum strain rate of 2.8×10⁻³ a–1 was observed during the period 1999–2001 between stakes T4 and T5. This may have resulted from the opening of new rifts parallel to the ice front, evident on synthetic aperture radar (SAR) images of 1 November 1996 (Reference Rott, Rack, Nagler and SkvarcaRott and others, 1998).
The average value of longitudinal strain rate between stakes T4 and T8/T9 calculated for the period 1996–2001 is 1.12×10⁻³ a–1. Following Reference MercerRack (2000), we obtain for this strain rate, and a mean ice-shelf thickness of 250m along section T4–T9 derived from BAS–IAA RES flight track F8_9798, a mean thinning rate of 0.30ma–1 between 1996 and 2001. In the period prior to collapse, the thinning rate is much larger, corresponding to the increased strain rate. During the period of strain-rate analysis (1996–2001), the net surface mass balance b n along the T-profile, although decreasing steadily, was clearly positive, though insufficient to compensate the ice-shelf thinning. We may conclude that Larsen B was in strong imbalance before the collapse, most probably because of enhanced melting beneath the ice shelf due to ocean warming (Reference Rignot and ThomasRignot and Jacobs, 2002), which was partly responsible for its sudden disintegration.
Recent changes
At the end of January 1995, Larsen B occupied an area of 11 816 km2 (Reference Skvarca, Rack, Rott, Ibarzábal and DonángeloSkvarca and others, 1999a), extending from Seal Nunataks at about 65˚ S to Jason Peninsula at 66˚ S (Fig. 1). The temporal variations in areal extent of Larsen B from 1963 to March 2002 based on satellite imagery and global positioning system (GPS) survey are described in detail by Reference Skvarca, De Angelis, Domack, Burnett, Leventer, Conley, Kirby and BindschadlerSkvarca and De Angelis (2003). In Figure 1 the major changes from October 2001 to March 2003 are indicated. From a GPS survey of the ice front carried out on 13 March 2002, during the last stage of the 2002 disintegration event, to 21 March 2003 (Moderate Resolution Imaging Spectroradiometer (MODIS) image), the ice-shelf retreat continued mainly by calving of a large iceberg at SCAR Inlet, between Cape Disappointment and Cape Framnes. This calving event occurred shortly before 23 January 2003, according to available MODIS images. Around 10–20 February 2003 another, much smaller, iceberg was observed to be calving immediately northeast of Cape Disappointment. Significant retreats continued also at Hektoria–Green–Evans and Crane Glacier embayments, forming deep indentations within grounding zones of some glaciers. The overall areal decay of Larsen B between 13 March 2002 and 21 March 2003 amounts to 852 km2. As a result, about 3056 km2 (26%) of Larsen B survives, mainly within the SCAR Inlet (Fig. 1).
Conclusions
The meteorological data collected at two AWSs provide detailed information on air temperature in the region before and during the collapse of Larsen B. The January 0˚C isotherm proposed by Reference MercerMercer (1978) as the limit of viability of ice shelves was reached for the first time on Larsen B in January 2002. Almost immediately afterwards, during February, the warmest month, the ice shelf collapsed. The surface velocity measured along the T-profile over different time periods increased between 1996 and 2001. The 10% increase in velocity measured from 1996/97 to 1997–99 was followed by a significant acceleration of 26% between 1997–99 and 1999–2001, indicating that Larsen B was thinning on average by 0.30 m a–1 and therefore out of balance, predicting a major disintegration. This may suggest that surface velocities can be used to predict the disintegration of other ice shelves around Antarctica. In March 2003, after an additional loss of 852 km2 during 2002/03, the remnant area of Larsen B was 3056 km2.
The observations of conditions on Larsen B immediately prior to its collapse may contribute to a better understanding of the processes involved. This understanding is especially important in view of the observed acceleration and retreat of former Larsen A tributary glaciers beyond their grounding lines and recently detected surges. The dynamic behavior of glaciers which fed former Larsen B should be monitored in detail to confirm the stabilizing role of ice shelves on their tributaries.
Acknowledgements
The authors are grateful to W. Rack, T. Toconás, J. Perez, F. Perez and D. Lepe for cooperation in field campaigns and to all Twin Otter crews of Fuerza Aérea Argentina for excellently performed GPS flights. Thanks are also due to H. Corr of BAS for joint collection and processing of RES data, to M. Lazzara, University of Wisconsin, U.S.A., for providing Larsen Ice AWS temperatures and to D. McAyeal for help in improving the manuscript. Data from 1996, 1997 and 1999 field campaigns are a result of a joint cooperation between IAA and the Institute for Meteorology and Geophysics of Innsbruck University (IMGI), Austria. This work is a contribution to the projects ‘Interacciόn Hielo-Clima y Dinámica de Glaciares en Península Antártica y Patagonia Austral’, funded by Direcciόn Nacional del Antártico–IAA and ‘A Glacier Baseline Inventory for the Antarctic Peninsula by Means of Remote Sensing Data and GIS Techniques’ (GLINAP), funded by the Program of Partnership of Volkswagen Foundation.



